

Abstract
Background:
Diphenhydramine (DPH) is an antihistamine medication that in overdose can result in anticholinergic symptoms and serious complications, including arrhythmia and coma. We aimed to compare the value of various machine learning (ML) models, including light gradient boosting machine (LGBM), logistic regression (LR), and random forest (RF), in the outcome prediction of DPH poisoning.
Materials and Methods:
We used the National Poison Data System database and included all of the human exposures of DPH from January 01, 2017 to December 31, 2017, and excluded those cases with missing information, duplicated cases, and those who reported co-ingestion. Data were split into training and test datasets, and three ML models were compared. We developed confusion matrices for each, and standard performance metrics were calculated.
Results:
Our study population included 53,761 patients with DPH exposure. The most common reasons for exposure, outcome, chronicity of exposure, and formulation were captured. Our results showed that the average precision-recall area under the curve (AUC) of 0.84. LGBM and RF had the highest performance (average AUC of 0.91), followed by LR (average AUC of 0.90). The specificity of the models was 87.0% in the testing groups. The precision of models was 75.0%. Recall (sensitivity) of models ranged between 73% and 75% with an F1 score of 75.0%. The overall accuracy of LGBM, LR, and RF models in the test dataset was 74.8%, 74.0%, and 75.1%, respectively. In total, just 1.1% of patients (mostly those with major outcomes) received physostigmine.
Conclusion:
Our study demonstrates the application of ML in the prediction of DPH poisoning.
Keywords: Diphenhydramine, overdose, poisoning, prognosis
INTRODUCTION
Diphenhydramine (DPH) is a first-generation antihistamine, ie.e., available over the counter (OTC) and is used to treat allergy symptoms and as a sleeping aid.[1] Even though the therapeutic window of DPH is wide, it is one of the most prevalent causes of antihistamine overdose, often presenting with anticholinergic symptoms.[2] DPH exposure has been rising in the United States in recent years. The current estimates show approximately 158,000 DPH exposures between 2005 and 2016, with increased rates of attempting suicide among children, growing abuse among adults, and a tendency toward higher overdose severity.[3] The American Association of Poison Control Centers (AAPCC) reported a total number of 41,132 cases of DPH exposure in 2020, compared to 65,690 cases of other antihistamines exposure.[4] DPH poisoning can also result in cardiovascular and neurological complications.[5] Physostigmine is a general antidote for DPH toxicity to alleviate its symptoms, but sometimes it is unavailable or not used.
Medical toxicologists at poison centers review patient records, medical history, and identify the substance or product code involved during exposure calls. Once the information in this file becomes accessible, it is sent to the National Poison Data System (NPDS). Cases are recorded contemporaneously by poison center personnel in one of five electronic medical record systems. Clinical outcomes, specific organ effects, the relationship between these effects and the agent, the duration of these effects, chronicity, demographic data, exposure time, administration sites, toxicological data, and clinical findings are documented. Depending on the case's specifics, most cases are “closed” within a few hours of initial exposure. This method was the same for DPH exposures and our analysis.
The application of machine learning (ML) and classification models for prognosis prediction has been a focus of attention in recent years.[6] Logistic regression (LR) and classification models (random forest [RF] and light gradient boosting machine [LGBM]) are well-known predictive models. The growing implementation of the LR model in medicine is due to its simplicity of interpretation and low error rate.[7] It is also effective in predicting a binary dependent variable based on the values of a collection of predictor variables.[8] RF is an ML model developed based on a decision tree that randomly selects training sets from the original dataset, leaving the remaining dataset as the test set.[9] Finally, gradient boosting is an ML strategy that enhances the precision of classification methods, such as decision trees, by correcting the model's errors at each level.[10]
Medical toxicology has taken advantage of these promising methods in both diagnosis/treatment and outcomes using gradient-boosting models.[11] For example, LR was applied to predict seizures among patients with acute tramadol poisoning.[12] In the emergency department, ML was used to detect individuals prone to adverse drug reactions.[13] Another study demonstrated the accuracy and reliability of the gradient-boosting model in predicting the 1-year survival of patients with cancer and the 30-day mortality of patients with sepsis.[14,15] Recently, a study on patients with COVID-19 showed that the gradient-boosting model predicted death with a sensitivity of 1 and intensive care unit admission with a specificity of 0.93.[16] A study on patients with myocardial infarction also revealed that the gradient-boosting model predicted the risk of 1-year mortality with high accuracy of 0.89 and precision of 0.84.[17] As gradient-boosting models enhance decision tree performance, they have demonstrated promising effects on prediction models in medicine. However, despite the growing use of ML in medicine, there has been limited application of ML in predicting outcomes of DPH poisoning. In this study, we sought to investigate the effectiveness of LR, RF, and LGBM in the outcome prediction of DPH poisoning using large-scale data derived from the National Poison Data System (NPDS).
MATERIALS AND METHODS
Study design and setting
This study is a retrospective cohort study, for which data were derived from the NPDS database. NPDS is the most comprehensive database of poisoning in the United States, operated by the AAPCC that includes human substance exposures reported to all of the accredited poison control centers (PCCs) all around the country. The data were gathered by anonymous phone calls to PCCs and included follow-up and symptoms associated with exposures obtained by healthcare professionals trained in poisoning treatment and prevention. The structure of the proposed method is shown in Figure 1.
Figure 1.
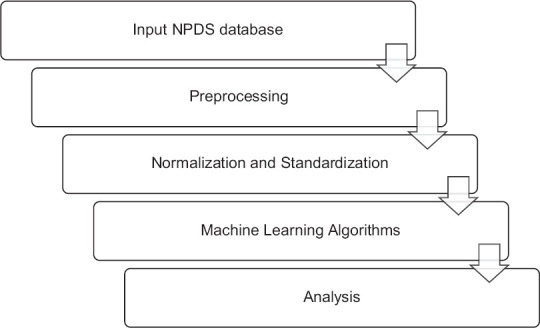
Structure of the proposed method. NPDS = National Poison Data System
Selection of participants
The data for this study were gathered and reviewed by expert medical toxicologists. We included all of the human exposures to DPH from January 01, 2017, to December 31, 2017. Those cases with missing information, duplicated cases, and reported co-ingestion were excluded. According to the NPDS coding users’ manual, exposure is defined as any exposure to a substance that has been ingested, inhaled, absorbed, applied to, or injected into the body, regardless of its toxicity or clinical manifestations.[4] Exposure to DPH included intentional and unintentional overdose of DPH and was confirmed based on clinical symptoms and history.
Terms definition
The predictors of the prognosis include all of the clinical and laboratory findings related to DPH poisoning, which were reviewed and defined by expert medical toxicologists. Medical outcomes are classified as minor, moderate, and major effects. This assessment requires follow-up unless the initial call to the regional poison center occurs sufficiently long after the exposure that there is reasonable certainty that the clinical effect(s) will not worsen. Patients with symptoms must be monitored until they have resolved or are almost resolved unless the residual symptoms are expected to be long-lasting and of limited clinical relevance.
Minor effect
The patient displayed a few symptoms due to the exposure, which are self-limiting. The patient's health has been restored to its pre-exposure level, and there are no lasting disabilities or disfigurements.
Moderate effect
The patient displayed longer-lasting, more systemic, or severe symptoms. Typically, treatment is indicated or would have been indicated. However, the patient's symptoms were not life-threatening, and he or she has fully recovered with no permanent disability or disfigurement.
Major effect
The patient manifested symptoms that are life-threatening, resulting in a major lasting disability or disfigurement. Major outcomes might result in death or severe complications regardless of treatment.
Chronicity
Exposures were defined per NPDS guidelines and acute, acute on chronic and chronic.[18] Acute exposures are those lasting less than 8 hours, acute on chronic up to 8 hours and chronic exposures greater than 8 hours. Exposures could be continuous, repetitive or intermittent.
Data preprocessing
When developing an ML model, data preprocessing is the initial step that initiates the process. Real-world data are typically insufficient, inconsistent, imprecise (including mistakes or outliers), and lacking in specific attribute values/trends. Data preparation is important in helping clean, prepare, and organize/format raw data, preparing it for the ML models. Some models require data in a particular format, for instance, the RF technique does not accept null values; hence, null values must be removed from the original raw data set to execute the algorithm. The data also need to be arranged in such a way that it can run and compare many algorithms in parallel. In this study, preprocessing involved removing NULL or NAN values and normalizing the data so that the mean is 0 and the standard deviation is 1.
Data development and evaluation
First, we categorized our data into two datasets, including training and test sets, which contained 70% and 30% of the random sample. Then, we applied three classifier prediction models, including LR, RF, and LGBM using the sklearn and TensorFlow library in Python.[19]
Statistical analysis and metrics
The study was implemented using a Jupyter notebook, and the Python programming language was employed for coding. In addition, standard evaluation metrics, including accuracy, precision, specificity, and sensitivity were used to evaluate the models’ performance.
As shown in Table 1, FN and FP represent the number of false-negative and false-negative samples. TN and TP reflect the number of true negative and true positive samples. Sensitivity (recall) estimates the proportion of stated positives that are accurate.
Table 1.
Structure of confusion matrix
| Predicted class | Actual class | |
|---|---|---|
|
| ||
| Positive | Negative | |
| Positive | TP | FP |
| Negative | FN | TN |
TP=True positive, FP=False positive, TN=True negative, FN=False-negative
Due to a large number of datasets analyzed, the range of methodologies employed, and the peculiarities of the data set, which includes both balanced and unbalanced data, it is not easy to evaluate the accuracy of multiclass algorithms. Therefore, criteria, such as accuracy, sensitivity, and precision, are used to evaluate the performance of these algorithms. Understanding these indicators enables users to assess the accuracy of a classification model's analysis of textual data. Conventionally, in multiclass problems, accuracy, recall, specificity, area under the curve (AUC), and precision might be reported.
RESULTS
Baseline characteristics
The baseline characteristics of our study are shown in Table 2. Our study population included 53761 patients with DPH exposure. The mean age of the patients was 22.74 ± 0.07. The majority of the DPH exposure was OTC use. Intentional exposure was the most common reason for exposure (66.0). The majority of the patients had minor outcomes. Most of the DPH exposures were acute ingestion (93.7%). Physostigmine was administrated in 1.1% of patients (n = 610) [Table 3].
Table 2.
Baseline characteristics of the participants
| n (%) | |
|---|---|
| Age, mean±SD | 22.74±0.07 (1–89 years) |
| DPH alone (OTC) | 31,239 (58.1) |
| DPH alone (prescription) | 1988 (3.7) |
| DPH alone (unknown if OTC or prescription) | 20,534 (38.2) |
| Reason of exposure | |
| Adverse reaction | 1142 (2.1) |
| Intentional | 35,473 (66) |
| Unintentional | 16,445 (30.6) |
| Other (contamination/tampering, malicious, withdrawal) | 55 (0.1) |
| Unknown | 646 (1.2) |
| Total | 53,761 (100) |
| Outcome | |
| Major | 2288 (4.2) |
| Moderate | 20,108 (37.4) |
| Minor | 28,382 (52.8) |
| Unable to follow | 2983 (5.5) |
| Total | 53,761 (100) |
| Chronicity | |
| Acute | 50,367 (93.7) |
| Acute on chronic | 1628 (3.0) |
| Chronic | 832 (1.5) |
| Unknown | 934 (1.7) |
| Total | 53,761 (100) |
| Formulation | |
| Aerosol/mist/spray/gas | 142 (0.3) |
| Cream/lotion/gel | 466 (0.9) |
| Liquid | 10,610 (19.7) |
| Patch | 8 (0.0) |
| Powder/granules | 125 (0.2) |
| Solid (tablets/capsules/caplets) | 41,190 (76.6) |
| Other | 103 (0.2) |
| Unknown | 1117 (2.1) |
| Total | 53,761 (100) |
DPH=Diphenhydramine, OTC=Over the counter, SD=Standard deviation
Table 3.
Status of physostigmine administration in patients
| Out come | Physostigmine administration, count (%) | Total, count (%) | |
|---|---|---|---|
|
| |||
| No | Yes | ||
| Major effects | 2172 (94.9) | 116 (5.1) | 2288 (100.0) |
| Minor effects | 31,320 (99.9) | 45 (0.1) | 31,365 (100.0) |
| Moderate effects | 19,659 (97.8) | 449 (2.2) | 20,108 (100.0) |
| Total | 53,151 (98.9) | 610 (1.1) | 53,761 (100.0) |
Test and training datasets analysis
The specificity of each model was 87.0% in the test groups. The precision of each model was 75.0%. The recall (sensitivity) of models was between 73% and 75%. The F1 score was 75.0%. The total accuracy of LGBM, LR, and RF models in the test dataset were 74.7%, 74.0%, and 75.0%, respectively. In our study, moderate effects had the highest value of specificity (91%–92%). However, the greatest value of recall and F-1 score belonged to minor effects. The characteristics of training and test sets of the models are shown in Table 4. Confusion matrices for our models are shown in Table 5.
Table 4.
Characteristics of training and test sets of the machine learning models
| Labels | Datasets | Models | Major effect | Minor effect | Moderate effect | Average |
|---|---|---|---|---|---|---|
| Specificity | Training | LGBM | 0.952470 (0.89–0.984) | 0.945017 (0.902–0.963) | 0.988782 (0.935–0.995) | 0.962090 (0.897–0.990) |
| RF | 0.942155 (0.886–0.981) | 0.883671 (0.815–0.938) | 0.971873 (0.916–0.994) | 0.932566 (0.874–0.978) | ||
| LR | 0.902513 (0.842–0.954) | 0.829750 (0.775–0.882) | 0.942907 (0.893–0.976) | 0.891723 (0.814–0.956) | ||
| Test | LGBM | 0.901235 (0.832–0.952) | 0.810320 (0.765–0.874) | 0.910022 (0.865–0.973) | 0.873859 (0.809–0.951) | |
| RF | 0.902256 (0.835–0.97) | 0.799248 (0.734–0.858) | 0.924031 (0.891–0.972) | 0.875178 (0.805–0.943) | ||
| LR | 0.885311 (0.816–0.937) | 0.800696 (0.764–0.853) | 0.924315 (0.892–0.971) | 0.870107 (0.799–0.926) | ||
| Precision | Training | LGBM | 0.909631 (0.852–0.956) | 0.891492 (0.846–0.935) | 0.976000 (0.943–0.995) | 0.925708 (0.874–0.963) |
| RF | 0.880060 (0.836–0.924) | 0.780654 (0.745–0.824) | 0.942249 (0.891–0.983) | 0.867654 (0.819–0.906) | ||
| LR | 0.811558 (0.774–0.863) | 0.686844 (0.641–0.739) | 0.869870 (0.827–0.905) | 0.789424 (0.754–0.82) | ||
| Test | LGBM | 0.808720 (0.771–0.853) | 0.635983 (0.597–0.681) | 0.805380 (0.758–0.851) | 0.750028 (0.723–0.789) | |
| RF | 0.811366 (0.778–0.856) | 0.638670 (0.589–0.675) | 0.822077 (0.775–0.874) | 0.757371 (0.702–0.792) | ||
| LR | 0.788790 (0.742–0.831) | 0.625817 (0.582–0.673) | 0.821904 (0.791–0.875) | 0.745503 (0.702–0.779) | ||
| Recall | Training | LGBM | 0.952677 (0.915–0.987) | 0.902059 (0.871–0.943) | 0.917868 (0.867–0.965) | 0.924201 (0.891–0.976) |
| RF | 0.868343 (0.834–0.908) | 0.848889 (0.803–0.888) | 0.875706 (0.816–0.915) | 0.864313 (0.821–0.907) | ||
| LR | 0.862100 (0.824–0.903) | 0.738075 (0.701–0.773) | 0.752381 (0.714–0.798) | 0.784185 (0.765–0.821) | ||
| Test | LGBM | 0.841874 (0.805–0.888) | 0.666667 (0.614–0.709) | 0.734488 (0.687–0.781) | 0.747676 (0.697–0.791) | |
| RF | 0.831990 (0.788–0.882) | 0.702854 (0.664–0.751) | 0.716456 (0.684–0.752) | 0.750433 (0.714–0.798) | ||
| LR | 0.833476 (0.802–0.873) | 0.675485 (0.641–0.709) | 0.708738 (0.667–0.746) | 0.739233 (0.701–0.776) | ||
| F1_score | Training | LGBM | 0.930657 (0.908–0.956) | 0.896744 (0.854–0.926) | 0.896744 (0.854–0.936) | 0.924481 (0.897–0.974) |
| RF | 0.874162 (0.847–0.913) | 0.813343 (0.785–0.864) | 0.907760 (0.854–0.947) | 0.865088 (0.823–0.906) | ||
| LR | 0.836066 (0.795–0.896) | 0.711538 (0.687–0.768) | 0.806871 (0.774–0.845) | 0.784825 (0.754–0.831) | ||
| Test | LGBM | 0.824964 (0.778–0.865) | 0.650964 (0.614–0.692) | 0.768302 (0.725–0.805) | 0.748077 (0.704–0.793) | |
| RF | 0.821549 (0.778–0.863) | 0.669226 (0.627–0.701) | 0.765641 (0.723–0.809) | 0.752139 (0.717–0.792) | ||
| LR | 0.810518 (0.769–0.864) | 0.649703 (0.607–0.683) | 0.761137 (0.731–0.806) | 0.740453 (0.716–0.792) | ||
| Accuracy | Training | LGBM | 0.934230 (0.897–0.971) | 0.894230 (0.856–0.926) | 0.884230 (0.834–0.921) | 0.924230 (0.888–0.967) |
| RF | 0.874497 (0.821–0.914) | 0.814497 (0.774–0.854) | 0.834497 (0.794–0.871) | 0.864497 (0.824–0.912) | ||
| LR | 0.773508 (0.735–0.814) | 0.693508 (0.652–0.739) | 0.753508 (0.712–0.793) | 0.783508 (0.746–0.82) | ||
| Test | LGBM | 0.817573 (0.774–0.859) | 0.737573 (0.704–0.774) | 0.737573 (0.698–0.769) | 0.747573 (0.712–0.783) | |
| RF | 0.770676 (0.716–0.816) | 0.760676 (0.723–802) | 0.690676 (0.642–0.735) | 0.750676 (0.713–0.801) | ||
| LR | 0.690093 (0.645–0.734) | 0.750093 (0.712–0.783) | 0.730093 (0.699–0.772) | 0.740093 (0.708–0.79.1) |
LGBM=Light gradient boosting machine, LR=Logistic regression, RF=Random forest
Table 5.
Confusion matrix for different models in training and test sets
| Prediction | Dataset | Model | Major effect | Minor effect | Moderate effect |
|---|---|---|---|---|---|
| Major effect | Training | LGBM | 1530 | 74 | 2 |
| RF | 587 | 87 | 2 | ||
| LR | 969 | 150 | 5 | ||
| Test | LGBM | 575 | 105 | 3 | |
| RF | 1342 | 265 | 6 | ||
| LR | 97 | 186 | 8 | ||
| Minor effect | Training | LGBM | 123 | 1446 | 34 |
| RF | 66 | 573 | 36 | ||
| LR | 177 | 851 | 125 | ||
| Test | LGBM | 108 | 456 | 120 | |
| RF | 240 | 1133 | 239 | ||
| LR | 202 | 766 | 166 | ||
| Moderate effect | Training | LGBM | 29 | 102 | 1464 |
| RF | 14 | 74 | 620 | ||
| LR | 48 | 238 | 869 | ||
| Test | LGBM | 28 | 156 | 509 | |
| RF | 72 | 376 | 1132 | ||
| LR | 58 | 272 | 803 |
LGBM=Light gradient boosting machine, LR=Logistic regression, RF=Random forest
Negative predictive value, precision-recall, and receiver operating characteristic curves
The evaluation of our models showed a high accuracy level in precision-recall and receiver operating characteristic (ROC) curves. We found that the RF model was best with an average precision-recall AUC of 0.85, followed by LGBM (average precision-recall AUC of 0.84). The LR model had the lowest performance, with an average precision-recall AUC of 0.82.
In terms of the AUC of the ROC curve, LGBM and RF both had the highest performance (average ROC curve AUC of 0.91), followed by LR (average ROC curve AUC of 0.90). Figure 2 shows the precision-recall and ROC curves for the models in detail.
Figure 2.

Precision-recall and ROC curves for the models. (a) Precision-recall curve for LGBM, (b) ROC curve model for LGBM, (c) Precision-recall curve for RF, (d) ROC curve for RF, (e) Precision-recall curve for LR, (f) ROC curve for LR. The diagonal black dotted line represents a baseline model (that predicts at random), hence the same values of TPR and FPR. The blue solid curve represents a ideal model. ROC = Receiver operating characteristic, TPR = True positive rate, FPR = False positive rate, LGBM = Light gradient boosting machine
The negative predictive value (NPV) of the LGBM model was 97.1 (93.45–99.42), 87.9 (84.67–91.75), 85.8 (82.31–89.47), and 90.3 in major effect, minor effect, moderate effect, and average, respectively. The NPV of the RF model was 96.5 (93.85–98.78), 87.7 (84.26–91.16), 86.0 (81.52–88.30), and 90.1 (87.62–94.07) in major effect, minor effect, moderate effect, and average, respectively. The NPV of the LR model was 97.2 (94.35–99.87), 89.9 (85.64–93.46), 85.7 (81.75–90.02), and 90.9 (87.35–94.66) in major effect, minor effect, moderate effect, and average, respectively.
DISCUSSION
The primary goal of the current study was to compare three different ML approaches in predicting the DPH poisoning prognosis. Our findings demonstrated the efficacy and accuracy of the LR, RF, and LGBM models in DPH prognosis prediction. To the best of our knowledge, this is the first study that utilized ML approaches with the aim of prognosis prediction in DPH poisonings.
Prior studies in ML in medical toxicology have found challenges in differentiating the causal agent of poisoning based on clinical symptoms, primarily due to small sample numbers. For example, a study by Nogee et al. used clinical characteristics and multiclass classification algorithms (Naive Bayes, Support Vector Machines, Decision Trees, RF, and Gradient Boosted (XGBoost), to identify the poisoning agent. They reported an overall accuracy rate of 61.9%, with carbon monoxide, opioids, and benzodiazepines exhibiting superior performance.[20] Dong et al. utilized a RF model to predict opioid overdose and achieved a high recall (85.7%), accuracy (98.7%), and precision (99.2%). They then applied a deep learning model using the SPARCS dataset, demonstrating a high precision (99.2%), accuracy (96.8%), and fair recall (71.6%).[21] ML has also been utilized to predict paraquat poisoning prognosis, seizures from tramadol poisoning, adverse drug events in elderly patients, smoking cessation treatment outcomes, lead poisoning in children, pesticide ototoxicity, in emergency departments.[11,12,22,23,24,25,26] Using NPDS data, Mehrpour et al. applied a decision tree approach to acetaminophen and metformin,[27,28,29,30] and ML classification techniques to predict the causal agent.[31]
Our models demonstrated a high NPV and specificity. The greater a test's sensitivity, the less likely it is that a person with a negative test has the disease, and hence the greater its NPV. The higher the positive predictive value of a test, the less probable it is that an individual with a positive test is free of disease.
Interestingly, we found that just 1.1% of patients (mostly in those with major outcomes) received physostigmine, a specific antidote for DPH. In a retrospective cohort trial, treatment of physostigmine to reverse anticholinergic delirium exhibited a favorable safety profile and frequently improved or cleared anticholinergic delirium when given in dosages <2 mg.[32]
The strengths of our study include the following: first, since NPDS is the largest data repository of poisoning and exposures to different substances in the United States, our results may be more generalizable. Second, the findings of our study are based on the symptoms and laboratory data of cases reported to PCCs, allowing our results to be more practical and potentially useful to clinicians during their medical decision-making process. The limitations of our study are that we included patients who had exposure only to DPH, so we could not identify the prognosis of patients with co-ingestions. Moreover, these patients may not necessarily have toxicity or overdose. However, even though the results of ML models may help physicians diagnose, treat, and predict prognosis, there are few trials investigating the efficacy of ML models compared to decisions made by physicians. Finally, this study is a retrospective data analysis, so the results of this study should be interpreted cautiously.
CONCLUSIONS
Our study demonstrates the applicability of ML methods to predict the outcome of DPH exposure is feasible with reasonable accuracy.
Disclaimers
The NPDS is organized by the AAPCC, and it consists of anonymous and self-reporting cases acquired through phone calls to the country's PCCs. Because further PCC exposure may be under-reported, NPDS data do not represent the complete exposure to a particular substance. As a result, NPDS data should not imply poisoning or overdose, and the AAPCC cannot authenticate the accuracy of each report. Consequently, findings based on NPDS data only sometimes accurately reflect the AAPCC's perspective.
Ethics statement
The authors of this study obtained the approval of NPDS. This study was reviewed by the Colorado Multiple Institutional Review Board (COMIRB#: 22-1088) and determined to be not human subject research because all of the data collected and analyzed is publicly available and fully de-identified.
Financial support and sponsorship
None.
Conflicts of interest
Dr. Goss receives consulting fees from Credo Health. Dr. Goss's financial interests have been reviewed by University of Colorado Hospital and University of Colorado School of Medicine in accordance with their institutional policies.
Acknowledgment
The authors would like to thank the NPDS for supplying the poisoning data.
REFERENCES
- 1.Eckes L, Tsokos M, Herre S, Gapert R, Hartwig S. Toxicological identification of diphenhydramine (DPH) in suicide. Forensic Sci Med Pathol. 2013;9:145–53. doi: 10.1007/s12024-012-9383-5. [DOI] [PubMed] [Google Scholar]
- 2.Clemons J, Jandu A, Stein B, Chary MA. Early intravenous lipid emulsion therapy for diphenhydramine overdose: A case report. Toxicol Commun. 2021;5:15–8. [Google Scholar]
- 3.Nemanich A, Liebelt E, Sabbatini AK. Increased rates of diphenhydramine overdose, abuse, and misuse in the United States, 2005-2016. Clin Toxicol (Phila) 2021;59:1002–8. doi: 10.1080/15563650.2021.1892716. [DOI] [PubMed] [Google Scholar]
- 4.Gummin DD, Mowry JB, Beuhler MC, Spyker DA, Bronstein AC, Rivers LJ, et al. 2020 annual report of the American Association of Poison Control Centers’ National Poison Data System (NPDS): 38th annual report. Clin Toxicol (Phila) 2021;59:1282–501. doi: 10.1080/15563650.2021.1989785. [DOI] [PubMed] [Google Scholar]
- 5.Palmer RB, Reynolds KM, Banner W, Bond GR, Kauffman RE, Paul IM, et al. Adverse events associated with diphenhydramine in children, 2008-2015. Clin Toxicol (Phila) 2020;58:99–106. doi: 10.1080/15563650.2019.1609683. [DOI] [PubMed] [Google Scholar]
- 6.Kourou K, Exarchos TP, Exarchos KP, Karamouzis MV, Fotiadis DI. Machine learning applications in cancer prognosis and prediction. Comput Struct Biotechnol J. 2015;13:8–17. doi: 10.1016/j.csbj.2014.11.005. [DOI] [PMC free article] [PubMed] [Google Scholar]
- 7.Dreiseitl S, Ohno-Machado L. Logistic regression and artificial neural network classification models: A methodology review. J Biomed Inform. 2002;35:352–9. doi: 10.1016/s1532-0464(03)00034-0. [DOI] [PubMed] [Google Scholar]
- 8.Kurt I, Ture M, Kurum AT. Comparing performances of logistic regression, classification and regression tree, and neural networks for predicting coronary artery disease. Expert Syst Appl. 2008;34:366–74. [Google Scholar]
- 9.Yang L, Wu H, Jin X, Zheng P, Hu S, Xu X, et al. Study of cardiovascular disease prediction model based on random forest in eastern China. Sci Rep. 2020;10:5245. doi: 10.1038/s41598-020-62133-5. [DOI] [PMC free article] [PubMed] [Google Scholar]
- 10.Klug M, Barash Y, Bechler S, Resheff YS, Tron T, Ironi A, et al. A gradient boosting machine learning model for predicting early mortality in the emergency department triage: Devising a nine-point triage score. J Gen Intern Med. 2020;35:220–7. doi: 10.1007/s11606-019-05512-7. [DOI] [PMC free article] [PubMed] [Google Scholar]
- 11.Gao M, Igata H, Takeuchi A, Sato K, Ikegaya Y. Machine learning-based prediction of adverse drug effects: An example of seizure-inducing compounds. J Pharmacol Sci. 2017;133:70–8. doi: 10.1016/j.jphs.2017.01.003. [DOI] [PubMed] [Google Scholar]
- 12.Behnoush B, Bazmi E, Nazari SH, Khodakarim S, Looha MA, Soori H. Machine learning algorithms to predict seizure due to acute tramadol poisoning. Hum Exp Toxicol. 2021;40:1225–33. doi: 10.1177/0960327121991910. [DOI] [PubMed] [Google Scholar]
- 13.Ouchi K, Lindvall C, Chai PR, Boyer EW. Machine learning to predict, detect, and intervene older adults vulnerable for adverse drug events in the emergency department. J Med Toxicol. 2018;14:248–52. doi: 10.1007/s13181-018-0667-3. [DOI] [PMC free article] [PubMed] [Google Scholar]
- 14.Huang Z, Hu C, Chi C, Jiang Z, Tong Y, Zhao C. An artificial intelligence model for predicting 1-year survival of bone metastases in non-small-cell lung cancer patients based on XGBoost algorithm. Biomed Res Int. 2020;2020:3462363. doi: 10.1155/2020/3462363. [DOI] [PMC free article] [PubMed] [Google Scholar]
- 15.Hou N, Li M, He L, Xie B, Wang L, Zhang R, et al. Predicting 30-days mortality for MIMIC-III patients with sepsis-3: A machine learning approach using XGboost. J Transl Med. 2020;18:462. doi: 10.1186/s12967-020-02620-5. [DOI] [PMC free article] [PubMed] [Google Scholar]
- 16.Fernandes FT, de Oliveira TA, Teixeira CE, Batista AF, Dalla Costa G, Chiavegatto Filho AD. A multipurpose machine learning approach to predict COVID-19 negative prognosis in São Paulo, Brazil. Sci Rep. 2021;11:3343. doi: 10.1038/s41598-021-82885-y. [DOI] [PMC free article] [PubMed] [Google Scholar]
- 17.Bai Z, Lu J, Li T, Ma Y, Liu Z, Zhao R, et al. Clinical feature-based machine learning model for 1-year mortality risk prediction of ST-segment elevation myocardial infarction in patients with hyperuricemia: A retrospective study. Comput Math Methods Med. 2021;2021:7252280. doi: 10.1155/2021/7252280. [DOI] [PMC free article] [PubMed] [Google Scholar]
- 18.Gummin DD, Mowry JB, Beuhler MC, Spyker DA, Brooks DE, Dibert KW, et al. 2019 Annual Report of the American Association of Poison Control Centers' National Poison Data System (NPDS): 37th Annual Report. Clinical toxicology (Philadelphia, Pa) 2020;58:1360–541. doi: 10.1080/15563650.2020.1834219. Epub 2020/12/12. doi: 10.1080/15563650.2020.1834219. PubMed PMID: 33305966. [DOI] [PubMed] [Google Scholar]
- 19. https://scikit-learn.org/stable. Available from: 04/11/2023.
- 20.Nogee DH, Hart K, Tomassoni A. Multiclass classification machine learning identification of common poisonings. North American Congress of Clinical Toxicology (NACCT) abstracts 2020. Clin Toxicol (Phila) 2020;58:1083–4. [Google Scholar]
- 21.Dong X, Rashidian S, Wang Y, Hajagos J, Zhao X, Rosenthal RN, et al. Machine learning based opioid overdose prediction using electronic health records. AMIA Annu Symp Proc. 2019;2019:389–98. [PMC free article] [PubMed] [Google Scholar]
- 22.Wen C, Lin F, Huang B, Zhang Z, Wang X, Ma J, et al. Metabolomics analysis in acute paraquat poisoning patients based on UPLC-Q-TOF-MS and machine learning approach. Chem Res Toxicol. 2019;32:629–37. doi: 10.1021/acs.chemrestox.8b00328. [DOI] [PubMed] [Google Scholar]
- 23.Chen H, Hu L, Li H, Hong G, Zhang T, Ma J, et al. An effective machine learning approach for prognosis of paraquat poisoning patients using blood routine indexes. Basic Clin Pharmacol Toxicol. 2017;120:86–96. doi: 10.1111/bcpt.12638. [DOI] [PubMed] [Google Scholar]
- 24.Lai CC, Huang WH, Chang BC, Hwang LC. Development of machine learning models for prediction of smoking cessation outcome. Int J Environ Res Public Health. 2021;18:2584. doi: 10.3390/ijerph18052584. [DOI] [PMC free article] [PubMed] [Google Scholar]
- 25.Potash E, Ghani R, Walsh J, Jorgensen E, Lohff C, Prachand N, et al. Validation of a machine learning model to predict childhood lead poisoning. JAMA Netw Open. 2020;3:e2012734. doi: 10.1001/jamanetworkopen.2020.12734. [DOI] [PMC free article] [PubMed] [Google Scholar]
- 26.Tomiazzi JS, Pereira DR, Judai MA, Antunes PA, Favareto AP. Performance of machine-learning algorithms to pattern recognition and classification of hearing impairment in Brazilian farmers exposed to pesticide and/or cigarette smoke. Environ Sci Pollut Res Int. 2019;26:6481–91. doi: 10.1007/s11356-018-04106-w. [DOI] [PubMed] [Google Scholar]
- 27.Mehrpour O, Saeedi F, Hoyte C. Decision tree outcome prediction of acute acetaminophen exposure in the United States: A study of 30,000 cases from the National Poison Data System. Basic Clin Pharmacol Toxicol. 2022;130:191–9. doi: 10.1111/bcpt.13674. [DOI] [PubMed] [Google Scholar]
- 28.Amirabadizadeh A, Nakhaee S, Mehrpour O. Risk assessment of elevated blood lead concentrations in the adult population using a decision tree approach. Drug Chem Toxicol. 2022;45:878–85. doi: 10.1080/01480545.2020.1783286. [DOI] [PubMed] [Google Scholar]
- 29.Mehrpour O, Saeedi F, Hoyte C, Goss F, Shirazi FM. Correction: Utility of support vector machine and decision tree to identify the prognosis of metformin poisoning in the United States: Analysis of National Poisoning Data System. BMC Pharmacol Toxicol. 2022;23:68. doi: 10.1186/s40360-022-00608-z. [DOI] [PMC free article] [PubMed] [Google Scholar]
- 30.Mehrpour O, Saeedi F, Hoyte C, Goss F, Shirazi FM. Utility of support vector machine and decision tree to identify the prognosis of metformin poisoning in the United States: Analysis of National Poisoning Data System. BMC Pharmacol Toxicol. 2022;23:49. doi: 10.1186/s40360-022-00588-0. [DOI] [PMC free article] [PubMed] [Google Scholar]
- 31.Mehrpour O, Hoyte C, Delva-Clark H, Al Masud A, Biswas A, Schimmel J, et al. Classification of acute poisoning exposures with machine learning models derived from the National Poison Data System. Basic Clin Pharmacol Toxicol. 2022;131:566–74. doi: 10.1111/bcpt.13800. [DOI] [PubMed] [Google Scholar]
- 32.Arens AM, Shah K, Al-Abri S, Olson KR, Kearney T. Safety and effectiveness of physostigmine: A 10-year retrospective review. Clin Toxicol (Phila) 2018;56:101–7. doi: 10.1080/15563650.2017.1342828. [DOI] [PubMed] [Google Scholar]