

Abstract
Background:
Using bone turnover marker (BTM) monitoring to identify “quick losers” who may develop osteoporosis in the coming years is one of the main challenges in clinical practice. This study was implemented to examine the association of BTMs with bone mineral density (BMD) as well as to determine their relationship with the fracture risk assessment tool (FRAX) in women in the postmenopausal period.
Materials and Methods:
This study was observational cross-sectional research that was done on women between the ages of 50 and 65 who were in the postmenopausal period. A dual-energy X-ray absorptiometry was applied to select 120 eligible women with normal BMD and 120 women without normal BMD. BTMs were assessed using enzyme-linked immunosorbent assay. Osteoporosis's Odds Ratio (OR) was estimated using a confounder-adjusted logistic regression model. The area under curve was calculated for the differentiation of low BMD in the postmenopausal period through receiver-operator characteristic (ROC) curves. To assess the probability of major osteoporotic fracture and hip fracture for the future 10 years, FRAX was applied.
Results:
Higher serum osteocalcin (OC) (OR: 1.134, 95% confidence interval [CI]: 1.086–1.184), osteopontin (OP) (OR: 1.180; 95%CI: 1.105–1.261), and alkaline phosphatase (ALP) (OR: 1.007; 95%CI: 1.001–1.144) concentrations were potential risk factors for developing low BMD in women after menopause. The area under curve (AUC) (95%CI) for OC, OP, and ALP was 0.75 (0.668–0.8130), 0.75 (0.685–0.812), and 0.602 (0.524–0.670), respectively. ROC analysis indicated that at the cut-off point of 16.28 ng/mL, sensitivity and specificity were 70.3% and 70.9%, respectively, for OC. Furthermore, at the cut-off point of 28.85 ng/mL, the sensitivity of 70.3% and specificity of 66.6% were obtained for OP. The serum OC and OP were significantly related to hip and major osteoporotic fractures (P < 0.05).
Conclusion:
The higher serum concentration of OC, OP, and ALP had significant associations with lower BMD. These BTMs can be complementary tools and helpful in the postmenopausal period as measures for screening of bone loss and possible bone fracture.
Keywords: Bone density, bone fracture, bone turnovers, menopause, risk, screening
INTRODUCTION
Osteoporosis is known as a major health concern during the postmenopausal period,[1] which is identified by low bone mass and decadence of the bone microarchitecture, as well as increased fragility.[2,3] Osteoporosis and related fractures are more probably to emerge with age, especially in women after menopause.[4] There are many factors that contribute to osteoporosis in postmenopausal women, but the main cause is a drop in estrogen levels, which results in rapid loss of bone mass and structure.[5] In addition to being a major cause of fractures, osteoporosis can lead to serious life-threatening complications, especially in elderly people.[6]
The assessment of bone mineral density (BMD) through dual-energy X-ray absorptiometry (DXA) is currently the gold standard method for diagnosing osteoporosis.[7,8] The American Association of Clinical Endocrinologists suggests BMD testing for women above 65 years or younger who are at a high risk of fracture, but BMD only is responsible for a portion of fracture risk.[9] On the other hand, there are several problems with using DXA. The high cost of the BMD test, as well as its limited availability in some countries, and its low sensitivity, make it not the optimal method for detecting fracture risks in high-risk individuals.[5]
In this way, assessment of the bone turnover markers (BTMs) is considered a method for investigating skeletal dynamic changes. These markers cannot be used for osteoporosis diagnosis, but their elevated levels may predict the high rates of bone loss.[10,11] Accordingly, some studies reported that the enhanced levels of these markers are associated with an increased fracture risk which was independent of BMD.[9]
Some important features of these markers make them an attractive option, including the ability to analyze blood and urine samples, the availability of a variety of markers, the ease of sample collection, and the fact that they provide information that can complement BMD.[12]
Currently, most women who are in the menopausal transition period did not screen for osteoporosis. Using BTM monitoring to identify “quick losers,” who may develop osteoporosis in the coming years is one of the main challenges in clinical practice.[13] There is not sufficient evidence to predict bone loss or fracture risk from BTMs in the world, and recommendations have been made to conduct further research in this field. Therefore, the current study examined the association between the serum concentration of osteocalcin (OC), osteopontin (OP), and alkaline phosphatase (ALP) with BMD in the postmenopausal period as well as determining their cut-off point for screening, and investigating the correlation of BTMs with fracture risk.
MATERIALS AND METHODS
Study design and population
This study was observational cross-sectional research that was done between August 2018 and January 2020 and derived from a megaproject of Tabriz University of Medical Science.[14] The ethics committee of Tabriz University of Medical Sciences confirmed the study protocol (IR. TBZMED. REC.1397.733). We identified 108,778 50–65-year-old menopausal women from the SIB integrated system of Health in Tabriz. Of these, 850 women were randomly selected and assessed for eligibility criteria. The final sample included 240 women, 120 of whom were diagnosed by normal BMD and 120 of whom had low BMD (primary osteoporosis andosteopenia) based on the criteria of the World Health Organization[15] [Figure 1]. The sampling began after obtaining the necessary permits. The city of Tabriz has 87 health centers that sampling was done randomly from these centers. The study participants all signed informed consent forms.
Figure 1.

Flowchart of the study subjects selection
Inclusion and exclusion criteria
Our study included 50- to 65-year-old women who had been menopausal for at least 12 consecutive months, without pathological fractures in the past 10 years, and had the ability to verbally communicate to answer questions. Exclusion criteria consisted of bone disorders except for osteoporosis, malignancies, metastatic bone diseases, kidney failure and kidney disease, and use of medications that affect the metabolism of bone consisted of intravenous bisphosphonates in the past 5 years and oral bisphosphonates within the past 6 months, the cumulative use of oral bisphosphonates exceed 1 month between 6–12 months or more than 3 years, the use of hormonal drugs or corticosteroids, taking the analogs of parathyroid hormone in the past 12 months or strontium, at any time, gastrointestinal disorders, endocrine disorders, biliary tract abnormality or chronic liver disease, a Body Mass Index (BMI) <18.5, serum 25 (OH) D <20 ng/ml as well as current hypocalcemia[16] based on medical history, laboratory tests and endocrinologist visit, and finally undiagnosed vertebral fractures.
Data collection tool and measurement
Demographic, reproductive history, anthropometric, food intake, and physical activity characteristics questionnaire
The demographic questionnaire included questions about age, menopausal age, smoking, alcohol consumption, sun exposure, supplements intake, etc. In the midwifery questionnaire, questions were asked about breastfeeding history and how many pregnancies a woman has had. Weight was measured through a standard lever scale (Seca, Hamburg, Germany) with an accuracy of 0.1 kg and height by a stadiometer attached to the wall (Seca, Hamburg, Germany) with an accuracy of 0.1 cm in the required conditions.
BMI was obtained by devoted formula using weight and height. The individuals physical activity was acquired by the International Physical Activity Questionnaire (IPAQ), and the validity and reliability of it, has been reviewed and approved in Iran.[17] MET-min/week rates were obtained for light, moderate, vigorous, and total physical activity through an interview. The participants’ dietary intake was calculated for 1 week using a 24-h food diary (one holiday and two nonconsecutive workdays totally three days). Food intake was converted to grams using the guide of home scales and then analyzed in terms of dietary calcium and Vitamin D by Nutritionist IV food analysis Software (First Databank, San Bruno, CA, USA), verified according to Iranian foods.
Bone mineral density
An experienced and trained expert evaluated the lumbar spine (L1-L4) and the femoral neck (FN) anterior-posterior (AP) projection at the Sina Hospital densitometry center with a Hologic QDR 4500W (S/N 50266) DXA densitometer.
Biochemical measurements
The serum levels of OC and OP were determined according to the manufacturer's instructions, using an enzyme-linked immunosorbent assay (ELISA) (Kit DY1419-05 and DY1433, respectively, from R and D Systems, USA) by reagents and materials inside the pack in the required conditions and temperatures at the recommended dilutions. Optical absorption of samples was read at the wavelength of 540 nm by ELISA reader Bio Tek Instruments, Inc., made in the USA, and used to determine the serum concentration using the standard curve. The serum level of ALP was measured by Pars Azmoon kit (Pars Azmoon, Tehran, Iran) by spectrophotometry using an auto-analyzer (Alcyon 300, USA).
Fracture risk assessment tool (FRAX)
Numerous determined clinical risk factors such as age, sex, smoking, BMI, alcohol use, previous fracture, or history of hip fracture in parents, secondary osteoporosis, rheumatoid arthritis, and FN BMD that independently from BMD are incorporated readily by available tool (www.shef.ac.uk/FRAX) to calculate the probability of 10 year fracture (%). This tool calculates the 10-year hip or major osteoporotic fractures probability including the lumbar spine, humerus, or forearm.[9]
Data analysis
In order to evaluate the normality of quantitative variables by study group, Kolmogorov–Smirnov and scattering indices (SD, Skewness, and kurtosis) were applied. Descriptive statistics consisting of absolute and relative frequencies as well as mean (standard deviation) were applied to indicate quantitative and qualitative variables. The Chi-square, Fisher's exact test, independent t -test, and Mann–Whitney test were utilized for the comparison of categorical and continuous variables between the study groups. To estimate the odds ratio (OR) and 95% confidence interval (CI) for osteoporosis and osteopenia adjusted for age, BMI, gravidity, age at menopause, and educational level, a logistic regression model was employed. The Hosmer–Lemeshow test was applied for the goodness-of-fit while using the Logistic regression model. A linear regression model was applied for modeling the relationship between FRAX and serum BTMs adjusted for confounders. To investigate the sensitivity and specificity of threshold values for OC, OP, and ALP to differentiate low bone density in 50- to 65-year-old postmenopausal women, receiver operating characteristic (ROC) were used. The AUCs were classified: 0.6–0.7 as poor, 0.7–0.8 as fair, 0.8–0.9 as good, and 0.9–1.0 as excellent diagnostic accuracy.[18] We used SPSS version 23 (SPSS, Chicago, IL, USA) for data analyses. P < 0.05 was considered a significant level.
RESULTS
Statistically significant discrepancies were observed between normal BMD and low BMD groups based on age (P < 0.001), menopausal age (P = 0.020), marital status (P = 0.005), the classification of education (P < 0.003), number of pregnancies (P < 0.001), BMI (P < 0.001), and BMD-lumbar spine L1-L4 (LS). BMD-FN (P < 0.001), serum levels of OC (P < 0.001), OP (P < 0.001), and ALP (P = 0.013), major osteoporotic fracture (P < 0.001), as well as hip fracture (P < 0.001). However, significant differences were not seen in other variables (P > 0.05) [Table 1].
Table 1.
Characteristics of participants among postmenopausal women with normal and low bone mineral density (n=120)
| Variable | Normal BMD, mean (SD) or n (%) | Low BMD, mean (SD) or n (%) | P |
|---|---|---|---|
| Age (years) | 55.4 (3.7%) | 58.5 (3.7%) | <0.001t |
| Menopause age (years) | 49.4 (3.6%) | 48.2 (4.0%) | 0.020t |
| Education | |||
| Illiterate | 22 (18.3%) | 36 (30.0%) | <0.003Ch |
| Primary | 37 (30.8%) | 47 (39.2%) | |
| Secondary | 22 (18.3%) | 14 (11.7%) | |
| High and diploma | 27 (22.55%) | 15 (12.5%) | |
| University | 12 (10.0%) | 8 (6.7%) | |
| Occupation | |||
| Householder | 106 (88.3%) | 105 (87.5%) | P=1.0f |
| Occupied | 14 (11.7%) | 15 (12.5%) | |
| Family income | |||
| Inadequate | 13 (10.8%) | 20 (16.8%) | 0.223Ch |
| Rather adequate | 81 (67.5%) | 77 (64.7%) | |
| Completely adequate | 26 (21.7%) | 22 (18.5%) | |
| Marital status | |||
| Married | 106 (88.3%) | 88 (73.3%) | 0.005f |
| Single, divorced, widowed | 14 (11.7%) | 32 (26.7%) | |
| Smoking (yes) | 3 (2.5%) | 4 (3.4%) | 0.845f |
| Gravid number | 3.9 (1.7%) | 4.8 (2.4%) | <0.001t |
| Lactation history | 109 (98.4%) | 109 (98.4%) | 1.0f |
| Taking supplements | |||
| Vitamin D | 28 (23.3%) | 19 (15.8%) | 0.683Ch |
| Calcium | 14 (11.7%) | 14 (11.7%) | |
| Vitamin D and calcium | 20 (16.7%) | 20 (16.7%) | |
| Dietary Vitamin D (µg/d) | 1.8 (1.2) | 1.5 (1.3) | 0.214t |
| Dietary calcium (mg/d) | 783.2 (322.7) | 715.1 (224.5) | 0.228t |
| Total met* (mets-min/week) | 401.2 (6612.0) | 346.5 (4426.5) | 0.839M |
| BMI (kg/m2) | 31.4 (4.6) | 28.2 (3.7) | <0.00t |
| BMD-LS (g/cm2) | 1.03 (0.11) | 0.73 (0.08) | <0.001t |
| BMD-FN (g/cm2) | 0.97 (0.11) | 0.75 (0.09) | <0.001t |
| T-score/LS | −0.11 (0.88) | −2.91 (0.75) | <0.001t |
| T-score/FN | 0.16 (0.76) | −1.60 (0.73) | <0.001t |
| OC (ng/mL) | 16.1 (6.5) | 27.1 (11.7) | <0.001t |
| OP (ng/mL) | 25.5 (6.6) | 31.4 (5.6) | <0.001t |
| ALP (U/L) | 174.3 (48.6) | 191.4 (55.4) | 0.013t |
| 25(OH) D (ng/mL)^ | 42.3 (7.2) | 40.9 (5.2) | 0.657 |
| Major osteoporotic fracture© | 2.5 (0.9) | 4.4 (1.9) | <0.001t |
| Hip fracture© | 0.000 (0.30) | 0.4 (2.5) | <0.001M |
*Median (range); tIndependent t-test; fFisher’s exact test; ChChi-square; MMann–Whitney; ^Cases with 25(OH) D <20ng/mL were excluded from study; ©FRAX predicts the 10-year probability of hip fracture and major osteoporotic fracture (hip, clinical spine, humerus, or forearm). BMI=Body mass index; BMD=Bone mineral density; LS=Lumbar spine; FN=Femoral neck; ALP=Alkaline phosphatase; SD=Standard deviation; OC=Osteocalcin; OP=Osteopontin
We observed significant inverse relationships between BMD in the LS and FN region and serum levels of BTMs according to the Pearson correlation coefficient (OC and BMD-LS: R = −0.38 P < 0.001, OC and BMD-FN: R = −0.39 P < 0.001; OP and BMD-LS: R = −0.37 P < 0.001, OP and BMD-FN: R = −0.35 P < 0.001; ALP and BMD-LS: R =−0.18 P = 0.007, ALP and BMD-FN: R = −0.24 P < 0.001) [Figure 2].
Figure 2.
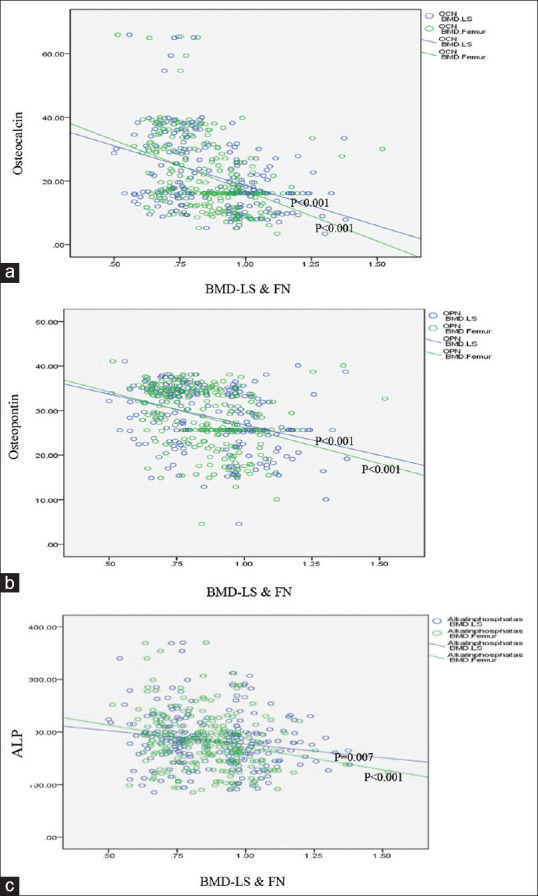
Correlation between osteocalcin, osteopontin, and with ALP with BMD-lumbar spine and femoral neck. (a) Correlation between osteocalcin with BMD-lumbar spine and femoral neck (r=−0.38, r=−0.39) (b) Correlation between osteopontin with BMD-lumbar spine and femoral neck (r=−0.37, r=−0.35) (c) Correlation between alkaline phosphatase (ALP) with BMD-lumbar spine and femoral neck (r=−0.18, r= −0.24)
The associations of serum bone turnover markers with bone mineral density in the early postmenopausal period
The results of the logistic regression model indicated that OC (adjusted OR: 1.134, 95% CI: 1.086–1.184), OP (adjusted OR: 1.180; 95% CI: 1.105–1.261), and ALP (adjusted OR: 1.007; 95% CI: 1.001–1.014) were significant risk factors for low BMD in postmenopausal women [Table 2]. We performed a sensitivity analysis, and the results of adjusted and nonadjusted regression models were similar for low BMD according to the FN and lumbar spine (L1-L4) regions.
Table 2.
The odds of low bone mineral density based on the serum concentration of bone turnover markers among early postmenopausal women using Logistic regression model
| Variable | Adjusted§ | Nonadjusted¶ | ||
|---|---|---|---|---|
|
|
|
|||
| OR (95% CI) | P | OR (95% CI) | P | |
| OC (ng/mL) | 1.134 (1.086–1.184) | <0.001 | 1.126 (1.086–1.166) | <0.001 |
| OP (ng/mL) | 1.180 (1.105–1.261) | <0.001 | 1.165 (1.110–1.223) | <0.001 |
| ALP (U/L) | 1.007 (1.001–1.014) | 0.024 | 1.006 (1.001–1.012) | 0.015 |
§Adjusted for age, menopause age, BMI, education, and gravid number; §OC Hosmer and Lemeshow P=0.778, χ2=4.804, df=8; ¶Hosmer and Lemeshow P=0.725, χ2=4.915, df=8; §OP hosmer and lemeshow P=0.170, χ2=11.593, df=8; ¶Hosmer and lemeshow P=0.149, χ2=12.051, df=8; ¶ALP hosmer and lemeshow P=0.396, χ2=8.391, df=8; ¶Hosmer and lemeshow P=0.585, χ2=6.554, df=8. ALP=Alkaline phosphatase; BMI=Body mass index; CI=Confidence interval; OR=Odds ratio; OC=Osteocalcin; OP=Osteopontin
Diagnostic value of bone turnover markers
To demonstrate the diagnostic value of measuring serum level of OC, OP, and ALP compared to the DXA standard method for low-BMD, ROC curve was applied [Figure 3]. AUC: 95% CI, standard error, and P value for OC, OP, and ALP compared to DXA were (0.750: 0.668–0.8130, 032; P < 0.001), (0.749: 0.685–0.812, 032; P < 0.001), and (0.602: 0.524–0.670, 032; P = 010) respectively.
Figure 3.
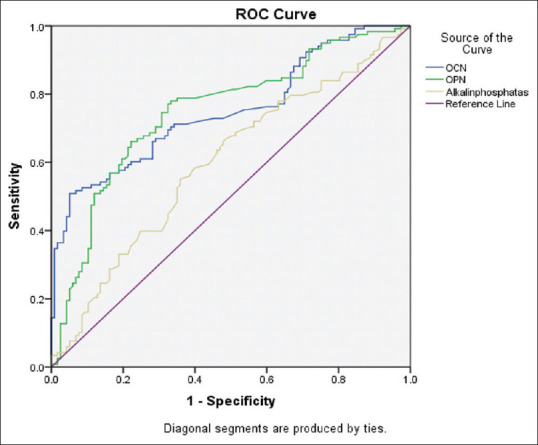
Area under the ROC curve for measurement of BTMs in postmenopausal women with low bone density. ROC: Receiver-Operator Characteristic, BTMs: Bone Turnover Markers, OCN: Osteocalcin, OPN: Osteopontin
A sensitivity of 70.3%, specificity of 66.6%, positive diagnostic value of 69%, negative diagnostic value 70.7%, positive likelihood ratio-2.10, and negative likelihood ratio-0.45 was obtained for OC marker at the cut-off point of 16.28 ng/mL, and sensitivity 70.3%, specificity 70.9%, positive diagnostic value 71.4%, negative diagnostic value 71.1% positive likelihood ratio-2.42 and a negative likelihood ratio of-0.42 was obtained for OP at the cut-off point 28.85.
The relationships of FRAX for major osteoporotic and hip fracture with serum bone turnover markers
The significant relationships between the FRAX (%) for major osteoporotic fracture with serum concentration of OC (adjusted β [95% CI]: 0.019 [0.002–0.036]) and OP (adjusted β [95% CI]: 0.033 [0.004–0.063], P = 0.027) as well as between FRAX for hip fracture with serum concentration of OC (adjusted β [95% CI]: 0.005 [0.004–0.012]) and OP (adjusted β [95% CI]: 0.012 [0.004–0.19]) were observed based on linear regression model adjusted for confounders [Table 3].
Table 3.
Relation of fracture risk with serum concentration of bone turnover markers among early postmenopausal women using linear regression model
| Variable | Adjusted β | Nonadjusted β | ||
|---|---|---|---|---|
|
|
|
|||
| 95% CI | P | 95% CI | P | |
| Major osteoporotic fracture | ||||
| OC | 0.019 (0.002–0.036) | 0.031 | 0.032 (0.013–0.051) | <0.001 |
| OP | 0.033 (0.004–0.063) | 0.027 | 0.048 (0.013–0.082) | 0.007 |
| ALP | 0.002 (−0.002–0.006) | 0.229 | 0.003 (−0.001–0.008) | 0.134 |
| Hip fracture | ||||
| OC | 0.005 (0.004–0.012) | <0.001 | 0.012 (0.008–0.017) | <0.001 |
| OP | 0.012 (0.004–0.19) | 0.002 | 0.016 (0.008–0.024) | <0.001 |
| ALP | 0.001 (0.000–0.002) | 0.079 | 0.001 (0.000–0.002) | 0.009 |
Adjusted for age, BMI, and menopause age. ALP=Alkaline phosphatase; CI=Confidence interval; BMI=Body mass index; OC=Osteocalcin; OP=Osteopontin
DISCUSSION
According to the findings, studied low BMD women had higher levels of serum OC, OP, and ALP than those with normal BMD. Hence that by adjusting confounders, the odds of having low BMD increased by 13% with one more unit of serum OC, by 18% with one more unit of serum OP, and by 1% with one more unit of serum ALP. The AUC of OC was 75% and a sensitivity of 70.3% and specificity of 66.6% were obtained at a cut-off point of 16.28 ng/mL for OC as well as the AUC of OP was 75%, and the obtained sensitivity and specificity values were 70.3% and 70.9%, respectively, at the point of 28.85 ng/mL. The higher concentrations of serum OC and OP were related to the increased 10-year likelihood of major osteoporotic fracture and hip fracture.
All women 50 years or older should be clinically screened for osteoporosis and the risk of fracture in the postmenopausal period.[9] BTMs allow bone metabolic changes to be detected before changes appear in BMD, and the emphasis is on the need to reconsider away from relying solely on BMD tests.[19] Moreover, the microarchitecture alterations which impact bone quality can be evaluated by BTMs, and so they can be applied as complementary tools to BMD in assessments of fracture risk.[20]
Consistent with the present study, the findings of the study by De Leo et al. demonstrated that serum levels of BTMs (P1CP and OC) in physiological menopaused women with low BMD were significantly higher than those with normal BMD.[21] In the study of Mederle et al., BSAP, and TRAP-5b were significantly higher in postmenopausal women with osteoporosis than in healthy women.[22] The results of Al-daghri et al. study showed that serum OC level in postmenopausal women with osteoporosis was significantly lower, but serum CTX level was higher than those with normal BMD.[23] In a cross-sectional study conducted by Kharroubi on normal and osteoporosis postmenopausal women, albeit the average BTMs serum levels (CTX and PINP) in women with osteoporosis, similar to our study, were higher than in healthy women, this difference was not statistically significant.[24] Among these studies, the result of only one study[23] related to OC is not consistent with the present study, which may be related to the younger age of the studied women and the failure to survey the secondary reasons of osteoporosis and exclude them from their study. In another study, in line with our results, serum OP levels and hip BMD had a significant negative relationship in the menopausal group.[25] It seems that according to the mentioned study, BTMs may be used as a screening test for low-BMD in individuals faced with early menopause.
BTMs in the current study had fair diagnostic value. Regarding the diagnostic value of BTMs in a study on postmenopausal women,[22] ROC analysis showed that BSAP had an AUC equal to 0.830 and at the cut-off point of 27.21 U/L had a sensitivity of 76.5% and a specificity of 84.3%. Furthermore, TRAP had an AUC of 0.950 and at the cut-off point of 3.45U, offered a moderate sensitivity of 86.3% and a specificity of 90.6% 40).[22] It seems in this study, BSAP was used instead of ALP, so it has shown a higher diagnostic value than the present study. Although the diagnostic value of ALP in the current study was less than the above study, its cost-effectiveness is one of its advantage. Another study in women and men above 60 years old examined the diagnostic value of BTMs for nonvertebral fractures, and all formation and resorption BTMs had an AUC of 0.6916–0.825.[26] In a study on renal osteodystrophy patients, the diagnostic value of BTMs compared to bone biopsy was evaluated, and BSAP, PINP, and TRAP5b had AUC of 0.82, 0.79, and 0.80, respectively.[18] In another study, BTMs (tP1NP, ß-CTx) were applied for the early diagnosis of bone metastases in patients with pulmonary cancer. ROC analysis showed AUC values of 0.84 and 0.81, respectively.[27] Furthermore, a study was done to survey the correlation between serum BSAP isoforms and bone histomorphometric parameters in CKD patients receiving long-term hemodialysis. For BSAP, an AUC of 0.89 was found to be useful for detecting nonlow bone turnover.[28] It is noteworthy that in the last four studies, the diagnostic value of BTMs for different health conditions (secondary causes of osteoporosis) has been performed and confirmed.
Some studies reported that BTMs were associated with an enhanced risk of fracture independent of BMD.[13,29] In contrast, a recent study without BMD data did not report BTMS as a predictor for hip fractures.[29] In the mentioned studies, the patients with or without fractures were evaluated, but in the current study, the association of BTMs with the 10-year possibility of fracture was investigated, and the prediction value of BTMs for future fractures was surveyed.
Study strengths and limitations
One of the consequences of menopause is an increase in the activity of osteoclasts due to a decrease in estrogen. This process continues for 10–15 years so that at the end of this time, 50% of spongy bone mass and 30% of dense bone mass decrease.[30] Therefore, this period (age 50–65 years) is a critical time for screening bone loss and fracture risk in these populations. In the present study, we assessed and adjusted possible confounders that might affect osteoporosis. One of the limitations of the current study was the impossibility of providing and checking all of the important BTMs due to the unavailability of kits for measuring in our country. Hence, we recommend measuring all important bone formation and bone resorption BTMS and measuring bone-specific ALP rather than ALP. It should be noted that BTMs are accompanied by some deficiencies, including high cost, lack of commercial laboratories reports for their appropriate reference ranges, and the probable impact of renal function deficiency on all BTMss except bone-specific ALP.[9] Moreover, in the current study, the association between BTMs with BMD as a dichotomous (normal BMD and low BMD) as well as a continuous variable has been investigated. It is suggested to do future studies on postmenopausal women as three group-divisions: normal BMD, osteopenia, and osteoporosis.
CONCLUSIONS
The findings of this study illustrated that the serum level of BTMs (OC, ALP, OP) in women with low BMD was significantly higher than in postmenopausal women with normal BMD. The investigated BTMs are suggested as good predictors of bone density loss in the early postmenopausal period. They may also be recommended for determining the probability of bone fracture in later 10 years. Wide access to reliable, sensitive, specific, and cost-effective assays for BTMs can be a good complementary for BMD assessment in the screening of bone loss and fracture.
Financial support and sponsorship
Nil.
Conflicts of interest
There are no conflicts of interest.
Acknowledgments
We appreciate all participants who assisted us in this research. This study has been supported financially by the vice chancellor for Research and Technology of Tabriz University of Medical Sciences (Grant no: 61149). Research project number of projects from which the paper is derived: 61149.
REFERENCES
- 1.Karimifard M, Aminorroaya A, Amini M, Kachuie A, Feizi A, Yamini SA, et al. The effect of alendronate on lipid profile of postmenopausal women with osteopenia and prediabetes: A randomized triple-blind clinical trial. J Res Med Sci. 2021;26:52. doi: 10.4103/jrms.JRMS_579_19. [DOI] [PMC free article] [PubMed] [Google Scholar]
- 2.Kanis JA, Johansson H, Oden A, McCloskey EV. Guidance for the adjustment of FRAX according to the dose of glucocorticoids. Osteoporos Int. 2011;22:809–16. doi: 10.1007/s00198-010-1524-7. [DOI] [PubMed] [Google Scholar]
- 3.Kanis JA, McCloskey EV, Johansson H, Oden A, Melton LJ, 3rd, Khaltaev N. A reference standard for the description of osteoporosis. Bone. 2008;42:467–75. doi: 10.1016/j.bone.2007.11.001. [DOI] [PubMed] [Google Scholar]
- 4.Ensrud KE. Epidemiology of fracture risk with advancing age. J Gerontol A Biol Sci Med Sci. 2013;68:1236–42. doi: 10.1093/gerona/glt092. [DOI] [PubMed] [Google Scholar]
- 5.Vincent GK, Victoria AV. The Next Four Decades: The Older Population in the United States: 2010 to 2050. Current Population Reports. No. 1138. US Department of Commerce, Economics and Statistics Administration, US Census Bureau. 2010:25–1138. [Google Scholar]
- 6.World Health Organization. WHO Scientific Group on the Assessment of Osteoporosis at Primary Health Care Level. Summary Meeting Report. 2004 [Google Scholar]
- 7.Blake GM, Fogelman I. The role of DXA bone density scans in the diagnosis and treatment of osteoporosis. Postgrad Med J. 2007;83:509–17. doi: 10.1136/pgmj.2007.057505. [DOI] [PMC free article] [PubMed] [Google Scholar]
- 8.European Agency for the Evaluation of Medicinal Products. Guideline on the evaluation of new medicinal products in the Treatment of primary osteoporosis. London: 2005. Dec 14, Doc. Ref. CPMP/EWP/552/95 Rev. 2. [Google Scholar]
- 9.Camacho PM, Petak SM, Binkley N, Diab DL, Eldeiry LS, Farooki A, et al. American association of clinical endocrinologists/American college of endocrinology clinical practice guidelines for the diagnosis and treatment of postmenopausal osteoporosis-2020 update. Endocr Pract. 2020;26:1–46. doi: 10.4158/GL-2020-0524SUPPL. [DOI] [PubMed] [Google Scholar]
- 10.Ross PD, Knowlton W. Rapid bone loss is associated with increased levels of biochemical markers. J Bone Miner Res. 1998;13:297–302. doi: 10.1359/jbmr.1998.13.2.297. [DOI] [PubMed] [Google Scholar]
- 11.Garnero P, Sornay-Rendu E, Duboeuf F, Delmas PD. Markers of bone turnover predict postmenopausal forearm bone loss over 4 years: The OFELY study. J Bone Miner Res. 1999;14:1614–21. doi: 10.1359/jbmr.1999.14.9.1614. [DOI] [PubMed] [Google Scholar]
- 12.He WT, Liang BC, Shi ZY, Li XY, Li CW, Shi XL. Weak cation exchange magnetic beads coupled with matrix-assisted laser desorption ionization-time of flight-mass spectrometry in screening serum protein markers in osteopenia. Springerplus. 2016;5:679. doi: 10.1186/s40064-016-2276-4. [DOI] [PMC free article] [PubMed] [Google Scholar]
- 13.Greenblatt MB, Tsai JN, Wein MN. Bone turnover markers in the diagnosis and monitoring of metabolic bone disease. Clin Chem. 2017;63:464–74. doi: 10.1373/clinchem.2016.259085. [DOI] [PMC free article] [PubMed] [Google Scholar]
- 14.Abdolalipour S, Mirghafourvand M, Mobasseri M, Mohammad-Alizadeh S, Ostadrahimi A, Dolatkhah N, et al. Assessment of primary osteoporosis status in postmenopausal women of Tabriz and effect of three interventions (Curcumin-nanomicelles, Nigella sativa oil, and Curcumin-nanomicelles & Nigella sativa oil soft capsules) on cellular- molecular and clinical outcomes: A study protocol. IJWHR. 2021;9:3–10. [Google Scholar]
- 15.Bartl R. Epidmiology of Oeteoporosis. 1st ed. Switzerland: Springer; 2017. pp. 105–8. [Google Scholar]
- 16.Klibanski A, Adams-Campbell L, Bassford T, Blair SN, Boden SD, Dickersin K, et al. Osteoporosis prevention, diagnosis, and therapy. JAMA. 2001;285:785–95. doi: 10.1001/jama.285.6.785. [DOI] [PubMed] [Google Scholar]
- 17.Committee IR. Guidelines for Data Processing and Analysis of the International Physical Activity Questionnaire (IPAQ)-Short and Long Forms. 2005. Available from: http://wwwipaqkise/scoringpdf . Last accessed on 2023 Apr 01.
- 18.Salam S, Gallagher O, Gossiel F, Paggiosi M, Khwaja A, Eastell R. Diagnostic accuracy of biomarkers and imaging for bone turnover in renal osteodystrophy. J Am Soc Nephrol. 2018;29:1557–65. doi: 10.1681/ASN.2017050584. [DOI] [PMC free article] [PubMed] [Google Scholar]
- 19.McCormick RK. Osteoporosis: Integrating biomarkers and other diagnostic correlates into the management of bone fragility. Altern Med Rev. 2007;12:113–45. [PubMed] [Google Scholar]
- 20.Shetty S, Kapoor N, Bondu JD, Thomas N, Paul TV. Bone turnover markers: Emerging tool in the management of osteoporosis. Indian J Endocrinol Metab. 2016;20:846–52. doi: 10.4103/2230-8210.192914. [DOI] [PMC free article] [PubMed] [Google Scholar]
- 21.De Leo V, Ditto A, la Marca A, Lanzetta D, Massafra C, Morgante G. Bone mineral density and biochemical markers of bone turnover in peri- and postmenopausal women. Calcif Tissue Int. 2000;66:263–7. doi: 10.1007/s002230010053. [DOI] [PubMed] [Google Scholar]
- 22.Mederle OA, Balas M, Ioanoviciu SD, Gurban CV, Tudor A, Borza C. Correlations between bone turnover markers, serum magnesium and bone mass density in postmenopausal osteoporosis. Clin Interv Aging. 2018;13:1383–9. doi: 10.2147/CIA.S170111. [DOI] [PMC free article] [PubMed] [Google Scholar]
- 23.Al-Daghri NM, Yakout S, Al-Shehri E, Al-Fawaz H, Aljohani N, Al-Saleh Y. Inflammatory and bone turnover markers in relation to PTH and vitamin D status among Saudi postmenopausal women with and without osteoporosis. Int J Clin Exp Med. 2014;7:2812–9. [PMC free article] [PubMed] [Google Scholar]
- 24.Kharroubi A, Saba E, Smoom R, Bader K, Darwish H. Serum 25-hydroxyvitamin D and bone turnover markers in Palestinian postmenopausal osteoporosis and normal women. Arch Osteoporos. 2017;12:13. doi: 10.1007/s11657-017-0306-7. [DOI] [PMC free article] [PubMed] [Google Scholar]
- 25.Chan GM, Riandini T, Ng SH, Goh SY, Tan CS, Tai ES, et al. Role of fat and bone biomarkers in the relationship between ethnicity and bone mineral density in older men. Calcif Tissue Int. 2018;102:64–72. doi: 10.1007/s00223-017-0342-8. [DOI] [PMC free article] [PubMed] [Google Scholar]
- 26.Fisher A, Fisher L, Srikusalanukul W, Smith PN. Bone turnover status: Classification model and clinical implications. Int J Med Sci. 2018;15:323–38. doi: 10.7150/ijms.22747. [DOI] [PMC free article] [PubMed] [Google Scholar]
- 27.Teng X, Wei L, Han L, Min D, Du Y. Establishment of a serological molecular model for the early diagnosis and progression monitoring of bone metastasis in lung cancer. BMC Cancer. 2020;20:562. doi: 10.1186/s12885-020-07046-2. [DOI] [PMC free article] [PubMed] [Google Scholar]
- 28.Haarhaus M, Monier-Faugere MC, Magnusson P, Malluche HH. Bone alkaline phosphatase isoforms in hemodialysis patients with low versus non-low bone turnover: A diagnostic test study. Am J Kidney Dis. 2015;66:99–105. doi: 10.1053/j.ajkd.2015.02.323. [DOI] [PMC free article] [PubMed] [Google Scholar]
- 29.Garnero P, Sornay-Rendu E, Claustrat B, Delmas PD. Biochemical markers of bone turnover, endogenous hormones and the risk of fractures in postmenopausal women: The OFELY study. J Bone Miner Res. 2000;15:1526–36. doi: 10.1359/jbmr.2000.15.8.1526. [DOI] [PubMed] [Google Scholar]
- 30.Crandall CJ, Vasan S, LaCroix A, LeBoff MS, Cauley JA, Robbins JA, et al. Bone turnover markers are not associated with hip fracture risk: A case-control study in the women's health initiative. J Bone Miner Res. 2018;33:1199–208. doi: 10.1002/jbmr.3471. [DOI] [PMC free article] [PubMed] [Google Scholar]