Abstract
Hepatitis B virus (HBV) infection is a global public health concern. During chronic infection, the HBV small-surface antigen is expressed in large excess as non-infectious spherical subviral particles (SVPs), which possess strong immunogenicity. To date, attempts at understanding the structure of HBV spherical SVP have been restricted to 12–30 Å with contradictory conclusions regarding its architecture. We have used cryo-electron microscopy (cryo-EM) and 3D image reconstruction to solve the HBV spherical SVP to 6.3 Å. Here, we present an extended protocol on combining AlphaFold2 prediction with a moderate-resolution cryo-EM density map to build a reliable 3D model. This protocol utilizes multiple software packages that are routinely used in the cryo-EM community. The workflow includes 3D model prediction, model evaluation, rigid-body fitting, flexible fitting, real-space refinement, model validation, and model adjustment. Finally, the described protocol can also be applied to high-resolution cryo-EM datasets (2–4 Å).
Keywords: HBV, HBsAg, SVP, Cryo-EM, AlphaFold2, Model building
Background
Hepatitis B surface antigen (HBsAg) is both a constituent of the viral envelope and a well-established serological marker for hepatitis B virus (HBV) infection. It exists in three forms (S stands for small, M for middle, and L for large) that share identical C-termini but different N-termini due to in-frame translation from different start codons. Naturally, all three types of HBsAg are incorporated into the envelope of virions in various amounts. Additionally, HBsAg can assemble into non-infectious subviral particles (SVP), either of filamentous or spherical morphology (Heermann et al., 1984; Ganem and Prince, 2004; Gerlich, 2013). The abundance of spherical SVP in hepatitis B carriers is expected to be 1,000–10,000 times higher than that of infectious virions. Despite this, the role of this large surplus of spherical SVP is unknown (Bruns et al., 1998; Chai et al., 2008; Gerlich, 2013; Hu and Liu, 2017). Among these particles, the S-HBsAg is the most abundant protein constituent.
The HBV SVP has many biomedical applications. It is currently used in a licensed vaccine for preventing hepatitis B infection in newborns. When inserted with a foreign antigenic epitope, the chimeric SVP becomes a platform to induce immune response against medically relevant sequences. This method has been used in the development of the malaria vaccine (Guerra Mendoza et al., 2019; Schuerman, 2019; Ho et al., 2020). Furthermore, HBsAg and SVP also possess immunoinhibitory functions (Fang et al., 2015; S. Liu et al., 2015; Tout et al., 2018; Ho et al., 2020; Kim et al., 2020; Megahed et al., 2020). Recently, a new antiviral strategy involving blocking of the assembly and release of SVPs was found to achieve functional control of HBV infection (Mijočević et al., 2019; Vaillant, 2019). Despite having many roles in biomedical applications and hepatitis B infection, there is no detailed structural information on HBsAg or how it assembles into SVP.
To understand the structural relationship between HBsAg and SVP, we purified spherical SVP from patient serum and investigated the structure using cryo-EM. Since the purification steps and cryo-EM structural determination were described elsewhere (H. Liu et al., 2022), this protocol focuses on the procedure for building the atomic model for S-HBsAg by a combination of AlphaFold2 prediction and a 6.3 Å cryo-EM density map of the spherical SVP from HBV genotype E (H. Liu et al., 2022). We began by using AlphaFold2 to predict the 3D models from HBV S-HBsAg sequence. We then evaluated the result of the prediction using a cryo-EM density map and selected the best model for additional analysis. Finally, we combined knowledge from the literature and used flexible fitting to obtain a 3D model for S-HBsAg. This process utilized AlphaFold2, UCSF ChimeraX (Pettersen et al., 2021), ISOLDE (Croll, 2018), PHENIX, MolProbity (Chen et al., 2010), and Coot to generate the Protein Data Bank (PDB) model and to validate the result. This protocol was used to build a 3D model into a moderate-resolution cryo-EM density map (5–7 Å); it can also be applied to experimental data when a high-resolution cryo-EM map (2–4 Å) is available.
Materials and reagents
EMD-26117 (https://www.ebi.ac.uk/emdb/EMD-26117)
HBV S protein sequence (https://www.ncbi.nlm.nih.gov/protein/1035343445)
Equipment
Linux workstation with dedicated GPU or MacBook (with 64 GB RAM).
Software
AlphaFold2 via ColabFold v1.5.2 (https://colab.research.google.com/github/sokrypton/ColabFold/blob/main/AlphaFold2.ipynb)
UCSF ChimeraX v1.5 (https://www.cgl.ucsf.edu/chimerax/)
ISOLDE (https://isolde.cimr.cam.ac.uk/)
PHENIX v1.20.1-4487 (https://phenix-online.org/)
MolProbity (http://molprobity.biochem.duke.edu/)
-
Coot v0.9.8.2 (https://www2.mrc-lmb.cam.ac.uk/personal/pemsley/coot/)
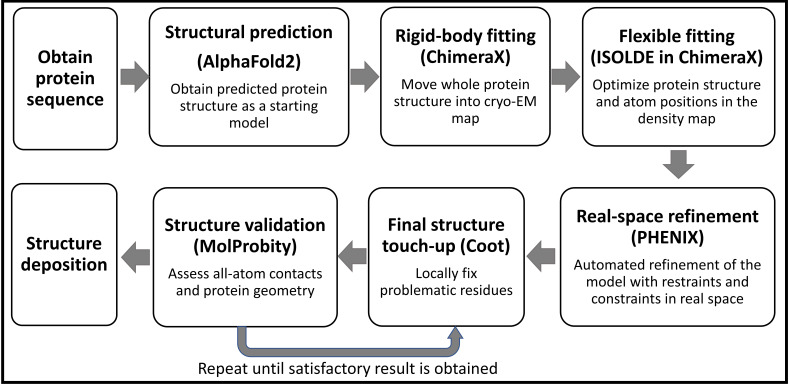
Note: The selection of software for structural modeling is largely a matter of personal preference. ISOLDE, PHENIX, and Coot can all be used for flexible structure modeling. ISOLDE and Coot provide direct visualization during the modeling process, allowing users to make objective decisions by dragging atoms or residues to specific locations. PHENIX, on the other hand, refines structures based on comprehensive checkups. All software can be used individually or in combination for this purpose. However, we have found that using ISOLDE at the beginning provides quick access to make large structural changes, fix Ramachandran and rotamer outliers, and reduce clashes. Additionally, ISOLDE allows users to "pin" part of the protein model at the original location while making new changes to another part of the structure, which is particularly helpful for regions where the density is ambiguous, such as flexible loops. Once an initial model is generated, PHENIX can be used to fine-tune the structure and fix structural outliers, such as residues with poor bond lengths and angles. Finally, we use Coot in a back-and-forth manner with information obtained from MolProbity to refine the final structure until we achieve a satisfactory result (Figure 1).
Figure 1. Protocol workflow.
Procedure
-
Alphafold2 prediction
-
AlphaFold2 (Jumper et al., 2021) is available in the ColabFold advanced notebook format at the following website (Mirdita et al., 2022) for easy access: https://colab.research.google.com/github/sokrypton/ColabFold/blob/main/AlphaFold2.ipynb.
Note: In this protocol, we used the newest version of ColabFold. The original paper was run using version v1.1.
-
The full surface protein sequence of HBV (residues 1–399) can be accessed at NCBI GenBank with Protein ID: ANJ02935. The S-HBsAg protein sequence starts at position 174–399.
Note: You can prepare the partial sequence using the following steps:
Bold font is either input field or button in the software; bold and italic font is the input command.
Go to https://www.ncbi.nlm.nih.gov/protein/ANJ02935 to obtain the HBV large S protein sequence.
Click the FASTA link and copy the sequence.
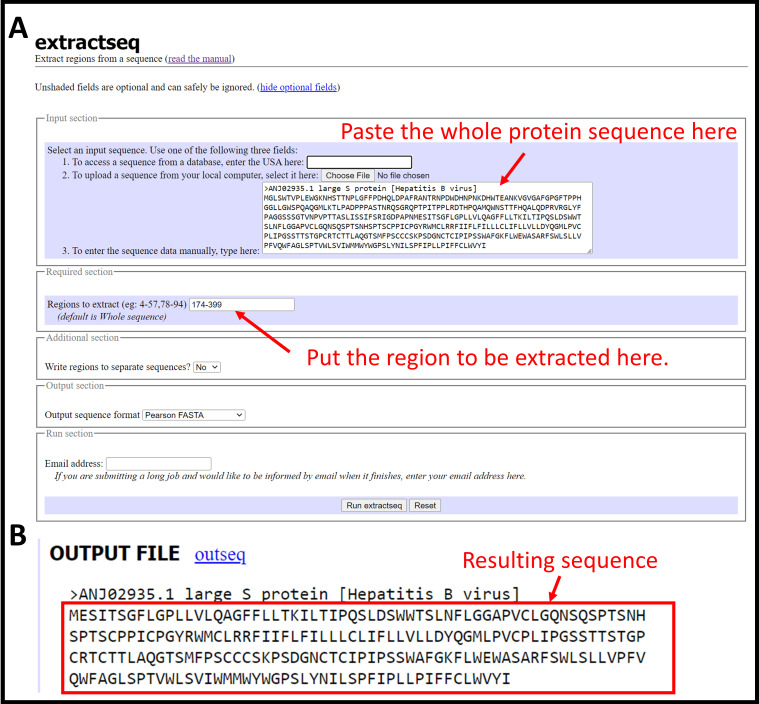
Go to https://www.bioinformatics.nl/cgi-bin/emboss/extractseq to extract partial sequence.
Paste the copied protein sequence under Input section (Figure 2A).
Go to Required section and input 174-399 under Regions to extract (Figure 2A).
Click the Run extractseq button at the bottom.
Copy only the sequence part for the next step (Figure 2B).
-
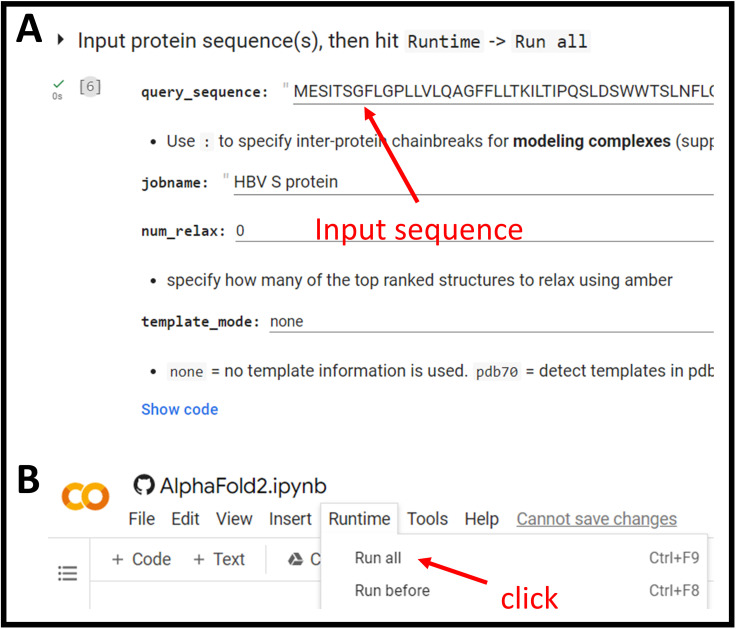
Paste the S-HBsAg sequence into query_sequence field at the top region of the page (Figure 3A).
Notes:
For this prediction, we did not consider the oligomeric state of S-HBsAg.
The name for this prediction can be added at the jobname field.
We used only default options in the dropdown menus through the ColabFold notebook.
We did not use template (template_mode: none) or amber (unchecked).
-
From the menu bar at the top, click Runtime > Run All to initiate the prediction (Figure 3B).
Note: You will see a warning message saying that this notebook was not authored by Google. Please click Run anyway to continue.
-
Once the job finishes, download the results (five output models) in a .zip format and inspect them in ChimeraX.
Notes:
Note that the predicted 3D model is displayed under Display 3D structure section. It shows the highest ranked model by default and can be changed from the dropdown menu rank_num. Areas of the output models predicted with poor confidence are colored in red; areas with high confidence are shown in blue.
All predicted 3D models consist of four helical regions: two long straight helices, one V-shaped helix, and one U-shaped helix. In these five predicted models, the helical regions all have higher confidence. The loop regions that connect two helices were more disordered (Figure S4 in H. Liu et al., 2022).
Because ColabFold webpage can only display one model at a time, we used ChimeraX to visualize all models at once to explicitly compare protein regions that are variant or consistent across them all. Combined with consideration of local confidence scores, this information can aid model interpretation following prediction (Figure 4).
In ChimeraX, we used matchmaker to quickly align all five models together. We found that helical regions had similar structures between all models. On the other hand, the loop region that connects preceding and following helices had distinct connecting angles from model to model. As a result, the secondary structural elements were virtually identical in five predicted models, but the tertiary structural organizations were different.
Proceed to build and refine the best model using a combination of Coot, PHENIX, and ISOLDE.
-
-
Model evaluation and rigid-body fitting
Select one model that has the highest similarity to the subunit within the cryo-EM density map of HBV spherical SVP. As the cryo-EM map was refined to 6.3 Å, the helical regions in the cryo-EM map are identifiable by rendering the map at the higher density level. Then, compare the predicted PDB model to the high-density region of the cryo-EM map and select the best model to proceed. To facilitate this process, segment a portion of the density map that contains a unique structural feature (Figure S3 in H. Liu et al., 2022).
Open ChimeraX and open the cryo-EM density map of HBV SVP via command: open emdb:26117 (Figure S2E in H. Liu et al., 2022).
Under Volume Viewer, change the step to 1 and the density Level to 0.013 to render the whole structure.
At the menu bar, select Tool > Volume > Hide Dust.
-
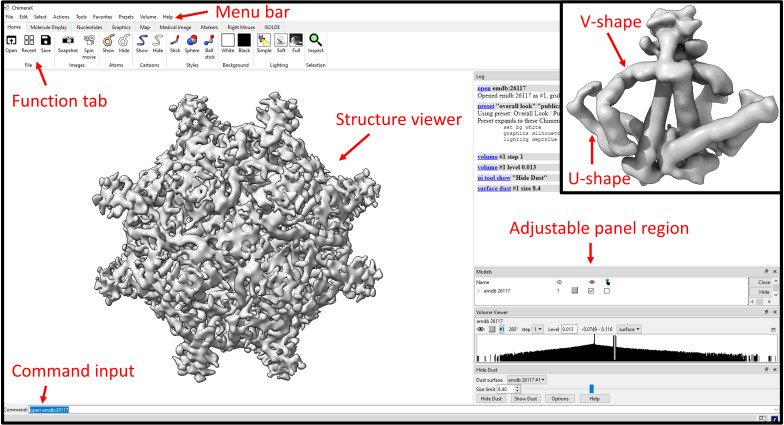
Set Size limit to 8.4 and click Hide Dust (Figure 5).
Notes:
Inspect the whole particle structure by rotating the map at different angles.
We observed 24 protrusions projected from the particle surface.
For this protocol, we changed the display to a white background. You can do this by going to the menu Presets > Publication 1. We also changed the display to a soft lighting by going to the Graphics tab and clicking Soft.
-
Under Volume Viewer, change the density level to 0.021.
Notes:
Inspect the volume to identify the repeating density (subunits).
We found 48 V-shaped densities arranged in parallel on the surface of the particle. At one end of the V-shaped density, it connects to a curved U-shaped density. At the other end of the V-shaped density, it is linked to a long, straight helical density. Following the straight density is another helical density, tilted in a distinct direction. The four helical densities identified from the cryo-EM density map resembles the structural organization we observed earlier in the AlphaFold2 prediction.
By changing the density level back-and-forth, we also observed two V-shaped densities connected to one protrusion.
Taking it all together, we found four connected helical densities organized into one repeated element. Two of the elements connected to one protrusion, indicating that this may be a dimer. In total, 48 repeated elements assembled into a spherical SVP.
If the repeating unit in the structure can be identified, the segmentation tool can be used to isolate only one subunit from the cryo-EM map. This can be done by selecting the menu Volume > Segment Map. In this protocol, we segmented a dimer as the density was unable to be separated to a single subunit state (Figure 5, inset).
-
Manually move all five predicted PDB models into the corresponding region in the cryo-EM map using the Right Mouse function.
Notes:
We used the V-shaped density as the marker and moved the PDB model into the density.
Move one model at a time using Move model and Rotate model under Right Mouse tab.
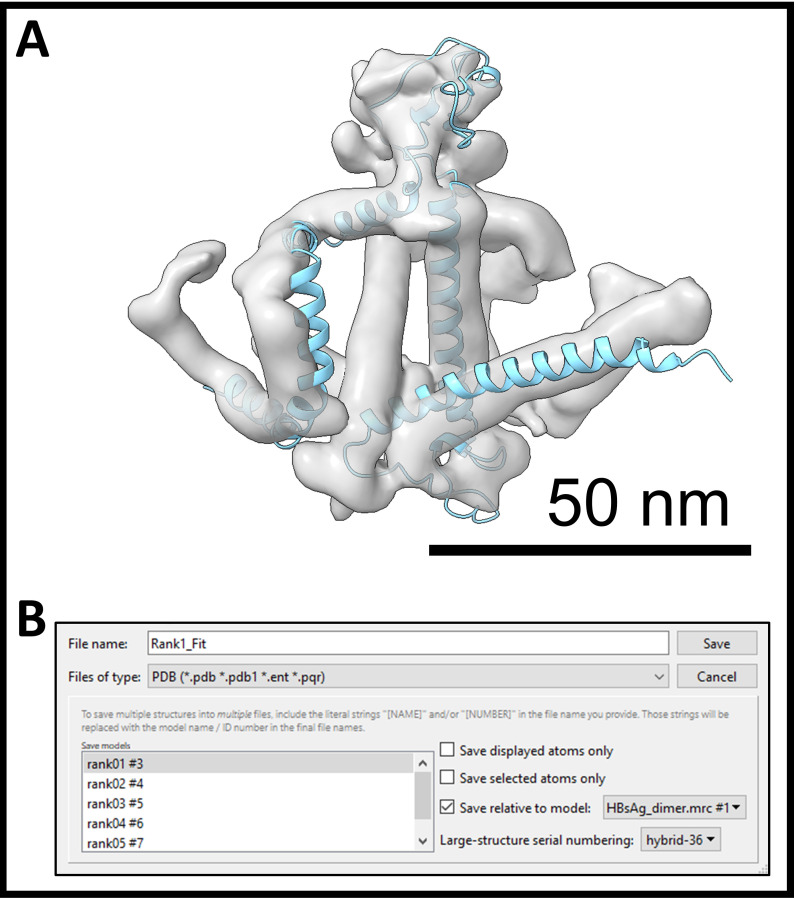
When the V-shape helix was roughly covered by the V-shape density from the cryo-EM map, we used an auto-function in ChimeraX to get better precision. This was done by using Tools > Volume Data > Fit in Map function (see result in Figure 6A).
-
Select each model from the drop-down menu and click Fit button.
Notes:
Steps B6–B8 are called rigid-body fitting.
Not every model can fit into the cryo-EM map very well.
Inspect the fitting result and pick the best fitting model for the subsequent model building.
-
Save the best PDB model in relation to the cryo-EM map. Go to menu File > Save… (Figure 6B).Notes:
Give a name for the PDB model at File name field.
Select PDB from the Files of type drop-down menu.
Select only the best model in the Save model list.
Check Save relative to model and select the cryo-EM map from the drop-down menu (Figure 6B).
Turn off other models and level only the best fitting model.
-
Flexible fitting using ISOLDE in ChimeraX (v1.5)
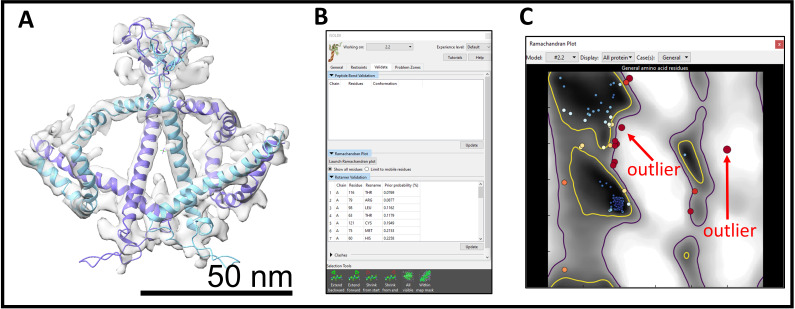
Once the model is selected and moved to the corresponding location of the cryo-EM map using rigid-body movement, work on the regions of the PDB model that fall outside the cryo-EM density using flexible fitting. The goal is to make the backbone of the protein fit into the cryo-EM density, as shown on Figure 7A.
At the menu, select Tools > General > ISOLDE.
At the Working on field at the top of the window, make sure the best fitting model from above is selected.
At the General tab, under Add map(s) to working model, select the cryo-EM map in the drop-down menu of From loaded volume. This will associate the PDB model to the cryo-EM map and render the map with mesh density around the PDB model.
At Mask and spotlight settings, change Spotlight radius and put 15.0.
Add hydrogens to the PDB by typing addh at the Command field. Output will show that H has been added. Hydrogens can then be hidden by using command hide HC for ease of visualization.
Use the mouse to select one of the helical regions in the PDB model to start with.
Initialize flexible fitting of the model into the map by clicking Start simulation (blue triangle) at the ISOLDE tab in the ChimeraX main window or run the command isolde sim start sel.
Once the simulation starts, use the right mouse button to drag the selected residues into the cryo-EM density. If this does not work, click Tug selection at the ISOLDE tab and use the right mouse button to drag again.
-
When a satisfactory result is obtained, at Simulation Runtime drop the temperature to 0 K for a few seconds to allow the adjusted structure to settle at the thermal equilibrium and click at the green Stop button. Do this for all the remaining regions of the structure.
Notes:
If a window pops up regarding specifying the disulfide bonds in the metadata when selecting the best PDB model to work with, please select No as we do not have sufficient resolution to resolve the disulfide bond.
For this protocol, keep most parameters unchanged. If customized changes are desired, please refer to each parameter on the ISOLDE website.
If there is a pop-up error stating that there are too many clashes, stop simulation (red stop button to undo changes) and fix individual residues.
If working with helices, it is important to restrain the selection residues to alpha helix. This can be done under the Restraints tab at the Secondary Structure section.
Move the residues outside the cryo-EM map into the density by right-clicking. You can tug just a few residues or the whole selected region.
At the moderate resolution (5–7 Å), only a few residues with bulky side chains can be used as anchors for modeling the rest of residues with higher confidence. Reference from the literature regarding specific mutations or important interactions should be considered at this point to generate a reliable model (Figure S7B in H. Liu et al., 2022).
During modeling, it may be helpful to “pin” the antigenic and cytosolic loops at fixed locations. Because of the low local resolution and high flexibility at these two loop regions, we were unable to model the interactions confidently.
-
Under Validate tab, try to fix Peptide Bond geometry, Ramachandran Plot, Rotamers, and Clashes (Figure 7B).
Notes:
For Peptide bond geometry, click on the residue in the list, start the simulation, and change it under Rebuild tab or move/rotate it.
For Ramachandran Plot, click on the problematic residue in the plot for a close-up view. Each residue is represented by a circle (Figure 7C). The problematic residues are colored from white (allowed region) to red (outlier). Start the simulation; most times, this will fix the residue. If not, try to move or rotate the residue to fix it. Fix as many outliers as possible.
For Rotamers, work with the outlier residue (red color residue) in the list first. Start the simulation, go to ISOLDE tab, and click at the Preview next icon to change the rotamer. For bulky side chain, make sure the side chain is still inside the cryo-EM density and that it does not cause a new clash with neighboring residues after you change it. Click Set coords once the result is satisfying. The residues in red (outliers) should all be corrected. Others (disfavored residues) should also be corrected, as much as possible. Clicking the Update button will refresh the list.
For Clashes, start with the biggest clashes first by clicking on the residue in the list and inspecting the region of the residue that is involved in the clash. If the clash is caused by the side chain, change it to other possible rotamers. If the clash is involved in the carbon backbone, move or rotate the residue to resolve the clash.
At moderate resolution, we can only fix clashes at the regions that have good cryo-EM densities, e.g., the helical region. At the loop or disordered regions, it becomes more difficult to fix clashes; thus, we did not attempt to fix clashes at these regions of the model.
Prioritize fixing clashes when going in between Rotamers and Clashes.
Once the residue is successfully corrected, click Update list to remove it from the list.
Note that some bond lengths and bond angles in ISOLDE cannot be fully corrected. They need to be refined or fixed in the next steps.
Save the corrected PDB model into a new file.
-
Because the building block of spherical HBV SVP is a dimer, we should take the PDB model generated from the steps above and flexibly fit it into the neighboring subunit that forms the same protrusion.Notes:
Open the file saved in step C11.
Move the model into the density of the neighboring subunit using rigid-body fitting.
Flexibly adjust the model with ISOLDE.
Combine two PDB models into one file by using command combine #PDB1 #PDB2 (PDB1 should be the ID number for the PDB in step C11 and PDB2 should be the ID number from this step).
-
Real-space refinement of flexible fitting result using PHENIX (v1.20.1-4487)
Even though it is possible to manually adjust the model using ISOLDE in ChimeraX, it is better to further refine and optimize the results using the algorithm that considers the chemical principle. To do so, use PHENIX and supply the PDB model (dimer) and the cryo-EM map. For the best results, the segmented dimer cryo-EM map should be used here. To prepare files for PHENIX and Coot, the coordinate system needs to be adjusted.
In ChimeraX, open both the cryo-EM map (from section B) and the combined PDB file (from section C).
At the menu, go to Volume > Map Coordinates. Change Original index to 0. The cryo-EM map should be off from the PDB model.
Perform rigid-body fitting by moving the PDB model into the cryo-EM map. Be cautious and make sure that the subunit is correctly fit into the density. Once this is done, save the PDB model into a new file.
Start PHENIX, add a New project, name Project ID, and pick a folder for Project directory. The sequence in FASTA format can also be added, but it is not required.
Go to Cryo-EM: Map analysis, symmetry, manipulation task at the right-hand side, click Refinement, and select Real-space refinement.
-
Specify Job title.
Note that it does not have to be unique, but new files will be created using this as part of the file name.
At Input/Output tab, click Add file button to add files (PDB model and cryo-EM map). Check the box for ignore symmetry conflicts and enter map resolution 5.5 here.
-
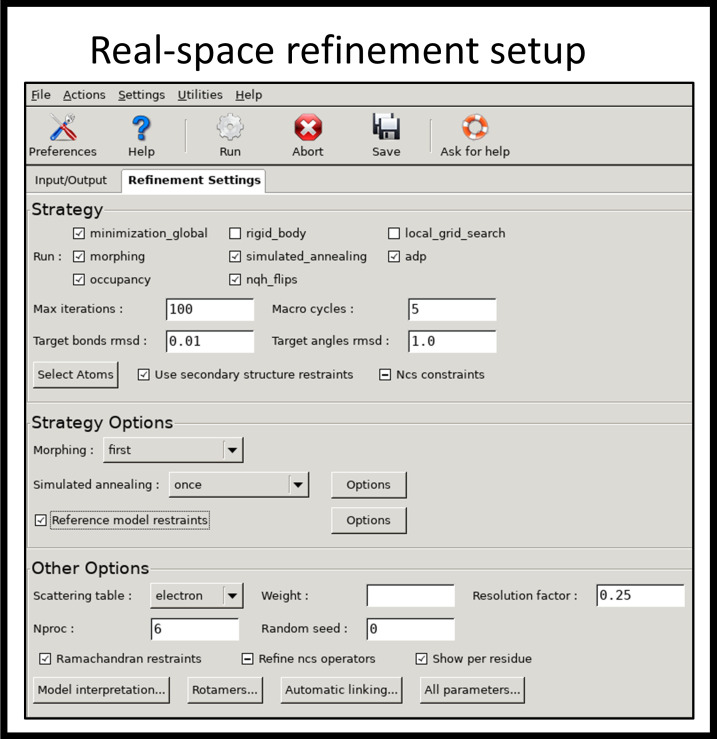
In Refinement Settings, make sure that minimization_global, morphing, simulated_annealing, adp, occupancy, and ngh_flips are selected. Hit Run (Figure 8).
Notes:
Rigid_body and local_grid_search can be unchecked to save time as the model was fitted to an approximate location in the earlier steps.
Other parameters can be used as default or changed to tune up the process.
If running with multiple CPU, specify the number of processors in Nproc box under Other Options.
Completed files have “real_space_refined” as a suffix in .pdb format.
Any bad bond length and angle should be corrected here.
-
MolProbity (v4.5, http://molprobity.biochem.duke.edu/)
We used MolProbity to validate the modeling result. Although PHENIX has a built-in validation tool from MolProbity, we found that the report created from the MolProbity website was better illustrated and allowed easy sorting.
Open a web browser and go to the MolProbity website at http://molprobity.biochem.duke.edu/.
Use Choose File to upload the resulting PDB model from PHENIX. Select PDB coords for the Type and click Upload.
-
Select Add hydrogens and choose the Asn/Gln/His flips method. Select Electron-cloud x-H for x-H bond-length and click Start adding H.
Notes:
If residue flips are suggested, a list of changes are shown. Check the explanation and the before and after flip result to decide if the changes are leading to a better result.
If changes are made here, click Regenerate H, applying only selected flips.
A new corrected PDB file will be downloaded.
Select Analyze all-atom contacts and geometry.
Use default options and click Run programs to perform these analyses.
-
A summary of data statistics will be shown. Click at Multi-criterion chart to see a full list.
Notes:
The goal is to fix as many outliers in the residues as possible. For loop and disordered regions, it should be difficult. On the other hand, if the cryo-EM density map can be resolved to better than 3 Å, all statistics in the table should be able to correct to the green color.
After ISOLDE and PHENIX, we should see only some residues remaining to be corrected. We will move to Coot to fix problematic residues.
-
Coot (v0.9.8.2)
-
Go to File > Open Coordinates and Open Map to open the PDB model and cryo-EM map, respectively.
Notes:
Read the PDB model with added hydrogen atoms.
Click the Display Manager button beneath the menu bar to change the display settings. We normally colored each chain in the PDB model with different colors by selecting Bonds (Colour by Chain) in the drop-down menu in the Molecules section. Add the plasmids into competent cells.
Go to the right-hand side menu bar and select Refine/Regularize Control… (R/RC) to open a dialog window. Select Use Torsion Restraints and Ramachandran Restrains under For Regularization and Refinement. Click Estimate to calculate the Weight Matrix for cryo-EM map. Click OK to finish.
-
For Ramachandran outliers, go to Validate > Ramachandran plot. Identify and correct all outliers in the plot.
Notes:
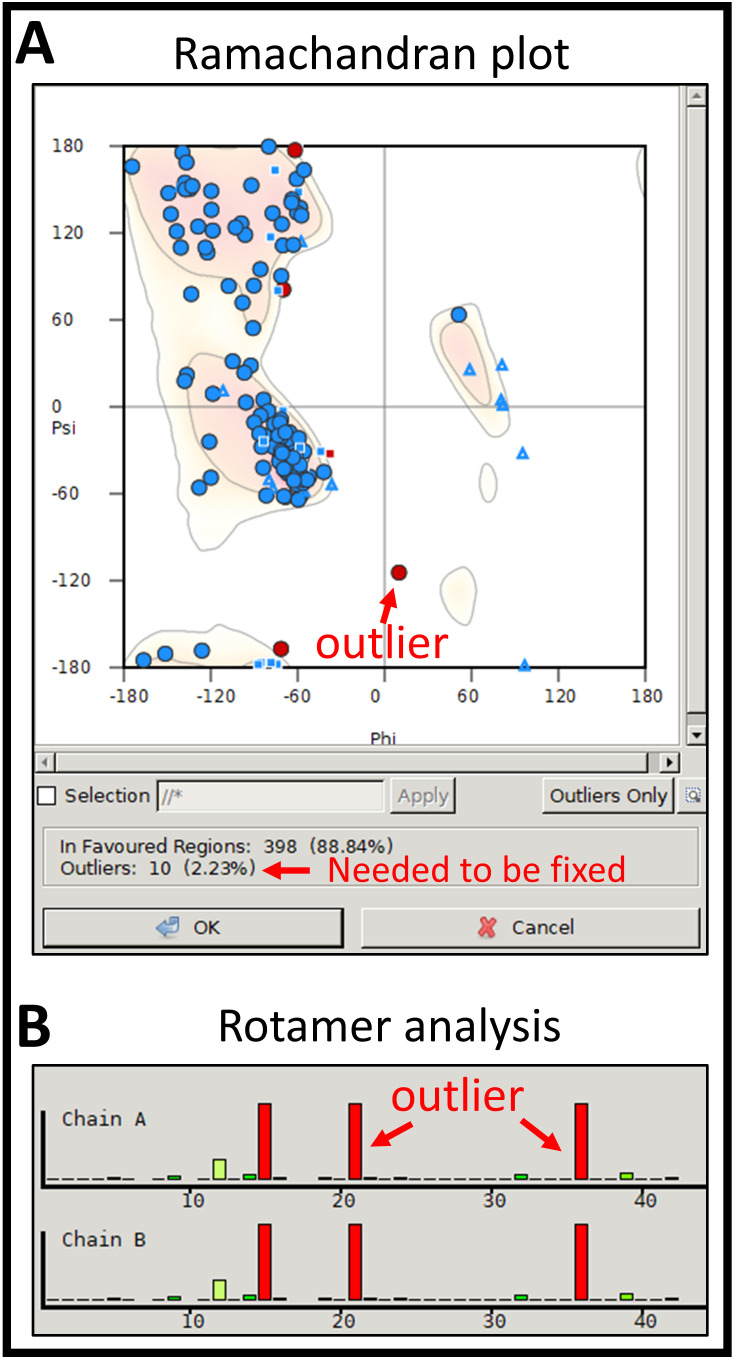
Look at the Ramachandran plot to identify the outliers; they are colored in red (Figure 9A).
Select the outlier by clicking on the red colored symbol. The viewer will then bring a close-up view at the selected residues.
Fix the outlier residue by selecting one preceding and one following residue by using Real Space Refine Zone at the right-hand side menu bar. As an example, if Ile 68 is an outlier, first click Real Space Refine Zone button and then click at Pro 67 and Cys 69.
A refinement result window pops up after it attempts to refine these residues. Check the refinement result at the top of the pop-up window. If all criteria are green, accept the refinement result. If one or more categories are red or yellow, reject refinement and change it again.
On some occasions, clicking Flip This Peptide or Flip Next Peptide in the pop-up window can resolve the problem.
Use the list from MolProbity to easily go through the unfavored residues as well.
For HBV SVP, we attempted to fix the helical region only.
For Bond lengths and Bond angles outliers identified in MolProbity, depending on the location of the bond, these can be corrected by using Read Space Refine Zone and clicking at the same residue twice to fix it. In some scenarios, it requires selecting preceding or following residues to fix it.
-
For Rotamer outliers, go to Validate > Rotamer Analysis and compare with MolProbity results (Figure 9B). Click on the poor rotamer residue (red and orange color) in the histogram plot for a close-up view in the 3D model. Click on Rotamers… at the right-hand side menu bar, click on the desired residue, and toggle between different rotamers. Select the rotamer closest in structure to the original conformation or within the cryo-EM density.
Notes:
Do not cause a new clash to neighboring atoms.
Continue until all red and orange rotamers have been repaired in Unusual Rotamer Graphs (histogram plot) window.
Save intermediate PDBs often without overwriting older versions.
Repeatedly alternate between Coot and MolProbity until all categories assessed in MolProbity validation appear green.
At the intermediate resolution, the information is insufficient to build a reliable atomic model directly from the cryo-EM density. Therefore, the side chain orientation and the atom locations were adjusted locally according to the published literature on the protein–protein interactions at this step.
Download the final PDB model without hydrogen atoms for PDB deposition.
-
Figure 2. Using extractseq to extract region of interest from the full-length protein sequence.
Protein sequence of interest can be obtained at NCBI protein database. (A) Copy the full-length protein sequence in the FASTA format and paste to extractseq web server. Input the region of interest to extract in the field. (B) Result from the extractseq.
Figure 3. Structural prediction using Alphafold2.
Alphafold2 prediction can be accessed via ColabFold notebook. (A) The necessary fields to be filled for running Alphafold2 structure prediction. (B) Clicking at Run all will execute all steps automatically. Detailed instructions can be found at the bottom of the notebook.
Figure 4. Inspection of the Alphafold2 results.
Structural prediction results showed that all models contain similar structural features: four helical regions. Helix 1 and helix 2 are straight, helix 3 has a V shape, and helix 4 has a U shape. The loop regions connected between helices showed substantial differences in all models.
Figure 5. Structural visualization and analysis in ChimeraX.
Hepatitis B virus (HBV) spherical subviral particle rendered in ChimeraX. Inset shows a low pass filtered, computationally segmented dimer density.
Figure 6. Rigid-body fitting in ChimeraX.
(A) Result of rigid-body fitting using the best predicted model into the cryo-EM density map. (B) ChimeraX window saving the resulting model into a new file.
Figure 7. Flexible fitting in ISOLDE.
(A) The result of flexible fitting of two subunits into a segmented dimer density. (B) Validation window that is used to fix problematic residues. (C) Ramachandran plot of the protein model.
Figure 8. Setup window of PHENIX real-space refinement.
Figure 9. Validation tools in Coot.
(A) Ramachandran plot shows outliers and the summary of all residues. (B) Rotamer analysis shows outlier residues (red color) and residues in the allowed region.
Acknowledgments
The research was supported by the startup fund from The Pennsylvania State University College of Medicine, NIH grant R21-AI1641191, and R37AI043453. We thank Dr. A. Zlotnick for insightful discussion. This protocol was derived from the original research study published by H. Liu et al. (2022).
Competing interests
The authors declare no competing interests.
Citation
Readers should cite both the Bio-protocol article and the original research article where this protocol was used.
Q&A
Post your question about this protocol in Q&A and get help from the authors of the protocol and some of its users.
References
- 1.Bruns M., Miska S., Chassot S. and Will H.(1998). Enhancement of hepatitis B virus infection by noninfectious subviral particles. J Virol 72(2): 1462-1468. [DOI] [PMC free article] [PubMed] [Google Scholar]
- 2.Chai N., Chang H. E., Nicolas E., Han Z., Jarnik M. and Taylor J.(2008). Properties of subviral particles of hepatitis B virus. J Virol 82(16): 7812-7817. [DOI] [PMC free article] [PubMed] [Google Scholar]
- 3.Chen V. B., Arendall W. B., Headd J. J., Keedy D. A., Immormino R. M., Kapral G. J., Murray L. W., Richardson J. S. and Richardson D. C.(2010). MolProbity: all-atom structure validation for macromolecular crystallography. Acta Crystallogr D Biol Crystallogr 1):12-21. [DOI] [PMC free article] [PubMed] [Google Scholar]
- 4.Croll T. I.(2018). ISOLDE: a physically realistic environment for model building into low-resolution electron-density maps. Acta Crystallogr D Struct Biol 6): 519-530. [DOI] [PMC free article] [PubMed] [Google Scholar]
- 5.Fang Z., Li J., Yu X., Zhang D., Ren G., Shi B., Wang C., Kosinska A. D., Wang S., Zhou X., et al.(2015). Polarization of Monocytic Myeloid-Derived Suppressor Cells by Hepatitis B Surface Antigen Is Mediated via ERK/IL-6/STAT3 Signaling Feedback and Restrains the Activation of T Cells in Chronic Hepatitis B Virus Infection. J Immunol 195(10): 4873-4883. [DOI] [PubMed] [Google Scholar]
- 6.Ganem D. and Prince A. M.(2004). Hepatitis B virus infection--natural history and clinical consequences. N Engl J Med 350(11): 1118-1129. [DOI] [PubMed] [Google Scholar]
- 7.Gerlich W. H.(2013). Medical virology of hepatitis B: how it began and where we are now. Virol J 10: 239. [DOI] [PMC free article] [PubMed] [Google Scholar]
- 8.Guerra Mendoza Y., Garric E., Leach A., Lievens M., Ofori-Anyinam O., Pirçon J. Y., Stegmann J. U., Vandoolaeghe P., Otieno L., Otieno W., et al.(2019). Safety profile of the RTS,S/AS01 malaria vaccine in infants and children: additional data from a phase III randomized controlled trial in sub-Saharan Africa. Hum Vaccin Immunother 15(10): 2386-2398. [DOI] [PMC free article] [PubMed] [Google Scholar]
- 9.Heermann K. H., Goldmann U., Schwartz W., Seyffarth T., Baumgarten H. and Gerlich W. H.(1984). Large surface proteins of hepatitis B virus containing the pre-s sequence. J Virol 52(2): 396-402. [DOI] [PMC free article] [PubMed] [Google Scholar]
- 10.Ho J. K., Jeevan-Raj B. and Netter H. J.(2020). Hepatitis B Virus(HBV) Subviral Particles as Protective Vaccines and Vaccine Platforms. Viruses 12(2): 126. [DOI] [PMC free article] [PubMed] [Google Scholar]
- 11.Hu J. and Liu K.(2017). Complete and Incomplete Hepatitis B Virus Particles: Formation, Function, and Application. Viruses 9(3): 56. [DOI] [PMC free article] [PubMed] [Google Scholar]
- 12.Jumper J., Evans R., Pritzel A., Green T., Figurnov M., Ronneberger O., Tunyasuvunakool K., Bates R., Žídek A., Potapenko A., et al.(2021). Highly accurate protein structure prediction with AlphaFold. Nature 596(7873): 583-589. [DOI] [PMC free article] [PubMed] [Google Scholar]
- 13.Kim J. H., Ghosh A., Ayithan N., Romani S., Khanam A., Park J. J., Rijnbrand R., Tang L., Sofia M. J., Kottilil S., et al.(2020). Publisher Correction: Circulating serum HBsAg level is a biomarker for HBV-specific T and B cell responses in chronic hepatitis B patients. Sci Rep 10(1): 5947. [DOI] [PMC free article] [PubMed] [Google Scholar]
- 14.Liu H., Hong X., Xi J., Menne S., Hu J. and Wang J. C.(2022). Cryo-EM structures of human hepatitis B and woodchuck hepatitis virus small spherical subviral particles. Sci Adv 8(31): eabo4184. [DOI] [PMC free article] [PubMed] [Google Scholar]
- 15.Liu S., Peng N., Xie J., Hao Q., Zhang M., Zhang Y., Xia Z., Xu G., Zhao F., Wang Q., et al.(2015). Human hepatitis B virus surface and e antigens inhibit major vault protein signaling in interferon induction pathways. J Hepatol 62(5): 1015-1023. [DOI] [PubMed] [Google Scholar]
- 16.Megahed F. A. K., Zhou X. and Sun P.(2020). The Interactions between HBV and the Innate Immunity of Hepatocytes. Viruses 12(3): 285. [DOI] [PMC free article] [PubMed] [Google Scholar]
- 17.Mijočević H., Karimzadeh H., Seebach J., Usman Z., Al-Mahtab M., Bazinet M., Vaillant A. and Roggendorf M.(2019). Variants of hepatitis B virus surface antigen observed during therapy with nucleic acid polymer REP 2139-Ca have no influence on treatment outcome and its detection by diagnostic assays. J Viral Hepat 26(4): 485-495. [DOI] [PubMed] [Google Scholar]
- 18.Mirdita M., Schütze K., Moriwaki Y., Heo L., Ovchinnikov S. and Steinegger M.(2022). ColabFold: making protein folding accessible to all. Nat Methods 19(6): 679-682. [DOI] [PMC free article] [PubMed] [Google Scholar]
- 19.Pettersen E. F., Goddard T. D., Huang C. C., Meng E. C., Couch G. S., Croll T. I., Morris J. H. and Ferrin T. E.(2021). UCSF ChimeraX: Structure visualization for researchers, educators, and developers. Protein Sci 30(1): 70-82. [DOI] [PMC free article] [PubMed] [Google Scholar]
- 20.Schuerman L.(2019). RTS,S malaria vaccine could provide major public health benefits. Lancet 394(10200): 735-736. [DOI] [PubMed] [Google Scholar]
- 21.Tout I., Gomes M., Ainouze M., Marotel M., Pecoul T., Durantel D., Vaccarella S., Dubois B., Loustaud-Ratti V., Walzer T., et al.(2018). Hepatitis B Virus Blocks the CRE/CREB Complex and Prevents TLR9 Transcription and Function in Human B Cells. J Immunol 201(8): 2331-2344. [DOI] [PubMed] [Google Scholar]
- 22.Vaillant A.(2019). REP 2139: Antiviral Mechanisms and Applications in Achieving Functional Control of HBV and HDV Infection. ACS Infect Dis 5(5): 675-687. [DOI] [PubMed] [Google Scholar]


