

Abstract
Recent studies link nonalcoholic fatty liver disease (NAFLD) to an increased incidence of hepatocellular carcinoma (HCC) and extrahepatic cancers. However, prior studies were small or lacked liver histology, which remains the gold standard for staging NAFLD severity. We conducted a population-based cohort study of all adults with histologically defined NAFLD in Sweden from 1966 to 2016 (N=8,892). NAFLD was defined from prospectively recorded liver histopathology submitted to all 28 Swedish pathology departments and categorized as simple steatosis, nonfibrotic nonalcoholic steatohepatitis (NASH), noncirrhotic fibrosis, and cirrhosis. NAFLD patients were individually matched to ≤5 general population controls without NAFLD by age, sex, calendar year, and county (N=39,907). Using Cox proportional hazards modeling, we calculated multivariable adjusted hazard ratios (aHRs) and 95% confidence intervals (CIs). Over a median of 13.8 years, we documented 1,691 incident cancers among NAFLD patients and 6,733 among controls. Compared with controls, NAFLD patients had significantly increased overall cancer incidence (10.9 vs. 13.8/1,000 person-years [PYs]; difference=2.9/1,000 PYs; aHR, 1.27 [95%CI, 1.18–1.36]), driven primarily by HCC (difference=1.1/1,000 PYs; aHR, 17.08 [95%CI, 11.56–25.25]). HCC incidence rates increased monotonically across categories of simple steatosis, nonfibrotic NASH, noncirrhotic fibrosis, and cirrhosis (0.8/1,000 PYs, 1.2/1,000 PYs, 2.3/1,000 PYs, and 6.2/1,000 PYs, respectively) (Ptrend<0.01) and were further amplified by diabetes (1.2/1,000 PYs, 2.9/1,000 PYs, 7.2/1,000 PYs, and 15.7/1,000 PYs, respectively). In contrast, NAFLD was associated with modestly increased rates of pancreatic cancer, kidney/bladder cancer, and melanoma (differences=0.2/1,000 PYs, 0.1/1,000 PYs, and 0.2/1,000 PYs, respectively) but no other cancers. Compared with controls, patients with biopsy-proven NAFLD had significantly increased cancer incidence, due primarily to HCC, whereas the contribution of extrahepatic cancers was modest. Although HCC risk was highest with cirrhosis, substantial excess risk was also found with noncirrhotic fibrosis and comorbid diabetes.
Keywords: NAFLD, epidemiology, fibrosis, extrahepatic, hepatocellular carcinoma
Nonalcoholic fatty liver disease (NAFLD) represents a leading cause of chronic liver disease in the United States and Europe, affecting more than 100 million adults.(1,2) Between 20% and 33% of patients with NAFLD develop progressive nonalcoholic steatohepatitis (NASH) with fibrosis, which in turn can lead to cirrhosis, decompensated liver disease, and liver-related mortality.(3–7) More recent observational studies have also linked NAFLD to an increased risk of developing cancer.(8,9) Among patients with NAFLD, mortality rates from both hepatocellular carcinoma (HCC) and extrahepatic cancers have increased by an alarming 2% to 4% per year over the past decade.(10) In contrast, within the general population, overall cancer mortality has declined by 2% to 6% per year over the same period of time,(11–13) highlighting the need to improve our understanding of cancer risk and identify opportunities for cancer prevention among patients with NAFLD.
Evidence regarding the precise risk of cancer among patients with NAFLD is limited. Although several studies have linked NAFLD with a 4- to 8-fold higher risk of incident HCC(8,14,15) and a 2-fold higher risk of some extrahepatic cancers,(8,9,15–18) others have found null associations.(19–22) Moreover, studies have been limited either by small populations with poor generalizability or have lacked liver histology, which remains the gold standard for identifying NASH and staging NAFLD fibrosis severity. Thus, large-scale epidemiological studies leveraging liver histology are necessary to determine if cancer risks vary according to the presence and histological severity of NAFLD. Moreover, quantifying the magnitude of these risks is important for developing effective cancer prevention and screening strategies for this rapidly growing population.
We hypothesized that the excess risk of overall cancer in patients with NAFLD is driven primarily by incident HCC and that this risk increases progressively with worsening NAFLD histological severity. Thus, we constructed a nationwide cohort of all adults in Sweden with biopsy-confirmed NAFLD to examine the risk of incident hepatic and extrahepatic cancers according to the presence and histological severity of NAFLD.
Methods
Study Population and NAFLD Ascertainment
We conducted a population-based, matched cohort study using the Epidemiology Strengthened by histoPathology Reports in Sweden (ESPRESSO) cohort. ESPRESSO includes prospectively recorded liver histopathology data from all 28 Swedish pathology departments (1966–2016) and thus is complete for the entire country.(23,24) Each report includes a unique personal identity number (PIN) and biopsy date and describes topography within the liver and morphology using the Systematized Nomenclature of Medicine (SNOMED) system. We linked ESPRESSO to validated, nationwide registers with data regarding demographics, comorbidities, prescribed medications, incident cancers, and death. ESPRESSO was approved by the Stockholm Regional Ethics Committee on August 27, 2014 (#2014/1287–31/4). Informed consent was waived because the study was register-based.(25)
Using a validated algorithm,(23) we identified all liver histopathology specimens between 1966 and 2016 that confirmed a diagnosis of NAFLD from adults aged ≥18 years without another competing etiology of liver disease (Supporting Methods; Supporting Tables S1 and S2). We excluded anyone with another form of liver disease, prior record of alcohol abuse/misuse, liver transplantation, or emigration from Sweden before the liver biopsy date (i.e., the index date). Consistent with prior publications,(26,27) we also excluded anyone with a cancer diagnosis at baseline, except nonmelanoma skin cancer, which generally has little clinical impact and therefore is not expected to be associated with recall bias or influence lifestyle changes. Additionally, we excluded anyone with <90 days of follow-up. In our previous validation study in this cohort (Supporting Methods), this methodology yielded a positive predictive value (PPV) of 92% for NAFLD.(23)
Patients meeting our criteria for NAFLD were subsequently categorized into four histological groups (simple steatosis, NASH without fibrosis, noncirrhotic fibrosis, cirrhosis) using Systematized Nomenclature of Medicine (SNOMED) definitions based on nationwide reporting recommendations for all pathologists in Sweden(28) and which we have previously validated in this cohort.(23) (Supporting Methods) Briefly, simple steatosis was defined by at least one morphology code for steatosis and no additional codes for inflammation/ballooning (M5400x or M4-) or fibrosis (M4900x) or cirrhosis (M4950x). NASH without fibrosis was defined by at least one code for steatosis plus at least one code indicating inflammation or ballooning (M5400x or M4-) without any codes for fibrosis or cirrhosis. Noncirrhotic fibrosis (F1-F3 fibrosis, with or without NASH) was defined by the presence of at least one code for steatosis plus at least one code for fibrosis (M4900x) but no codes for cirrhosis. Cirrhosis was defined by at least one code for cirrhosis (M4950x).
Each NAFLD patient was individually matched to ≤5 general population controls without recorded NAFLD according to age, sex, calendar year, and county of residence, consistent with prior work.(23) Controls were derived from the Total Population Register,(29) and identical exclusion criteria were applied (Supporting Table S1).
Incident overall cancer was ascertained from the Swedish Cancer Register, which is complete for >96% of all cancers(30) and in which all cases are confirmed and classified by specialists using established histopathological or radiographic criteria. Secondary outcomes included specific cancer types (HCC, non-HCC liver cancer, and extrahepatic cancers), which were further subclassified as hematologic cancers and extrahepatic solid organ (EHSO) cancers (cancer of the prostate, breast, esophagus/stomach, colon/rectum, lung, pancreas, kidney/bladder, cervical/ovarian/uterine, melanoma, and a composite group of all others). All-cause mortality was ascertained from the Total Population Register, which records 93% of all deaths within 10 days and the remaining 7% within 30 days.(31)
We collected detailed information regarding demographics, comorbidities, and medication use (Supporting Methods; Supporting Table S3). Briefly, age at the index date (i.e., date of biopsy among NAFLD patients or the corresponding matching date for controls), sex, date of birth, and emigration status were ascertained from the Total Population Register,(29) and education level was obtained from the Longitudinal Integrated Database for Health Insurance and Labour Market Studies (LISA).(32) Comorbidities were ascertained using established ICD algorithms extracted from the validated Patient Register, which prospectively records data from hospitalizations (including surgeries), discharge diagnoses (since 1964), and specialty outpatient care (since 2001), with PPVs between 85% and 95% (25) (for ICD definitions, see Supporting Methods; Supporting Table S3). Medication data, including statins, low-dose aspirin (<163 mg), antidiabetic medications, and use of angiotensin-converting enzyme (ACE) inhibitors and angiotensin II receptor blockers (ARBs), were ascertained from the Prescribed Drug Register, a well-validated and virtually complete register with prospectively recorded data regarding all dispensed prescriptions from Swedish pharmacies that has been available since July 2005.(33)
Statistical Analysis
Our primary analysis examined the incidence of overall cancer according to the presence and histological severity of NAFLD compared with matched controls. Follow-up began ≥90 days after the index biopsy date and continued to the first diagnosis date of incident cancer, death, emigration, or end of follow-up (December 31, 2016).
Unadjusted incidence rates and absolute rate differences (RDs), with 95% confidence intervals (CIs), were calculated by dividing the number of events by the number of person-years (PYs). We also calculated unadjusted 20-year absolute risks and corresponding risk differences, with 95% CIs approximated by the normal distribution. Using Cox proportional hazard models, we estimated multivariable adjusted hazard ratios (aHRs) for incident cancers, accounting for matching factors (age at the index date, sex, calendar year, and county) and also for covariates defined up to and including the index date (cardiovascular disease, diabetes, hypertension, dyslipidemia, obesity, end-stage renal disease, family history of cancer at age <50 years, education, the number of recorded hospital encounters in the year prior to the index date), and time-varying alcohol abuse/misuse, consistent with prior work.(23,24) (Supporting Methods; Supporting Table S3) The proportional hazards assumption was tested by visually examining and formally testing the association between Schoenfeld residuals and time.
In stratified models, we evaluated the associations between NAFLD and the development of cancer according to risk strata defined by age, sex, index date, follow-up time, Nordic vs. non-Nordic birth country, education level, cardiovascular disease, diabetes, hypertension, dyslipidemia, and the metabolic syndrome, and we tested the significance of effect modification using the log likelihood ratio test. To better characterize the gradient of risk associated with progressive NAFLD and to minimize potential misclassification of controls or bias related to the indication for liver biopsy, we excluded controls and restricted the analysis to patients with histologically defined NAFLD, with simple steatosis as the comparator.
We conducted several sensitivity analyses to test the robustness of our results. First, to address potential overestimation of cancer incidence in the setting of competing events, we accounted for competing risks of noncancer mortality.(34) Second, to more carefully account for differences in clinical comorbidities between NAFLD patients and population comparators at the index date, we propensity score (PS)-matched NAFLD patients to population controls without NAFLD in a 1:1 manner on the index date using a nearest-neighbor PS algorithm and included age at the index date (±2 years), sex, calendar year (±2 years), county of residence, cardiovascular disease, diabetes, hypertension, dyslipidemia, obesity, and the metabolic syndrome. After applying this algorithm, 100% of the 8,982 NAFLD patients were successfully matched to 8,982 population controls.
Third, because a widely used histological scoring system for NAFLD was published in 2005,(35) the year prescription medication data were first available in the Prescribed Drug Register, we restricted the cohort to patients with an index date on or after January 1, 2006, and constructed multivariable models further accounting for time-varying use of relevant medications, including aspirin, statins, antidiabetic drugs, and ACE inhibitors or ARBs (Supporting Methods). Fourth, to address potential confounding from shared genetic or early environmental factors, we restricted the cohort to NAFLD patients with ≥1 full sibling without recorded NAFLD(23) and compared each NAFLD patient with his or her sibling(s) after conditioning on matching set within each family (i.e. 1 stratum per family) and further adjusting for all covariates. Fifth, we compared our findings after applying an alternative, broader definition of HCC(36) and, again, after excluding anyone diagnosed with cancer within ≤2 years. We also repeated our primary analysis using a control exposure with an expected positive association (the metabolic syndrome). Finally, using an array-based approach,(37) we tested the sensitivity of our models to potential unmeasured confounding.
Analyses were conducted using R software (version 3.6.1 and survival package version 2.44, R Foundation for Statistical Computing, Vienna, Austria). P < 0.05 was considered statistically significant.
Results
Table 1 outlines the baseline characteristics of 8,892 adults with histologically confirmed NAFLD and 39,907 matched population controls. Among NAFLD patients, the average age at index biopsy was 51 years, and 42% were female. Simple steatosis was found in 5,939 (66.8%), 1,050 (11.8%) had NASH without fibrosis, 1,400 (15.7%) had noncirrhotic fibrosis, and 503 (5.7%) had cirrhosis. NAFLD patients were more likely than controls to have cardiovascular disease, diabetes, hypertension, and dyslipidemia.
Table 1.
Baseline Characteristics of Adults With Histologically Defined NAFLD and Matched Population Comparators
| Characteristic | Population Comparators N = 39,907 |
All NAFLD N = 8,892 |
Simple Steatosis N = 5,939 |
NASH Without Fibrosis N = 1,050 |
Noncirrhotic Fibrosis N = 1,400 |
Cirrhosis N = 503 |
P Value3 |
|---|---|---|---|---|---|---|---|
| Male, % | 56.7 | 58.3 | 59.4 | 54.0 | 57.4 | 57.3 | 0.02 |
| Age at the index date, years (SD) | 49.9 (14.4) | 50.6 (14.5) | 49.3 (14.4) | 51.1 (14.8) | 53.3 (14.0) | 57.9 (12.1) | <0.001 |
| Years of follow-up (IQR) | 15.5 (8.6) | 13.8 (8.5) | 15.3 (8.5) | 12.1 (7.9) | 10.3 (7.4) | 8.9 (7.3) | <0.001 |
| Start of follow-up, % | 0.10 | ||||||
| 1966–1989 | 8,274 (20.7) | 1,784 (20.1) | 1,388 (23.4) | 145 (13.8) | 139 (9.9) | 112 (22.3) | NA |
| 1990–2000 | 18,404 (46.1) | 4,050 (45.6) | 2,933 (49.4) | 439 (41.8) | 463 (33.1) | 215 (42.7) | NA |
| 2001–2010 | 9,449 (23.7) | 2,159 (24.3) | 1,218 (20.5) | 314 (29.9) | 516 (36.9) | 111 (22.1) | NA |
| 2011–2016 | 3,780 (9.5) | 899 (10.1) | 400 (6.7) | 152 (14.5) | 282 (20.1) | 65 (12.9) | NA |
| Nordic country of birth (%) | 36,343 (91.1) | 7,919 (89.1) | 5,328 (89.7) | 920 (87.6) | 1219 (87.1) | 452 (89.9) | <0.001 |
| Highest education level1 (%) | (among n = 31,633) | (among n = 7,108) | (among n = 4,551) | (among n = 905) | (among n = 1,261) | (among n = 391) | <0.001 |
| ≤9 years | 8,625 (27.3) | 2,093 (29.5) | 1,307 (28.7) | 259 (28.6) | 375 (29.7) | 152 (38.9) | NA |
| 10–12 years | 13,394 (42.3) | 3,251 (45.7) | 2,079 (45.7) | 426 (47.1) | 568 (45.0) | 178 (45.5) | NA |
| ≥13 years | 9,228 (29.2) | 1,699 (23.9) | 1,132 (24.9) | 210 (23.2) | 305 (24.2) | 52 (13.3) | NA |
| Unknown | 386 (1.2) | 65 (0.9) | 33 (0.7) | 10 (1.1) | 13 (1.0) | 9 (2.3) | NA |
| Cardiovascular disease (%) | 1,939 (4.9) | 961 (10.8) | 542 (9.1) | 129 (12.3) | 197 (14.1) | 93 (18.5) | <0.001 |
| Dyslipidemia (%) | 1,066 (2.7) | 531 (6.0) | 215 (3.6) | 86 (8.2) | 179 (12.8) | 51 (10.1) | <0.001 |
| Diabetes (%) | 703 (1.7) | 687 (7.7) | 303 (5.1) | 96 (9.1) | 194 (13.9) | 94 (18.7) | <0.001 |
| Hypertension (%) | 1,770 (4.4) | 1,040 (11.7) | 466 (7.9) | 156 (14.9) | 304 (21.7) | 114 (22.7) | <0.001 |
| Obesity (%) | 59 (0.1) | 136 (1.5) | 67 (1.5) | 19 (1.8) | 31 (2.2) | 19 (3.8) | <0.001 |
| Metabolic syndrome2 (%) | 215 (0.5) | 207 (2.3) | 66 (1.1) | 37 (3.5) | 67 (4.8) | 37 (7.4) | <0.001 |
| Number of hospital encounters in the year prior to the index date (SD) | 0.4 (1.6) | 2.6 (4.0) | 2.3 (3.3) | 3.0 (3.8) | 3.7 (6.4) | 2.8 (3.4) | <0.001 |
| Family history of cancer at age <50 years (%) | 2,284 (5.7) | 511 (5.8) | 328 (5.5) | 78 (7.4) | 84 (6.0) | 21 (4.2) | <0.001 |
All variables reported as mean (SD) or % unless described otherwise. For definitions of the NAFLD histological groups and all covariates, see Supporting Methods and Supporting Table S3.
Education categories based on compulsory school, high school, and college (see Supporting Methods). Education level was recorded beginning in 1990; therefore, data presented are for persons with index dates on or after January 1, 1990.
Metabolic syndrome was defined as ≥3 metabolic risk factors (dyslipidemia, diabetes, hypertension, and/or obesity), as outlined in the Methods section and Supporting Table S3.
P values signify the comparison between all NAFLD patients versus population comparators.
Abbreviations: IQR, interquartile range; NAFLD, nonalcoholic fatty liver disease; NASH, nonalcoholic steatohepatitis; SD, standard deviation; NA, not applicable.
Overall Cancer Incidence
Over a median of 13.8 years, we documented 1,691 incident cancers among NAFLD patients (13.8/1,000 PYs) and 6,733 incident cancers among controls (10.9/1,000 PYs), yielding an absolute RD of 2.9/1,000 PYs and a 20-year absolute risk difference of 5.4% (95% CI, 3.7–7.0) (Table 2). After multivariable adjustment, the aHR for incident overall cancer was 27% higher among patients with NAFLD compared with controls (95% CI, 1.18–1.36) (Fig. 1; Table 2). This significant, positive association was similar among women and men and across all clinical risk strata (all Pheterogeneity > 0.05) (Supporting Table S4).
TABLE 2.
Risk of Incident Cancer Among Adults With Histologically Confirmed NAFLD and Matched Population Comparators
| Population Comparators N = 39,907 |
NAFLD* | |||||
|---|---|---|---|---|---|---|
| Incident Cancer | All NAFLD N = 8,892 |
Simple Steatosis N = 5,939 |
NASH Without Fibrosis N = 1,050 |
Noncirrhotic Fibrosis N = 1,400 |
Cirrhosis N = 503 |
|
| Overall cancers, N. | 6,733 | 1,691 | 1,160 | 187 | 233 | 111 |
| Incidence rate1 per 1,000 PYs (95% CI) | 10.9 (10.6–11.2) | 13.8 (13.2–14.5) | 12.8 (12.1–13.6) | 14.7 (12.7–17.0) | 16.2 (14.1–18.4) | 24.8 (20.4–29.9) |
| Incidence RD1 (95% CI) | 0 (ref.) | 2.9 (2.2–3.7) | 1.9 (1.1–2.7) | 3.8 (1.7–6.0) | 5.3 (3.2–7.4) | 14.0 (9.3–18.6) |
| 20-year absolute risk difference,2 % (95% CI) | 0 (ref.) | 5.4 (3.7–7.0) | 3.4 (1.6–5.2) | 7.8 (2.5–13.2) | 10.0 (4.4–15.7) | 20.7 (9.3–32.1) |
| Multivariable aHR3 (95% CI) | 1 (ref.) | 1.27 (1.18–1.36) | 1.22 (1.12–1.32) | 1.27 (1.03–1.56) | 1.35 (1.13–1.61) | 1.95 (1.48–2.55) |
| P value3 | NA | <0.001 | <0.001 | 0.024 | 0.001 | <0.001 |
| HCC, N. | 56 | 153 | 72 | 16 | 35 | 30 |
| Incidence rate1 per 1,000 PYs (95% CI) | 0.1 (0.1–0.1) | 1.2 (1.0–1.4) | 0.8 (0.6–1.0) | 1.2 (0.7–1.9) | 2.3 (1.6–3.2) | 6.2 (4.2–8.8) |
| Incidence RD1 (95% CI) | 0 (ref.) | 1.1 (0.9–1.3) | 0.7 (0.5–0.8) | 1.1 (0.5–1.7) | 2.2 (1.4–3.0) | 6.1 (3.9–8.3) |
| 20-year absolute risk difference,2 % (95% CI) | 0 (ref.) | 2.1 (1.7–2.5) | 1.2 (0.8–1.6) | 2.1 (0.7–3.6) | 4.6 (2.7–6.5) | 11.4 (6.5–16.3) |
| Multivariable aHR3 (95% CI) | 1 (ref.) | 17.08 (11.56–25.25) | 9.25 (5.63–15.20) | 55.66 (14.43–214.72) | 72.72 (19.20–275.51) | 49.48 (15.71–155.81) |
| P value3 | NA | <0.001 | <0.001 | <0.001 | <0.001 | <0.001 |
| Non-HCC liver cancers, N. | 82 | 25 | 16 | 2 | 5 | 2 |
| Incidence rate1 per 1,000 PYs (95% CI) | 0.1 (0.1–0.2) | 0.2 (0.1–0.3) | 0.2 (0.1–0.3) | 0.2 (0.0–0.5) | 0.3 (0.1–0.8) | 0.4 (0.1–1.5) |
| Incidence RD1 (95% CI) | 0 (ref.) | 0.1 (0.0–0.2) | 0.0 (0.0–0.1) | 0.02 (−0.2–0.2) | 0.2 (−0.1–0.5) | 0.3 (−0.3–0.9) |
| 20-year absolute risk difference,2 % (95% CI) | 0 (ref.) | 0.1 (0.0–0.3) | 0.1 (−0.1–0.3) | 0.1 (−0.4–0.6) | 0.2 (−0.3–0.7) | 0.8 (−0.8–2.4) |
| Multivariable aHR3 (95% CI) | 1 (ref.) | 1.75 (0.98–3.14) | 1.26 (0.62–2.58) | 3.49 (0.36–34.00) | 4.20 (1.05–16.86) | 3.08 (0.35–27.48) |
| P value3 | NA | 0.062 | 0.535 | 0.261 | 0.048 | 0.175 |
| EHSO cancers, N. | 6,160 | 1,390 | 987 | 152 | 174 | 77 |
| Incidence rate1 per 1,000 PYs (95% CI) | 9.9 (9.7–10.2) | 11.3 (10.7–11.9) | 10.8 (10.2–11.5) | 11.8 (10.0–13.9) | 12.0 (10.3–13.9) | 17.1 (13.5–21.3) |
| Incidence RD1 (95% CI) | 0 (ref.) | 1.4 (0.7–2.0) | 0.9 (0.2–1.6) | 1.9 (0.0–3.8) | 2.0 (0.3–3.8) | 7.1 (3.3–11.0) |
| 20-year absolute risk ifference,2 % (95% CI) | 0 (ref.) | 3.0 (1.5–4.5) | 1.9 (0.2–3.6) | 5.2 (0.4–10.1) | 4.7 (−0.2–9.5) | 11.4 (2.0–20.7) |
| Multivariable aHR3 (95% CI) | 1 (ref.) | 1.12 (1.04–1.20) | 1.11 (1.02–1.22) | 1.11 (0.89–1.39) | 1.05 (0.86–1.28) | 1.41 (1.04–1.91) |
| P value3 | NA | 0.002 | 0.013 | 0.26 | 0.529 | 0.018 |
| Hematologic cancers, N. | 435 | 123 | 85 | 17 | 19 | 2 |
| Incidence rate1 per 1,000 PYs (95% CI) | 0.7 (0.6–0.7) | 1.0 (0.8–1.1) | 0.9 (0.7–1.1) | 1.3 (0.7–2.0) | 1.2 (0.8–1.9) | 0.4 (0.0–1.5) |
| Incidence RD1 (95% CI) | 0 (ref.) | 0.3 (0.1–0.5) | 0.2 (0.0–0.4) | 0.6 (0.0–1.2) | 0.6 (0.0–1.1) | −0.3 (−0.8–0.3) |
| 20-year absolute risk difference,2 % (95% CI) | 0 (ref.) | 0.6 (0.2–1.0) | 0.5 (0.0–0.9) | 0.8 (−0.3–1.9) | 1.8 (0.1–3.5) | −0.3 (−1.9–1.4) |
| Multivariable aHR3 (95% CI) | 1 (ref.) | 1.46 (1.12–1.90) | 1.47 (1.06–2.03) | 1.05 (0.51–2.15) | 1.86 (0.96–3.62) | 1.07 (0.19–5.93) |
| P value3 | NA | 0.004 | 0.014 | 0.874 | 0.083 | 0.652 |
NAFLD was defined by liver histology. For definitions and algorithm, see the Methods section and Supporting Information.
Incidence rates were calculated by dividing the number of cases by PYs; CIs for incidence rates and absolute RDs were approximated by the normal distribution (Methods).
20-year absolute risks and absolute risk differences (percentage points) were calculated based on Kaplan-Meier estimates (Methods).
The multivariable-adjusted model accounted for age at the index date, sex, calendar year, county of residence, cardiovascular disease, diabetes, hypertension, dyslipidemia, obesity, end-stage renal disease, family history of cancer at age <50 years, education (3 groups + missing category), the number of recorded hospital encounters in the year prior to the index biopsy date (or corresponding matching date), and alcohol abuse/misuse defined as a time-varying covariate. All clinical covariates were ascertained from the Patient Register using established ICD codes, and defined by the presence of ≥1 inpatient diagnosis or by the second of ≥2 outpatient diagnoses (as outlined in the Supporting Methods and Supporting Table S3). P values signify the comparison between each NAFLD category and population comparators.
Abbreviations: aHR, adjusted hazard ratio; CI, confidence interval; EHSO, extrahepatic solid organ; HCC, hepatocellular carcinoma; N., number; PYs, person-years; RD, rate difference; ref., referent.
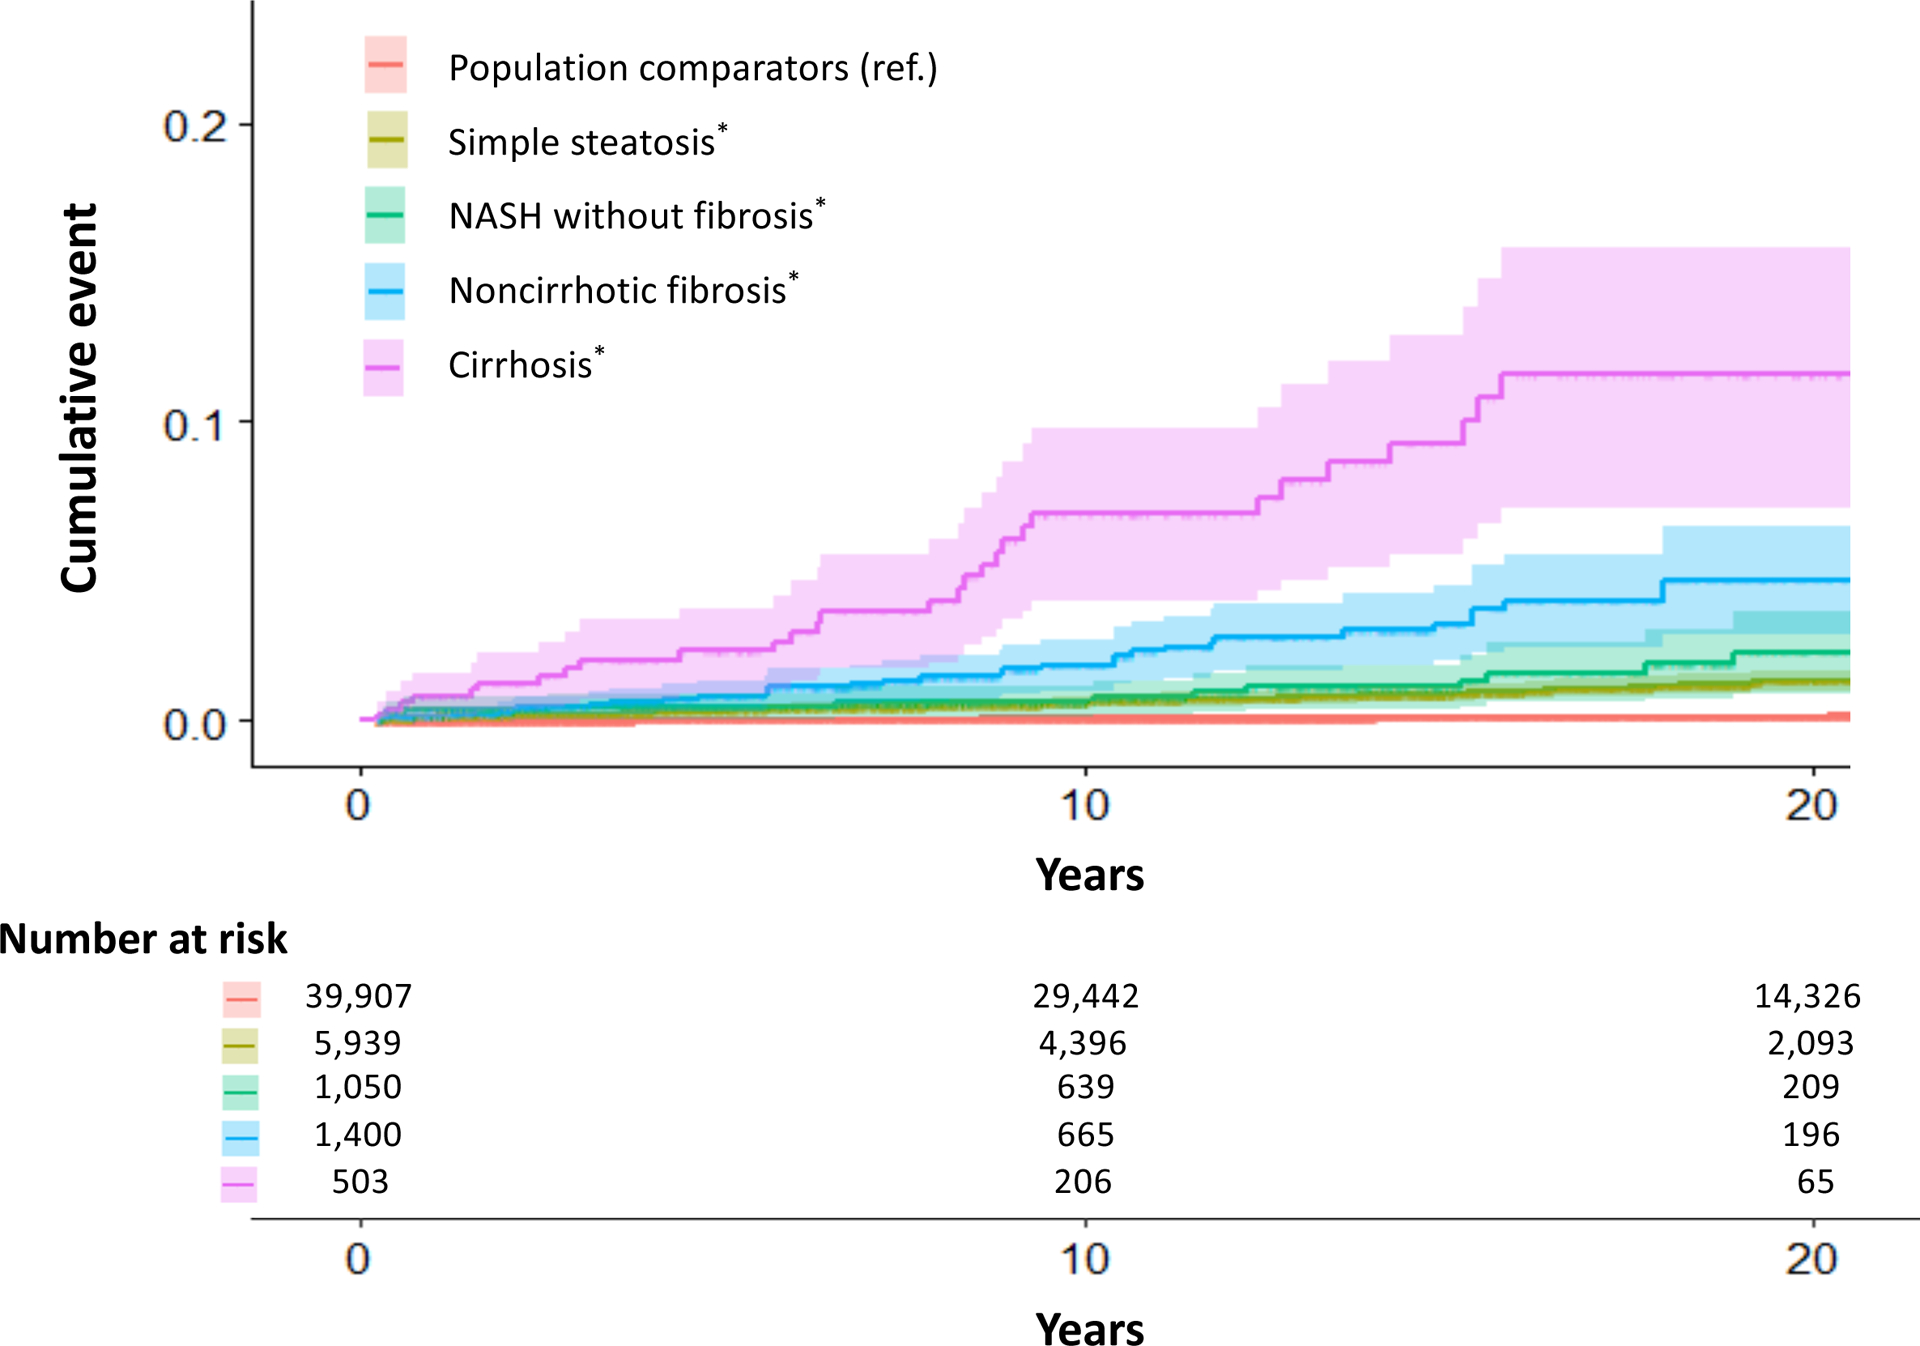
FIG. 1.

Cumulative incidence of overall cancer according to the prevalence and histological severity of NAFLD. NAFLD histological severity was defined in four categories: simple steatosis, NASH without fibrosis, noncirrhotic fibrosis, and cirrhosis. (For details, see Supporting Methods.) P values for the absolute incidence RDs for overall cancer between population comparators versus simple steatosis, NASH without fibrosis, noncirrhotic fibrosis, and cirrhosis were all <0.001. P values were approximated using the normal distribution. Abbreviations: NAFLD, nonalcoholic fatty liver disease; NASH, nonalcoholic steatohepatitis; RDs, rate differences; ref., referent.
Rates of incident overall cancer increased progressively with worsening NAFLD histological severity (Ptrend < 0.01) (Fig. 1; Table 2). Compared with controls, the absolute RDs and corresponding aHRs with simple steatosis, NASH without fibrosis, noncirrhotic fibrosis, and cirrhosis were 1.9/1,000 PYs (aHR, 1.22 [95% CI, 1.12–1.32]), 3.8/1,000 PYs (aHR, 1.27 [95% CI, 1.03–1.56]), 5.3/1,000 PYs (aHR, 1.35 [95% CI, 1.13–1.61]), and 14.0/1,000 PYs (aHR, 1.95 [95% CI, 1.48–2.55]), respectively. These findings were similar in men and women and across all clinical strata (all Pheterogeneity > 0.05).
HCC Incidence
Compared with controls, NAFLD patients had significantly higher rates of developing incident HCC (0.1 vs. 1.2/1,000 PYs; aHR, 17.08 [95% CI, 11.56–25.25]), corresponding to a 20-year absolute excess risk of 2.1% (Table 2). Rates of incident HCC also increased monotonically with worsening NAFLD histological severity (Ptrend < 0.01) (Table 2; Fig. 2). Compared with controls, the absolute RDs and corresponding aHRs for incident HCC with simple steatosis, NASH without fibrosis, noncirrhotic fibrosis, and cirrhosis were 0.8/1,000 PYs (aHR, 9.25 [95% CI, 5.63–15.20]), 1.2/1,000 PYs (aHR, 55.66 [95% CI, 14.43–214.72]), 2.3/1,000 PYs (aHR, 72.72 [95% CI, 19.20–275.51]), and 6.2/1,000 PYs (aHR, 49.48 [95%CI, 15.71–155.81]), respectively. This significant, positive, dose-dependent gradient was similar among women and men (both Ptrend < 0.01) and after further accounting for competing events (Ptrend < 0.01) (Supporting Table S5).
FIG. 2.
Cumulative incidence of HCC according to the presence and histological severity of NAFLD. NAFLD histological severity was defined in four categories: simple steatosis, NASH without fibrosis, noncirrhotic fibrosis, and cirrhosis. (For details, see Supporting Methods.) P values for the absolute incidence RDs for incident HCC between population comparators versus simple fibrosis, noncirrhotic fibrosis, and cirrhosis were all <0.001. P values were approximated using the normal distribution. Abbreviation: HCC, hepatocellular carcinoma.
To further explore variation in annual HCC incidence rates according to clinical factors, we conducted subgroup analyses among patients with NASH without fibrosis, noncirrhotic fibrosis, and cirrhosis (Supporting Fig. S1). Among patients with diabetes and NASH without fibrosis, noncirrhotic fibrosis, or cirrhosis, the observed HCC incidence rates were 2.9/1,000 PYs, 7.2/1,000 PYs, and 15.7/1,000 PYs, respectively. In contrast, among nondiabetic patients with NASH without fibrosis, noncirrhotic fibrosis, or cirrhosis, the corresponding annual HCC incidence rates were 1.1/1,000 PYs, 1.9/1,000 PYs, and 5.0/1,000 PYs (Supporting Fig. S1). Similarly, annual incidence rates of EHSO cancers among diabetic patients with NASH without fibrosis, noncirrhotic fibrosis, or cirrhosis were 15.4/1,000 PYs, 17.8/1,000 PYs, and 18.2/1,000 PYs, respectively. In contrast, the corresponding annual incidence rates among nondiabetic patients were 11.8/1,000 PYs, 11.6/1,000 PYs, and 17.1/1,000 PYs, respectively.
Non-HCC Cancer Incidence
Compared with controls, NAFLD patients had modest yet significantly higher rates of developing EHSO cancers (9.9 vs. 11.3/1,000 PYs; aHR, 1.12 [95% CI, 1.04–1.20]) and hematologic cancers (0.7 vs. 1.0/1,000 PYs; aHR, 1.46 [95% CI, 1.12–1.90]), but significant differences were not observed with worsening NAFLD severity (both Ptrend > 0.05) (Table 2).
In analyses of individual EHSO cancers (Supporting Table S6), NAFLD patients had significantly higher rates of developing pancreatic cancer (aHR, 2.15 [95% CI, 1.40–3.30]), kidney/bladder cancer (aHR, 1.41 [95% CI, 1.07–1.86]), and melanoma (aHR, 1.30 [95% CI, 1.08–1.57]) compared with controls. In contrast, no significant differences were observed for prostate, lung, breast, colorectal, esophageal/stomach, or cervical/ovarian/uterine cancers. Although there was a trend toward higher rates of non-HCC liver cancer among NAFLD patients, this did not achieve statistical significance (aHR, 1.75 [95% CI, 0.98–3.14]).
NAFLD-Only Subgroup
To address potential misclassification of controls and bias related to the indication for liver biopsy, we restricted the analyses just to patients with biopsy-confirmed NAFLD, with simple steatosis as the comparator. Consistent with our primary analyses, we observed progressively higher rates of incident overall cancer with worsening NAFLD histological severity (Ptrend = 0.03), particularly incident HCC (Ptrend < 0.01) (Table 3). Specifically, compared with simple steatosis, the absolute RDs and aHRs for incident HCC in patients with NASH without fibrosis, noncirrhotic fibrosis, and cirrhosis were 0.7/1,000 PYs (aHR, 1.61 [95% CI, 0.91–2.84]), 1.5/1,000 PYs (aHR, 2.45 [95% CI, 1.57–3.84]), and 5.4/1,000 PYs (aHR, 4.95 [95%CI, 3.08–7.97]), respectively. In contrast, dose-dependent associations were not observed for EHSO cancers. These findings persisted after rematching subjects with simple steatosis to all others with NAFLD (not shown).
TABLE 3.
Risk of Incident Cancer With Increasing NAFLD Histological Severity, Compared With Simple Steatosis*
| NAFLD* | ||||
|---|---|---|---|---|
| Types of Incident Cancer, N. | Simple Steatosis N = 5,939 |
NASH Without Fibrosis N = 1,050 |
Noncirrhotic Fibrosis N = 1,400 |
Cirrhosis N = 503 |
| All incident cancers | 1,160 | 187 | 233 | 111 |
| Incidence RD1 (95% CI) | 0 (ref.) | 2.0 (−0.3–4.2) | 3.4 (1.2–5.6) | 12.1 (7.4–16.8) |
| 20-year absolute risk difference,2 % (95% CI) | 0 (ref.) | 4.4 (−1.1–10.0) | 6.7 (0.8–12.5) | 17.3 (5.8–28.9) |
| Multivariable aHR3 (95% CI) | 1 (ref.) | 1.10 (0.94–1.29) | 1.08 (0.93–1.26) | 1.46 (1.19–1.79) |
| HCC | 72 | 16 | 35 | 30 |
| Incidence RD1 (95% CI) | 0 (ref.) | 0.7 (0.0–1.3) | 1.5 (0.8–2.3) | 5.4 (3.3–7.6) |
| 20-year absolute risk difference,2 % (95% CI) | 0 (ref.) | 1.0 (−0.5–2.4) | 3.4 (1.5–5.3) | 10.2 (5.3–15.2) |
| Multivariable aHR3 (95% CI) | 1 (ref.) | 1.61 (0.91–2.84) | 2.45 (1.57–3.84) | 4.95 (3.08–7.97) |
| Non-HCC liver cancers | 16 | 2 | 5 | 2 |
| Incidence RD1 (95% CI) | 0 (ref.) | 0.0 (−0.2–0.2) | 0.2 (−0.1–0.5) | 0.2 (−0.3–0.8) |
| 20-year absolute risk difference,2 % (95% CI) | 0 (ref.) | 0.0 (−0.6–0.5) | 0.1 (−0.5–0.6) | 0.7 (−1.0–2.3) |
| Multivariable aHR3 (95% CI) | 1 (ref.) | 0.76 (0.16–3.52) | 1.97 (0.66–5.88) | 1.56 (0.35–7.08) |
| EHSO cancers | 987 | 152 | 175 | 77 |
| Incidence RD1 (95% CI) | 0 (ref.) | 1.0 (−1.0–3.0) | 1.2 (−0.7–3.1) | 6.3 (2.4–10.1) |
| 20-year absolute risk difference,2 % (95% CI) | 0 (ref.) | 3.3 (−1.7–8.4) | 2.9 (−2.2–7.9) | 9.5 (0.0–19.0) |
| Multivariable aHR3 (95% CI) | 1 (ref.) | 1.04 (0.88–1.25) | 0.94 (0.80–1.12) | 1.23 (0.97–1.56) |
| Hematologic cancers | 85 | 17 | 19 | 2 |
| Incidence RD1 (95% CI) | 0 (ref.) | 0.4 (−0.3–1.0) | 0.4 (−0.2–1.0) | −0.5 (−1.1–0.1) |
| 20-year absolute risk difference,2 % (95% CI) | 0 (ref.) | 0.3 (−0.9–1.5) | 1.3 (−0.5–3.0) | −0.7 (−2.4–1.0) |
| Multivariable aHR3 (95% CI) | 1 (ref.) | 1.38 (0.80–2.36) | 1.39 (0.81–2.37) | 0.35 (0.08–1.46) |
NAFLD was defined by liver histology. For definitions and algorithm, see the Methods section and Supporting Information.
Incidence rates were calculated by dividing the number of cases by PYs; CIs for incidence rates and absolute RDs were approximated by the normal distribution (Methods).
20-year absolute risks and absolute risk differences (percentage points) were calculated based on Kaplan-Meier estimates (Methods).
The multivariable aHR model accounted for the covariates outlined in Table 2.
Sensitivity Analyses
Our findings were robust across all sensitivity analyses. After PS matching NAFLD patients (N = 8,982) to population controls (N = 8,982), all clinical comorbidities were well balanced between groups (standardized mean differences <0.1) (Supporting Table S7), and our findings remained consistent with our primary analyses (Supporting Table S8). Similarly, after restricting the cohort to NAFLD patients with ≥1 full sibling without recorded NAFLD and then comparing each NAFLD patient with his or her full sibling(s), our findings were consistent (Supporting Table S9). Among the subgroup of NAFLD patients with an index date on or after January 1, 2006 (N = 1,826), and matched comparators (N = 7,785) (Supporting Table S10), NAFLD remained significantly and positively associated with both overall cancer (aHR, 1.53 [95% CI, 1.19–1.96]) and incident HCC (aHR, 38.20 [95% CI, 8,29–176.09]) in the fully adjusted multivariable model after further accounting for relevant medication use (Supporting Table S11). Our findings also persisted after further excluding anyone diagnosed with cancer within <2 years (Supporting Table S12) and after applying the alternative definition of HCC (Ptrend < 0.01) (Supporting Table S13). When we repeated the NAFLD-only subgroup analysis and the full-sibling analysis after accounting for the potential competing risk of death without cancer, we observed similar, significant associations for HCC but not for other cancers (Supporting Table S14A,B). In analyses focused on a control exposure with an expected positive relation to overall cancer risk (the metabolic syndrome), we observed a modest but statistically significant increased risk (aHR, 1.07 [95% CI, 1.00–1.15]), consistent with published data.(38,39) Finally, we found that an unmeasured confounder would have to be both very strongly associated with incident cancer risk and highly imbalanced (aHR ≥3.0, with ≥30% difference in prevalence) to fully attenuate our results (Supporting Table S15).
Discussion
In this population-based cohort comprising all Swedish adults with biopsy-confirmed NAFLD and matched population controls, NAFLD was associated with a significantly increased risk of developing overall cancer, driven primarily by an increased incidence of HCC. Compared with controls, patients with NAFLD had a 17-fold higher rate of developing HCC and a 20-year absolute excess risk of 2.1%. Significant excess HCC incidence was apparent at all ages, in both men and women, and after accounting for both established HCC risk factors and competing risks. Moreover, HCC incidence increased monotonically with worsening NAFLD histological severity, and it was further amplified in the setting of diabetes; thus, the highest HCC incidence rates were found in patients with comorbid diabetes and noncirrhotic fibrosis (7.2/1,000 PYs) or cirrhosis (15.7/1,000 PYs). Although NAFLD was also associated with the development of some EHSO cancers, those associations were relatively modest. In contrast, the 20-year absolute excess risk of patients with noncirrhotic NAFLD fibrosis (4.6%) or cirrhosis (11.4%) developing HCC was comparable to that of all EHSO cancers combined (4.7%−11.4%).
Our findings extend prior evidence linking NAFLD to an increased incidence of overall cancer,(8,9) including HCC,(14,40) by quantifying these risks for the first time in a nationwide, population-based histopathology cohort. Beyond the association with HCC, NAFLD was also associated with a small but significantly increased risk of developing pancreatic cancer, kidney/bladder cancer, and melanoma, a finding supported by some observational studies.(8,16) However, for each of those cancers, significant associations were no longer present after we restricted the population just to patients with NAFLD, suggesting that other factors, such as obesity, may have confounded those relationships. Additionally, we detected no significant associations between NAFLD and cancers of the lung, prostate, breast, colon, rectum, esophagus, stomach, cervix, ovaries, or the uterus and only weak evidence for hematologic cancers. For some of those cancer sites, small associations have been described,(8,9,16) yet those estimates are included within our CIs. In contrast to some reports, the current study benefitted from prospectively recorded histopathology collected from all adults with biopsy-confirmed NAFLD in Sweden, which therefore enabled a more comprehensive evaluation of cancer risk across the NAFLD histological spectrum.
Previous large-scale studies of NAFLD and HCC have relied on billing codes or serum markers to estimate NAFLD severity,(14,40,41) and the few published studies with liver histology have had small populations of fewer than 500 participants, resulting in imprecise risk estimates and poor generalizability. Thus, although it has been suggested that a proportion of NAFLD-HCC tumors might arise in the absence of cirrhosis,(42,43) the precise relationship between NAFLD severity and HCC risk remains unclear.(44,45) In this nationwide population, rates of incident HCC increased in a dose-dependent fashion with worsening NAFLD severity. Patients with simple steatosis had minimally elevated annual HCC incidence rates (0.8/1000 PYs), most likely related to the small proportion who progress to advanced fibrosis over time. In contrast, patients with cirrhosis had HCC incidence rates of 6 to 9/1000 PYs. Importantly, these estimates varied according to key clinical factors, and the greatest magnitude of risk was found in patients with both diabetes and cirrhosis (annual incidence, 15.7/1000 PYs) or diabetes and noncirrhotic fibrosis (7.2/1000 PYs). Both of these subgroups had upper CIs that met or exceeded the threshold range, beyond which HCC surveillance is considered cost-effective (i.e., at or beyond the 95% CI of 0.8–2.3/100 PYs).(44,46)_ENREF_31 Among patients with noncirrhotic fibrosis, diabetes was the only subgroup with CIs that approached this threshold range. In contrast, all subgroups with cirrhosis had CIs that included this range; furthermore, because many patients with established or decompensated cirrhosis will not undergo biopsy, their estimates are likely to be conservative. Collectively, our findings support future research to personalize HCC surveillance protocols and to test whether such protocols should include high-risk patients with diabetes and noncirrhotic NAFLD fibrosis.
Our study is strengthened by the population-based cohort with complete and prospectively recorded histopathology and by our strict, validated definitions of NAFLD and confounding variables in registers with near-complete follow-up for the entire country. This large sample size and prolonged follow-up time permitted calculation of more precise risk estimates across the complete NAFLD spectrum. Additionally, accounting for ranges of time between liver biopsy and incident cancer minimized potential reverse causation, and conducting analyses restricted to patients with histologically defined NAFLD reduced potential misclassification and bias from the underlying indication for biopsy. Moreover, we applied robust analytical techniques to address potential bias from residual confounding, shared familial factors, and competing events.
We considered whether the relationship between NAFLD and cancer risk merely reflected an association with the metabolic syndrome or its components. Consistent with other administrative data sets,(47) the recorded prevalence of the metabolic syndrome was low, which could lead to unmeasured confounding. Nevertheless, our findings remained similar in patients with and without this diagnosis, and our results also persisted in PS-matched analyses. Furthermore, substantial prior evidence demonstrates that the full metabolic syndrome contributes only modestly to the excess risk of developing overall cancer (pooled aHRs for the full metabolic syndrome, 1.10–1.61, depending on cancer site),(39) and our sensitivity analysis demonstrated that our results were robust to unmeasured confounding. Specifically, a confounder would need to have an aHR ≥3.0 for incident cancer risk and also simultaneously have a >30% difference in prevalence between groups to attenuate our results. Thus, the excess cancer risk associated with NAFLD likely exceeds that which is explained by the metabolic syndrome alone.
We acknowledge several limitations to our study. First, NAFLD was defined histologically, which could introduce selection bias, and therefore our findings may not extend to patients with NAFLD who do not undergo biopsy. However, our case distribution across histological categories accords with data from smaller histology cohorts,(15,48–50) and our estimates are broadly consistent with prior studies,(8,40) including a population-based study that defined NAFLD by ultrasound,(9) underscoring the generalizability of our results. Second, our controls may have included patients with undiagnosed NAFLD, which could have attenuated our estimates; however, the gradients of risk for overall cancer and for HCC across NAFLD stages remained similar in the NAFLD-only subgroup analysis. Third, although histopathology is subject to interobserver variability, our validation study (Supporting Methods) demonstrates the accuracy of our exposure definitions.(23) Fourth, despite careful matching, some residual confounding cannot be excluded in this administrative data set, and we lacked laboratory values or data regarding smoking, alcohol consumption, body mass index (BMI), or confirmation of the absence of viral hepatitis. This highlights the need for additional large-scale histopathology cohorts with long-term follow-up that also include more detailed clinical phenotyping. Nevertheless, our findings were robust after multivariable adjustment and PS matching and in models stratified by clinical comorbidities and the NAFLD histological group—approaches that were not possible in previous, smaller studies. Fifth, although HCC cases could have been diagnosed more frequently among patients with NAFLD compared with controls, our estimates were similar when we applied an alternative, validated algorithm for HCC ascertainment.(36) Sixth, the Swedish population is primarily Caucasian, and we lacked specific data regarding individual cancer risks across different ethnic groups. Moreover, despite confirming a high PPV for NASH (87%) in our previous validation study,(23) our data did not distinguish between inflammation and hepatocyte ballooning or between individual fibrosis stages. Further, some of our subgroups were small in size with a limited number of events. Thus, there is a need for future studies that further characterize individual cancer risks according to specific NAFLD histological features as well as those focused on the type and severity of HCC, rare non-HCC liver cancers, and cancer-related mortality. Finally, we acknowledge changing trends in noninvasive NAFLD diagnostic tools; however, all models accounted for calendar year, and our results were similar in recent time periods and in the histology-only subgroup.
In conclusion, within this population-based cohort of 8,982 adults in Sweden with biopsy-confirmed NAFLD and matched population controls, NAFLD was associated with significantly increased risk of developing overall cancer, which was due primarily to a significantly increased incidence of HCC. For the first time on a nationwide scale, this study provides quantitative estimates regarding the risks of developing overall and site-specific cancers according to the presence and histological severity of NAFLD. We demonstrate that significant excess HCC risk is evident across all stages of NAFLD, and the magnitude of that risk is amplified by comorbid diabetes. Our findings underscore the need for improved, personalized HCC surveillance strategies for high-risk patients with NAFLD.
Supplementary Material
Supporting FIG. S1. Annual HCC incidence rates according to NAFLD histology and clinical factors. (For definitions of NAFLD histological groups, see Supporting Methods.)*HCC surveillance in patients with NAFLD is considered cost-effective if the annual incidence rate meets or exceeds 1.5% per year (95% CI, 0.8–2.3),(46) as outlined in the Discussion. Abbreviations: CI, confidence interval; HCC, hepatocellular carcinoma; NAFLD, nonalcoholic fatty liver disease; NASH, nonalcoholic steatohepatitis.
Acknowledgment:
We thank Jonas F. Ludvigsson for the acquisition and integrity of the data and the accuracy of the data analysis; Bjorn Roelstraete for data analysis; Tracey G. Simon and Jonas F. Ludvigsson for writing the first draft of the manuscript; and all the authors for study concept and design, interpretation of data, critical revision of the manuscript for important intellectual content, and approval of the final version.
Financial Support:
This study was supported by grants from the National Institutes of Health (NIH) (K23 DK122104), the Harvard University Center for AIDS Research (CFAR), and the Dana-Farber/Harvard Cancer Center (DF/HCC) Gastrointestinal (GI) Specialized Program in Research Excellence (SPORE) to T.G.S.; grants from Region Stockholm (postdoctoral appointment) to H.H.; the Crohn’s and Colitis Foundation Senior Research Award to H.K.; and grants from the Karolinska Institutet to J.F.L.
Potential conflict of interest:
Dr. Ludvigsson coordinates an unrelated study on behalf of the Swedish Inflammatory Bowel Disease Registry (SWIBREG) that has received funding from Janssen Corporation. Dr. Simon’s institution has received grants from Amgen, and she has served as a consultant to Aetion for work unrelated to this manuscript. Dr. Hagström’s institution has received research grants from AstraZeneca, Intercept, and Gilead, and he has served on the advisory board for Bristol Myers Squibb and Gilead.
Abbreviations:
- aHR
adjusted hazard ratio
- CI
confidence interval
- EHSO
extrahepatic solid organ
- ESPRESSO
Epidemiology Strengthened by histoPathology Reports in Sweden
- HCC
hepatocellular carcinoma
- ICD
International Classification of Diseases
- LISA
Longitudinal Integrated Database for Health Insurance and Labour Market Studies
- NAFLD
nonalcoholic fatty liver disease
- NASH
nonalcoholic steatohepatitis
- PIN
personal identity number
- PPV
positive predictive value
- PS
propensity score
- PY
person-year
- RD
rate difference
- SNOMED
Systematized Nomenclature of Medicine
REFERENCES
- 1).Younossi ZM, Koenig AB, Abdelatif D, Fazel Y, Henry L, Wymer M. Global epidemiology of nonalcoholic fatty liver disease: meta-analytic assessment of prevalence, incidence, and outcomes. Hepatology 2016;64:73–84. [DOI] [PubMed] [Google Scholar]
- 2).Adams LA, Lindor KD. Nonalcoholic fatty liver disease. Ann Epidemiol 2007;17:863–869. [DOI] [PubMed] [Google Scholar]
- 3).Vernon G, Baranova A, Younossi ZM. Systematic review: the epidemiology and natural history of non-alcoholic fatty liver disease and non-alcoholic steatohepatitis in adults. Aliment Pharmacol Ther 2011;34:274–285. [DOI] [PubMed] [Google Scholar]
- 4).Taylor RS, Taylor RJ, Bayliss S, Hagström H, Nasr P, Schattenberg JM, et al. Association between fibrosis stage and outcomes of patients with non-alcoholic fatty liver disease: a systematic review and meta-analysis. Gastroenterology 2020;158:611–1625.e12. [DOI] [PubMed] [Google Scholar]
- 5).Dulai PS, Singh S, Patel J, Soni M, Prokop LJ, Younossi Z, et al. Increased risk of mortality by fibrosis stage in nonalcoholic fatty liver disease: systematic review and meta-analysis. Hepatology 2017;65:1557–1565. [DOI] [PMC free article] [PubMed] [Google Scholar]
- 6).Kleiner DE, Brunt EM, Wilson LA, Behling C, Guy C, Contos M, et al. Association of histologic disease activity with progression of nonalcoholic fatty liver disease. JAMA Netw Open 2019;2:e1912565. doi: 10.1001/jamanetworkopen.2019.12565. [DOI] [PMC free article] [PubMed] [Google Scholar]
- 7).McPherson S, Hardy T, Henderson E, Burt AD, Day CP, Anstee QM. Evidence of NAFLD progression from steatosis to fibrosing-steatohepatitis using paired biopsies: implications for prognosis and clinical management. J Hepatol 2015;62:1148–1155. [DOI] [PubMed] [Google Scholar]
- 8).Allen AM, Hicks SB, Mara KC, Larson JL, Therneau TM. The risk of incident extrahepatic cancers is higher in non-alcoholic fatty liver disease than obesity: a longitudinal cohort study. J Hepatol 2019;71:1229–1236. [DOI] [PMC free article] [PubMed] [Google Scholar]
- 9).Kim GA, Lee HC, Choe J, Kim M-J, Lee MJ, Chang H-S, et al. Association between non-alcoholic fatty liver disease and cancer incidence rate. J Hepatol 2018;68:140–146. [DOI] [PubMed] [Google Scholar]
- 10).Paik JM, Henry L, De Avila L, Younossi E, Racila A, Younossi ZM. Mortality related to nonalcoholic fatty liver disease is increasing in the United States. Hepatol Commun 2019;3:1459–1471. [DOI] [PMC free article] [PubMed] [Google Scholar]
- 11).Siegel RL, Miller KD, Jemal A. Cancer statistics, 2020. CA Cancer J Clin 2020;70:7–30. [DOI] [PubMed] [Google Scholar]
- 12).Malvezzi M, Carioli G, Bertuccio P, Boffetta P, Levi F, La Vechia CL, et al. European cancer mortality predictions for the year 2019 with focus on breast cancer. Ann Oncol 2019;30:781–787. [DOI] [PubMed] [Google Scholar]
- 13).Ferlay J, Colombet M, Soerjomataram I, Mathers C, Parkin DM, Piñeros M, et al. Estimating the global cancer incidence and mortality in 2018: GLOBOCAN sources and methods. Int J Cancer 2019;144:1941–1953. [DOI] [PubMed] [Google Scholar]
- 14).Kanwal F, Kramer JR, Mapakshi S, Natarajan Y, Chayanupatkul M, Richardson PA, et al. Risk of hepatocellular cancer in patients with non-alcoholic fatty liver disease. Gastroenterology 2018;155:1828–1837.e2. [DOI] [PMC free article] [PubMed] [Google Scholar]
- 15).Vilar-Gomez E, Calzadilla-Bertot L, Wai-Sun Wong V, Castellanos M, Aller de la Fuente R, Metwally M, et al. Fibrosis severity as a determinant of cause-specific mortality in patients with advanced nonalcoholic fatty liver disease: a multi-national cohort study. Gastroenterology 2018;155:443–457.e17. [DOI] [PubMed] [Google Scholar]
- 16).Sorensen HT, Mellemkjaer L, Jepsen P, Thulstrup AM, Baron J, Olsen JH, et al. Risk of cancer in patients hospitalized with fatty liver: a Danish cohort study. J Clin Gastroenterol 2003;36:356–359. [DOI] [PubMed] [Google Scholar]
- 17).Ahn JS, Sinn DH, Min YW, Hong SN, Kim HS, Jung S-H, et al. Non-alcoholic fatty liver diseases and risk of colorectal neoplasia. Aliment Pharmacol Ther 2017;45:345–353. [DOI] [PubMed] [Google Scholar]
- 18).Wongjarupong N, Assavapongpaiboon B, Susantitaphong P, Cheungpasitporn W, Treeprasertsuk S, Rerknimitr R, et al. Non-alcoholic fatty liver disease as a risk factor for cholangiocarcinoma: a systematic review and meta-analysis. BMC Gastroenterol 2017;17:149. doi: 10.1186/s12876-017-0696-4. [DOI] [PMC free article] [PubMed] [Google Scholar]
- 19).Touzin NT, Bush KN, Williams CD, Harrison SA. Prevalence of colonic adenomas in patients with nonalcoholic fatty liver disease. Therap Adv Gastroenterol 2011;4:169–176. [DOI] [PMC free article] [PubMed] [Google Scholar]
- 20).Shen H, Lipka S, Kumar A, Musttachia P. Association between nonalcoholic fatty liver disease and colorectal adenoma: a systemic review and meta-analysis. J Gastrointest Oncol 2014;5:440–446. [DOI] [PMC free article] [PubMed] [Google Scholar]
- 21).Singh V, Yeoh BS, Chassaing B, Xiao X, Saha P, Olvera RA, et al. Dysregulated microbial fermentation of soluble fiber induces cholestatic liver cancer. Cell 2018;175:679–694.e22. [DOI] [PMC free article] [PubMed] [Google Scholar]
- 22).Dam-Larsen S, Becker U, Franzmann MB, Larsen K, Christoffersen P, Bendtsen F. Final results of a long-term, clinical follow-up in fatty liver patients. Scand J Gastroenterol 2009;44:1236–1243. [DOI] [PubMed] [Google Scholar]
- 23).Simon TG, Roelstraete B, Khalili H, Hagström H, Ludvigsson JF. Mortality in biopsy-confirmed nonalcoholic fatty liver disease: results from a nationwide cohort. Gut 2020; doi: 10.1136/gutjnl-2020-322786. [DOI] [PMC free article] [PubMed] [Google Scholar]
- 24).Hagstrom H, Thiele M, Roelstraete B, Söderling J, Ludvigsson JF. Mortality in biopsy-proven alcohol-related liver disease: a population-based nationwide cohort study of 3453 patients. Gut 2021;70:170–179. [DOI] [PubMed] [Google Scholar]
- 25).Ludvigsson JF, Andersson E, Ekbom A, Feychting M, Kim J-L, Reuterwall C, et al. External review and validation of the Swedish national inpatient register. BMC Public Health 2011;11:450. doi: 10.1186/1471-2458-11-450. [DOI] [PMC free article] [PubMed] [Google Scholar]
- 26).Simon TG, King LY, Chong DQ, Nguyen LH, Ma Y, VoPham T, et al. Diabetes, metabolic comorbidities, and risk of hepatocellular carcinoma: results from two prospective cohort studies. Hepatology 2018;67:1797–1806. [DOI] [PMC free article] [PubMed] [Google Scholar]
- 27).Simon TG, Ma Y, Ludvigsson JF, Chong DQ, Giovannucci EL, Fuchs CS, et al. Association between aspirin use and risk of hepatocellular carcinoma. JAMA Oncol 2018;4:1683–1690. [DOI] [PMC free article] [PubMed] [Google Scholar]
- 28).Svensk Förening för Patologi – Svensk Förening för Klinisk Cytologi V. http://www.svfp.se/foreningar/uploads/L15178/kvast/lever/Leverbiopsier2019.pdf. Published April 4, 2019. Accessed November 1, 2019.
- 29).Ludvigsson JF, Almqvist C, Bonamy AK, Ljung R, Michaëlsson K, Neovius M, et al. Registers of the Swedish total population and their use in medical research. Eur J Epidemiol 2016;31:125–136. [DOI] [PubMed] [Google Scholar]
- 30).Barlow L, Westergren K, Holmberg L, Talbäck M. The completeness of the Swedish Cancer Register: a sample survey for year 1998. Acta Oncol 2009;48:27–33. [DOI] [PubMed] [Google Scholar]
- 31).Brooke HL, Talback M, Hornblad J, Johansson LA, Ludvigsson JF, Druid H, et al. The Swedish cause of death register. Eur J Epidemiol 2017;32:765–773. [DOI] [PMC free article] [PubMed] [Google Scholar]
- 32).Ludvigsson JF, Svedberg P, Olen O, Bruze G, Neovius M. The Longitudinal Integrated Database for Health Insurance and Labour Market Studies (LISA) and its use in medical research. Eur J Epidemiol 2019;34:423–437. [DOI] [PMC free article] [PubMed] [Google Scholar]
- 33).Wettermark B, Hammar N, Fored CM, Leimanis A, Olausson PO, Bergman U, et al. The new Swedish Prescribed Drug Register: opportunities for pharmacoepidemiological research and experience from the first six months. Pharmacoepidemiol Drug Saf 2007;16:726–735. [DOI] [PubMed] [Google Scholar]
- 34).Austin PC, Fine JP. Practical recommendations for reporting Fine-Gray model analyses for competing risk data. Stat Med 2017;36:4391–4400. [DOI] [PMC free article] [PubMed] [Google Scholar]
- 35).Kleiner DE, Brunt EM, Van Natta M, Behling C, Contos MJ, Cummings OW, et al. Design and validation of a histological scoring system for nonalcoholic fatty liver disease. Hepatology 2005;41:1313–1321. [DOI] [PubMed] [Google Scholar]
- 36).Torner A, Stokkeland K, Svensson A, Dickman PW, Hultcrantz R, Montgomery S, et al. The underreporting of hepatocellular carcinoma to the Cancer Register and a log-linear model to estimate a more correct incidence. Hepatology 2017;65:885–892. [DOI] [PubMed] [Google Scholar]
- 37).Schneeweiss S Sensitivity analysis and external adjustment for unmeasured confounders in epidemiologic database studies of therapeutics. Pharmacoepidemiol Drug Saf 2006;15:291–303. [DOI] [PubMed] [Google Scholar]
- 38).Esposito K, Capuano A, Giugliano D. Metabolic syndrome and cancer: holistic or reductionist? Endocrine 2014;45:362–364. [DOI] [PubMed] [Google Scholar]
- 39).Esposito K, Chiodini P, Colao A, Lenzi A, Giugliano D. Metabolic syndrome and risk of cancer: a systematic review and meta-analysis. Diabetes Care 2012;35:2402–2411. [DOI] [PMC free article] [PubMed] [Google Scholar]
- 40).White DL, Kanwal F, El-Serag HB. Association between nonalcoholic fatty liver disease and risk for hepatocellular cancer, based on systematic review. Clin Gastroenterol Hepatol 2012;10:1342–1359.e2. [DOI] [PMC free article] [PubMed] [Google Scholar]
- 41).Kawamura Y, Arase Y, Ikeda K, Seko Y, Imai N, Hosaka T, et al. Large-scale long-term follow-up study of Japanese patients with non-alcoholic fatty liver disease for the onset of hepatocellular carcinoma. Am J Gastroenterol 2012;107:253–261. [DOI] [PubMed] [Google Scholar]
- 42).Perumpail RB, Wong RJ, Ahmed A, Harrison SA. Hepatocellular carcinoma in the setting of non-cirrhotic nonalcoholic fatty liver disease and the metabolic syndrome: US experience. Dig Dis Sci 2015;60:3142–3148. [DOI] [PubMed] [Google Scholar]
- 43).Bengtsson B, Stal P, Wahlin S, Björkström NK, Hagström H. Characteristics and outcome of hepatocellular carcinoma in patients with NAFLD without cirrhosis. Liver Int 2019;39:1098–1108. [DOI] [PubMed] [Google Scholar]
- 44).Marrero JA, Kulik LM, Sirlin CB, Zhu AX, Finn RS, Abecassis MM, et al. Diagnosis, staging, and management of hepatocellular carcinoma: 2018 practice guidance by the American Association for the Study of Liver Diseases. Hepatology 2018;68:723–750. [DOI] [PubMed] [Google Scholar]
- 45).Loomba R, Lim JK, Patton H, El-Serag HB. AGA clinical practice update on screening and surveillance for hepatocellular carcinoma in patients with nonalcoholic fatty liver disease: expert review. Gastroenterology 2020;158:1822–1830. [DOI] [PMC free article] [PubMed] [Google Scholar]
- 46).Cucchetti A, Cescon M, Erroi V, Pinna AD. Cost-effectiveness of liver cancer screening. Best Pract Res Clin Gastroenterol 2013;27:961–972. [DOI] [PubMed] [Google Scholar]
- 47).Goetzel RZ, Kent K, Henke RM, Pack C, D’Arco M, Thomas J, et al. Prevalence of metabolic syndrome in an employed population as determined by analysis of three data sources. J Occup Environ Med 2017;59:161–168. [DOI] [PubMed] [Google Scholar]
- 48).Angulo P, Kleiner DE, Dam-Larsen S, Adams LA, Bjornsson ES, Charatcharoenwitthaya P, et al. Liver fibrosis, but no other histologic features, is associated with long-term outcomes of patients with nonalcoholic fatty liver disease. Gastroenterology 2015;149:389–397.e10. [DOI] [PMC free article] [PubMed] [Google Scholar]
- 49).Ekstedt M, Hagstrom H, Nasr P, Fredrikson M, Stål P, Kechagias S, et al. Fibrosis stage is the strongest predictor for disease-specific mortality in NAFLD after up to 33 years of follow-up. Hepatology 2015;61:1547–1554. [DOI] [PubMed] [Google Scholar]
- 50).Hagstrom H, Nasr P, Ekstedt M, Hammar U, Stål P, Hultcrantz R, et al. Fibrosis stage but not NASH predicts mortality and time to development of severe liver disease in biopsy-proven NAFLD. J Hepatol 2017;67:1265–1273. [DOI] [PubMed] [Google Scholar]
Associated Data
This section collects any data citations, data availability statements, or supplementary materials included in this article.
Supplementary Materials
Supporting FIG. S1. Annual HCC incidence rates according to NAFLD histology and clinical factors. (For definitions of NAFLD histological groups, see Supporting Methods.)*HCC surveillance in patients with NAFLD is considered cost-effective if the annual incidence rate meets or exceeds 1.5% per year (95% CI, 0.8–2.3),(46) as outlined in the Discussion. Abbreviations: CI, confidence interval; HCC, hepatocellular carcinoma; NAFLD, nonalcoholic fatty liver disease; NASH, nonalcoholic steatohepatitis.