

Abstract
Organ size is maintained by the controlled proliferation of distinct cell populations. In the mouse liver, hepatocytes in the midlobular zone that are positive for cyclin D1 (CCND1) repopulate the parenchyma at a constant rate to preserve liver mass. Here, we investigated how hepatocyte proliferation is supported by hepatic stellate cells (HSCs), pericytes that are in close proximity to hepatocytes. We used T cells to ablate nearly all HSCs in the murine liver, enabling the unbiased characterization of HSC functions. In the normal liver, complete loss of HSCs persisted for up to 10 weeks and caused a gradual reduction in liver mass and in the number of CCND1+ hepatocytes. We identified neurotrophin-3 (Ntf-3) as an HSC-produced factor that induced the proliferation of midlobular hepatocytes through the activation of tropomyosin receptor kinase B (TrkB). Treating HSC-depleted mice with Ntf-3 restored CCND1+ hepatocytes in the midlobular region and increased liver mass. These findings establish that HSCs form the mitogenic niche for midlobular hepatocytes and identify Ntf-3 as a hepatocyte growth factor.
Introduction
Metabolic liver zonation is critical for liver function (1). The liver is organized into functional units, liver lobules, in which hepatocytes are arranged along specialized capillaries (liver sinusoids) that connect branches of the liver hepatic artery and the portal vein to the central veins. The hepatocytes express specific subsets of metabolic genes according to their position along the sinusoid. Traditionally, the numbering of liver zones follows the direction of the hepatic blood flow, from the periportal (zone 1) to the midlobular (zone 2) to the pericentral (zone 3) hepatocytes. Single-cell RNA-sequencing (scRNA-seq) and spatial sorting experiments in healthy and injured livers have further refined the three liver zones into 9 lobular regions that show a gradient of metabolic specialization across these regions, reinforcing the importance of zonation to liver function (2–5).
In healthy liver, only a subset of hepatocytes proliferates at any given time to steadily replenish and maintain a defined organ size and hepatocellular mass. The cellular source of repopulating hepatocytes in this context has been debated (6–10), but studies using sophisticated labeling approaches provide strong evidence that midlobular zone 2 hepatocytes proliferate to maintain liver homeostasis (10–13). Central to this finding is cyclin D1 (CCND1), a cell cycle protein that promotes progression from G1 to S phase (14). CCND1 is present and constitutively nuclear in most midlobular hepatocytes, and a small subset of CCND1+ midlobular hepatocytes are proliferating at any given time. Hepatocyte-specific deletion of CCND1 leads to loss of proliferation in midlobular hepatocytes (13), and acute deletion of CCND1 delays liver regeneration (15), underscoring the pivotal role of CCND1+ midlobular hepatocytes in both maintaining the hepatocyte population and restoring it after injury.
Although advanced models have provided more insight into the source of proliferating hepatocytes during homeostasis (10–13), little is known about the cues determining this process and the mitogenic signals driving hepatocyte proliferation in zone 2 (16, 17). Hepatic stellate cells (HSCs) are the liver’s pericytes and reside in the space of Disse in direct contact with hepatocytes. Because HSCs remain quiescent in the healthy liver but differentiate into fibrogenic myofibroblasts upon liver injury (18), much research has focused on their fibrogenic properties and mechanisms of activation rather than on their role in liver homeostasis (19). Well defined models of liver regeneration, such as partial liver resection in rodents, have clarified that HSCs activate and release growth factors including Wnt9a (20), hepatocyte growth factor (HGF) (21), vascular endothelial growth factor (VEGF) (22) and many others (23–26) that promote proliferation and differentiation of hepatocytes, liver sinusoidal endothelial cells (LSECs) and other liver cells (16, 19). To reconstitute liver mass, activated HSCs synthesize the complex hepatic extracellular matrix (ECM) (27), promote angiogenesis (28), and induce hepatocyte proliferation (16). Consequently, rodent models with blunted HSC activation have impaired liver regeneration (29–32). In healthy livers, HSCs are quiescent, vitamin-A-storing cells that contribute to the turnover and maintenance of the complex hepatic extracellular matrix (ECM)(33, 34) and regulate the sinusoidal blood flow (35). Therefore, it is conceivable, that quiescent HSCs contribute to liver homeostasis and liver zonation, which is important for liver function (20, 21, 23–26). However, disruption of Wnt secretion from HSCs does not alter zonation, liver proliferation, or fibrosis (36). Similarly, deletion of HGF in HSCs does not abrogate tumorigenesis in a murine model of cholangiocarcinoma, a liver cancer arising from biliary epithelial cells (37), although consequences on liver homeostasis and liver zonation were not described.
Here, we established a highly efficient, T cell–mediated HSC ablation model that allows for removal of nearly all quiescent HSCs in healthy murine livers. A single administration of T cells led to sustained HSC depletion for up to 10 weeks and led to a gradual loss in liver mass indicating impaired liver homeostasis. Our analyses showed decreased CCND1 expression in midlobular hepatocytes and an alteration in liver zonation in HSC-depleted mice. We identified neurotrophin-3 (NTF3) as an HSC-derived growth factor, that stabilizes CCND1 and induces hepatocyte proliferation through activation of tropomyosin kinase receptor B (TRKB). Our studies underscore the role of quiescent HSCs in maintaining liver zonation and liver mass.
Results
Jedi T cells deplete eGFP-expressing HSCs in vivo
Agudo and colleagues engineered mice to make T cells that specifically target cells displaying enhanced green fluorescent protein (eGFP) (38, 39). These just eGFP death-inducing (Jedi) mice produce T cells bearing a T cell receptors (TCR) specific for the immunodominant epitope of eGFP presented by MHC class I (MHC-I) (38, 39). Adoptive transfer of Jedi T cells into an eGFP reporter mouse with the same MHC-I haplotype H-2Kd efficiently ablates eGFP+ cells within days (38, 39). Single-cell RNA sequencing (scRNA-seq) analyses from human and mouse livers have revealed the heterogeneity and spatial zonation of HSCs (40–44). Because analysis of published scRNA-seq datasets showed high expression and specificity of platelet-derived growth factor receptor β (Pdgfrb) in HSCs in both injured and healthy livers (fig. S1), we used Pdgfrb-BAC-eGFP transgenic mice (henceforth called Pdgfrb-GFP), which express eGFP in HSCs (41, 45). Immunostaining for GFP in livers of Pdgfrb-GFP mice showed staining only in small non-parenchymal cells (Fig. 1A, fig. S2A), and coimmunofluorescence analysis for GFP and desmin, one of the most reliable markers for HSCs in mouse liver (46), confirmed HSC-specific GFP expression (Fig. 1B). Primary HSCs isolated from Pdgfrb-GFP mice also coexpressed desmin and GFP (fig. S2B). We did not observe coexpression of GFP with markers of Kupffer cells (F4/80), liver sinusoidal endothelial cells (CD31/PECAM1), or hepatocytes (HNF4α) (fig. S2C), indicating that, in the liver, GFP was expressed only in HSCs.
Fig. 1. Jedi T cells deplete HSCs.

(A) Representative immunohistochemical staining for GFP of Pdgfrb-GFP adult mouse liver. PV, portal vein; CV, central vein. Scale bar, 50 μm. n = 10 mice. (B) Immunofluorescence microscopy of liver section from Pdgfrb-GFP transgenic mice for GFP and desmin. Scale bar, 20 μm. n = 10 mice. (C) Experimental scheme. (D) Macroscopic liver images of control and HSC-depleted mice. Scale bar, 5 mm. (E) Liver-to-body weight ratios of control and HSC-depleted mice. Mean+SD. n=8 mice per group. (F and G) Immunofluorescence microscopy of liver sections from control and HSC-depleted mice for desmin (F) and GFP (G). Nuclei are stained with DAPI. Squares indicate areas of enlargement. Scale bars, 100 μm (lower magnification) and 20 μm (enlargements in F) and 50 μm (enlargements in G). n = 10 mice per group. (H) Quantification of desmin+ tissue area in control and HSC-depleted mice. Mean+SD. n=5 mice per group. (I and J) qRT-PCR for Des (I) and Pdgfrb (J) expression in whole-liver RNA. Mean+SD. n=5 mice per group. (K) H&E staining of sections of control and HSC-depleted livers. Scale bar, 50 μm. Arrows indicate examples of sinusoids. (L) Serum ALT in control and HSC-depleted mice. Mean+SD. n=10 control and 7 HSC-depleted mice. *p< 0.05, **p< 0.01, by unpaired two-tailed Mann-Whitney t-test.
Adoptive transfer of Jedi T cells isolated from Jedi mice, but not control T cells from H-2Kd control mice, almost completely ablated HSCs within 10 days in Pdgfrb-GFP mice (Fig. 1, C to J). Livers appeared macroscopically normal, and HSC-depleted mice displayed a similar liver-to-body weight ratio as control mice at this time point (Fig. 1, D and E). No cells positive for GFP or the HSC markers desmin (DES), reelin, or glial fibrillary acidic protein (GFAP), could be detected by immunofluorescence, indicating efficient ablation of HSCs (Fig. 1F and G; fig. S2D and E). Quantification of the desmin+ area by tissue morphometry revealed significantly fewer HSCs in HSC-ablated livers (Fig. 1H), a result that was confirmed by measuring Des and Pdgfrb gene expression in whole liver RNA by qRT-PCR (Fig. 1I and J). By hematoxylin and eosin (H&E) staining, sinusoids were slightly distended (Fig. 1K). Serum alanine aminotransferase (ALT) was increased (Fig. 1L), an indication of discrete hepatocyte injury, likely resulting from a transient, reversible increase in ALT due to T cell-induced cytokine release, similar to what is seen after chimeric antigen receptor (CAR) T cell administration in patients (47, 48). Serum measurements of total bilirubin and alkaline phosphatase (ALP) (fig. S3A and B) were comparable in control and HSC-depleted mice. Serum albumin concentration was decreased in HSC-depleted mice (fig. S3C), but gene expression analysis for albumin and coagulation factors synthesized by the liver were similar in control and HSC-depleted mice (fig. S3C and D).
Although Jedi T cells were readily detectable in the liver by staining for granzyme B, a CD8+ T cell marker, at 3 days after adoptive transfer, no Jedi T cells were detected at 10 days or up to 6 weeks after adoptive transfer (fig. S3E). Similarly, we detected no Jedi TCRa or TCRb mRNA expression by whole liver RNA-seq at 10 days. These observations agree with earlier reports in which Jedi T cells become undetectable 2–3 weeks after adoptive transfer (38, 39). In summary, these results demonstrate efficient ablation of HSCs with no detectable Jedi T cells following days after adoptive transfer in liver indicating that subsequent liver changes are due to ablation of HSCs rather than indirect effects of persistent Jedi T cells.
Sustained HSC depletion causes loss of liver mass and reduces the number of midlobular hepatocytes
We sacrificed mice 6 weeks and 10 weeks after HSC ablation (Fig. 2A, fig. S5A) and found no evidence of desmin+ or GFP+ HSCs (Fig. 2B; fig. S4A; fig. S5F and G), indicating that HSCs were completely depleted for up to 10 weeks. Macroscopic inspection showed smaller livers in HSC-depleted mice (Fig. 2C), which was supported by measurements of body and liver weights (Fig. 2D; fig. S4, B and C; fig. S5, B to D). Serum ALT amounts were similar in control and HSC-depleted mice 10 weeks after depletion (fig. S5E). Although body weights were similar among both HSC-depleted and control (vehicle-only injection) groups immediately after HSC depletion (10 days) (Fig. 1E), we observed a significant decrease in the liver-to-body weight ratio of up to ~45% after sustained HSC depletion (6 weeks and 10 weeks after HSC-depletion). Mean liver/body weight ratios were 3.94% vs. 3.05% and 4.38% vs. 3.19% at 6 weeks and 10 weeks after HSC depletion, respectively (Fig. 2D; fig. S5B). Liver-to-body weight ratios decreased by ~22.5% at 6 weeks after HSC depletion and by ~27.1% at 10 weeks, suggesting a progressive liver mass loss with sustained HSC depletion. H&E staining showed distended sinusoids and an increase in acellular areas reminiscent of large hepatic vessels (Fig. 2, E and F; fig. S4E). However, based on immunostaining with the endothelial cell marker CD31/PECAM1, these structures were not lined by endothelial cells (Fig. 2G) and thus acellular cavities. These cavities (annotated with blue circles) were consistently localized between central veins (yellow circles) and portal veins (green circles) within the midlobular zone 2 of the hepatic lobule. (Fig. 2H; fig. S4E).
Fig. 2. HSC depletion decreases liver mass and diminishes midlobular hepatocyte numbers.
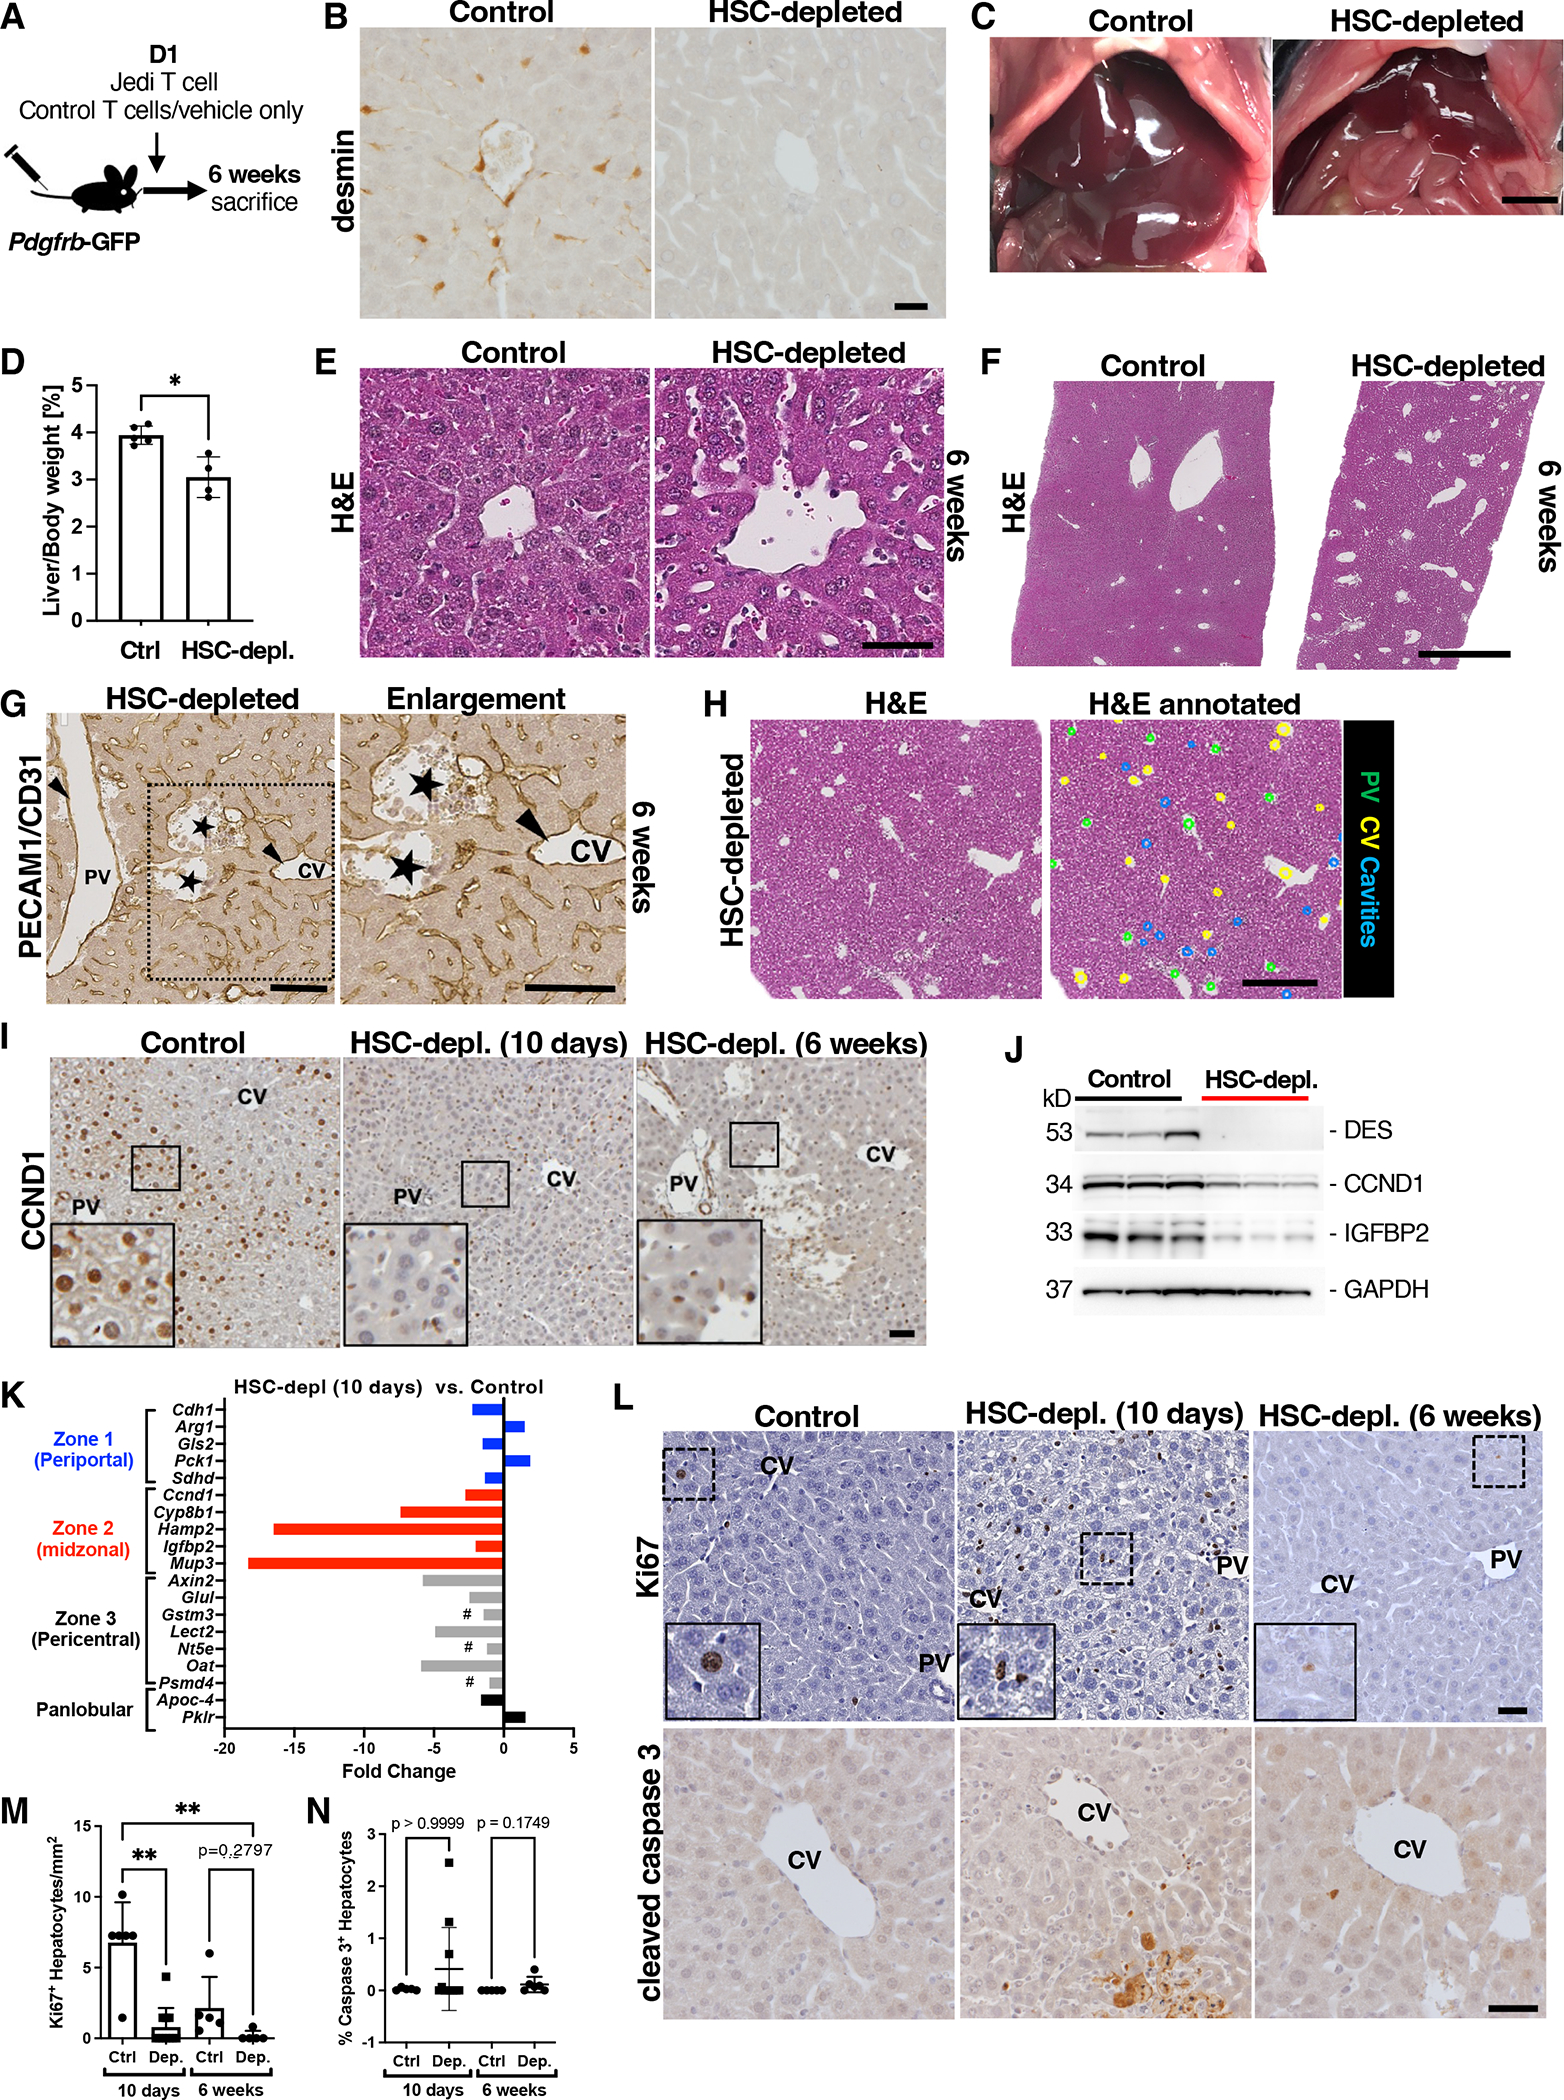
(A) Experimental scheme. (B) Immunohistochemical staining for desmin in control and HSC-depleted mice 6 weeks after adoptive transfer. Scale bar, 20 μm. n = 5. (C) Macroscopic images of control and HSC-depleted mouse livers in situ. Scale bar, 5 mm. (D) Liver-to-body weight ratios of control and HSC-depleted mice at 6 weeks. N=5 control and 4 HSC-depleted animals. *p<0.05 by unpaired two-tailed Mann-Whitney test. (E and F) High- and low-magnification of H&E staining of control and HSC-depleted livers 6 weeks after adoptive transfer. Scale bars, 50 μm (E) and 1 mm (F). n = 5 control and 5 HSC-depleted mice. (G) Immunohistochemical staining for CD31 in an HSC-depleted liver section. Arrows indicate endothelial lining of vessels. PV, portal vein; CV central vein. Stars indicate acellular cavities with absent endothelium. Square indicates area of enlargement. Scale bars, 100 μm. Image is representative of 5 mice. (H) H&E staining of HSC-depleted liver section at 6 weeks. In the annotated image, green dots indicate portal vein (PV), yellow dots central vein (CV), and blue dots acellular cavities. Scale bar, 500 μm. n = 5. (I) Immunohistochemical staining for CCND1 in control and HSC-depleted livers at 10 days and 6 weeks after adoptive transfer. Squares indicate areas of enlargement in inserts. Scale bar, 50 μm. n = 6 control and 11 HSC-depleted mice at 10 days after adoptive transfer. n=5 control and n=5 HSC-depleted mice 6 weeks after adoptive transfer. (J) Western blot showing desmin, CCND1, and IGFBP2 in whole-liver lysates from control and HSC-depleted livers 10 days after adoptive transfer. Gapdh is a loading control. Each lane represents 1 mouse. n = 3 control and 3 HSC-depleted mice. (K) Whole-liver RNA-seq analysis of control and HSC-depleted livers 10 days after adoptive transfer. n=6 controls and 4 HSC-depleted mice. #, non-differentially expressed genes (FDR>0.34). (L) Immunohistochemical staining and quantification of Ki67 and cleaved caspase 3 in control and HSC-depleted livers at 10 days and 6 weeks after adoptive transfer. Scale bar, 30 μm. Dashed rectangles indicate areas of enlargement in inserts. PV, portal vein. CV, central vein. Ki67+ hepatocytes per mm2 in control and HSC-depleted livers at 10 days and 6 weeks after adoptive transfer. n=6 control and 11 HSC-depleted animals at 10 days after adoptive transfer. n = 5 control and 5 HSC-depleted animals at 6 weeks after adoptive transfer. Mean+SD. Kruskal-Wallis with post hoc Dunn’s test. **p<0.005.
Several studies have established the role of midlobular zone 2 hepatocytes in maintaining liver homeostasis and liver mass in healthy livers (10–13). Central to this process is CCND1, which is constitutively expressed in most midlobular hepatocytes and critical for their proliferation (13). We thus investigated liver zonation and expression of CCND1 in HSC-depleted livers and control livers. As expected, control livers showed strong nuclear staining in midlobular zone 2 hepatocytes. By contrast, there was a substantial decrease in nuclear hepatocyte CCND1 staining 10 days after HSC ablation, and staining remained low for up to 10 weeks after HSC ablation (Fig. 2I; fig. S5H). The rapid decrease in CCND1 was confirmed by western blotting of whole liver lysates for CCND1, as well as for another zone 2 hepatocyte marker, insulin growth factor-binding protein 2 (IGFBP2) (13) (Fig. 2J; fig. S4, H to J). Marked reduction in genes characteristic for zone 2 hepatocytes was also apparent by liver transcriptome analysis assessed at 10 days after HSC ablation. Based on whole liver RNA-seq analysis, there was a greater (up to −18.3-fold) and more consistent decrease in marker genes (2, 13, 49, 50) for zone 2 hepatocytes (Hamp2, Cyp8b1, Mup3, Ccnd1 and Igfbp2) than in genes characteristic for zone 3 (Axin2, Lect2, Oat, Nt5e, Glul), or zone 1 (Gls2, Arg1, Cdh1) hepatocytes or in panlobular genes (Apoc4, Pklr) (Fig. 2K, Fig. S4D). Whereas the zone 3 genes Axin2 and Glul were significantly decreased (−5.8-fold and −2.5-fold, respectively, FDR<0.01), other zone 3 hepatocyte genes (Gstm3, Nt5e and Psmd4) were not differentially expressed (Fig. 2D; fig. S4D). Gene expression analysis for signaling and metabolic pathways in HSC-depleted livers compared to control livers in KEGG, BioCarta, and Reactome signatures (FDR<0.1) showed decreases in Wnt-β-catenin signaling, hedgehog signaling, and transforming growth factor β (TGF-β) signaling, and decreases in insulin receptor signaling, amino acid metabolism, and cytochrome P450 metabolism, some of which are to be expected, given the metabolic function of midlobular hepatocytes (51) and HSC-derived growth factor signaling pathways (52) (Data file S1). Even though gene expression analyses suggested that metabolic zonation was affected by HSC depletion, we observed stable expression of both glutamine synthetase (GS), a pericentral marker and Wnt-β-catenin target (53, 54), and E-cadherin, a periportal marker, at 10 days and 6 weeks after HSC depletion (fig. S4F and G). At 10 weeks after HSC depletion, E-cadherin staining was preserved but the number of GS-positive hepatocytes was decreased compared to controls (fig. S5H). Because staining for GS and E-cadherin or similar markers has been commonly used as an indicator of liver zonation, these findings suggest that zone 1 and zone 3 hepatocytes were preserved in HSC-depleted livers despite decreased Wnt-β-catenin signaling based on gene expression analysis. Our data suggest that assessment of these markers alone might not be sufficient to characterize liver zonation and that more detailed analyses are required.
The liver’s size is tightly controlled, and loss in liver mass —such as by partial liver resection—elicits a robust regenerative response. Thus, the loss in liver mass and decrease in midlobular CCND1 expression led us to investigate whether the regenerative response was impaired. Indeed, staining for the proliferation marker Ki67 showed a lack of proliferating hepatocytes at both 10 days and 6 weeks after HSC depletion (Fig. 2, L and M). Immunostaining for cleaved caspase 3, an apoptosis marker, showed positive hepatocyte staining in some mice though the increase was not significant and observed only in some HSC-depleted mice (n=3 out of 11 animals) (Fig. 2, L and N). In summary, our results suggest that HSCs are critical for maintaining midlobular hepatocyte CCND1 expression and liver mass.
HSC-derived NTF-3 induces CCND1 and is a hepatocyte mitogen
To investigate proteomic changes due to HSC ablation, we assessed whole liver protein lysates from control and HSC-depleted livers using the Olink mouse exploratory assay, which employs proximity extension assay technology for protein biomarker analysis of 92 proteins involved in diverse cellular processes (55). The Olink analysis separated control and HSC-depleted livers harvested 10 days after depletion into two clearly distinct groups (Fig. 3A and B; Data file S2). In total, we found robust differences in 46 proteins between depleted and control livers, with amounts of 30 proteins higher and 16 proteins lower in HSC-depleted than in control livers (adjusted p-value <0.05). HGF was among the proteins expressed in lower amounts, which was expected, given that it is produced and released by both HSCs and liver sinusoidal endothelial cells. Among the reduced proteins with a less well-established role in HSCs was neurotrophin-3 (NTF3) (Fig. 3C), a member of the nerve growth factor family HSCs are known to express genes encoding both neuronal and glial proteins such as GFAP and nerve growth factor receptor [NGFR, also known as p75NTR and tumor necrosis factor receptor superfamily member 16 (TNFR16)]. Although it has been long known that HSCs express NTF3 (56), its paracrine function in the liver remains largely unexplored save for a report identifying NTF3 as an autocrine signaling pathway in HSCs that contributes to fibrosis (57). We confirmed that NTF3 is expressed in HSCs by analyses of three published mouse and human liver scRNA-seq datasets (3, 41, 43), which showed highly specific NTF3 expression in mesenchymal cells and HSCs (fig. S6A–C). Furthermore, our immunofluorescence analysis for NTF3 and desmin in mouse liver demonstrated pan-lobular expression in HSCs (Fig. 3D). Western blotting of mouse and human HSC cell lines JS1, LX2 and TWNT4 also showed robust NTF3 expression (Fig. 3E).
Fig. 3. NTF3 is an HSC-derived hepatocyte mitogen that increases CCND1.
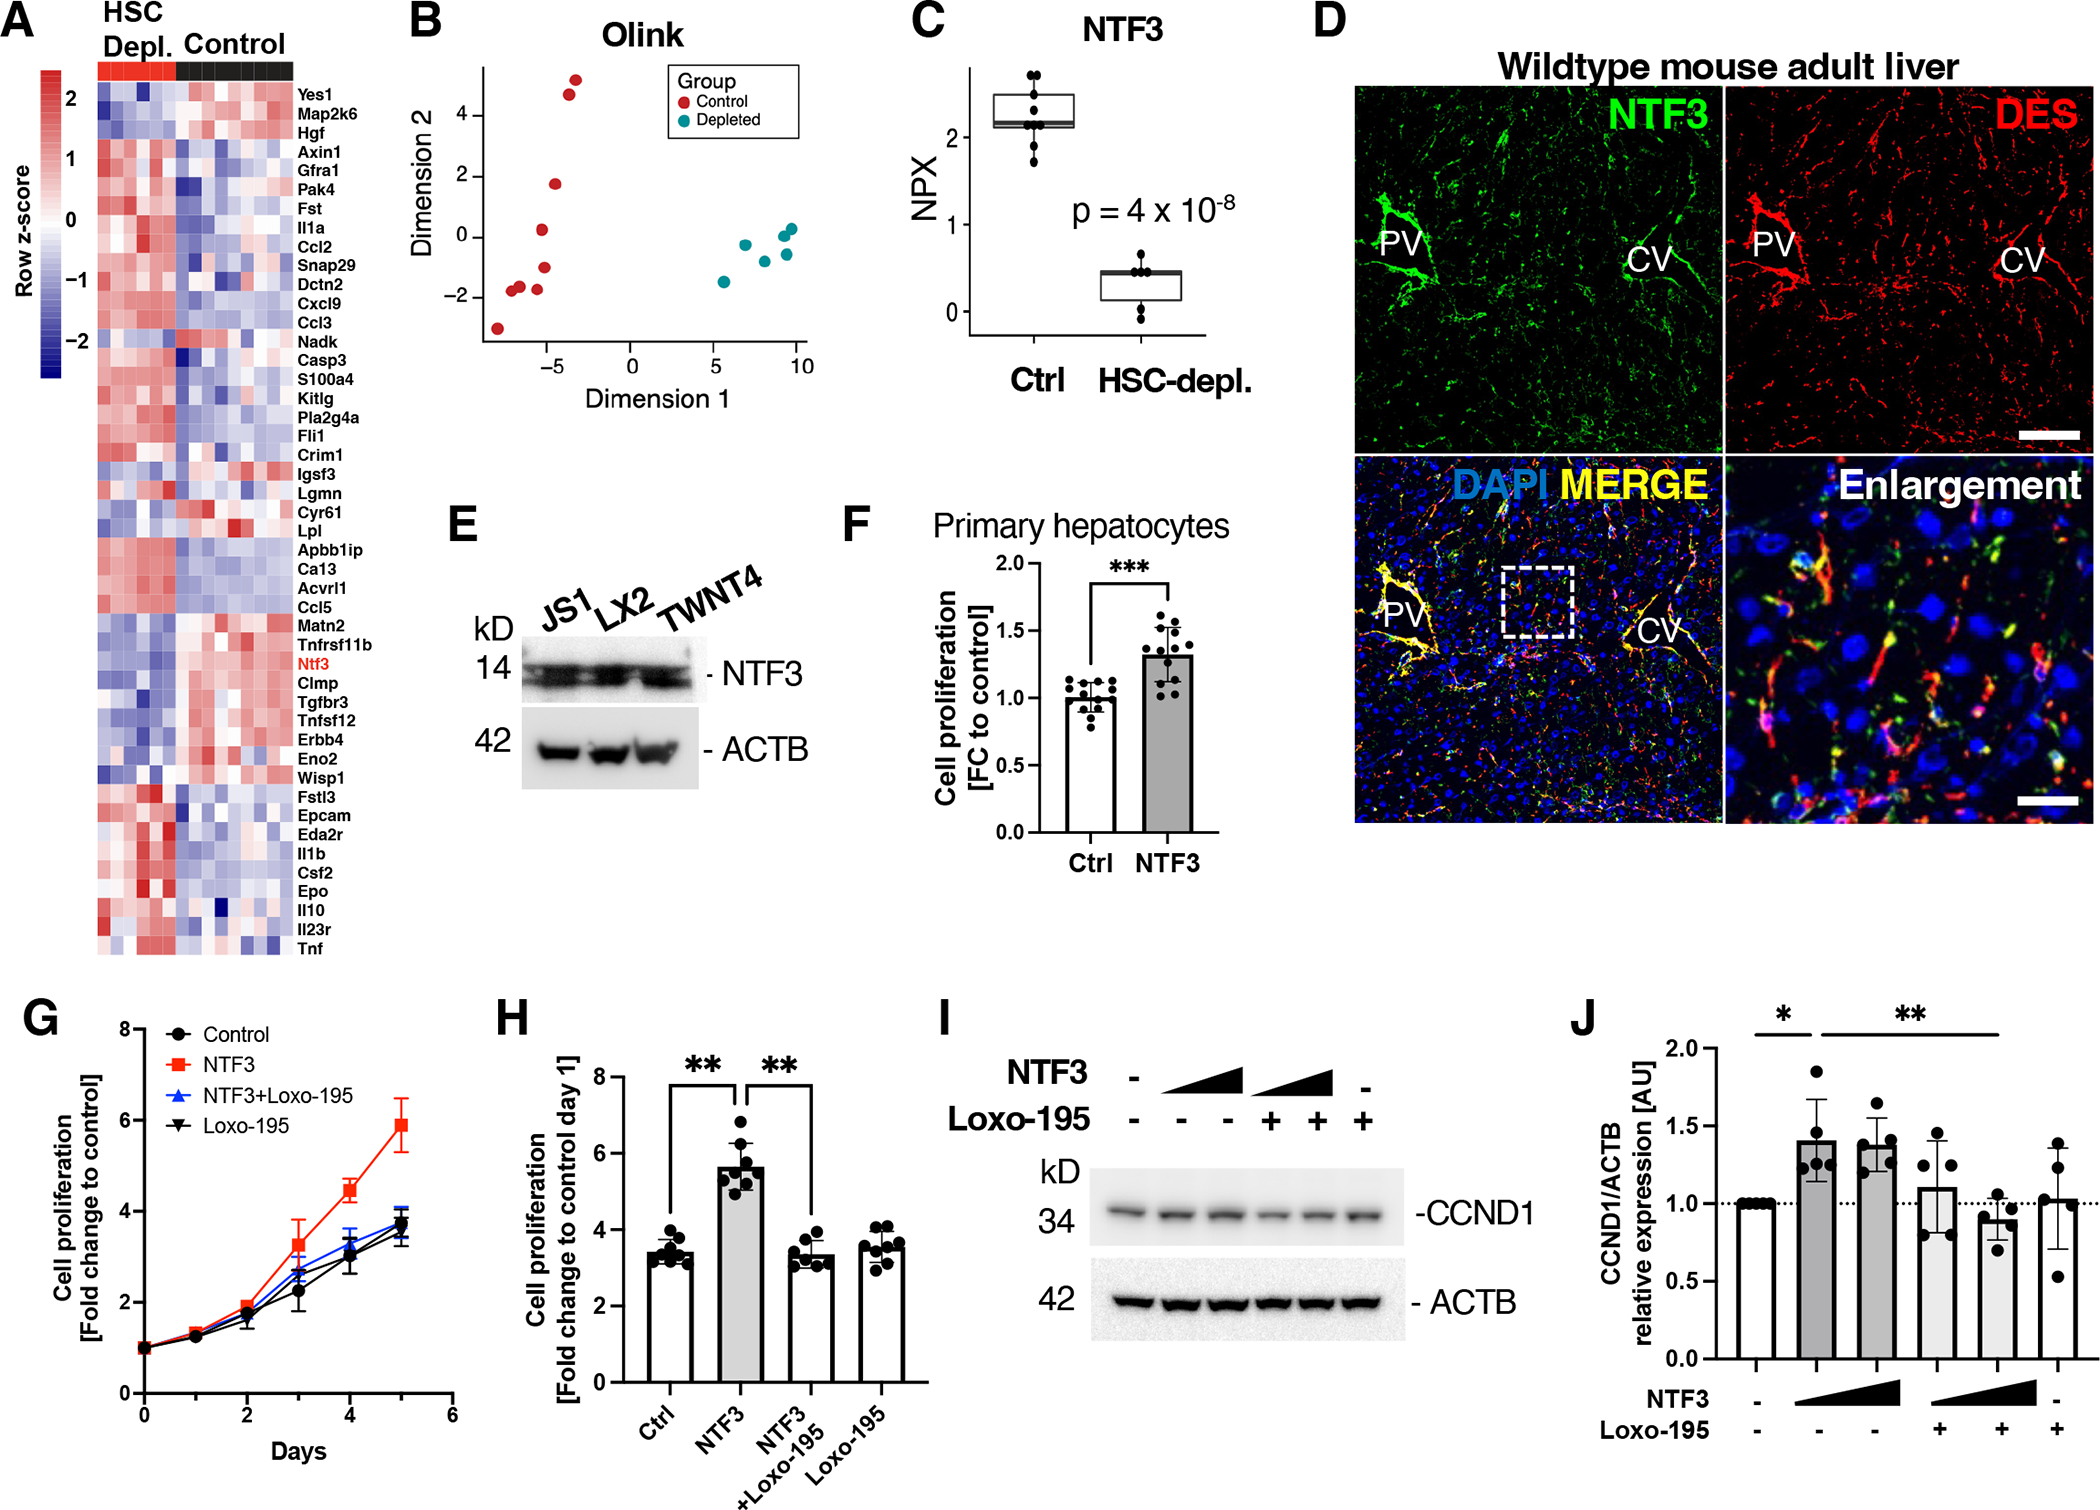
(A to C) Olink protein biomarker analysis (A), multidimensional scaling of Olink biomarker analysis (B), and quantification of NTF3 (C) in lysates from control and HSC-depleted livers 10 days after adoptive transfer. NPX, normalized protein expression. n=9 control and 6 HSC-depleted mice. (D) Immunofluorescence microscopy for NTF3 and desmin in wild-type adult mouse liver. Nuclei are stained with DAPI. Dashed rectangle indicates area of enlargement. Scale bar, 100 μm and 20 μm in enlargement. PV, portal vein. CV central vein. n = 5 mice. (E) Western blot of mouse and human HSC cell lines for NTF3. ACTB is a loading control. n = 3 independent experiments per cell line. (F) Proliferation of primary wild-type mouse hepatocytes after incubation with NTF3 (20 ng/ml) or vehicle in serum-free media for 5 days. Data from 3 independent experiments. Mean+SD. ***p=0.0002 by unpaired two-tailed Mann-Whitney test. (G) Cell proliferation analysis of HepG2 cells incubated with NTF3, NTF3+Loxo-195, Loxo-195, or vehicle only (control). n = 3 independent experiments. Mean+SD. (H) Proliferation of HepG2 cells treated with NTF3, NTF3+Loxo-195, Loxo-195, or vehicle only for 5 days. n = 3 independent experiments. Mean+SD. **p<0.005 by unpaired two-tailed Mann-Whitney test. (I and J) Western blot analysis and quantification of CCND1 in lysates from HepG2 cells treated with NTF3 and Loxo-195 as indicated or vehicle only. ACTB is a loading control. n = 5 independent experiments. Mean+SD. Kruskal Wallis with post hoc Dunn’s test. *p<0.05, **p<0.01.
The mature NTF3 protein is highly conserved in vertebrates, with the human and mouse orthologs sharing 96% amino acid identity. We therefore incubated freshly isolated primary mouse hepatocytes in serum-free (Fig. 3F) and in serum-containing media (fig. S6D) supplemented with recombinant NTF3 or vehicle control. We found that cell proliferation was significantly higher in NTF3-treated primary hepatocytes than in control-treated hepatocytes (Fig. 3F; fig. S6D). Similarly, NTF3 treatment of the mouse hepatocyte AML12 cell line (fig. S6, E and F) and the human HepG2 cell line (Fig. 3, G and H) greatly stimulated cell proliferation. NTF3 binds and activates the tropomyosin receptor kinases (TRKs) TRKA, TRKB, and TRKC, which are encoded by NTRK1–3 (58). Binding of NTF3 to a TRK induces autophosphorylation of the TRK and activation of downstream signaling pathways (58). Cancers with NTRK genes fusions express proteins that have constitutive receptor activity and are oncogenic drivers, rendering them therapeutically responsive to TRK inhibitors (59, 60). We thus investigated whether the highly specific TRKA and TRKC inhibitor, Loxo-195 (selectritinib) inhibited NTF3-induced hepatocyte proliferation. Indeed, Loxo-195 (final concentration 5 nM) significantly inhibited proliferation in AML12 and HepG2 cells, indicating that NTF3 induces cell proliferation through TRK signaling (Fig. 3G–H, fig. S6, E and F).
Because HSC depletion decreased hepatocyte CCND1 expression (Fig. 2I, J), we investigated whether NTF3 affected CCND1 abundance in culture. Incubation of HepG2 cells with NTF3 increased CCND1 abundance, which was inhibited by the addition of Loxo-195 (Fig. 3, I and J). We observed increased TRK phosphorylation at tyrosine residues in the activation loop of TRKA or TRKB (P-TRKATyr674/675, P-TRKB Tyr706/707) which were decreased by addition of Loxo-195 (fig. S3, G and H). These results were consistent using NTF3 from three different vendors; in all cases, CCND1 amounts increased in both AML12 and HepG2 cells (fig. S6, I to L). HGF is a potent hepatocyte mitogen that is secreted by HSCs and liver sinusoidal endothelial cells. We therefore compared proliferative effects of NTF3 to HGF in primary mouse hepatocytes (fig. S6M. HGF and NTF3 increased primary hepatocyte proliferation by 2.6 and 1.5-fold, respectively, indicating that HGF is a more potent mitogen than NTF3 at the tested concentrations. To assess if NTF3 is an additional factor that synergizes with HGF, we incubated primary hepatocytes with either NTF3, HGF or both growth factors, and found no synergistic effects at the tested concentrations (fig. S6N).
Exogenous NTF3 rescues CCND1 expression and increases liver mass in HSC-depleted mice
In our murine model, ablation of HSCs decreased nuclear CCND1 in midlobular hepatocytes (Fig. 2, I and J). To determine whether NTF3 is required for midlobular CCND1 expression, we assessed if in vivo administration of NTF3 increased hepatocyte proliferation and CCND1 expression in HSC-depleted mice. We induced HSC depletion and injected mice with NTF3 at 20 or 100 ng/g body weight or with vehicle control for 4 consecutive days, then sacrificed the mice after the last injection (Fig. 4, A and B). The liver-to-body weight ratio of mice treated with NTF3 dose-dependently increased with a significant increase in liver-to-body weight ratio in the higher dose group (Fig. 4C). As expected, in HSC-depleted mice treated with vehicle only, CCND1 was decreased in hepatocytes and there was some scattered CCND1 expression in non-parenchymal cells (Fig. 4D). NTF3 treatment of HSC-depleted mice increased nuclear CCND1 in hepatocytes in the midlobular region (Fig. 4D). To quantify CCND1 expression in hepatocytes, we assessed livers by multiplex immunohistochemistry for CCND1 and hepatocyte nuclear factor 4α (HNF4α), which is ubiquitously expressed in the nuclei of hepatocytes across the liver lobule and was retained in HSC-depleted mice (fig. S7A). Treatment with NTF3 dose-dependently increased the number of CCND1+HNF4α+ nuclei (Fig. 4, E and F). Similarly, we observed an increase in Ki67+ hepatocytes, consistent with increased regenerative activity in HSC-depleted mice (Fig. 4, G and H). Western blotting of whole liver lysates also confirmed that NTF3 treatment increased CCND1 and proliferating cell nuclear antigen (PCNA) in HSC-depleted mice, further indicating increased regenerative activity (Fig. 4I; fig. S7B and B).
Fig. 4. Recombinant NTF3 increases hepatocyte CCND1 in HSC-depleted mice.
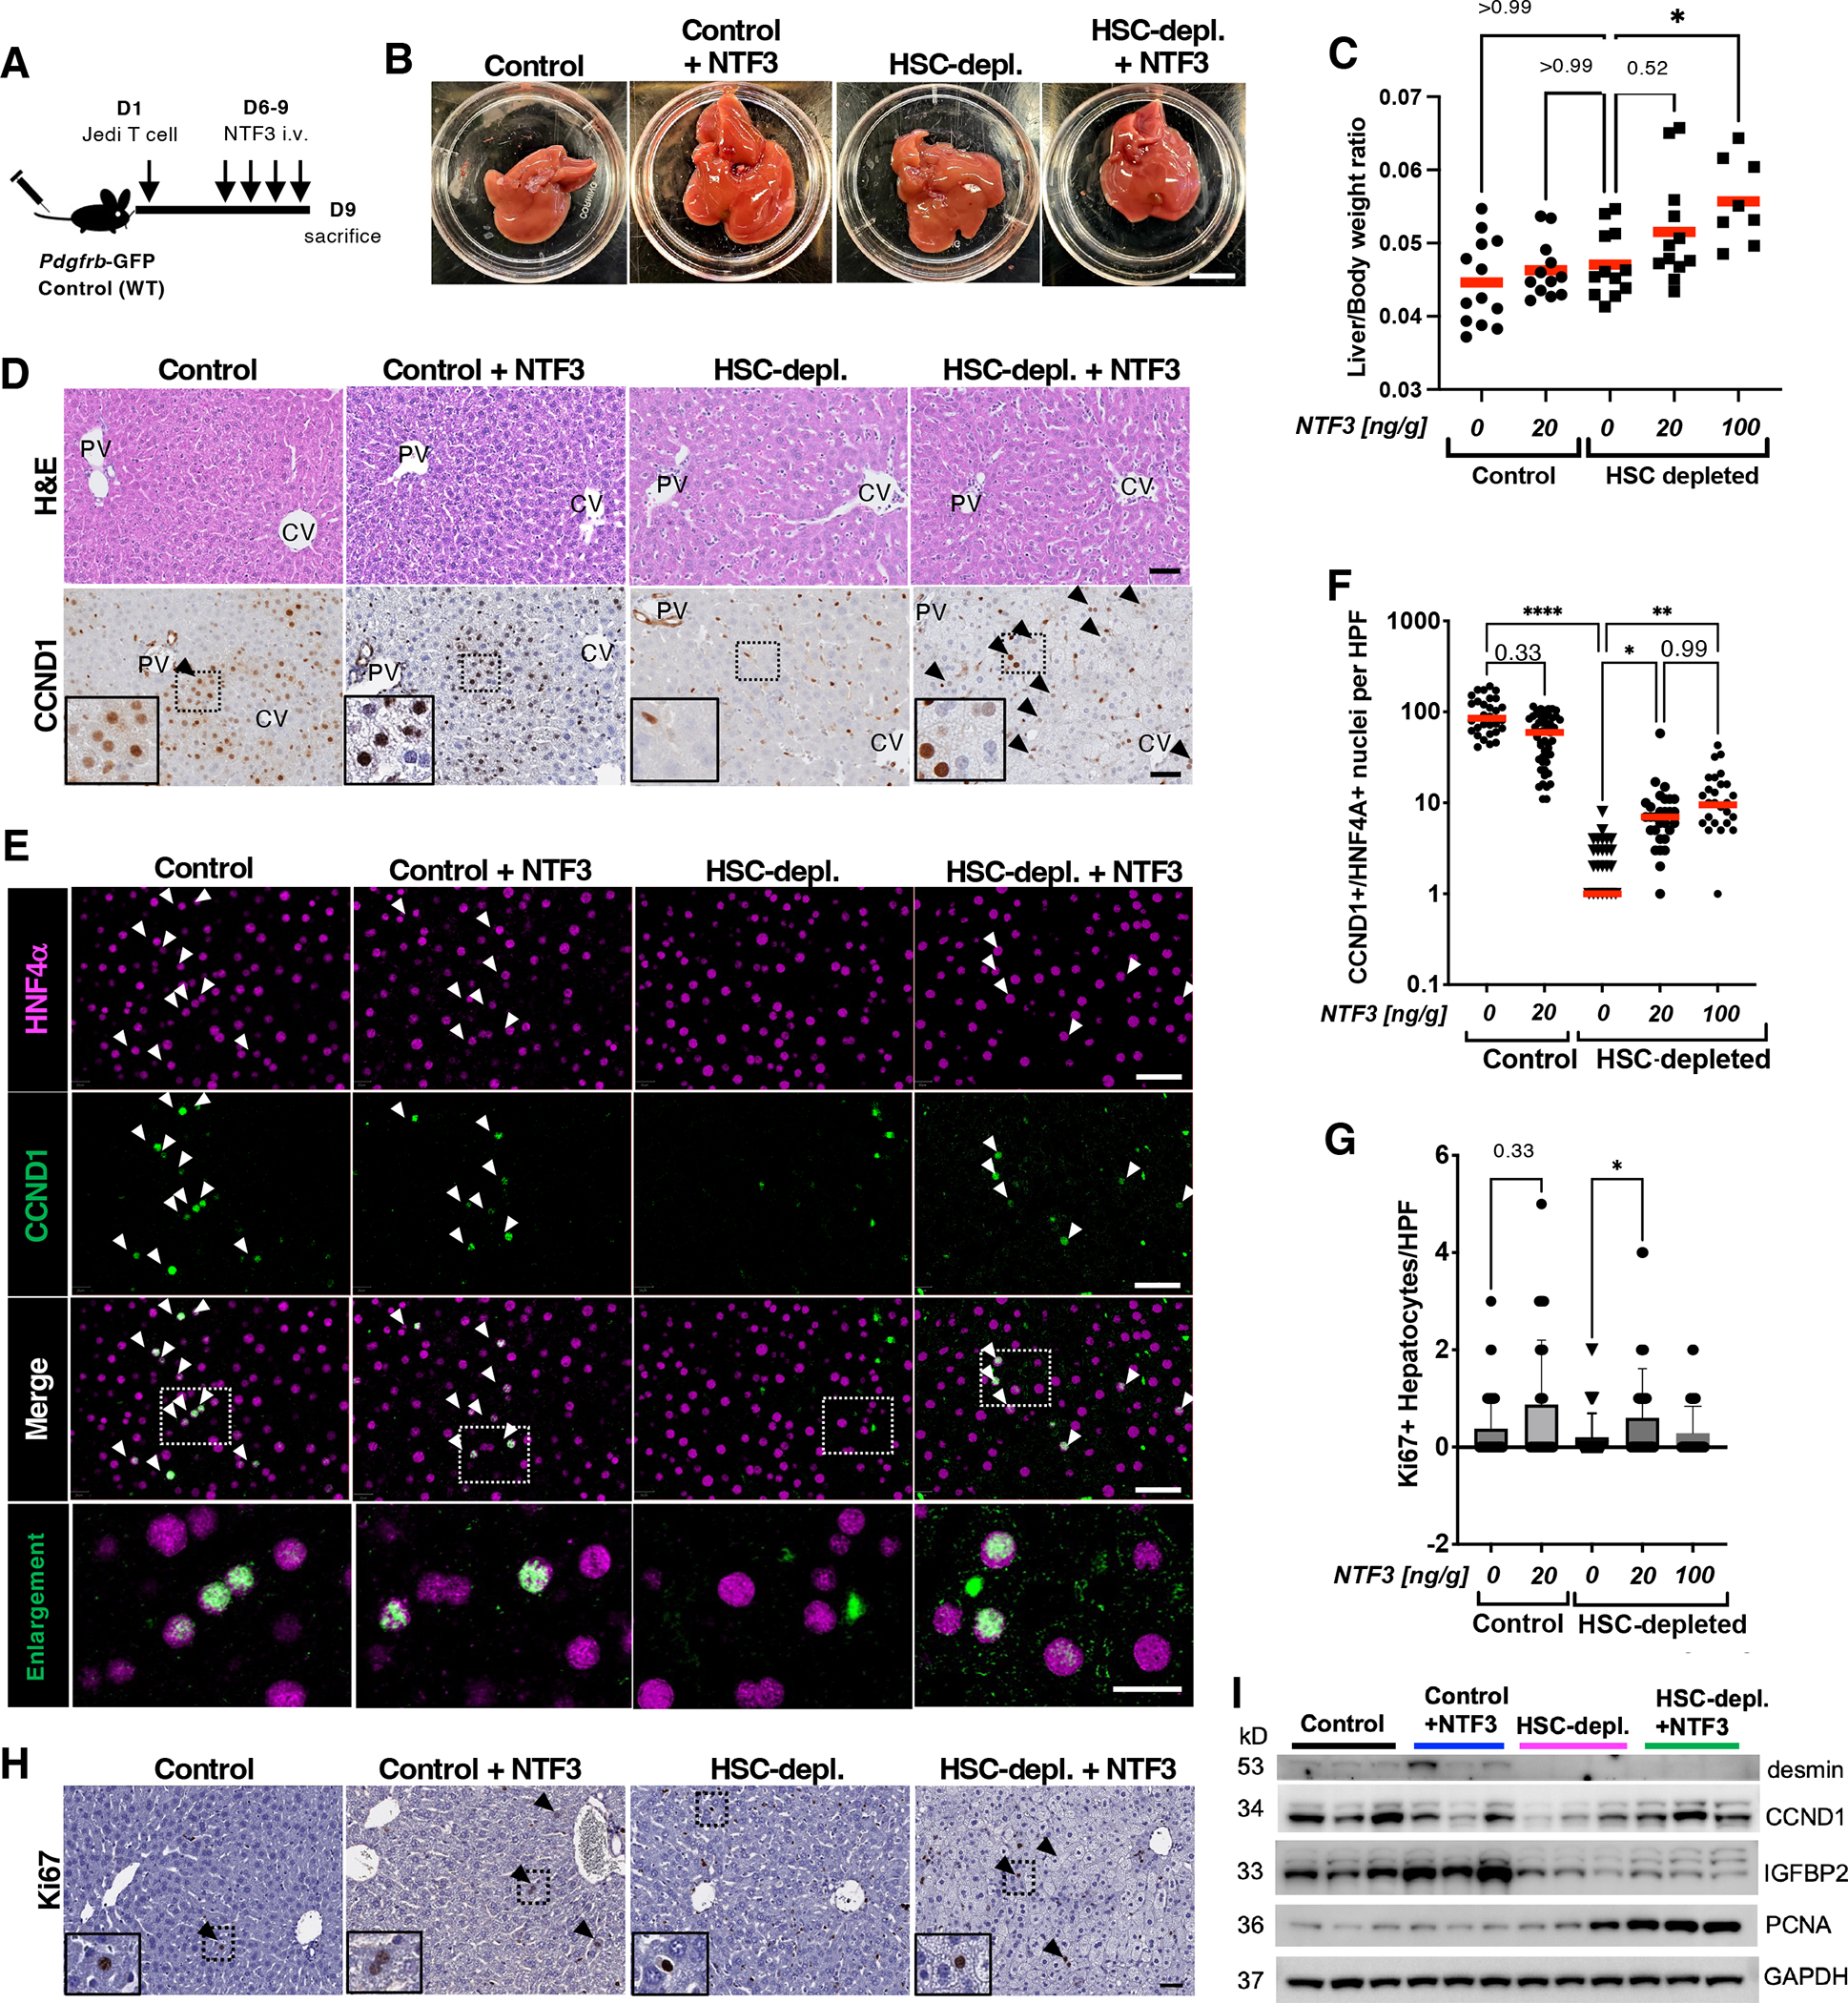
(A) Experimental scheme. (B) Macroscopic images of livers in control and HSC-depleted mice treated with vehicle or NTF3. Scale bar, 1 cm (C) Liver-to-body weight ratios of control and HSC-depleted mice treated with vehicle or the indicated concentrations of NTF3. *p<0.05 by Kruskal-Wallis, post hoc Dunn’s test. n=8–13 animals per group. (D) H&E and CCND1 staining of liver sections from control and HSC-depleted mice treated with vehicle or NTF3. Arrowheads indicate positive staining. Dashed rectangles indicate areas shown in insets. (E) Multiplex immunohistochemistry for CCND1 and HNF4α in liver sections from control and HSC-depleted mice treated with vehicle or NTF3. Dashed rectangles indicate areas of enlargement. Scale bars, 20 μm. Arrowheads indicate positive-staining nuclei. (F) Quantification of CCND1+HNF4α+ nuclei per high power field (HPF). Red bars indicate mean. n=3–5 animals per group. *p<0.05, **p<0.005, ****p<0.0001 by Kruskal-Wallis, post hoc Dunn’s test. (G) Quantification of Ki67+ hepatocytes in control and HSC-depleted mice treated with vehicle or NTF3. Mean+SD. *p<0.05 by Kruskal-Wallis, post hoc Dunn’s test. n=4–6 animals per group. (H) Ki67 staining of liver sections from control and HSC-depleted mice treated with vehicle or NTF3. Arrowheads indicate positive staining. Dashed rectangles indicate areas shown in insets. (I) Western blot for desmin, CCND1, IGFBP2, and PCNA in whole-liver lysates from control and HSC-depleted mice treated with vehicle or recombinant NTF3. GAPDH is a loading control. N=3 animals per group.
NTF3 signals through TRKB in mouse hepatocytes
Analysis of a published mouse liver dataset that allows for zone-specific gene expression analysis of hepatocytes (lobule layers 1 through 9) (2) showed expression of NTRK1 and NTRK2 in midlobular hepatocyte layers 2 through 7 (Fig. 5A), whereas NTRK3 was absent. Immunofluorescence analysis for TRKA (NTRK1) showed non-parenchymal TRKA staining around the portal tracts and central veins (Fig. 5B). TRKB (NTRK2) staining was observed in midlobular hepatocytes with decreased staining around portal tracts and central veins, suggesting that TRKB mediates the effects of HSC-derived NTF3 (Fig. 5B, fig. S7D). Costaining for filamentous actin and TRKB indicated TRKB-positive hepatocytes in zone 2 (Fig. 5C). To assess if NTF3 signals though TRKB in primary mouse hepatocytes, we incubated these cells with ANA-12, a highly specific TRKB antagonist that does not alter TRKA or TRKC function (61). ANA-12 significantly inhibited NTF3-induced cell proliferation when used at 10 nM (Fig. 5D). To confirm that TRKB mediated NTF-3 signaling in hepatocytes, we performed knockdown experiments in primary mouse hepatocytes using lentiviral vectors expressing two different shRNAs targeting Ntrk2 (shNtrk2_1 and shNtrk2_2) and a control lentiviral vector expressing a non-targeting shRNA (shNT). Knockdown of Ntrk2 mRNA was confirmed by qRT-PCR and showed decreases of 45% for shNtrk2_1 and 80% shNtrk2_1 (Fig. 5E). Knockdown of Ntrk2, which encodes TRKB, blocked NTF3-induced cell proliferation (Fig. 5F). It has been reported that hepatocyte proliferation after partial hepatectomy initiates in midlobular hepatocytes before proceeding to pericentral and periportal areas (62). By gene expression analysis, Ntf3 was significantly increased in mouse livers at 72 hours after partial hepatectomy, further supporting a pro-proliferative role of NTF3 (Fig. 5G), though further studies are required to address the role of NTF3 in liver regeneration. Overall, our findings indicate that HSCs maintain liver homeostasis by secreting NTF3 that stimulates the proliferation of zone 2 hepatocytes by activating TRKB.
Fig. 5. NTF3-induced cell proliferation is mediated by TRKB in primary mouse hepatocytes.
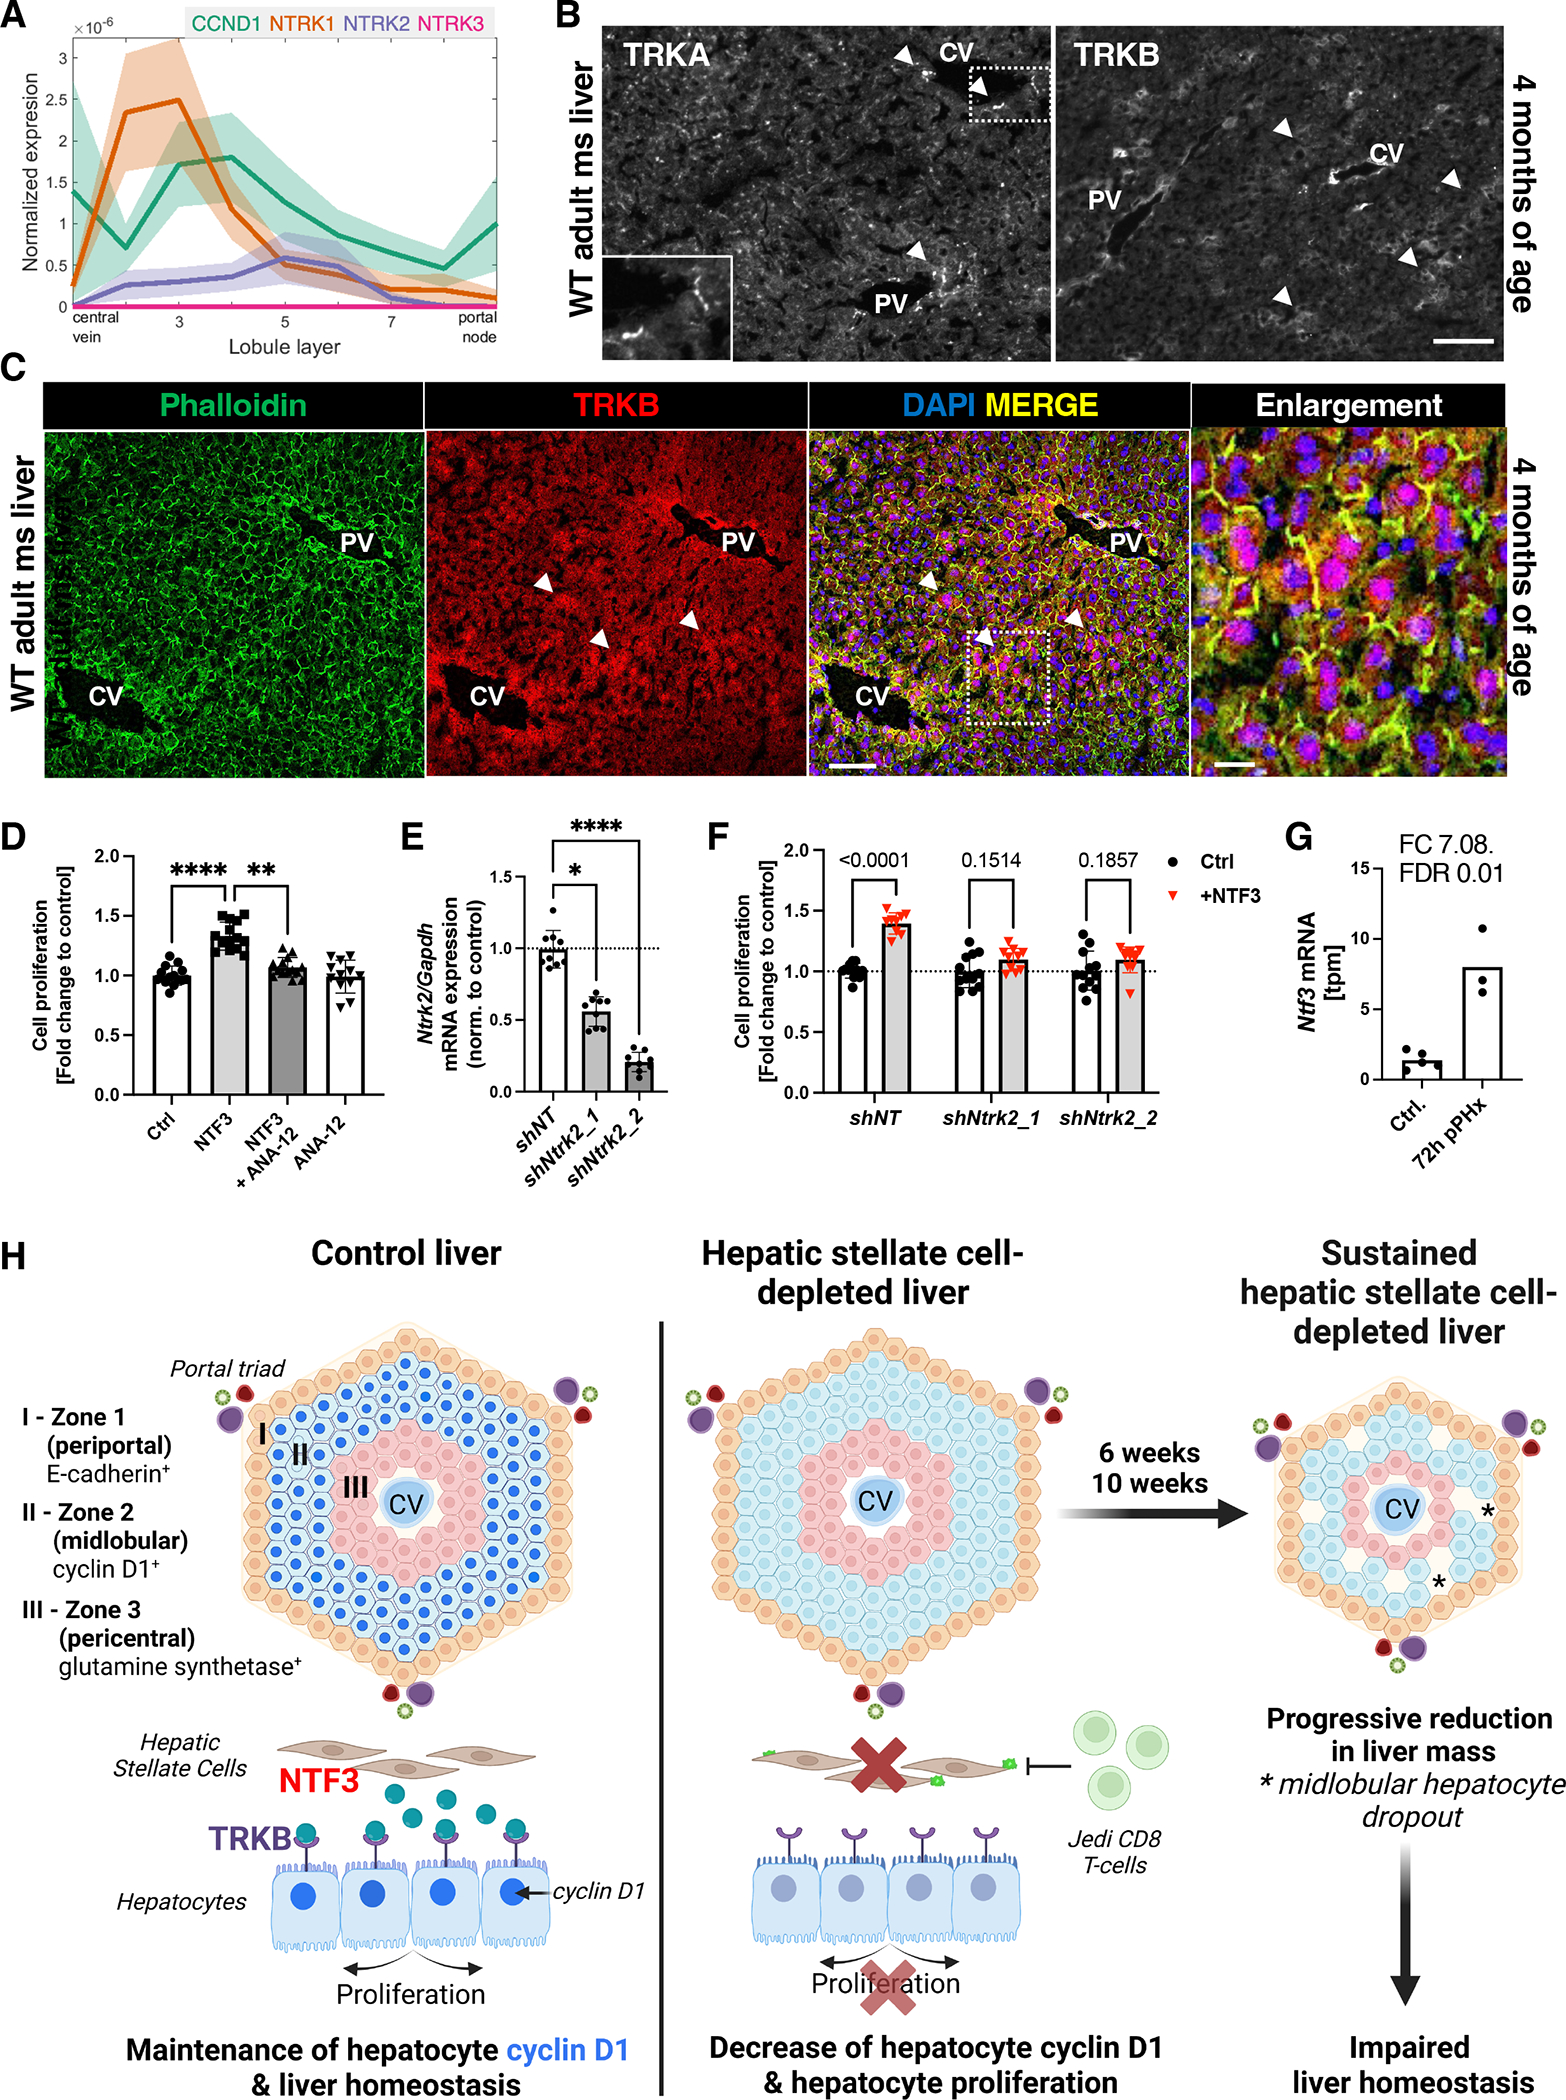
(A) Analysis of CCND1, NTRK1, NTRK2, and NTRK3 expression in a published mouse liver gene expression dataset (2) that enables gene expression analysis according to the hepatocyte’s position in the lobule layers. (B) Immunofluorescence microscopy for TRKA and TRKB in normal adult mouse liver at 4 months of age. Dashed rectangle indicates area of enlargement. CV, central vein. PV, portal vein. Scale bar, 100 μm. n = 3 mice. (C) Immunofluorescence microscopy for TRKB in adult mouse liver also stained with phalloidin to label F-actin. Nuclei are stained with DAPI. PV, portal vein. CV, central vein. Scale bar, 100 μm, 20 μm in enlargement. (D) Proliferation of primary wild-type mouse hepatocytes after incubation with NTF3 (20 ng/ml), TRKB antagonist ANA-12 (10 nM), NTF3+ANA-12, or ANA-12 only in serum-free medium. Mean+SD. Data from n=3 independent experiments. ****p<0.0001, **p<0.005 by Kruskal-Wallis, post hoc Dunn’s. (E) qRT-PCR for Ntrk2 expression in primary mouse hepatocytes infected with lentivirus carrying non-targeting control shRNA (shNT), or Ntrk2-targeting shRNAs (shNtrk2_1 or shNtrk2_2). Mean+SD. Data from n=3 independent experiments. *p<0.05, ****p<0.0001 by Kruskal-Wallis, post hoc Dunn’s. (F) Proliferation analysis of primary mouse hepatocytes infected with shNT, shNtrk2_1, or shNtrk2_2 lentivirus and incubated with NTF3 (20 ng/ml) or vehicle only. Analysis by two-way ANOVA, post hoc Šidak test comparing vehicle only-treated vs. NTF3-treated cells. Mean+SD. Data from n = 3 independent experiments. (G) Bulk RNA-seq analyses for Ntf3 in livers 72 hours after partial hepatectomy and controls. n=5 control and 3 hepatectomized mice per group. FC, fold change; FDR, false discovery rate. (H) Graphical summary of the main findings. The diagram depicts the metabolic zonation of hepatocytes between the central vein (CV) and the portal triad, which includes branches of the portal vein and hepatic artery and a bile duct. Under normal conditions, HSCs produce NTF3 that activates TRKB on midlobular (zone 2) hepatocytes, leading to CCND1-dependent proliferation. Upon HSC ablation by Jedi T cells, midlobular hepatocytes stop proliferating, leading to a gradual reduction in liver mass as dead hepatocytes are not replaced.
Discussion
We developed a highly efficient HSC ablation model that enabled us to uncover the role of quiescent HSCs in adult mouse livers during homeostasis. Previous HSC ablation models using transgenic mice expressing diphtheria toxin receptor (63) or thymidine kinase (64) or HSC ablation by gliotoxin administration (65) achieved only partial (50–65%) ablation of HSCs. Although we have focused on the HSC-hepatocyte interaction, this ablation model might also be useful for investigating the interaction of HSCs with other liver cells and to explore how HSCs modulate the immune microenvironment (66) or the effects of HSCs on liver sinusoidal endothelial cell biology (67–70). Although GFP was highly expressed in HSCs within the liver in our model, extrahepatic expression of GFP in Pdgfrb+ cells in other organs such as the lung, kidney, or pancreas, could be used to study pericyte biology in other organ systems.
Signaling pathways that regulate liver zonation have been best characterized for zone 1 and zone 3 (1, 71–75), which was facilitated by the longstanding tradition of binary classification of hepatocytes and well-established markers for both zone 1 (E-cadherin) and zone 3 (glutamine synthetase). Much less is known about signals determining midlobular hepatocyte zonation (17). Unique genes expressed at higher amounts in midlobular hepatocytes have only been identified using advanced scRNA-seq and spatial sorting and transcriptomic analyses and fate-labeling methods (2, 12, 13, 51, 76). These include hepcidin antimicrobial peptide (Hamp2) and Igfbp2 (2, 5, 13) suggesting that midlobular hepatocytes play important roles in iron metabolism and insulin growth factor signaling. Midlobular hepatocytes also express higher amounts of cytochrome P450 xenobiotic metabolism genes (2, 51, 76). Genetic fate-labeling in Hamp2-CreER transgenic mice confirm Hamp2 as a primarily midlobular marker (13) and identify IGFBP2-mTOR-CCND1 signaling as a critical pathway to maintain midlobular hepatocyte proliferation. Deletion of either Igfbp2 or inhibition of mechanistic target of rapamycin and 2 (mTORC1/2) leads to decreased CCND1 expression and hepatocyte proliferation in vivo (13). Whereas our results demonstrate that HSCs were essential to maintain midlobular CCND1 expression and liver homeostasis, NTF3 only increased CCND1 but not IGFBP2 expression in hepatocytes of HSC-ablated mice, suggesting that NTF3-TRKB signaling may regulate CCND1 separately from the IGFBP2-mTOR-CCND1 axis in vivo.
Fate-labeling studies indicate that midlobular hepatocytes have a higher proliferative capacity than periportal or pericentral hepatocytes in the homeostatic liver (10–13). Our results indicate that HSC-derived NTF3 acts as a full-fledged hepatocyte mitogen in the midlobular niche. In liver regeneration, signals inducing hepatocyte proliferation may be classified as ‘complete mitogens’ and ‘auxiliary hepatocyte mitogens’ depending on their ability to induce proliferation in cultured primary hepatocytes and to induce hepatocyte DNA synthesis and liver enlargement in vivo (16). In contrast to complete mitogens, auxiliary mitogens cannot induce hepatocyte proliferation in culture or if injected into rodents. Whereas auxiliary mitogens include several different types of molecules (16, 77), complete mitogens include only HGF and ligands of epidermal growth factor receptor (EGFR). Other complex signaling pathways can also promote hepatocyte proliferation, but disruption of these (Wnt-β-catenin and hedgehog signaling) delays liver regeneration without abolishing regeneration (78, 79). Although the role of NTF3 in liver regeneration remains to be clarified, gene expression analysis of mouse livers 72 hours after partial hepatectomy demonstrated increased Ntf3 mRNA amounts consistent with a pro-proliferative role for NTF3 during liver regeneration (Fig. 5G). Our results demonstrated that NTF3 increased proliferation of cultured primary hepatocytes through TRKB, and induced hepatocyte proliferation and enlargement of liver size when injected into mice (Fig. 4C, G, H; Fig. 5D and F). Of note, NTF3 induced hepatocyte proliferation in HSC-depleted mice despite decreased amounts of HGF in these mice, underscoring the effectiveness of NTF3 in inducing proliferation (Fig. 3A). Although it is possible that NTF3 synergizes with HGF to promote proliferative effects, our studies did not detect synergism at the tested concentrations. Further studies are required to clarify synergistic effects of NTF3 with HGF, EGF or catecholamines, which can enhance effects of HGF and EGF on hepatocyte proliferation (80, 81).
The loss in liver mass of ~22% and ~27% after 6 weeks and 10 weeks of sustained HSC-depletion, respectively, is substantial but can be explained by considering the dynamics of normal hepatocyte turnover. Mouse hepatocytes have a reported life span of 200 days (82). Cells reaching the end of their life are thought to undergo mostly caspase-dependent apoptosis to maintain homeostatic cell turnover (83). The number of apoptotic cells was similar in HSC-depleted and control livers, but the number of proliferating hepatocytes was markedly decreased, resulting in a net negative balance in cell numbers that, in turn, led to a progressive decrease in liver mass over time. Although a life span of ~200 days may seem long, it would mean that after 100 days 50% of hepatocytes are replaced, and 25% after ~50 days, and so on. In our HSC-depletion model, liver mass was reduced by ~22% and ~27% after 42 days and 70 days, respectively, which would be within the theoretically expected range if hepatocyte proliferation were abrogated. Some studies suggest that hepatocyte life spans can vary depending on the cell’s location within the liver lobule (13), with zone 1 hepatocytes having shorter life spans (< 1 year) than either zone 3 or zone 2 hepatocytes. It is possible that in addition to decreased hepatocyte proliferation, HSC-depletion also leads to a shortened life span of hepatocyte populations, which will need to be evaluated in more suitable fate-labeling models.
At this point, two question arise: How does NTF3 signal to hepatocytes in vivo? And why does NTF3 have a greater effect on midlobular hepatocytes than on zone 1 or zone 2 hepatocytes? Analysis of a published mouse liver scRNA-seq dataset that allows for expression analysis of hepatocytes according to their localization in the liver lobule (3) indicated that NTRK1 and NTRK2, but not NTRK3, were expressed in midlobular hepatocytes (Fig. 5A). Immunofluorescence staining for TRKB (NTRK2) showed TRKB+ midlobular hepatocytes, possibly explaining why NTF3 has the largest effect on midlobular hepatocytes (Fig. 5B and C); however, further studies characterizing TRK expression in the liver are required. Overall, NTRK gene expression seems very low in liver in queries of publicly accessible datasets such as TCGA, Gtex, and our own bulk RNA-seq dataset of control and HSC-depleted livers. However, low expression of NTRKs in healthy livers might not preclude high activity of specific receptors, as exemplified by the efficiency of HER2-targeting antibody drug conjugates in breast cancers with low HER2 expression (84). Furthermore, besides hepatocytes, other cells – namely HSCs themselves – express high amounts of NTRK2, NTRK3, and NGFR (32, 56). Thus, autocrine neurotrophin signaling in HSCs could be biologically relevant, as recently confirmed in the context of fibrosis (57). HSCs are highly pleiotropic; therefore, other signaling pathways besides NTF3-TRKB might also be affected and contribute to the phenotypes observed in HSC-depleted livers. Furthermore, although we have focused on how NTF3 affects CCND1, NTF3 might also affect other proteins and signaling pathways in either HSC-depleted or control livers.
In summary, HSCs have important physiological functions, and their roles in liver homeostasis must be further elucidated if we are to deepen our understanding of pathobiological processes. Although activated HSCs are the principal fibrogenic cells in chronic liver injury driving fibrosis towards end-stage liver disease, therapeutic strategies targeting HSCs in liver cirrhosis analogous to T cell–targeted immunotherapy for cardiac fibrosis should be developed carefully and investigated in detail (85–87). NTF3 is a complete hepatocyte mitogen whose signaling pathway is well characterized in the nervous system and in cancer and for which signaling pathway agonists and antagonists are available (59). Future studies may well reveal how these pathways could be exploited therapeutically to promote liver regeneration and/or inhibit proliferation in hepatic malignancies.
Materials and Methods
Mice
Jedi mice were obtained from Jackson Laboratories (Jax 028062) and are homozygous for CD45.1 and H-2Kd haplotype. Pdgfrb-BAC-eGFP cryopreserved sperm was obtained from MMRRC (031796-UCD), and mice were rederived in C57Bl/6, sub strain B10.D2 females (Jax 000463) that express CD45.2 and H-2Kd haplotype. Rederived Pdgfrb-GFP mice were backcrossed into B10.D2 and were maintained heterozygous for GFP, homozygous for CD45.2 and homozygous for H-2Kd haplotype. All experiments were performed when mice were 6 weeks to 10 months old and both male and females were used. All animal procedures were performed according to protocols approved by the Institutional Animal Care and Use Committees at Icahn School of Medicine at Mount Sinai and the Institutional Animal Care and Use Committees at Vanderbilt University Medical Center.
Genotyping
Jedi mice were genotyped by PCR genotyping using the following primers: TCRα-For: GAGGAGCCAGCAGAAGGT; TCRα-Rev: TCCCACCCTACACTCACTACA; TCRβ-For: TCAAGTCGCTTCCAACCTCAA; TCRβ-Rev: TGTCACAGTGAGCCGGGTG. Pdgfrb-GFP mice were genotyped by PCR using the following primers: GFP-For: GTGGAAGCAGAGAGGAGAGCATTTG, GFP-Rev: GGTCGGGGT-AGCGGCTGAA. H-2Kd haplotype, CD45.1, CD45.2 status were determined by flow analysis of PBMCs using the following antibodies purchased from ebiosciences: CD45.1-eFluor-450 (48–0453-80), CD45.2-PE (12–0454-82), H-2Kd-APC (17–5957-80).
T cell isolation and adoptive transfer
CD8+ T cells were isolated from spleen and lymph nodes (brachial, inguinal, axillar, submandibular, superficial cervical and mesenteric) of Jedi and controls. Spleens and lymph nodes were collected in ice cold T cell media (RPMI [Gibco 11875–093] supplemented by 10% FBS, 2 mM L-glutamine [Thermofisher 25030–081], 1% MEM nonessential amino acids [Thermofisher, 11140050] and 1 mM sodium pyruvate [Thermofisher, 11360–070]). Spleen and lymph nodes were mechanically homogenized and filtered through a 70 μm cell strainer (Falcon). The cell suspension was centrifuged for 10 min at 4°C, 300 g. Red blood cell (RBC) lysis was performed with RBC buffer (Thermoscientific, A10492). Cells were then washed with T cell media, filtered through a 70 μm cell strainer and centrifuged for 10 min at 4°C, 300 g. The cell pellet was then resuspended in flow buffer (PBS, pH 7.4, 2 mM EDTA, 0.05% BSA) and CD8+ T cells enriched using the mouse CD8+ T cell isolation kit (STEMCELL technologies 19853A) according to the manufacturer’s instructions. Enriched CD8 T cells were centrifuged for 10 min at 4°C, 300 g, and resuspended in PBS. Mice with less than 25 g body weight were injected with up to 12 million Jedi T cells and mice greater than 25 g body weight were injected by tail vein injection with 18 million Jedi T cells. Control mice were injected with either T cells from H-2Kd mice or with vehicle only. Mice were not injected with lentiviral GFP particles as previously described (38, 39) to avoid lentiviral GFP-expression of other cells such as hepatocytes.
Partial hepatectomy
All surgeries were performed per the NIH recommendations contained in the Guide for the Care and Use of Laboratory. Mice were anesthetized with isoflurane. An incision was made inferior to the xiphoid process. Evisceration of the median and left lateral lobes allowed suture ligation and ~70% hepatectomy. Skin and abdominal muscles were closed in a two-step procedure and postoperative analgesia administered. Mice were sacrificed 72 hours after partial hepatectomy, and tissues collected for processing.
Treatment with recombinant NTF3
Four months old mice were injected via tail vein for 4 consecutive days with recombinant NTF3 (STEMCELL technology, cat. 78074, lots 1000070683, 1000077434) diluted in sterile 0.9% saline (0.9% NaCl) or vehicle only. Mice were weighed daily and recombinant NTF3 given at 20 ng/g body weight or 100 ng/g body weight, respectively. Lyophilized NTF3 was solubilized in 0.1% BSA/PBS (bovine serum albumin, Sigma A3059) and stored at −80°C until use. As activity and protein concentration declined significantly at approximately 3 months, only aliquots stored for 3 months or less were used for experiments and freeze-thaw cycles minimized.
Mouse blood chemistry analysis
Mouse serum or EDTA-plasma were stored at −80°C after collection and analyzed on a VetScan vs2 (Abaxis) using mammalian liver profile analysis discs (Abaxis, 500–0040) according to the manufacturer’s instructions.
RNA extraction and qRT-PCR
Bulk liver total RNA was isolated using the RNeasy Kit (Qiagen) following the manufacturer’s instructions. Five μg of total RNA was transcribed to cDNA using the RNA-to-cDNA ecoDry Premix (Takara). IQ SYBR Green Supermix (Biorad) was used to quantitative on a LightCycler480 System (Roche) or CFX96 Real-time System (Biorad). Primer sequences used were Desmin: For-GCCACCATGAGCCAGGCCTACT, Rev-TGCTCGAGGGAAC-ACGGGAGA, Pdgfrb: For-ACTACATCTCCAAAGGCAGCACCT, Rev-TGTAGAACTGGTCGTTCATGGGCA, Ntrk2 (encoding for TrkB): For-GTCTGGAGGGTGCTATGCTA, Rev-CAGGGGCAGAAACTCCAGAA, GAPDH: For-CAATGACCCCTTCATTGACC, Rev-GATCTCGCTCCTGGAAGATG.
RNA-sequencing
Bulk total RNA was isolated using RNeasy Kit (Qiagen) following the manufacturer’s instructions, and 1 μg were used for polyA selection and library preparation using the Illumina TruSeq protocol. Samples were sequenced 50 bp paired-end on a NovaSeq 6000 by the Genomics Core Facility at The Rockefeller University. Raw FASTQ files were aligned to the mouse mm10 genome using the STAR aligner (v. 2.7.1a). The STAR command used was
STAR --runThreadN 10 \\
--genomeDir mm10 \\
--readFilesIn INPUT_R1_001.fastq.gz   INPUT_L001_R2_001.fastq.gz \\
--clip3pAdapterSeq GATCGGAAGAGC \\
--outFilterMismatchNmax 2 \\
--outFileNamePrefix OUTFILE \\
--readFilesCommand gunzip -c \\
--outSAMunmapped Within \\
--outStd BAM_Unsorted \\
--outSAMtype BAM Unsorted \\
--outStd BAM_Unsorted
The resulting BAM file was sorted using samtools (v. 1.15.1). Reads were summarized using featureCounts (v1.6.4) against the Gencode mouse vM6 release disregarding multi-mapping and overlapping reads. The command used was:
featureCounts -a INPUT.gtf -T 4 -s 2 -o OUTFILE.txt LIST_OF_BAMFILES
Differential and gene set analysis was done in R session (development version, 2022–01-07 r81454) using the quasi-likelihood framework in edgeR (v. 3.37.0) and the mroast function on the mouse version of the MSigDB gene sets based on release v5.2 provided by the Bioinformatics group at the Walter+Eliza Hall Institute for Medical Research (https://bioinf.wehi.edu.au/software/MSigDB/). For other packages used to generate figures see section Olink. The Gene Expression Omnibus accession number for the transcriptome profiles reported in this paper is GSE211370.
Olink
Fresh frozen liver tissue samples were homogenized using a TissueLyser LT (Qiagen) in RIPA buffer (Sigma R0278). Protein concentration was determined by Biorad Protein Assay (Biorad) (Biorad), lysate protein concentration adjusted to 0.5 μg/μl protein liver lysate and submitted to the Human Immune Monitoring Center (HIMC), a core facility at Icahn School of Medicine at Mount Sinai.
Olink data were generated using the Olink mouse exploratory panel (v.3801), and the data was exported in NPX format from the Olink NPX Manager (v. 2.0.0.173) to Excel xlsx files. These files were imported into an R session (development version, 2022–01-07 r81454) using the OlinkAnalyze package (v. 3.0.0). Groups were compared using a one-way ANOVA with Tukey’s post-hoc test as implemented in the OlinkAnalyze package and using the default adjusted P value of 0.05. Other R packages used to generate figures and plots were the packages NMF (v. 0.23.0), ggplot2 (v. 3.3.5), and cowplot (v. 1.1.1).
Immunohistochemistry
For immunohistochemistry, formalin-fixed paraffin embedded sections were cut at 4 μm thickness and slides incubated at 65°C for 30 min. Slides were deparaffinized in Histoclear (National Diagnostics, HS2001GLL) and rehydrated by an ethanol gradient. Heat antigen retrieval was performed in 10 mM sodium citrate (pH 6.0) in a pressure cooker (Cuisinart, CPC-600C), 20 min at high-pressure, natural pressure release for 30 min, and cooled at room temperature for 30 min. Endogenous peroxidase quenching was performed with 1.5% hydrogen peroxide (Sigma-Aldrich, H1009) for 20 min, and slides washed twice in phosphate buffered saline (PBS) twice. Blocking was performed for 30 min with Protein Block, Serum-free (Agilent, X090930–2). The primary antibody (Table S1) was diluted in antibody diluent (Agilent, S080983–2) and applied to the slides in a wet chamber overnight at 4°C. After 2 washes in PBS, slides were incubated with the appropriate secondary antibody (Table S1) for 30 min followed by two washes in PBS. The antigen was revealed with DAB (Vector Laboratories, SK-4105) until the appropriate staining on a control slide was obtained. The same reveal time was then used on all experimental slides. Slides were stained with hematoxylin (Sigma-Aldrich, GHS332) for 30 sec, washed gently in lukewarm tap water for 5 min, and washed twice in distilled water, followed by two washes in phosphate buffered saline (PBS, pH 7.4)). Slides were washed in increasing ethanol/water gradients, followed by three washes in Histoclear. Whole-slide scans for subsequent analyses and publishing were obtained using an VS200 Research Slide Scanner (Olympus, Tokyo, Japan) and a SCN400 (Leica, Wetzlar, Germany). Whole-slide images were processed and annotated in QuPath 0.3.2. and 0.4.2. Ki67-positive hepatocyte nuclei were counted over ten random high-power fields (ROIs of 0.27 mm2). Hepatocytes and cleaved caspase 3-positive hepatocyte nuclei were counted over 5 random high-power fields and mean % of cleaved caspase 3-positive hepatocytes per mouse calculated.
Immunofluorescence
Primary mouse hepatic stellate cells that had been seeded on glass coverslips were washed in PBS, incubated for 10 min in cold (−20°C) 100% acetone then rehydrated for 5 min in PBS (pH 7.4). Coverslips were incubated with respective primary antibodies (Table S1) (dilution buffer PBS) in a wet chamber for 1 hour at room temperature. Coverslips were then washed 5 times for 5 min each in PBS and incubated with respective secondary antibodies (Table S2) for 1 h at room temperature. Coverslips were washed 5 times in PBS for 5 min each and mounted with ProLong Gold antifade reagent with DAPI (Invitrogen, P36931).
For immunofluorescence, 4 μm cryosections from fresh frozen liver samples embedded in Optimal Cutting Temperature (OCT) compound (Sakura, Tokyo, Japan) were cut and dried for a minimum of 1 h at room temperature and stored at −80°C until use. Frozen sections were thawed and rehydrated in PBS for 5 min at room temperature, fixed in 100% acetone for 10 min at −20°C and washed in PBS. The primary antibody (Table S1) was diluted in antibody diluent (Agilent, S080983–2) and incubated for 60 min at room temperature in a wet chamber. Slides were then washed 3 × 5 min in PBS. The secondary antibody (Table S1) was diluted in antibody diluent (Agilent, S080983–2 or PBS), and slides incubated in a wet chamber for 30–60 min. Slides were washed three times in PBS, followed by two washes in distilled H2O. The slides were then mounted with a DAPI-containing medium (Prolong Antifade, Thermo Fisher Scientific, P36931). Images were taken with either a Nikon A1R confocal microscope (Nikon, Tokyo, Japan), an Axioimager M2, or a Axioimager 7 (Zeiss, Oberkochen, Germany) microscope. For phalloidin staining, Alexa Fluor™488 Phalloidin (Invitrogen, A12379) was added to the diluent containing the secondary antibody (40x dilution).
Multiplex immunohistochemistry
For multiplex immunohistochemistry, FFPE sections were incubated at 65°C for 30 min and cooled for 15 min at room temperature for 2 cycles to strongly fix the tissue to the slide. After deparaffinization and rehydration, heat antigen retrieval was performed with 10 mM sodium citrate (pH 6). The slides were then stained with hematoxylin to avoid staining after the signal reveal which would unbind the chromogen. Endogenous peroxidase quenching was performed with 1.5% hydrogen peroxide (Sigma-Aldrich, H1009) for 20 min, and slides washed twice in phosphate buffered saline (PBS). Blocking was performed for 30 min with Protein Block, Serum-free (Agilent, X090930–2). The CCND1 primary antibody (Table S1) was diluted in antibody diluent (Agilent, S080983–2) and incubated on the slides for 60 min. Slides were washed in PBS and incubated with secondary antibody for 30 min. Slides were washed in PBS and slides incubated with 3-amino-9-ethylcarbazole (AEC, Agilent, K346111–2) until the appropriate staining on a control slide was obtained. The same reveal time was used on all experimental slides. The slides were washed in PBS, and cover slipped with a PBS mounting medium immediately prior to imaging. Slides were scanned with the VS200 research slide scanner (Olympus, Tokyo, Japan). After imaging, the cover glass were carefully removed in a PBS wash, and the slides were de-stained in a gradient of dH2O, 70% ethanol, 95% ethanol, 70% ethanol, dH2O, and conserved in PBS at 4°C. Slides were incubated in 10 mM sodium citrate (pH 6.0) in a pressure cooker (Cuisinart, CPC-600C), for 20 min at high-pressure, natural pressure release for 30 min, and cooled at room temperature for 30 min. The hematoxylin staining was repeated, and the steps were repeated from the blocking step but with anti-HNF4α antibody (Table S1). Images were registered in QuPath 0.3.2 with the image combiner extension 0.2.3 using rigid transform based on image intensity at 5 pixel resolution. Ten high-power fields (ROIs measuring 0.27 mm2) evenly and blindly distributed across tissue sections per sample were assessed.
Cell lines
Human HepG2 (ATCC HB-8065) were maintained in MEM media with 10% FBS and the mouse hepatocyte cell line AML12 (ATCC CRL-2254) in DMEM/F12 media supplemented with dexamethasone (40 ng/ml) and Insulin-Transferrin-Selenium (Gibco, 41400045), containing 10% FBS and 1% penicillin and streptomycin. JS1 (RRID: CVCL_C7PL), LX2 (RRID: CVCL_5792, Millipore, SCC064) and TWNT4 (RRID: CVCL_W296) cells were cultured in DMEM supplemented with 10% FBS. 293T cells (ATCC CRL-3216) were cultured in DMEM supplemented with 10% FBS.
Primary hepatic stellate cell isolation
Pdgfrb-GFP-positive mice were anesthetized and cannulated via the portal vein. Livers were perfused with pre-warmed (37°C) buffers: ~25 ml of liver perfusion medium (Gibco, 17707–038), followed by ~30 ml 0.2% Pronase/HBSS (Roche, cat. 11459643001, Gibco, 24020–117). Livers were then perfused by 25 ml 0.05% Pronase/0.05% Collagenase B (Roche, 11088831001) diluted in HBSS (Gibco, 24020–117). Livers were then resected and placed in ice cold 5 ml hepatocyte wash medium (Gibco, 17704024), the liver capsule gently teased apart with tweezers and cells released. Cells were taken up in hepatocyte wash medium (Gibco, 17704–024) and filtered through a 100 μm mesh. Cells were then centrifuged for 2 min at 100g, 4°C. The supernatant containing non-parenchymal cells was filtered through 70 μm mesh and centrifuged for 5 min at 580g, 4°C. The cell pellet was resuspended in 25 ml ice cold hepatocyte wash medium (Gibco), filtered through a 70 μm mesh, and centrifuged for 5 min at 580g, 4°C. The resulting cell pellet was then resuspended in 2.5 ml 50% Percoll/PBS (Percoll, GE, GE17–0891-01), transferred into a 15 ml reaction tube and overlayed with 5 ml of 35% Percoll/PBS, followed by 1 ml sterile 1% BSA/PBS. Cells were centrifuged at 1380g for 30 min at 4°C. The cell layer on top of the 35% Percoll/PBS gradient was collected, resuspended in 25 ml hepatocyte wash buffer, filtered through 70 μm mesh and centrifuged for 5 min at 580g, 4°C. The cell pellet was then resuspended in DMEM/10% FBS and seeded on coverslips for further analyses.
Primary hepatocyte isolation
Pdgfrb-GFP-negative or H-2Kd mice older than 4 months were anesthetized and cannulated via the portal vein. Livers were perfused with ~25 ml of pre-warmed Liver Perfusion Medium (Gibco, 17707–038) followed by ~50 ml Liver Digestion Medium (Gibco,17703–034). Liver capsule was gently teased apart with tweezers and hepatocytes released. Cells were taken up in Hepatocyte Wash Buffer (Gibco, 17704–024) and filtered through 100 μm mesh. Cells were then centrifuged for 2 min at 100g, 4°C and cell pellet resuspended in ice cold 10 ml DMEM (Gibco, 11885–084)/5% FBS. 10 ml of ice cold 100% Percoll/PBS (GE, GE17–0891-01) was added for gradient purification and cells centrifuged for 10 min at 200g, 4°C. Cell pellet was resuspended with 20 ml DMEM/5%FBS and centrifuged for 2 min at 100g, 4°C. 1–2 × 10³ hepatocytes were plated on collagen-coated 96-well plates in DMEM/5%FBS/Pen/Strep. Rat tail collagen I (Gibco, A1048301) was used for coating. Cell culture media was changed 3 hours after plating with either serum-free William’s E media (Gibco) containing Pen/Strep (Gibco) or DMEM/5%FBS/Pen/Strep. NTF3 (STEMCELL technologies) was added 1 day after plating at a final concentration of 20 ng/ml and primary hepatocytes cultured for 3 days with NTF3 until analysis.
Ntrk2 knockdown in primary hepatocytes
Lentivirus containing short hairpin RNAs (shRNAs) were expressed in a lentiviral vector (pLKO.1 puro). Lentivirus with shNon-target (shNT, Addgene#109012) and mouse shNTRK2 [Sigma Millipore, TRCN0000023703, target sequence: CATTCCAAGTTTGGCATGAAA (shNtrk2_1) and TRCN0000361390, target sequence: CAGCAACCTGCGGCACATAAA (shNtrk2_2)] were generated in 293 T cells (ATCC CRL-3216). Primary mouse hepatocytes (2×10³ cells per well) were incubated with lentivirus for 2 days. For cell proliferation experiments, media was and changed to serum-free William E media without L-glutamine containing NTF3 (20 ng/ml) or vehicle only. Ntrk2 knock down (encoding for TRKB) was verified by qRT-PCR.
Cell proliferation assays
Primary mouse hepatocytes, HepG2 or AML12 cells were grown in opaque-walled 96-well plates. NTF3 (final concentration 20 ng/ml) (STEMCELL Technologies, cat. 78074) and/or Loxo-195 (final concentration 5 nM) (Selleckchem, S8636) were added into complete growth media without L-glutamine. Primary mouse hepatocytes were also grown in serum-free William’s E media without supplements. Cells were analyzed by CellTiter-Glo (Promega G7570, Madison, WI) which detects the number of viable cells on day 0 to day 5 by on detection systems Glomax (Promega) or Bioteck Synergy H1 (Agilent). Mouse recombinant HGF (Abcam, ab281797) was added to cell culture media at a final concentration 5 ng/ml. TRKB inhibitor ANA-12 (Selleckchem, S7745) was diluted in DMSO (10 mM stock solution) and added to cell culture media at a final concentration of 10 nM.
Western blotting
Fifty micrograms of snap frozen liver were homogenized with a Qiagen PowerLyzer in RIPA buffer containing proteinase inhibitors (Roche complete Mini proteinase inhibitor, 2 tab/10 ml buffer) and 1x HALT phosphatase inhibitors (Thermoscientific, cat. 78428). Lysates were sonicated and then centrifuged for 10 min at 18,800 × g. Protein concentration of supernatants were determined by Direct Detect Spectrophotometer (Millipore).
Human HepG2 and mouse AML12 cells were grown in 6-well plates. Cells were treated with NTF3 (20 ng/ml) purchased from STEMCELL technologies (cat. 78074), R&D (267-N3), Gibco (PHC7036) and/or Loxo-195 (5–10 nM) (Selleckchem, S8636) in complete growth media without L-glutamine for 2 hours. Lyophilized NTF3 was solubilized with sterile filtered PBS supplemented with 0.1% BSA, aliquoted and stored at −80°C until use. Only aliquots with < 3 months shelf life were used for experiments as activity and protein concentration declined significantly after 3 months. HepG2 and AML12 cells were collected on ice in PBS, centrifuged for 10 sec at and cell pellet homogenized in RIPA buffer containing inhibitors (Roche complete Mini proteinase inhibitor, 1x HALT phosphatase inhibitors, Thermoscientific, cat. 78428). Cell lysates were sonicated and centrifuged for 10 min at 18,800 × g. Protein concentration of supernatants were determined by Direct Detect Spectrophotometer (Millipore).
For immunoblot analysis, 30–50 μg of protein diluted in LSD sample buffer (Invitrogen) were analyzed per SDS-PAGE (Nupage, Invitrogen) using MOPS buffer or MES buffer (Invitrogen). Gels were stained with Coomassie (Bio-Safe Coomassie G-250 Stain, Biorad) and transferred onto PVDF membranes using semi-dry blotting (Trans-Blot SD, Biorad). Antibodies and dilutions used are indicated in Table S2. Images were visualized on an Amersham Imager 680 (Cytiva). Semi-quantitative band densitometry was performed using ImageJ software (version 1.53).
Statistical Analysis
For analysis of the Olink and RNA-seq data see the corresponding sections. Other data analysis was performed using GraphPad Prism (version 9.4.1). Two groups were compared by unpaired two-tailed Mann-Whitney test. Data of three or more groups were assessed by Kruskal-Wallis test with post hoc Dunn’s test. Three or more groups were analyzed by two-way ANOVA with post hoc test Sidak, testing for vehicle only treated cells vs. NTF3-treated cells.
Supplementary Material
Acknowledgments:
We thank Andrea Branch for critical reading and constructive feedback on the manuscript, Joseph Roland for expert advice and support by the DSHR at Vanderbilt University Medical Center, the Genomics Core at Rockefeller University for excellent support, Seung-Hee Kim-Schultze for expert support at the HIMC at Icahn School of Medicine at Mount Sinai, and the Department of Animal Care at Vanderbilt University Medical Center. Core Services (Flow core, DHSR) were performed through Vanderbilt University Medical Center’s Digestive Disease Research Center supported by NIH grant P30DK058404. Figure 5H was created with BioRender.
Funding:
National Institutes of Health grants: Young Investigator Award P30DK058404 (YAL), pilot research grant P30DK058404 (YAL), pilot research grant VICC GI SPORE P50CA236733 (YAL), R01DK56621 (SLF), DK128289 (SLF), NIH R01AT011326 (BB).
American Cancer Society: RSG-22–061-01-MM (YAL), American Cancer Society Institutional Research Grant #IRG-19–139-60 (YAL).
Société Nationale Française de Gastro-Entérologie SNFGE (Robert Tournut) (SL)
Société Française d’Hépatologie AFEF (SL)
La Fondation pour la Recherche Médicale FRM, FRM SPE201803005011 (SL)
Philippe Foundation (SL)
Footnotes
Competing interests: SLF is a consultant to 89 Bio, Amgen, Axcella Health, Blade Therapeutics, Bristol Myers Squibb, Can-Fite Biopharma, Casma Therapeutics, ChemomAb, Escient Pharmaceuticals, Forbion, Galmed, Gordian Biotechnology, Glycotest, Glympse Bio, In sitro, Morphic Therapeutics, North Sea Therapeutics, Novartis, Ono Pharmaceuticals, Pfizer Pharmaceuticals, Scholar Rock, and Surrozen and has stock options (all less than 1% of company value) in Blade Therapeutics, Escient, Galectin, Galmed, Genfit, Glympse, Hepgene, Lifemax, Metacrine, Morphic Therapeutics, Nimbus, North Sea Therapeutics, Scholar Rock, and Surrozen. SL is a consultant to Albireo. All other authors declare that they have no competing interests.
Data and materials availability:
The Gene Expression Omnibus (https://www.ncbi.nlm.nih.gov/geo/) accession number for the liver transcriptome profiles of HSC-depleted livers vs. controls, and mouse livers 72 hours after partial hepatectomy reported in this paper is GSE211370. Analysis interface of published scRNA-seq datasets are available at https://shiny.igmm.ed.ac.uk/livermesenchyme/ (41); https://shiny.igmm.ed.ac.uk/livercellatlas/ (43); https ://itzkovitzwebapps.weizmann.ac.il/webapps/home/session.html?app=HumanLiverBrowser (2, 3) and https://itzkovitzapapp.weizmann.ac.il/apap/?gene1=Col1a1 (44). All other data needed to evaluate the conclusions in the paper are present in the paper or the Supplementary Materials and are available on request by the corresponding author.
References and Notes
- 1.Paris J, Henderson NC, Hepatology 76, 1219 (2022). [DOI] [PMC free article] [PubMed] [Google Scholar]
- 2.Halpern KB et al. , Nature 542, 352 (2017). [DOI] [PMC free article] [PubMed] [Google Scholar]
- 3.Massalha H et al. , Mol Syst Biol 16, e9682 (2020). [DOI] [PMC free article] [PubMed] [Google Scholar]
- 4.Droin C et al. , Nat Metab 3, 43 (2021). [DOI] [PMC free article] [PubMed] [Google Scholar]
- 5.Ben-Moshe S et al. , Nat Metab 1, 899 (2019). [DOI] [PMC free article] [PubMed] [Google Scholar]
- 6.Font-Burgada J et al. , Cell 162, 766 (2015). [DOI] [PMC free article] [PubMed] [Google Scholar]
- 7.Wang B, Zhao L, Fish M, Logan CY, Nusse R, Nature 524, 180 (2015). [DOI] [PMC free article] [PubMed] [Google Scholar]
- 8.Sun T et al. , Cell Stem Cell 26, 97 (2020). [DOI] [PubMed] [Google Scholar]
- 9.Lin S et al. , Nature 556, 244 (2018). [DOI] [PMC free article] [PubMed] [Google Scholar]
- 10.Chen F et al. , Cell Stem Cell 26, 27 (2020). [DOI] [PMC free article] [PubMed] [Google Scholar]
- 11.Sun T et al. , Cell Stem Cell 28, 1822 (2021). [DOI] [PubMed] [Google Scholar]
- 12.He L et al. , Science 371, eabc4346 (2021).33632818 [Google Scholar]
- 13.Wei Y et al. , Science 371, eabb1625 (2021).33632817 [Google Scholar]
- 14.Mullany LK et al. , Cell Cycle 7, 2215 (2008). [DOI] [PMC free article] [PubMed] [Google Scholar]
- 15.Wu H et al. , Proc Natl Acad Sci U S A 117, 17177 (2020). [DOI] [PMC free article] [PubMed] [Google Scholar]
- 16.Michalopoulos GK, Bhushan B, Nat Rev Gastroenterol Hepatol 18, 40 (2021). [DOI] [PubMed] [Google Scholar]
- 17.Pu W, Zhou B, Cell Regen 11, 2 (2022). [DOI] [PMC free article] [PubMed] [Google Scholar]
- 18.Tsuchida T, Friedman SL, Nature Reviews Gastroenterology & Hepatology 14, 397 (2017). [DOI] [PubMed] [Google Scholar]
- 19.Kitto LJ, Henderson NC, Hepatol Commun 5, 358 (2021). [DOI] [PMC free article] [PubMed] [Google Scholar]
- 20.Matsumoto K, Miki R, Nakayama M, Tatsumi N, Yokouchi Y, Dev Biol 319, 234 (2008). [DOI] [PubMed] [Google Scholar]
- 21.Maher JJ, J Clin Invest 91, 2244 (1993). [DOI] [PMC free article] [PubMed] [Google Scholar]
- 22.Corpechot C et al. , Hepatology 35, 1010 (2002). [DOI] [PubMed] [Google Scholar]
- 23.Asahina K et al. , Am J Pathol 160, 2191 (2002). [DOI] [PMC free article] [PubMed] [Google Scholar]
- 24.Mullhaupt B, Feren A, Fodor E, Jones A, J Biol Chem 269, 19667 (1994). [PubMed] [Google Scholar]
- 25.Sekhon SS, Tan X, Micsenyi A, Bowen WC, Monga SP, Am J Pathol 164, 2229 (2004). [DOI] [PMC free article] [PubMed] [Google Scholar]
- 26.Berg T et al. , Hepatology 46, 1187 (2007). [DOI] [PMC free article] [PubMed] [Google Scholar]
- 27.Mabuchi A et al. , J Hepatol 40, 910 (2004). [DOI] [PubMed] [Google Scholar]
- 28.Lee JS, Semela D, Iredale J, Shah VH, Hepatology 45, 817 (2007). [DOI] [PubMed] [Google Scholar]
- 29.Shen K et al. , Acta Biochim Biophys Sin (Shanghai) 43, 307 (2011). [DOI] [PubMed] [Google Scholar]
- 30.Pintilie DG et al. , Lab Invest (2010). [Google Scholar]
- 31.Kalinichenko VV et al. , Hepatology 37, 107 (2003). [DOI] [PubMed] [Google Scholar]
- 32.Passino MA, Adams RA, Sikorski SL, Akassoglou K, Science 315, 1853 (2007). [DOI] [PubMed] [Google Scholar]
- 33.Schuppan D, Ruehl M, Somasundaram R, Hahn EG, Semin Liver Dis 21, 351 (2001). [DOI] [PubMed] [Google Scholar]
- 34.Geerts A, Semin Liver Dis 21, 311 (2001). [DOI] [PubMed] [Google Scholar]
- 35.Iwakiri Y, Shah V, Rockey DC, J Hepatol 61, 912 (2014). [DOI] [PMC free article] [PubMed] [Google Scholar]
- 36.Zhang R et al. , Gene Expr 19, 121 (2019). [DOI] [PMC free article] [PubMed] [Google Scholar]
- 37.Affo S et al. , Cancer Cell 39, 866 (2021). [DOI] [PMC free article] [PubMed] [Google Scholar]
- 38.Agudo J et al. , Nat Biotechnol 33, 1287 (2015). [DOI] [PMC free article] [PubMed] [Google Scholar]
- 39.Agudo J et al. , Immunity 48, 271 (2018). [DOI] [PMC free article] [PubMed] [Google Scholar]
- 40.Payen VL et al. , JHEP Rep 3, 100278 (2021). [DOI] [PMC free article] [PubMed] [Google Scholar]
- 41.Dobie R et al. , Cell Reports 29, 1832 (2019). [DOI] [PMC free article] [PubMed] [Google Scholar]
- 42.Krenkel O, Hundertmark J, Ritz TP, Weiskirchen R, Tacke F, Cells 8, E503 (2019). [DOI] [PMC free article] [PubMed] [Google Scholar]
- 43.Ramachandran P et al. , Nature 575, 512 (2019). [DOI] [PMC free article] [PubMed] [Google Scholar]
- 44.Ben-Moshe S et al. , Cell Stem Cell 29, 973 (2022). [DOI] [PubMed] [Google Scholar]
- 45.Henderson NC et al. , Nat Med 19, 1617 (2013). [DOI] [PMC free article] [PubMed] [Google Scholar]
- 46.Shang L, Hosseini M, Liu X, Kisseleva T, Brenner DA, J Gastroenterol 53, 6 (2018). [DOI] [PubMed] [Google Scholar]
- 47.Morris EC, Neelapu SS, Giavridis T, Sadelain M, Nat Rev Immunol 22, 85 (2022). [DOI] [PMC free article] [PubMed] [Google Scholar]
- 48.Brudno JN, Kochenderfer JN, Blood 127, 3321 (2016). [DOI] [PMC free article] [PubMed] [Google Scholar]
- 49.Braeuning A et al. , FEBS J 273, 5051 (2006). [DOI] [PubMed] [Google Scholar]
- 50.Gougelet A et al. , Hepatology 59, 2344 (2014). [DOI] [PubMed] [Google Scholar]
- 51.Aizarani N et al. , Nature 572, 199 (2019). [DOI] [PMC free article] [PubMed] [Google Scholar]
- 52.Friedman SL, Physiol Rev 88, 125 (2008). [DOI] [PMC free article] [PubMed] [Google Scholar]
- 53.Sekine S, Lan BY, Bedolli M, Feng S, Hebrok M, Hepatology 43, 817 (2006). [DOI] [PubMed] [Google Scholar]
- 54.Russell JO, Monga SP, Annu Rev Pathol 13, 351 (2018). [DOI] [PMC free article] [PubMed] [Google Scholar]
- 55.Assarsson E et al. , PLoS One 9, e95192 (2014). [DOI] [PMC free article] [PubMed] [Google Scholar]
- 56.Cassiman D, Denef C, Desmet VJ, Roskams T, Hepatology 33, 148 (2001). [DOI] [PubMed] [Google Scholar]
- 57.Wang S et al. , Sci Transl Med 15, eadd3949 (2023). [DOI] [PMC free article] [PubMed] [Google Scholar]
- 58.Huang EJ, Reichardt LF, Annu Rev Neurosci 24, 677 (2001). [DOI] [PMC free article] [PubMed] [Google Scholar]
- 59.Cocco E, Scaltriti M, Drilon A, Nat Rev Clin Oncol 15, 731 (2018). [DOI] [PMC free article] [PubMed] [Google Scholar]
- 60.Blondy S et al. , Cell Death Dis 10, 123 (2019). [DOI] [PMC free article] [PubMed] [Google Scholar]
- 61.Cazorla M et al. , J Clin Invest 121, 1846 (2011). [DOI] [PMC free article] [PubMed] [Google Scholar]
- 62.Chembazhi UV, Bangru S, Hernaez M, Kalsotra A, Genome Res 31, 576 (2021). [DOI] [PMC free article] [PubMed] [Google Scholar]
- 63.Mederacke I et al. , Nat Commun 4, 2823 (2013). [DOI] [PMC free article] [PubMed] [Google Scholar]
- 64.Puche JE et al. , Hepatology 57, 339 (2013). [DOI] [PMC free article] [PubMed] [Google Scholar]
- 65.Douglass A et al. , J Hepatol 49, 88 (2008). [DOI] [PubMed] [Google Scholar]
- 66.Dapito DH, Schwabe RF, in Stellate Cells in Health and Disease, Eds. (Elsevier, 2015), pp. 145–162. [Google Scholar]
- 67.Oda M, Yokomori H, Han JY, Clin Hemorheol Microcirc 34, 11 (2006). [PubMed] [Google Scholar]
- 68.Rappaport AM, Microvasc Res 6, 212 (1973). [DOI] [PubMed] [Google Scholar]
- 69.Wake K, Proc Jpn Acad Ser B Phys Biol Sci 82, 155 (2006). [DOI] [PMC free article] [PubMed] [Google Scholar]
- 70.Poisson J et al. , J Hepatol 66, 212 (2017). [DOI] [PubMed] [Google Scholar]
- 71.Planas-Paz L et al. , Nat Cell Biol 18, 467 (2016). [DOI] [PubMed] [Google Scholar]
- 72.Rocha AS et al. , Cell Rep 13, 1757 (2015). [DOI] [PubMed] [Google Scholar]
- 73.Benhamouche S et al. , Dev Cell 10, 759 (2006). [DOI] [PubMed] [Google Scholar]
- 74.Cunningham RP, Porat-Shliom N, Front Physiol 12, 732929 (2021). [DOI] [PMC free article] [PubMed] [Google Scholar]
- 75.Kietzmann T, Redox Biol 11, 622 (2017). [DOI] [PMC free article] [PubMed] [Google Scholar]
- 76.Andrews TS et al. , Hepatol Commun 6, 821 (2022). [DOI] [PMC free article] [PubMed] [Google Scholar]
- 77.Michalopoulos GK, J Cell Physiol 213, 286 (2007). [DOI] [PMC free article] [PubMed] [Google Scholar]
- 78.Sekine S, Gutiérrez PJ, Lan BY, Feng S, Hebrok M, Hepatology 45, 361 (2007). [DOI] [PubMed] [Google Scholar]
- 79.Ochoa B et al. , Hepatology 51, 1712 (2010). [DOI] [PMC free article] [PubMed] [Google Scholar]
- 80.Cruise JL, Knechtle SJ, Bollinger RR, Kuhn C, Michalopoulos G, Hepatology 7, 1189 (1987). [DOI] [PubMed] [Google Scholar]
- 81.Cruise JL, Houck KA, Michalopoulos GK, Science 227, 749 (1985). [DOI] [PubMed] [Google Scholar]
- 82.Magami Y et al. , Liver 22, 419 (2002). [DOI] [PubMed] [Google Scholar]
- 83.Arandjelovic S, Ravichandran KS, Nat Immunol 16, 907 (2015). [DOI] [PMC free article] [PubMed] [Google Scholar]
- 84.Modi S et al. , New England Journal of Medicine N Engl J Med 387, 9 (2022). [Google Scholar]
- 85.Aghajanian H et al. , Nature 573, 430 (2019). [DOI] [PMC free article] [PubMed] [Google Scholar]
- 86.Amor C et al. , Nature 583, 127 (2020). [DOI] [PMC free article] [PubMed] [Google Scholar]
- 87.Rurik JG et al. , Science 375, 91 (2022). [DOI] [PMC free article] [PubMed] [Google Scholar]
Associated Data
This section collects any data citations, data availability statements, or supplementary materials included in this article.
Supplementary Materials
Data Availability Statement
The Gene Expression Omnibus (https://www.ncbi.nlm.nih.gov/geo/) accession number for the liver transcriptome profiles of HSC-depleted livers vs. controls, and mouse livers 72 hours after partial hepatectomy reported in this paper is GSE211370. Analysis interface of published scRNA-seq datasets are available at https://shiny.igmm.ed.ac.uk/livermesenchyme/ (41); https://shiny.igmm.ed.ac.uk/livercellatlas/ (43); https ://itzkovitzwebapps.weizmann.ac.il/webapps/home/session.html?app=HumanLiverBrowser (2, 3) and https://itzkovitzapapp.weizmann.ac.il/apap/?gene1=Col1a1 (44). All other data needed to evaluate the conclusions in the paper are present in the paper or the Supplementary Materials and are available on request by the corresponding author.