

Abstract
In silico methods to estimate and/or quantify skin absorption of chemicals as a function of chemistry are needed to realistically predict pharmacological, occupational, and environmental exposures. The Potts–Guy equation is a well-established approach, using multi-linear regression analysis describing skin permeability in terms of the octanol/water partition coefficient (logP) and molecular weight . In this work, we obtained regression equations for different human datasets relevant to environmental and cosmetic chemicals. Since the Potts–Guy equation was published in 1992, we explored recent datasets that include different skin layers, such as dermatomed (including dermis to a defined thickness) and full skin. Our work was consistent with others who have observed that fits to the Potts–Guy equation are stronger for experiments focused on the epidermis. Permeability estimates for dermatomed skin and full skin resulted in low regression coefficients when compared to epidermis datasets. An updated regression equation uses a combination of fitted permeability values obtained with a published 2D compartmental model previously evaluated. The resulting regression equation was: (applicability domain for all datasets: ranges from 18 to >584 g/mol and −4 to >5 for logP). This approach demonstrates the advantage of combining mechanistic with structural activity relationships in a single modeling approach. This combination approach results in an improved regression fit when compared to permeability estimates obtained using the Potts–Guy approach alone. The analysis presented in this work assumes a one-compartment skin absorption route; future modeling work will consider adding multiple compartments.
Keywords: consumer products, human skin permeability, multiple linear regression, Potts–Guy equation
1 |. INTRODUCTION
Skin exposure represents an important route for chemicals to enter the body, including pharmaceutical, occupational, and environmental chemicals (Chen et al., 2015; Jepps et al., 2013; Potts & Guy, 1992). Quantification of skin absorption is important to estimate the dose penetrating blood surrounding the deepest skin layer. Mathematical modeling is one of the tools available for skin absorption quantification, with different model types available for different situations (Anissimov & Roberts, 2011). A subset of mathematical models dividing the skin into compartments makes use of mass conservation to quantify absorption and penetration over time (Cleek & Bunge, 1993). Compartmental models have been developed to reflect different levels of biological complexity, exposure type, or penetration mechanisms. The simplest one-compartment model lumps all membrane layers within a single compartment, whereas additional compartments can include sequential layers as needed to include additional toxicological mechanisms.
In most skin absorption models, permeability represents the chemical’s penetration rate as length/time and can be estimated from molecular descriptors (Potts & Guy, 1992). A major assumption adopted in skin modeling is that the passive process of diffusion (Fick’s law) governs transport into the skin (Higuchi, 1960; Mitragotri et al., 2011). Using ideal membrane theory, permeability can be empirically related to solubility (octanol–water partition coefficient) and diffusion constant (D) at steady state (Crank, 1979; Lehman, 2014; Mitragotri et al., 2011). Experimental measurements of permeability for a series of compounds have been gathered in different species, including humans (Flynn et al., 1990; Williams, 2004).
The most well-known skin permeability calculation relates physicochemical properties to estimated permeability and is known as the Potts–Guy equation (Potts & Guy, 1992):
| (1) |
where is permeability in cm/h, is the log10 of octanol–water partition coefficient, and is the chemical’s molecular weight. The use of the Potts–Guy equation relating and to skin permeability has been a useful correlation for the estimation of skin permeability, particularly for chemicals where experimental measurements are not practical (cannot easily achieve steady-state). The Potts–Guy equations predict a permeability coefficient with the use of two easily available molecular descriptors: and . The logP or log (water–octanol partition coefficient) reflects the lipophilic property of the compound. The molecular weight (MW) affects diffusion, in general, bigger molecules have a decreased ability to penetrate skin membranes.
Skin can be mathematically represented by a series of sequentially layered membranes having different barrier properties (Figure 1). In vitro experiments typically combine several layers: stratum corneum, viable epidermis, and partial dermis, with chemicals absorbed and measured from the receptor fluid. The stratum corneum (SC) consists of corneocytes (water soluble) embedded between lipids, forming a distinct first protective barrier against skin penetration (Wang et al., 2006). The SC has been modeled using a brick-and-mortar analogy, where the bricks represent the corneocytes and the gaps between bricks are filled with lipids (Chen et al., 2015; Wang et al., 2007). An equation describing the effective SC permeability can then be obtained from the linear combination of partitioning and diffusion constants (Lehman, 2014).
FIGURE 1.

Schematic representation of the interaction between multiple skin membranes, hair follicles, and capillaries
The epidermis has been used to determine skin permeability (, cm/h) (Zhang et al., 2012), and a correction has been applied to account for lipophilicity included in the dermis (Cleek & Bunge, 1993). Typical in vitro experiments include the viable epidermis and SC together to form a combined epidermis. For successive layers beneath the epidermis, theoretical models have offered equations for the calculation of diffusion and solubility (Chen et al., 2015; Kretsos et al., 2004). The dermis layer is of interest since an understanding of these local exposures allows for integration needed to predict the possibility of skin sensitization (e.g., through the predictions of protein haptenation or extrahepatic metabolism [Maxwell et al., 2014]). Since the layers are physically and mechanistically different, the possibility of permeability constants being different across membrane layers has been explored. Cross et al. (2003) explored the differences in permeability constants across layers and concluded that the dermis may be more lipophilic than previously thought. Negative logP values (hydrophilic compounds) epidermis permeability values were comparable to full skin. In contrast, for increasing logP (lipophilic) alcohols, dermis permeability values were comparable to full skin. As discussed later, the importance of having a representative permeability constant for different layers will impact the number of skin compartments selected for the absorption analysis based on available data.
The past decade has observed an explosion of data generation in terms of high throughput screening for in vitro bioactivity as a surrogate for animal toxicity data (Krewski et al., 2020). Relating bioactivity identified in vitro to relevant human doses (that is, in vitro–in vivo extrapolation) is of key interest for prioritizing chemical impact on public health (Coecke et al., 2013; National Academies of Sciences and Medicine, 2017). Although past methods have focused on prioritizing chemicals based on oral exposure, skin exposure remains an important route for which methods applicable to thousands of chemicals have not yet been developed (Behroozy, 2013; Wambaugh et al., 2019). The strategy for the development of risk assessment tools for such a large number of chemicals is two-fold: 1) develop toxicokinetic datasets for a large number of chemicals and 2) develop open-source compartmental pharmacokinetics models capable of translating exposure to internal dose. For the latter, a generic pharmacokinetic model describing a large number of chemicals is key for expanding the current suite of pharmacokinetic tools including oral and inhalation exposure routes (Linakis et al., 2020; Wambaugh et al., 2018). With the addition of a skin route, modeling can be extended to thousands of chemicals such that skin exposures may be assessed using “high throughput toxicokinetics” or HTTK (Breen et al., 2021). A generic skin route model can include single or multiple compartments depending on the mechanistic complexity being addressed.
In summary, our goals are as follows:
To obtain QSAR-type multi-linear regression for both and for different human skin layers: stratum corneum, epidermis, dermis, dermatomed skin, and full skin. Permeability values for different layers can then be incorporated into httk models by using these QSAR equations.
To combine permeability results obtained with a 2-dimensional (2D) model representative of a one-compartment model.
To develop a strategy for the development of a generic skin route to be used with httk. Current efforts are considering the simplest permeability case using a one-compartment model, with multi-compartment layers being developed in the future.
2 |. METHODS
2.1 |. Datasets
Literature searches were conducted using PubMed, with a time span for our search from 1970 to 2020. Only human permeability datasets using water-based vehicles were considered. Infinite or steady-state datasets were preferred, although not always indicated in the papers. Environmental and consumer use chemicals were selected from datasets also containing pharmaceuticals. The physicochemical properties needed for each chemical’s permeability calculation were as follows: and . Values for each compound were obtained from the USEPA CompTox Chemicals Dashboard (Williams et al., 2017). Datasets were stored using Excel (MS Office, Version 2002).
2.2 |. Datasets compared
2.2.1 |. Flynn et al. (1990)
Experimentally measured permeability coefficients (cm/h) were copied and curated into an Excel spreadsheet. In vitro experiments were performed using human skin. The Flynn data were listed in a US EPA Guidance document for performing risk assessment calculations involving dermal exposure (https://www.epa.gov/sites/default/files/2015-09/documents/part_e_final_revision_10-03-07.pdf). Pharmaceutical compounds were not included in this analysis, producing a total of chemicals.
2.2.2 |. Wilschut et al. (1995)
Experimentally measured permeability coefficients (cm/h) were copied and curated into an Excel spreadsheet. In vitro experiments were performed using human skin. Pharmaceutical compounds were not included in this analysis, producing a total of chemicals.
2.2.3 |. Patel et al. (2002)
Experimental permeability values (cm/h) listed in Table 1 (Patel et al., 2002, pp. 605–607) were copied and curated into an Excel spreadsheet. Patel et al. (2002) make use of two datasets: Flynn et al. (1990) and Wilschut et al. (1995). A review of the Flynn et al. (1990) data has identified experimental layer types and was used to ensure our dataset permeability values were for epidermis layers only (Kladt et al., 2018). We also examined the original publications included in the Wilschut et al. (1995) dataset to select permeability values measured using the human epidermis. Pharmaceutical compounds were omitted from our analysis, our final dataset included a total of chemicals.
TABLE 1.
Statistical comparison of all datasets
| Flynn | Wilschut | Patel | Zhang | Shen | Hewitt_2D | Ellison | Full skin | Combined |
|---|---|---|---|---|---|---|---|---|
| −2.8737*** | −2.5785*** | −2.6194*** | −2.1652*** | −2.0211*** | −2.5517*** | −1.7368*** | −2.6007*** | −1.9687*** |
| (0.1409) | (0.1813) | (0.1032) | (0.1471) | (0.2382) | (0.1034) | (0.2127) | (0.1672) | (0.0826) |
| −0.0016 | −0.0028* | −0.0063*** | −0.0060*** | −0.0115*** | −0.0085*** | −0.0029* | −0.0041*** | −0.0061*** |
| (0.0011) | (0.0014) | (0.0012) | (0.0008) | (0.0020) | (0.0006) | (0.0012) | (0.0008) | (0.0005) |
| 0.5608*** | 0.5287*** | 0.7232*** | 0.7250*** | 0.7653*** | 0.6531*** | 0.2216** | 0.2594*** | 0.4906*** |
| (0.0345) | (0.0441) | (0.0333) | (0.0452) | (0.1031) | (0.0313) | (0.0652) | (0.0596) | (0.0343) |
| 41 | 44 | 98 | 54 | 57 | 50 | 50 | 56 | 443 |
| 0.8746 | 0.7782 | 0.8772 | 0.8574 | 0.5079 | 0.9130 | 0.2173 | 0.3478 | 0.3358 |
p < 0.001
p < 0.01
p < 0.05.
2.2.4 |. Zhang et al. (2012)
Experimental values for skin permeability were published in Table 2 of their paper for neutral chemicals. Permeability units were cm/s and were converted to cm/h—to have consistent units throughout our analysis. A factor of 3,600 was used on this conversion. Experimental values were obtained using epidermis membranes separated from skin obtained from women aged 30–50 years. Phosphate buffer saline (PBS) at pH 7.4 was used as the donor vehicle. Pharmaceutical compounds were omitted from our analysis; our final dataset consisted of chemicals.
2.2.5 |. Shen et al. (2014)
Experimental skin permeability for fragrance chemicals was considered a subset of all chemicals available for skin exposure. Their list of chemicals (Table 1) came from two sources: the Flynn dataset and EDETOX (https://research.ncl.ac.uk/edetox/theedetoxdatabase/). The latter dataset included both in vitro and in vivo values. Only human in vitro experiments were considered, with pharmaceutical compounds omitted from our analysis; our final dataset consisted of a total of chemicals.
2.2.6 |. Hewitt et al. (2020)
A total of 56 chemicals used in the cosmetics industry were selected for the study using a standardized in vitro experimental setup for all chemicals. Human skin (mainly female donors) was dermatomed before experiments were performed. The dermatomed skin included the epidermis plus a section of the dermis. Skin vehicle was washed off after 24 h to end exposure, simulating finite dosing. The top skin surface was not occluded, and evaporation was allowed to occur. Only PBS vehicle exposures were included in our analysis, for a total of chemicals. Permeability values using a steady state flux calculation (Equation 1) were provided by the authors. These steady-state permeability calculations were used in the regression analysis when comparing QSAR results with other datasets. A second set of permeability values was calculated using the 2D Surrey diffusion model described in the methods. The permeability values obtained with optimization with the 2D model were used to calculate an additional QSAR equation relating permeability to and .
2.2.7 |. Ellison et al. (2020)
A group of 50 fragrance chemicals was studied using human in vitro membrane layers separated into SC, epidermis, and dermis. A separate group of measurements was performed using dermatomed skin with all intact layers. Infinite dosing was used for all exposures, maintaining a constant surface dose. Partition and diffusion constants were experimentally determined and reported for each layer. In addition, permeability and lag times were calculated per layer and chemical. We are not aware of any other dataset that provides diffusion, permeability, and partitioning constants for all separate skin layers. All chemicals were used in the analysis for .
2.2.8 |. Full-skin dataset
This dataset is comprised of multiple sources listed in the provided Excel file. Experimental permeability (cm/h) published were copied and curated into an Excel spreadsheet. There are a small number of chemicals in common with the Patel dataset, but most chemicals are uniquely present in this dataset. A total of chemicals were used.
2.2.9 |. Combined dataset
This dataset was compiled by combining all data files together, to account for repeated chemicals. The question of chemical overlap was addressed by repeating the analysis using the combined dataset. One final dataset was created by selecting chemicals that were present only once and not repeated in multiple databases. Venn diagrams were generated to show the accurate overlap between datasets and are included in the Supplementary Material for the interested reader. Regression results for this category are also stated in the Results section.
2.3 |. Surrey skin or 2D skin model
A mechanistic model for predicting transdermal and systemic kinetics has been developed and previously evaluated with published clinical data. This hybrid approach combines a mechanistic description of the stratum corneum and uses QSAR approaches to calculate the permeability and diffusion coefficients published in Wang et al. (2010) and Kasting and Miller (2006), alternatively experimentally calculated coefficients can be used. Diffusion is the predominant mechanism used to describe chemical movement from vehicle to receptor fluid. This single-compartment model assumes that the vehicle, viable epidermis, dermis, and receptor fluid behave as sinks and that counter-diffusion is negligible. The concern over possible non-sink conditions for in vitro dermal systems using aqueous receptor fluid has been addressed by Yousef et al. (2016). Since all datasets analyzed in this paper used aqueous receptor media, we are assuming that the concentration in the receptor medium remains below 20%–30% of equilibrium with the delivery vehicle, so that the rate of counter-diffusion is negligible. Evaporation from the vehicle was not considered in this model. The 2D model is written in Python and it can be found on GitHub here: https://github.com/anthonytchen/LC_DPK.
The SC is assumed to consist of two phases: corneocytes and lipid space referred to as the “brick and mortar model.” Because of the two separate phases, the name 2D was chosen for this approach. A schematic for the SC is included in the Supplementary Material with a parameter table used for comparison with the Hewitt dataset. Both time and thickness are considered as independent variables for diffusion between the phases to be described. The diffusion equation becomes a partial differential equation (PDE) for each phase considered separately, as shown in the Supplementary Material. Mass transfer coefficients between the lipid and corneocyte phases are used in combination with mass conservation to fully characterize chemical diffusion within the SC. The combination of mass transfer coefficients and mass conservation ordinary differential equations allows for the estimation of permeability under infinite dosing conditions. The numerical solutions are obtained using a finite differential method to solve the bi-direction diffusion in the SC, viable dermis, and dermis. Zero flux boundary conditions are applied on both sides, and the flux perpendicular to the boundary above and below is modeled to derive skin permeability. Diffusion is assumed to occur in one direction as stated previously.
The 2D skin Surrey model has been calibrated not for individual chemicals but more so in general. We have performed validations of the QSPRs component for partition and diffusion coefficients by applying bounds and checking that experimental data fall into this area. The calibration has not been performed in this paper, but the 2D model has been evaluated in the following papers: (Chen et al., 2008, 2010, 2015, 2016; Grégoire et al., 2021; Kattou et al., 2017; Lian et al., 2010). The 2D Surrey is a one-compartment model that is amenable for application in a generic high throughput toxicokinetic model (httk).
3 |. RESULTS
Figure 1 presents a biologically realistic representation of the skin layers. As described in the Methods section, a subset of available permeability datasets was selected from the literature. The inclusion of all existing datasets was not the intent of this work; we specifically wanted to select datasets consisting of more than 50 chemicals. When considering all datasets, the applicability domain for MW was 18–584 g/mol and −4 to 5 for logP. Regression analysis results should only be considered within the applicability domain used.
Table 1 summarizes the multiple linear regression results using permeability as the predicted result and MW + logP as independent variables for all datasets analyzed, using the Flynn and Wilschut datasets as benchmarks. Per Table 1, all linear intercepts are negative and have an absolute value around −2.2. The MW coefficient always has a negative coefficient and is represented by a negative slope. The logP coefficient always has a positive value and has two different groups of values: between 0.6 and 0.8 for six datasets and 0.2 for Ellison, increasing to 0.3 for full skin. For a detailed statistical comparison of the different datasets, the reader is referred to Figure S4 in the Supplementary Material. One final comparison is made using the combination of all datasets, including repeated chemicals. Table 1 shows , similar to that of full skin. The overlap between datasets can be seen in the Venn diagrams included in the Supplementary Material (Figure S5). Another dataset generated without repeated chemicals results in an (results not shown). These unique chemicals set represent different layers from the epidermis to full skin combined into one dataset. Adding the unique set of chemicals dataset was helpful to increase our overall confidence in the impact of membrane complexity and permeability.
Figure 2 shows the partial regression plots for the different datasets included in our analysis. The partial regression plots can be combined with Table 1 to write the regression equation. For example, the Hewitt2D regression equation reads: . Since there are two independent variables considered for each equation, a separate plot was used for each independent variable. Thus, each partial regression plot presents two graphs: one for and another for . The panel on the left presents the logP coefficient (the slope is always positive). The panel on the right presents the coefficient (slope is always negative). One advantage of using partial regression plots is that each plotted slope equals the coefficient obtained for that specific independent variable in the regression analysis. Figure 2 presents the analysis of epidermis layers at the top, proceeding with adding more skin layers toward the bottom of the graph. There is a corresponding decrease in when adding a partial dermatomed dermis or full skin.
FIGURE 2.

Partial regression plots for different datasets analyzed. The residuals are plotted for both (Y-axis) and (X-axis) instead of the absolute values. Abbreviation: MW, molecular weight
Figure 3 shows two bubble plots for all epidermis data used in our analysis. Panel A shows permeability values for the Patel, Zhang, and Ellison epidermis permeabilities versus . This plot presents the results of the multi-linear regression for both and , but only is shown on the X-axis. Changes in color represent the for each individual chemical, thus serving as a third dimension for a two-axis plot. We added panel B for added clarity, this time presenting MW as the independent axis, whereas is presented by changes in color. The range for each color variable is given in the legend of each figure. The Ellison epidermis analysis presented in Figure 3 shows a distinct difference from the Patel and Zhang datasets.
FIGURE 3.
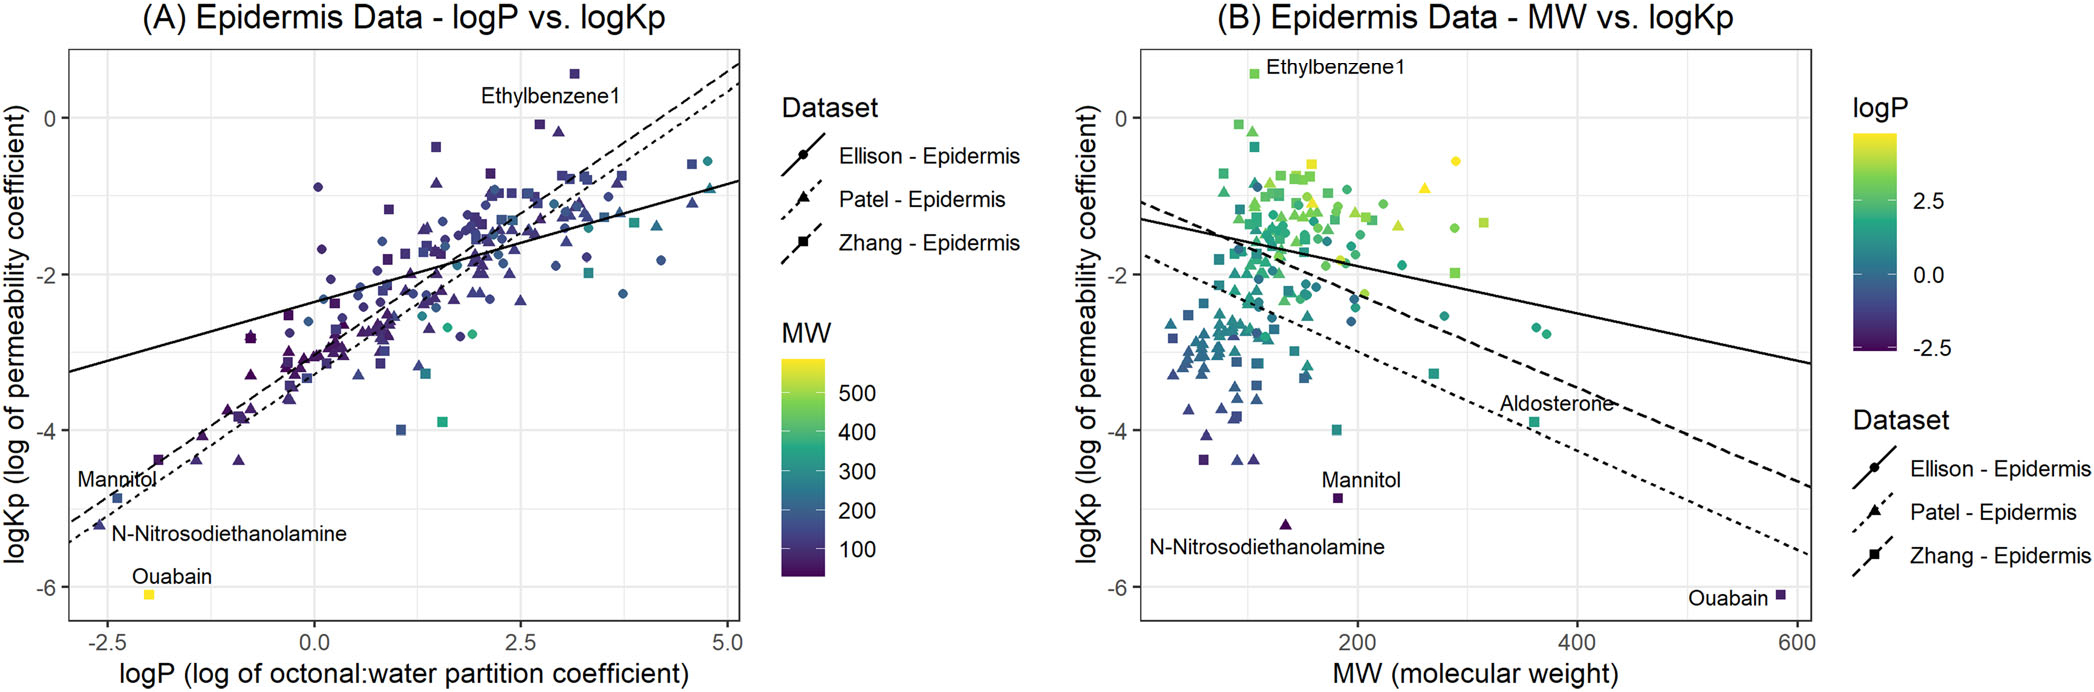
Bubble plots comparing versus logP (A) and (B). The color legend presents the range of values used for each plot.
Figure 4 shows regression results between predicted (2D model) and experimental permeabilities for each dataset. In this figure, Flynn, Wilschut, Patel, and Zhang use the epidermis only. Hewitt and Ellison use dermatomed data, including a section of the dermis. The highest belongs to the Hewitt 2D regression, followed by Patel. The lowest value obtained corresponds to Ellison. An explanation for this outcome is offered in the Discussion section.
FIGURE 4.

Experimental versus predicted permeability regression plots for each dataset
Figure 5 presents different modeling combinations based on the number of skin compartments that can be included for simulation. For in vitro experimentation, the receptor fluid serves as the sampling compartment. For in vivo experiments, capillaries are included within the dermis compartment and provide a transport mechanism for the absorbed chemical into the blood and the rest of the body. For either case, the modeler chooses the number of compartments needed to describe absorption. Model complexity will be addressed in the Discussion section.
FIGURE 5.

Schematic representation of different compartmental levels including different skin membranes. In general, diffusion is assumed to be bi-directional.
4 |. DISCUSSION
Because of its relevance in estimating skin absorption, permeability has been described using several chemical and molecular descriptors available in the literature (Brown et al., 2016; Geinoz et al., 2004). The resulting Potts–Guy equation was obtained by multiple regression of experimentally measured penetration using and logP as independent variables. The Potts–Guy equation was obtained using epidermal membranes, with the assumption that passive diffusion occurs from the upper SC layer (Potts & Guy, 1992). The Potts–Guy equation relates permeability for the epidermis but may not be applicable to deeper layers in the skin as classified by logP (i.e., lipophilic chemicals).
We decided to look at the literature to examine if skin permeability is determined mainly by logP. Zhang et al. (2009) used the maximum flux parameter (proportional to permeability) and found a convex shape (having a maximum), demonstrating the dependence of absorption on logP, and a decrease in flux for lipophilic compounds. Mitragotri (2003) suggests four different pathways for solute permeability in the SC that are related to structures present in the SC like pores and hair follicles. As shown in Figure 1, different structures may contribute to differences in permeability in different layers. To our knowledge, Cross et al. (2003) were the first to determine a change in permeability present in different skin layers. Their work suggested that the dermis layer is the determining factor for the absorption of lipophilic compounds. Due to the small class of chemicals examined in their work (alcohols), we decided to take another look at this question with larger datasets.
We then concentrated on obtaining permeability regressions for different skin layers, shown in Figure 2. In general, regressions showed increased variability as the dermis compartment was included. The first two datasets are for the epidermis only, Patel and Zhang. The data points tightly approach the regression line, and regression coefficients reflect higher goodness of fit. As we examine Figure 2 from top to bottom, we find datasets with different combinations of the dermis. Both Hewitt and Ellison use dermatomed skin (although at different lengths) to include a partial dermis compartment. Finally, full skin can be compared with the epidermis only. The observed increase in the scatter from top to bottom is correlated to the presence of dermis included within the skin sample.
A comparison of all epidermis permeability calculations is shown in Figure 3A and B. This plot presents the results of the multi-linear regression for both MW and logP. The Ellison epidermis analysis presented in Figure 3 shows a distinct difference from the Patel and Zhang datasets. One possible explanation is due to methodological differences between the experiments, which span years between 2002 and 2020. However, the calculation method is also quite different between Ellison et al. (2020) and the earlier datasets. Patel et al. (2002) cite using Flynn’s permeability results in their manuscript. Both Flynn and Zhang use the flux method for permeability calculation (Flynn et al., 1990; Zhang et al., 2012). However, Ellison et al. (2020) use a different approach. Membrane theory allows for the calculation of permeability if diffusion, partition coefficients, and membrane parameters are known . We suggest the reason for the differences in slope present in Figure 3 is the differences in calculation between the permeability methods. We believe that a parallel slope was obtained due to the application of the same calculation method for both datasets (Patel and Zhang), whereas a different calculation method was used by Ellison et al. (2020). Future research could evaluate potential differences between the two permeability estimation methods. We would like to note that both Hewitt et al. (2020) and Ellison et al. (2020) adopt OECD guidelines for skin experiments (OECD, 2004, 2011). These guidelines encourage standardization of methodology and experimental analyses. However, these guidelines were not available for earlier experiments.
Probably the most novel contribution of our work is the application of a hybrid mechanistic and QSAR 2D model to estimate permeabilities. The 2D permeability calculations improved the regression fits . In addition, the scatter around regression data was reduced after the application of the 2D model. At first glance, the Potts–Guy and 2D regression equations appear to have similar coefficients and slope directions. However, it is important to consider two facts: 1) The Hewitt dataset was obtained by adopting the OECD guidelines for skin absorption experiments, and 2) the Hewitt dataset includes a dermis compartment. Given the importance of the dermis for chemical transport into the blood, as well as the potential site for toxicity, we feel that it is important to include this compartment in a QSAR-type equation for permeability estimation. Our updated QSAR equation can be considered to provide an “averaged” permeability value for all layers, including the dermis. We believe this representation to be more compatible with full skin, which includes a dermis compartment. The overall effect is to obtain a permeability value that is equivalent to a one-compartment model, taking into account all membrane layers.
We would like to note that Hewitt et al. (2020) use very similar chemicals (related to cosmetics) when compared to Ellison et al. (2020), since the same group of researchers participated in both studies. There were 32 chemicals in common, and we obtained similar values for both datasets (Table 1). Hewitt et al. (2020) check to determine if the chemical exposure has achieved steady-state conditions. If a steady state is not achieved, the 2D model predicts an equivalent infinite dose permeability value (described in the Methods section). The predicted infinite dose permeability obtained from the 2D Surrey modeling can be then compared to all other studies, which used infinite dosing. In this way, a common form of exposure can be considered for the analysis.
Figure 5 suggests different types of experiments that could be performed in vitro. Future modeling studies can also include additional layers for a given model, if needed to describe additional skin or mechanistic complexities. The following modeling strategy comes to mind: Obtain a permeability value for the epidermis using one of the listed equations, and then, estimate SC permeability using a regression obtained by comparing epidermis and SC permeabilities from the Ellison dataset. At this point in time, dermis permeability can be estimated using equations presented in Kretsos et al. (2008). Dermal models can make use of the simplifying assumption that the dermis and epidermis are similar, thus allowing us to combine these two compartments. With these assumptions, the modeler can choose between using a one-compartment or a two-compartment model to evaluate a dataset. With additional dermis permeability estimates, then, we can make use of a three-compartment model, thus separating the dermis from the combined viable tissue compartment. With the substitution of blood for receptor fluid, we can use the same permeability estimates to calibrate an in vivo model. The modeler will assess the complexity necessary based on the available data and permeability estimates. In conclusion, this approach offers the ability and flexibility to choose the level of modeling complexity required given the data available.
4.1 |. Future research
Using a compartmental model representing skin, the influx rate of a chemical into the section of skin exposed to a chemical-containing medium is dependent on :
where is the chemical concentration in the medium, SA (cm2) is the surface area of the exposed skin, is the skin permeability coefficient, is skin concentration, and is the skin-to-media partition coefficient. Our has units of cm/h. Our skin permeability calculations represent the first step in the development of a skin route to be interfaced with a high-throughput PBPK model publicly available as the R package “httk” (https://cran.r-project.org/web/packages/httk/index.html). The utility of a combined skin and PBPK model has been demonstrated for case chemicals (Moxon et al., 2020) and will be extended by the inclusion of a skin exposure compartment with “httk.” A one-compartment skin route is currently being implemented into httk, with the addition of multiple layers being considered for future research.
Supplementary Material
ACKNOWLEDGEMENTS
The authors wish to thank Drs. R. Tornero-Velez, M. Goldsmith, P. Egeghy, and M. DeVito for internal review of this manuscript. Ms. Madison Goldsmith created the graphic for the skin used in Figure 1A. Mr. Christopher Eklund assisted with data curation and organization.
Funding information
Mr. Benjamin Deacon has been supported by a PhD studentship grant from the UK Biotechnology and Biological Sciences Research Council (BB/S50709X/1) in collaboration with Unilever.
Footnotes
CONFLICT OF INTEREST
The authors declare no competing financial interests.
Disclaimer: This document has been reviewed in accordance with U.S. Environmental Protection Agency policy and approved for publication. Any mention of trade names, manufacturers, or products does not imply an endorsement by the United States Government or the U.S. Environmental Protection Agency. EPA and its employees do not endorse any commercial products, services, or enterprises.
SUPPORTING INFORMATION
Additional supporting information can be found online in the Supporting Information section at the end of this article.
DATA AVAILABILITY STATEMENT
All data analyzed has been previously published and organized using Excel spreadsheets. The Excel spreadsheets are included in the Supporting Information section. This material is available free of charge via the Internet at http://pubs.acs.org.
REFERENCES
- Anissimov YG, & Roberts MS (2011). Modelling dermal drug distribution after topical application in human. Pharmaceutical Research, 28(9), 2119–2129. 10.1007/s11095-011-0437-2 [DOI] [PubMed] [Google Scholar]
- Behroozy AJIJOEM (2013). On dermal exposure assessment. The International Journal of Occupational and Environmental Medicine, 4-(3 July), 113–227. [PubMed] [Google Scholar]
- Breen M, Ring CL, Kreutz A, Goldsmith MR, & Wambaugh JF (2021). High-throughput PBTK models for in vitro to in vivo extrapolation. Expert Opinion on Drug Metabolism & Toxicology, 17(8), 903–921. [DOI] [PMC free article] [PubMed] [Google Scholar]
- Brown TN, Armitage JM, Egeghy P, Kircanski I, & Arnot JA (2016). Dermal permeation data and models for the prioritization and screening-level exposure assessment of organic chemicals. Environment International, 94, 424–435. 10.1016/j.envint.2016.05.025 [DOI] [PubMed] [Google Scholar]
- Chen L, Han L, Saib O, & Lian G (2015). In silico prediction of percutaneous absorption and disposition kinetics of chemicals. Pharmaceutical Research, 32(5), 1779–1793. 10.1007/s11095-014-1575-0 [DOI] [PubMed] [Google Scholar]
- Chen L, Lian G, & Han L (2008). Use of “bricks and mortar” model to predict transdermal permeation: Model development and initial validation. Industrial & Engineering Chemistry Research, 47(17), 6465–6472. 10.1021/ie701711v [DOI] [Google Scholar]
- Chen L, Lian G, & Han L (2010). Modeling transdermal permeation. Part I. predicting skin permeability of both hydrophobic and hydrophilic solutes. AICHE Journal, 56(5), 1136–1146. [Google Scholar]
- Chen T, Lian G, & Kattou P (2016). In silico modelling of transdermal and systemic kinetics of topically applied solutes: Model development and initial validation for transdermal nicotine. Pharmaceutical Research, 33(7), 1602–1614. 10.1007/s11095-016-1900-x [DOI] [PubMed] [Google Scholar]
- Cleek RL, & Bunge AL (1993). A new method for estimating dermal absorption from chemical exposure. 1. General approach. Pharmaceutical Research, 10(4), 497–506. 10.1023/A:1018981515480 [DOI] [PubMed] [Google Scholar]
- Coecke S, Pelkonen O, Leite SB, Bernauer U, Bessems JG, Bois FY, Gundert-Remy U, Loizou G, Testai E, & Zaldívar J-M (2013). Toxicokinetics as a key to the integrated toxicity risk assessment based primarily on non-animal approaches. Toxicology in Vitro, 27(5), 1570–1577. [DOI] [PubMed] [Google Scholar]
- Crank J (1979). The mathematics of diffusion. Oxford university press. [Google Scholar]
- Cross SE, Magnusson BM, Winckle G, Anissimov Y, & Roberts MS (2003). Determination of the effect of lipophilicity on the in vitro permeability and tissue reservoir characteristics of topically applied solutes in human skin layers. Journal of Investigative Dermatology, 120(5), 759–764. 10.1046/j.1523-1747.2003.12131.x [DOI] [PubMed] [Google Scholar]
- Ellison CA, Tankersley KO, Obringer CM, Carr GJ, Manwaring J, Rothe H, Duplan H, Géniès C, Grégoire S, & Hewitt NJ (2020). Partition coefficient and diffusion coefficient determinations of 50 compounds in human intact skin, isolated skin layers and isolated stratum corneum lipids. Toxicology in Vitro, 69, 104990. 10.1016/j.tiv.2020.104990 [DOI] [PubMed] [Google Scholar]
- Flynn GL, Gerrity T, & Henry C (1990). Principles of route-to-route extrapolation for risk assessment. In Physicochemical determinants of skin absorption (pp. 93–127). [Google Scholar]
- Geinoz S, Guy RH, Testa B, & Carrupt P-A (2004). Quantitative structure-permeation relationships (QSPeRs) to predict skin permeation: A critical evaluation. Pharmaceutical Research, 21(1), 83–92. 10.1023/B:PHAM.0000012155.27488.2b [DOI] [PubMed] [Google Scholar]
- Grégoire S, Sorrell I, Lange D, Najjar A, Schepky A, Ellison C, Troutman J, Fabian E, Duplan H, & Genies C (2021). Cosmetics Europe evaluation of 6 in silico skin penetration models. Computational Toxicology, 19, 100177. 10.1016/j.comtox.2021. 100177 [DOI] [Google Scholar]
- Hewitt NJ, Grégoire S, Cubberley R, Duplan H, Eilstein J, Ellison C, Lester C, Fabian E, Fernandez J, & Géniès C (2020). Measurement of the penetration of 56 cosmetic relevant chemicals into and through human skin using a standardized protocol. Journal of Applied Toxicology, 40(3), 403–415. 10.1002/jat.3913 [DOI] [PMC free article] [PubMed] [Google Scholar]
- Higuchi T (1960). Physical chemical analysis of percutaneous absorption process from creams and ointments. Journal of the Society of Cosmetic Chemists, 11, 85–97. [Google Scholar]
- Jepps OG, Dancik Y, Anissimov YG, & Roberts MS (2013). Modeling the human skin barrier—Towards a better understanding of dermal absorption. Advanced Drug Delivery Reviews, 65(2), 152–168. 10.1016/j.addr.2012.04.003 [DOI] [PubMed] [Google Scholar]
- Kasting GB, & Miller MA (2006). Kinetics of finite dose absorption through skin 2: Volatile compounds. Journal of Pharmaceutical Sciences, 95(2), 268–280. 10.1002/jps.20497 [DOI] [PubMed] [Google Scholar]
- Kattou P, Lian G, Glavin S, Sorrell I, & Chen T (2017). Development of a two-dimensional model for predicting transdermal permeation with the follicular pathway: Demonstration with a caffeine study. Pharmaceutical Research, 34(10), 2036–2048. 10.1007/s11095-017-2209-0 [DOI] [PMC free article] [PubMed] [Google Scholar]
- Kladt C, Dennerlein K, Göen T, Drexler H, & Korinth G (2018). Evaluation on the reliability of the permeability coefficient (Kp) to assess the percutaneous penetration property of chemicals on the basis of Flynn’s dataset. International Archives of Occupational and Environmental Health, 91(4), 467–477. 10.1007/s00420-018-1296-5 [DOI] [PubMed] [Google Scholar]
- Kretsos K, Kasting GB, & Nitsche JM (2004). Distributed diffusion–clearance model for transient drug distribution within the skin. Journal of Pharmaceutical Sciences, 93(11), 2820–2835. 10.1002/jps.20187 [DOI] [PubMed] [Google Scholar]
- Kretsos K, Miller MA, Zamora-Estrada G, & Kasting GB (2008). Partitioning, diffusivity and clearance of skin permeants in mammalian dermis. International Journal of Pharmaceutics, 346(1–2), 64–79. 10.1016/j.ijpharm.2007.06.020 [DOI] [PubMed] [Google Scholar]
- Krewski D, Andersen ME, Tyshenko MG, Krishnan K, Hartung T, Boekelheide K, Wambaugh JF, Jones D, Whelan M, & Thomas R (2020). Toxicity testing in the 21st century: Progress in the past decade and future perspectives. Archives of Toxicology, 94(1), 1–58. [DOI] [PubMed] [Google Scholar]
- Lehman PA (2014). A simplified approach for estimating skin permeation parameters from in vitro finite dose absorption studies. Journal of Pharmaceutical Sciences, 103(12), 4048–4057. 10.1002/jps.24189 [DOI] [PubMed] [Google Scholar]
- Lian G, Chen L, Pudney PD, Mélot M, & Han L (2010). Modeling transdermal permeation. Part 2. Predicting the dermatopharmacokinetics of percutaneous solute. AICHE Journal, 56(10), 2551–2560. 10.1002/aic.12146 [DOI] [Google Scholar]
- Linakis MW, Sayre RR, Pearce RG, Sfeir MA, Sipes NS, Pangburn HA, Gearhart JM, & Wambaugh JF (2020). Development and evaluation of a high throughput inhalation model for organic chemicals. Journal of Exposure Science & Environmental Epidemiology, 30(5), 866–877. 10.1038/s41370-020-0238-y [DOI] [PMC free article] [PubMed] [Google Scholar]
- Maxwell G, MacKay C, Cubberley R, Davies M, Gellatly N, Glavin S, Gouin T, Jacquoilleot S, Moore C, & Pendlington R (2014). Applying the skin sensitisation adverse outcome pathway (AOP) to quantitative risk assessment. Toxicology in Vitro, 28(1), 8–12. 10.1016/j.tiv.2013.10.013 [DOI] [PubMed] [Google Scholar]
- Mitragotri S (2003). Modeling skin permeability to hydrophilic and hydrophobic solutes based on four permeation pathways. Journal of Controlled Release, 86(1), 69–92. 10.1016/S0168-3659(02)00321-8 [DOI] [PubMed] [Google Scholar]
- Mitragotri S, Anissimov YG, Bunge AL, Frasch HF, Guy RH, Hadgraft J, Kasting GB, Lane ME, & Roberts MS (2011). Mathematical models of skin permeability: An overview. International Journal of Pharmaceutics, 418(1), 115–129. 10.1016/j.ijpharm.2011.02.023 [DOI] [PubMed] [Google Scholar]
- Moxon TE, Li H, Lee M-Y, Piechota P, Nicol B, Pickles J, Pendlington R, Sorrell I, & Baltazar MT (2020). Application of physiologically based kinetic (PBK) modelling in the next generation risk assessment of dermally applied consumer products. Toxicology in Vitro, 63, 104746. 10.1016/j.tiv.2019.104746 [DOI] [PubMed] [Google Scholar]
- National Academies of Sciences, E. and Medicine. (2017). Using 21st century science to improve risk-related evaluations. National Academies Press. [PubMed] [Google Scholar]
- OECD. (2004). Test No. 428: Skin Absorption: In Vitro Method.
- OECD. (2011). Guidance notes on dermal absorption, series on testing and assessment. Organisation for Economic Co-operation and Development. [Google Scholar]
- Patel H, ten Berge W, & Cronin MT (2002). Quantitative structure–activity relationships (QSARs) for the prediction of skin permeation of exogenous chemicals. Chemosphere, 48(6), 603–613. 10.1016/S0045-6535(02)00114-5 [DOI] [PubMed] [Google Scholar]
- Potts RO, & Guy RH (1992). Predicting skin permeability. Pharmaceutical Research, 9(5), 663–669. 10.1023/A:1015810312465 [DOI] [PubMed] [Google Scholar]
- Shen J, Kromidas L, Schultz T, & Bhatia S (2014). An in silico skin absorption model for fragrance materials. Food and Chemical Toxicology, 74, 164–176. 10.1016/j.fct.2014.09.015 [DOI] [PubMed] [Google Scholar]
- Wambaugh JF, Bare JC, Carignan CC, Dionisio KL, Dodson RE, Jolliet O, Liu X, Meyer DE, Newton SR, & Phillips KA (2019). New approach methodologies for exposure science. Current Opinion in Toxicology, 15, 76–92. [Google Scholar]
- Wambaugh JF, Hughes MF, Ring CL, MacMillan DK, Ford J, Fennell TR, Black SR, Snyder RW, Sipes NS, & Wetmore BA (2018). Evaluating in vitro-in vivo extrapolation of toxicokinetics. Toxicological Sciences, 163(1), 152–169. 10.1093/toxsci/kfy020 [DOI] [PMC free article] [PubMed] [Google Scholar]
- Wang L, Chen L, Lian G, & Han L (2010). Determination of partition and binding properties of solutes to stratum corneum. International Journal of Pharmaceutics, 398(122), 114–122. 10.1016/j.ijpharm.2010.07.035 [DOI] [PubMed] [Google Scholar]
- Wang T-F, Kasting GB, & Nitsche JM (2006). A multiphase microscopic diffusion model for stratum corneum permeability. I. Formulation, solution, and illustrative results for representative compounds. Journal of Pharmaceutical Sciences, 95(3), 620–648. 10.1002/jps.20509 [DOI] [PubMed] [Google Scholar]
- Wang T-F, Kasting GB, & Nitsche JM (2007). A multiphase microscopic diffusion model for stratum corneum permeability. II. Estimation of physicochemical parameters, and application to a large permeability database. Journal of Pharmaceutical Sciences, 96(11), 3024–3051. 10.1002/jps.20883 [DOI] [PubMed] [Google Scholar]
- Williams AJ, Grulke CM, Edwards J, McEachran AD, Mansouri K, Baker NC, Patlewicz G, Shah I, Wambaugh JF, & Judson RS (2017). The CompTox chemistry dashboard: A community data resource for environmental chemistry. Journal of Cheminformatics, 9(1), 61. 10.1186/s13321-017-0247-6 [DOI] [PMC free article] [PubMed] [Google Scholar]
- Williams FM (2004). EDETOX. Evaluations and predictions of dermal absorption of toxic chemicals. International Archives of Occupational and Environmental Health, 77(2), 150–151. 10.1007/s00420-003-0484-z [DOI] [PubMed] [Google Scholar]
- Wilschut A, Wil F, Robinson PJ, & McKone TE (1995). Estimating skin permeation. The validation of five mathematical skin permeation models. Chemosphere, 30(7), 1275–1296. 10.1016/0045-6535(95)00023-2 [DOI] [PubMed] [Google Scholar]
- Yousef S, Liu X, Mostafa A, Mohammed Y, Grice JE, Anissimov YG, Sakran W, & Roberts MS (2016). Estimating maximal in vitro skin permeation flux from studies using non-sink receptor phase conditions. Pharmaceutical Research, 33(9), 2180–2194. 10.1007/s11095-016-1955-8 [DOI] [PubMed] [Google Scholar]
- Zhang K, Chen M, Scriba GK, Abraham MH, Fahr A, & Liu X (2012). Human skin permeation of neutral species and ionic species: Extended linear free energy relationship analyses. Journal of Pharmaceutical Sciences, 101(6), 2034–2044. 10.1002/jps.23086 [DOI] [PubMed] [Google Scholar]
- Zhang Q, Grice JE, Li P, Jepps OG, Wang G-J, & Roberts MS (2009). Skin solubility determines maximum transepidermal flux for similar size molecules. Pharmaceutical Research, 26(8), 1974–1985. [DOI] [PubMed] [Google Scholar]
Associated Data
This section collects any data citations, data availability statements, or supplementary materials included in this article.
Supplementary Materials
Data Availability Statement
All data analyzed has been previously published and organized using Excel spreadsheets. The Excel spreadsheets are included in the Supporting Information section. This material is available free of charge via the Internet at http://pubs.acs.org.