

Abstract
Background:
Evidence exists that escalating melanoma incidence is due in part to overdiagnosis, the diagnosis of lesions that will not lead to symptoms or death. The authors aimed to characterize subsets of melanoma patients with very-low risk of death that may be contributing to overdiagnosis.
Methods:
Melanoma patients diagnosed in 2010 and 2011 with stage I lesions ≤1.0 mm thick and negative clinical lymph nodes from the Surveillance, Epidemiology, and End Results database were selected. Classification and regression tree and logistic regression models were developed and validated to identify patients with very-low risk of death from melanoma within 7 years. Logistic models were also used to identify patients at higher risk of death among this group of stage I patients.
Results:
Compared to an overall 7-year mortality from melanoma of 2.5% in these patients, a subset comprising 25% had a risk below 1%. Younger age at diagnosis and Clark level II were associated with low risk of death in all models. Breslow thickness below 0.4 mm, absence of mitogenicity, absence of ulceration, and female sex were also associated with lower mortality. A small subset of high-risk patients with >20% risk of death was also identified.
Conclusion:
Patients with very-low risk of dying from melanoma within 7 years of diagnosis were identified. Such cases warrant further study and consensus discussion to develop classification criteria, with the potential to be categorized using an alternative term such as “melanocytic neoplasms of low malignant potential.”
Keywords: melanoma, overdiagnosis, prognosis, regression analysis, SEER program
Lay summary
Although melanoma is the most serious skin cancer, most melanoma patients have high chances of survival.
There is evidence that some lesions diagnosed as melanoma would never have caused symptoms or death, a phenomenon known as overdiagnosis.
In this study, we used cancer registry data to identify a subset of early-stage melanoma patients with almost no melanoma deaths.
Using two statistical approaches, we identified patients with <1% risk of dying from melanoma in 7 years.
Such patients tended to be younger with minimal invasion into the skin.
We also identified a very small patient subset with higher mortality risk.
INTRODUCTION
Melanoma is considered the most common potentially lethal tumor of the skin. However, the prognosis is very good for patients with melanoma in the lowest category of risk, T1 melanoma, in the current staging system of the American Joint Committee on Cancer (AJCC), 8th edition.1 Prognostic modeling has been used to predict survival in patients with melanoma and identify prognostic variables. The most prominent attributes are Breslow thickness2 and ulceration of the primary tumor,3 which form the basis of the current AJCC staging system. Mitotic rate (the presence and number of mitoses) and Clark levels of invasion III and greater are also associated with increased risk of progression.4–6 Additionally, tumorigenicity or vertical growth phase (VGP), which represents expansile growth in the dermis, has been shown to be strongly associated with poorer outcomes.7–10
We are interested in identifying lesions currently diagnosed as melanoma that might lack competence for metastasis. Such cases could potentially account for part of the phenomenon of overdiagnosis, in which lesions diagnosed as melanoma do not have capacity to harm patients.11 Cases that lack VGP/tumorigenicity might qualify,7–9 but these characteristics are not available in the Surveillance, Epidemiology, and End Results (SEER) cancer registry database. We hypothesized that characteristics included in the AJCC system and SEER database might act as surrogates, perhaps imperfectly. Specifically, we developed prognostic models for risk of death from melanoma in patients with low risk melanomas diagnosed in 2010 and 2011 from the SEER database. We evaluated the models’ ability to identify very-low risk subsets of patients with melanoma-specific survival surpassing that of T1 overall. Additionally, we considered whether models could identify a subset of patients with high risk of death from melanoma. We used two complementary methods for building logistic regression. We believed this strategy, and the presentation of multiple models, might enhance identification of significant prognostic variables for the purposes of hypothesis-generating.
MATERIALS AND METHODS
Data source
We used SEER cancer registry research data to develop and validate models. We selected patients from the November 2020 submission comprised of 18 population-based registries covering approximately 28% of the US population.12,13 The database includes patients diagnosed from 2000 to 2018, with survival follow-up through December 2018. The SEER research database includes Breslow thickness, ulceration, Clark level, stage of disease, and mitotic rate, but does not include VGP/tumorigenicity or regression.12 Because mitotic rate was added for the 7th edition of the AJCC system,14 we selected patients diagnosed using AJCC 7th edition criteria. To capture sufficient follow-up to evaluate 7-year survival, we limited analysis to patients diagnosed in 2010 and 2011.
Study sample
We used SEER*Stat (Surveillance Research Program, National Cancer Institute SEER*Stat software [http://www.seer.cancer.gov/seerstat] version 8.3.9.) to select patients with melanoma of the skin diagnosed in 2010 or 2011 with no prior melanoma diagnoses in SEER (N = 35,304). To limit to low-risk thin melanoma cases, we rounded Breslow thickness to the nearest 0.1 mm, then selected only patients whose lesions were ≤1.0 mm, stage I, and had negative clinical lymph nodes. Those with missing or unknown ulceration, mitogenicity, or Clark level were excluded. Patients were required to have complete 7-year follow-up, which we defined as survival for 7 years or death from melanoma within 7 years, leaving a study sample of 11,594. Patients with less than 7 years of follow-up, or who died of other or unknown causes before 7 years, were excluded from the main analysis. See Figure S1 for details. We also performed a sensitivity analysis using a Fine-Gray competing risk model that included patients who died of other causes.
Outcome and predictors
The outcome for all models is a binary variable indicating death from melanoma within 7 years or survival for 7 years.
Demographic predictors included sex and age at diagnosis. Age is quantitative, except that patients older than 85 years were assigned age 85 years for analysis. Clinical characteristics at diagnosis include Breslow thickness, ulceration, mitogenicity, and Clark level. Breslow thickness is measured in 0.01 mm increments in the analysis data set (in the current AJCC 8th edition, increments are 0.1 mm). Ulceration and mitogenicity are binary variables indicating presence vs. absence of ulceration or mitotic figures. For Clark level, we created a binary variable indicating level II vs. all other values from the SEER variable for tumor extension (see Table S1 for details).
Statistical analysis
We randomly divided the sample into training (67%) and testing (33%) sets. The testing data were reserved until after the final selection of candidate models developed using the training data. We used classification and regression tree (CART) analysis and logistic regression to develop models using the training data. We developed multiple CART models by varying the weights assigned to patients with the event (i.e., death from melanoma) and by varying the degree of cost–complexity pruning. Patients with vs. without the event were either weighted 42:1, which made the total weight of the two groups approximately equal; or weighted 160:1, reflecting the maximum amount of re-weighting enabled in the software and reflecting our goal of identifying a low-risk subgroup. Age and Breslow thickness were included as quantitative variables; thresholds for quantitative variables are identified by the CART algorithm if selected for the classification tree.
Initial logistic regression models included one model using all predictors (Table S2) and one using the subset of predictors thought to be most relevant (age, Breslow thickness, ulceration, mitogenicity, and Clark level). Secondary models dropped nonsignificant predictors from the two initial models. We used a bootstrap technique to recalibrate logistic models on the training data before any evaluation on the testing data.15 CART and logistic regression were performed in SAS 9.4 (SAS Institute Inc, Cary, North Carolina) and recalibration was done using the “rms” package in R (R Core Team 2020, Vienna, Austria).
We calculated area under the receiver-operating characteristic curve (AUC) for an overall summary of each model; however, AUC is not the primary performance metric of interest. CART models classify patients into two groups, nominally patients predicted to die and patients predicted to survive. For CART models, we examined the proportion of patients predicted to survive and the proportion of that subset that actually died within 7 years. Logistic regression models assign patients an estimated risk of death from 0% to 100%. For comparison with CART models, we examined the proportion assigned risk <0.5%, which we believe is a reasonable threshold to define “very-low” risk of death. Additionally, we examined patients who were assigned risk ≥20% in the logistic models, because this is a reasonable threshold for consideration of adjuvant therapy.
Finally, we applied models to an earlier cohort as an additional assessment of performance for 7-year survival and to examine 10-year survival. We selected patients diagnosed using AJCC 6th edition staging criteria from 2004 to 2009. Sample selection was similar to the primary analysis sample, except mitotic rate was not routinely collected in this era, therefore cases missing mitotic rate were not excluded. We only evaluated models without mitogenicity. We examined 7-year risk of death from melanoma in cases diagnosed from 2004 to 2009 and 10-year risk of death in cases diagnosed from 2004 to 2008.
RESULTS
The study sample of 11,594 patients contained slightly more males (54%) than females (46%) (Table 1). Median age was 58 years (interquartile range [IQR], 48–68 years). Median Breslow thickness was 0.45 mm (IQR, 0.30–0.65 mm) and 71% were assigned stage IA. Ulceration was present for 4% of cases, 27% were mitogenic, and 45% were Clark level II.
TABLE 1.
Demographic and clinical characteristics of study sample
| Patient characteristics | All patients (N = 11,594), No. (%) | Training patients (N = 7652), No. (%) | Testing patients (N = 3942), No. (%) |
|---|---|---|---|
| Demographics | |||
| Agea | |||
| Age, mean (SD), year | 57.3 (14.9) | 57.4 (14.9) | 57.2 (15.0) |
| Age, median (IQR), year | 58 (48–68) | 59 (47–68) | 58 (48–68) |
| Sex | |||
| Female | 5375 (46%) | 3566 (47%) | 1809 (46%) |
| Male | 6219 (54%) | 4086 (53%) | 2133 (54%) |
| Year of diagnosis | |||
| 2010 | 5565 (48%) | 3681 (48%) | 1884 (48%) |
| 2011 | 6029 (52%) | 3971 (52%) | 2058 (52%) |
| Clinical factors | |||
| AJCC 7th Edition stage | |||
| IA | 8216 (71%) | 5430 (71%) | 2786 (71%) |
| IB | 3350 (29%) | 2201 (29%) | 1149 (29%) |
| INOS | 28 (0%) | 21 (0%) | 7 (0%) |
| Breslow thickness | |||
| Breslow thickness, mean (SD) | 0.49 (0.24) | 0.49 (0.24) | 0.49 (0.25) |
| Breslow thickness, median (IQR) | 0.45 (0.30–0.65) | 0.45 (0.30–0.65) | 0.45 (0.30–0.65) |
| Ulceration | |||
| Ulceration not identified/not present | 11,177 (96%) | 7382 (96%) | 3795 (96%) |
| Ulceration present | 417 (4%) | 270 (4%) | 147 (4%) |
| Mitogenicity | |||
| Nonmitogenic | 8423 (73%) | 5564 (73%) | 2859 (73%) |
| Mitogenic | 3171 (27%) | 2088 (27%) | 1083 (27%) |
| Extension/Clark level | |||
| Clark level II | 5231 (45%) | 3458 (45%) | 1773 (45%) |
| Other | 6363 (55%) | 4194 (55%) | 2169 (55%) |
| Vital status at 7 years | |||
| Alive | 11,302 (97.5%) | 7475 (97.7%) | 3827 (97.1%) |
| Died (attributable to this cancer) | 292 (2.5%) | 177 (2.3%) | 115 (2.9%) |
Abbreviations: AJCC, American Joint Committee on Cancer; IQR, interquartile range; SD, standard deviation.
Age greater than 85 years reported as 85 years.
Of the 11,594 patients, 292 (2.5%) died of melanoma within 7 years. In the training data set, 177 of 7652 patients (2.3%) died of melanoma within 7 years; in the testing data set, 115 of 3942 patients (2.9%) died of melanoma within 7 years.
Model identification and assessment
Using only the training data to develop and select models, we identified three CART models and one logistic regression model of interest. The selected CART models all demonstrated potential to identify a substantial subset of patients with excellent prognosis. All logistic regression models showed similar performance in the training data, and we selected the most parsimonious model to validate. Model 1A is a CART model that classifies patients using only age (cutpoint 69 years) and Clark level. Model 1B extends Model 1A with an additional branch using age (cutpoint 43 years) and Breslow thickness (cutpoint 0.40 mm). Figure 1 depicts Model 1A and 1B. Model 2 is a risk prediction model constructed using logistic regression and uses continuous age, sex, Clark level, ulceration, and mitogenicity (Table 2). The fourth model, Model 3, is a CART model that classifies patients using age (cutpoint 69 years), Clark level, ulceration status, and mitogenicity (Figure S3; Table S3). Based on final results (described below), we focus on Model 1A, 1B, and 2.
FIGURE 1.
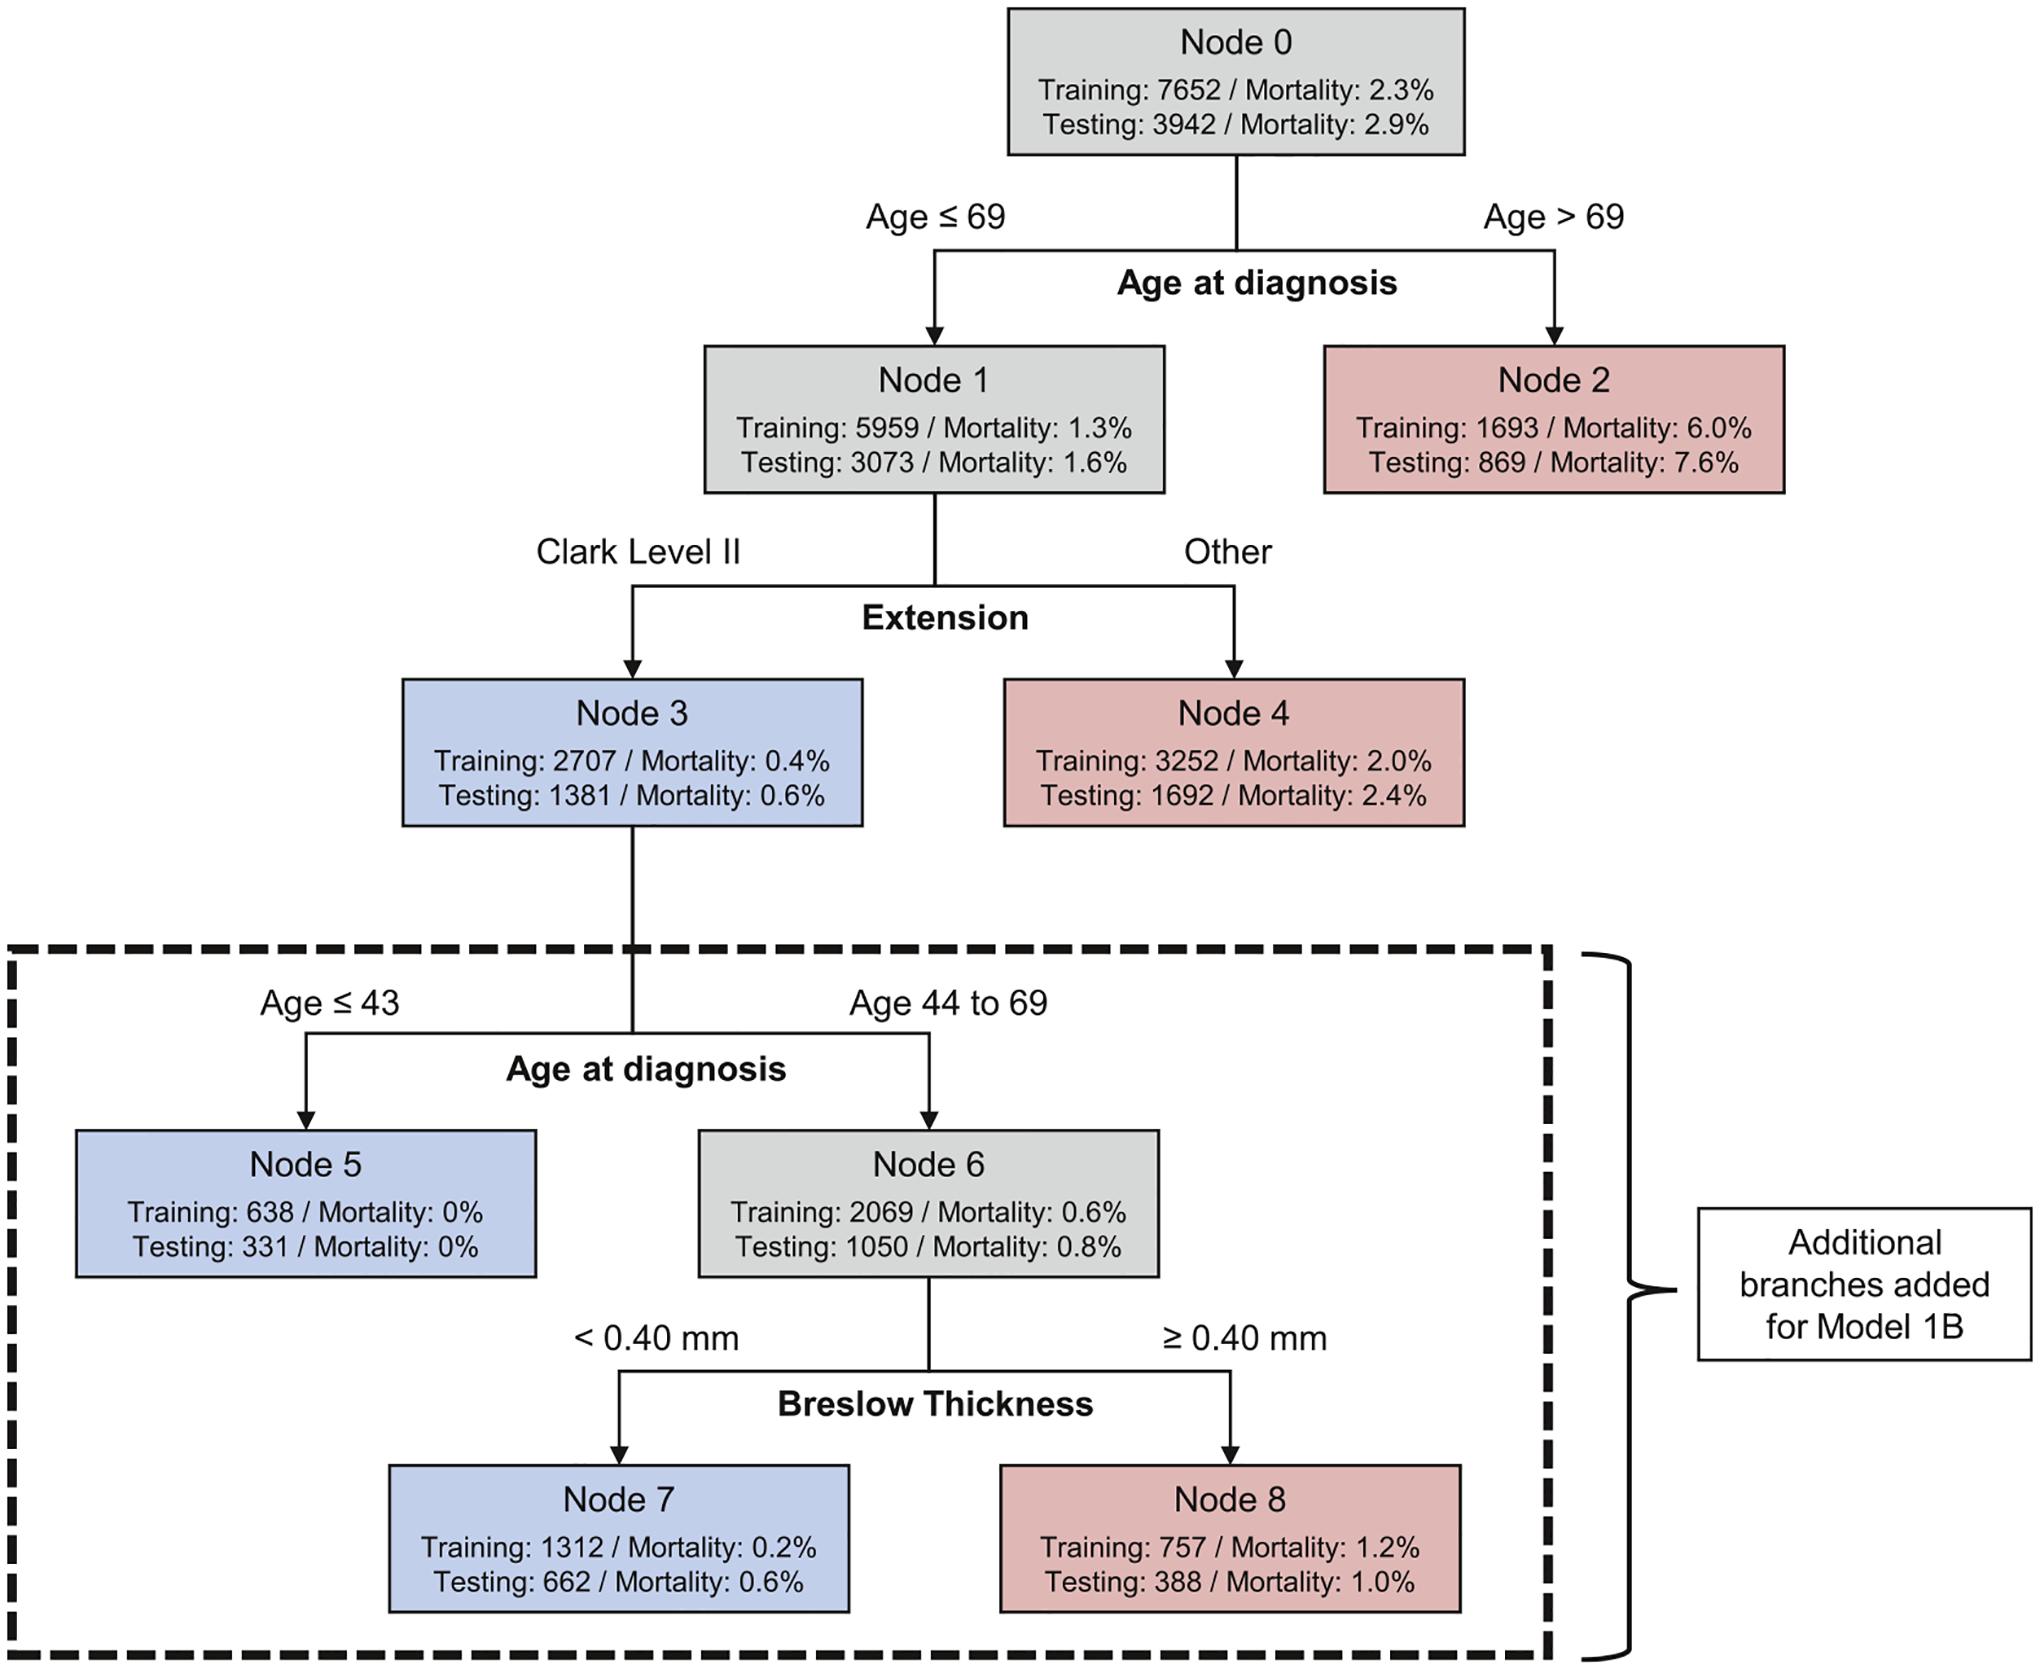
Model 1A has three leaves (nodes 2, 3, and 4). Model 1B with five leaves includes additional tree branches in the dashed box. The diagram displays the number of patients in each node and the proportion of patients in the node who died. Blue leaves indicate subsets of patients classified as low-risk of death and red leaves indicate subsets of patients classified as relatively higher risk of death. These models were constructed in the training data set weighting patients who died within 7 years 160:1 compared to patients who survived. The two models result from different levels of pruning.
TABLE 2.
Logistic regression parameter estimates (Model 2)
| Covariate | Comparison | Parameter estimate | SE | p | OR estimate | Recalibrated parameter estimate |
|---|---|---|---|---|---|---|
| Intercept | −9.1747 | 0.5007 | <.0001 | . | −9.0920 | |
| Age at diagnosis | Continuous | 0.0664 | 0.00676 | <.0001 | 1.069 | 0.0655 |
| Sex | Male vs. female (ref) | 0.4843 | 0.1720 | 0.0049 | 1.623 | 0.4780 |
| Clark level | Other vs. Clark level II (ref) | 0.5691 | 0.1945 | 0.0034 | 1.767 | 0.5616 |
| Ulceration | Ulceration present vs. ulceration not identified/not present (ref) | 1.4333 | 0.2187 | <.0001 | 4.193 | 1.4144 |
| Mitogenicity | Mitogenic vs. nonmitogenic (ref) | 0.9708 | 0.1709 | <.0001 | 2.640 | 0.9579 |
Note: Recalibrated parameter estimates were calculated using the estimated recalibration slope (0.9868) and recalibration intercept (−0.0384). Abbreviations: OR, odds ratio; SE, standard error.
Table 3 summarizes model performance for the low-risk group identified by CART models and those with risk of death <0.5% for the logistic model. Table 3A shows performance in the training data in the top panel; these results were used to evaluate all candidate models and select the final models to evaluate on the testing data. Model performance is slightly diminished in the testing data (Table 3A, second panel) compared to the training data, which is expected because models were developed using the training data. We focus on testing data results as the most objective assessment.
TABLE 3.
Model performance metrics for predicting death from melanoma within 7 years
| Model | AUC | Proportion of sample with low risk of death, No. (%) | No. in subset that died | Risk of melanoma death in subset (95% CI) |
|---|---|---|---|---|
| A. Model performance and AUC for identifying patients at low risk of death from melanoma within 7 yearsa | ||||
| Training data using 2010–2011 cohort (N = 7652)b | ||||
| Model 1A: CART model with 3 leaves | 0.73 | 2707 (35) | 12 | 0.44% (0.25%, 0.77%) |
| Model 1B: CART model 5 leaves | 0.74 | 1950 (25) | 3 | 0.15% (0.05%, 0.45%) |
| Model 2: logistic model, risk of death <0.5% | 0.80 | 1896 (25) | 9 | 0.47% (0.25%, 0.90%) |
| Testing data using 2010–2011 cohort (N = 3942)c | ||||
| Model 1A: CART model with 3 leaves | 0.64 | 1381 (35) | 8 | 0.58% (0.29%, 1.14%) |
| Model 1B: CART model with 5 leaves | 0.61 | 993 (25) | 4 | 0.40% (0.16%, 1.03%) |
| Model 2: logistic model, risk of death < 0.5% | 0.78 | 969 (25) | 5 | 0.52% (0.22%, 1.20%) |
| 7-year follow-up using 2004–2009 cohort (N = 47,171)d | ||||
| Model 1A: CART model with 3 leaves | 0.67 | 19,834 (42) | 126 | 0.64% (0.53%, 0.76%) |
| Model 1B: CART model with 5 leaves | 0.63 | 14,428 (31) | 77 | 0.53% (0.43%, 0.67%) |
| 10-year follow-up using 2004–2008 cohort (N = 35,526)e | ||||
| Model 1A: CART model with 3 leaves | 0.67 | 15,706 (44) | 165 | 1.05% (0.90%, 1.22%) |
| Model 1B: CART model with 5 leaves | 0.63 | 11,498 (32) | 97 | 0.84% (0.69%, 1.03%) |
| Proportion of sample with high risk of death, No. (%) | No. in subset that died | Risk of melanoma death in subset (95% CI) | ||
| B. Model performance for identifying patients at high risk of death from melanoma within 7 yearsf | ||||
| Training data using 2010–2011 cohort (N = 7652) | ||||
| Model 2: logistic model, risk of death ≥20% | 65 (0.8) | 18 | 27.7% (18.3%, 39.6%) | |
| Testing data using 2010–2011 cohort (N = 3942) | ||||
| Model 2: logistic model, risk of death ≥20% | 28 (0.7) | 9 | 32.1% (17.9%, 50.7%) | |
Note: Logistic regression model results are based on recalibrated predicted risks. Training and testing data for the primary analysis include patients diagnosed in 2010–2011.
Abbreviations: AUC, area under the receiver-operating characteristic curve; CAET, classification and regression tree; CI, confidence interval.
Training and testing data for the primary analysis include patients diagnosed in 2010–2011. As a secondary analysis, we applied Models 1A and 1B to the cohort of patients diagnosed from 2004 to 2009. Model 2 is not evaluated in the 2004–2009 cohorts because data on mitotic rate are not available for those cohorts.
For reference, recall that 2.3% of patients in the training data overall died.
For reference, recall that 2.9% of patients in the testing data overall died.
For reference, at 7 years, 2.8% of the 2004–2009 cohort had died.
For reference, at 10 years, 3.9% of the 2004–2008 cohort had died.
Results are shown only for the logistic model (Model 2) because only this model gives a continuous risk estimate for every patient.
Model 1A classifies 35% of patients as low risk of death, with estimated risk of death 0.58% (95% confidence interval [CI], 0.29%–1.14%). Model 1B identifies a smaller subset (25%) with a better prognosis, 0.40% (95% CI, 0.16%–1.03%) risk of death. Model 2 performs similarly to Model 1B regarding the proportion of the sample identified as low risk and number of actual deaths (Table 3A).
Model 1B and Model 2 each identified small subsets of patients with 0 deaths in the training data and 0 deaths when evaluated in the testing data. Model 1B identifies patients 43 years or younger with Clark level II (Figure 1). There were 638 patients in the training data and 331 patients in the test data who fit these criteria and none died from melanoma within 7 years of diagnosis. For the logistic regression model, Model 2, we examined the cutoff of <0.1% (one in a thousand) risk of death. There were 206 patients in the training data and 115 in the testing data with estimated risk <0.1% and none died (Table S4).
Table 3B evaluates Model 2 for its ability to identify patients at high risk of death using the criterion risk ≥20%. Less than 1% of patients fell into this category, but 32.1% of them died within 7 years, a much higher risk than the baseline risk of 2.5% for this patient population. Figure 2 shows survival curves for three groups defined by the logistic model: very-low risk (<0.5%), intermediate risk, and high risk (≥20%). Model 2 demonstrated good calibration in the testing data, especially in the range of risk <10%, where most of the individual risks lie (Figures S2A,B).
FIGURE 2.
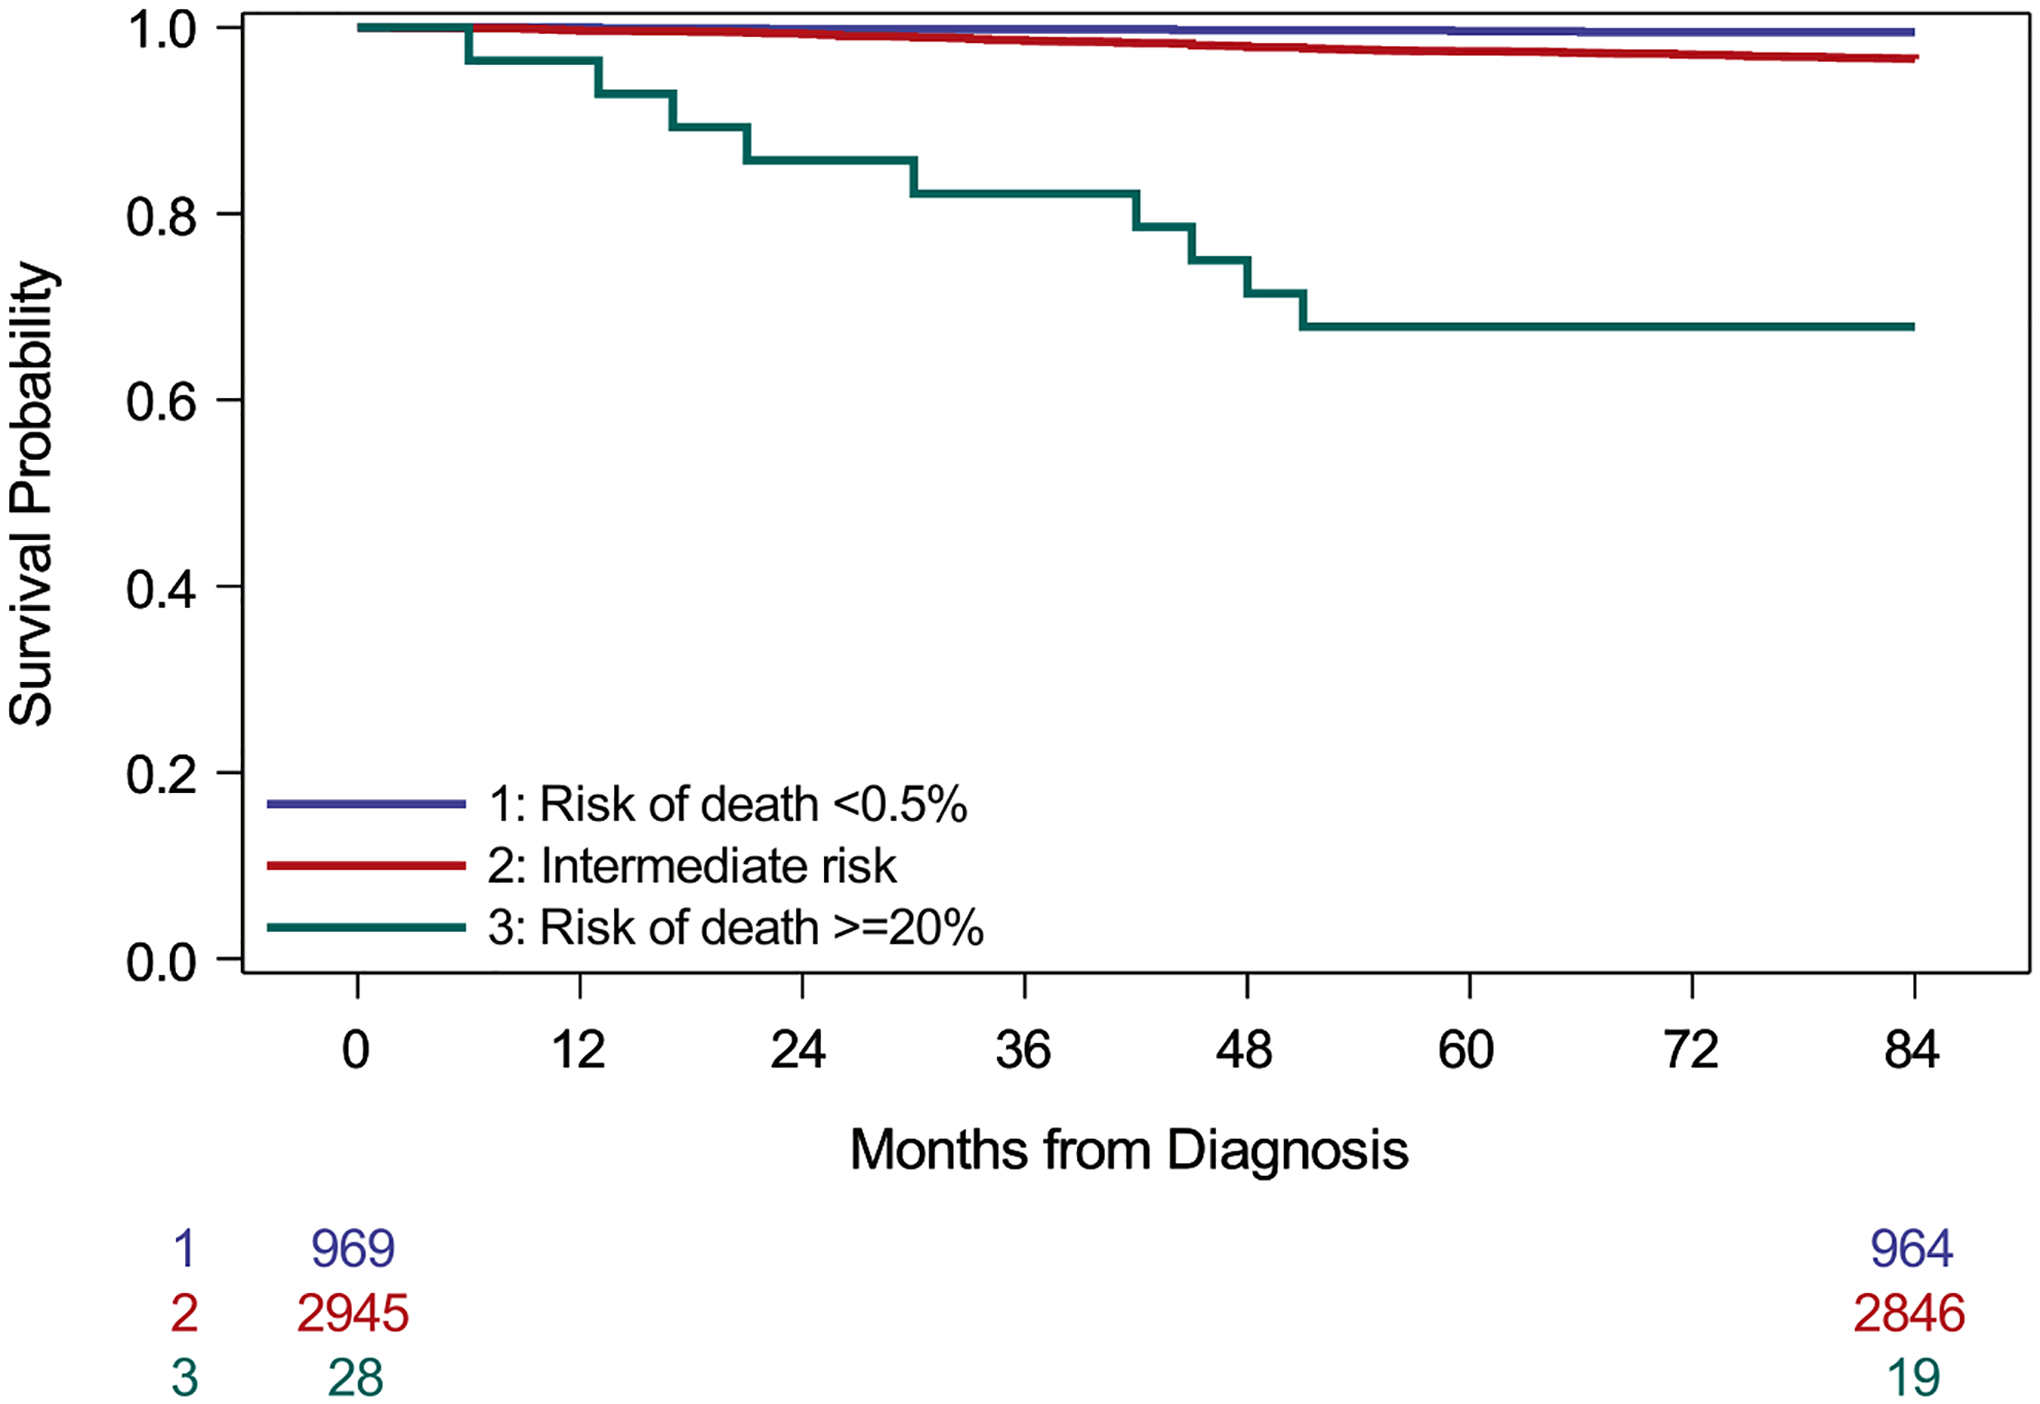
Survival among patients in the testing data by estimated risk of death according to Model 2 (logistic regression analysis). Risk categories are based on recalibrated predicted risks. Very-low risk patients have predicted risk of death <0.5% and high-risk patients have predicted risks ≥20% (log-rank test, p < .001)
Application to Patients Diagnosed 2004–2009
There were 47,171 eligible melanoma cases diagnosed from 2004 to 2009 with 7 years of follow-up and 35,526 cases diagnosed from 2004 to 2008 with 10 years of follow-up. Because mitotic rate was not routinely collected before 2010, only CART Models 1A and 1B could be applied to these cases (Table 3A).
After 7 years, 1301 (2.8%) of the total 2004–2009 cohort had died of melanoma. Using Model 1B, 31% of cases were predicted to survive, and the actual risk of death in this subset was 0.53% (95% CI, 0.43%, 0.67%). After 10 years, 1386 (3.9%) of the total 2004–2008 cohort had died. Using the same model, 32% of the cohort was predicted to survive, and the actual risk of death was 0.84% (95% CI, 0.69%, 1.03%).
DISCUSSION
Using CART and logistic regression, we identified three large subsets of patients with AJCC 7th edition stage I (“thin”) melanoma with risk of death of approximately <1% according to model validation in reserved testing data, a marked improvement over the rate in the sample overall. In the simplest model (Model 1A), patients younger than 70 years at diagnosis with Clark level II invasion were classified as very-low risk. Model 1B used the same initial classifications, but further refined the very-low risk subset identified by Model 1A by limiting to patients who were either age 43 years or younger or 44 to 69 years with Breslow thickness <0.40 mm. After 10 years, the subset identified by Model 1B showed <1% risk of death from melanoma. Notably, mitogenicity did not enter these models. The logistic regression model (Model 2) similarly identified about a quarter of the sample with predicted risk of death <0.5%, incorporating patient age, sex, mitogenicity, Clark level, and ulceration. Model 2 was further able to identify a small subset of patients with no deaths.
The favorable survival estimates we report are comparable to ultra-thin melanomas with Breslow thickness ≤0.5 mm studied previously.16 The current study builds on that single-center study by using a US population-based sample and considering factors beyond Breslow thickness. Other studies have identified subgroups of thin melanoma patients having <1% 10-year risk of death.17,18 We sought to characterize a subset with even higher survival by incorporating the mitogenicity variable added for AJCC 7th edition. However, mitogenicity did not enter our final models with the exception of the logistic regression model.
Although comprised of very few patients, the logistic regression model identified a very small subset with risk of death exceeding 20%, markedly higher than most T1b patients (Figure S4). It is notable that a small number of patients classified as stage I may be at sufficiently high risk to potentially consider more aggressive treatment.
Age and Clark level were identified as essential factors in all models. Clark level of invasion is based on patterns of involvement of the dermis, with Clark level I representing absence of invasion (“in situ melanoma,” not included in the present study). In Clark level II, tumor is present in the papillary dermis but does not fill or expand it. In level III, tumor fills and expands the papillary dermis, thus corresponding in essentially all cases to the definition of VGP as a pattern of expansile tumorigenic growth; however, in a few patients, tumorigenic proliferation (VGP) can be present in a Clark level II tumor. Both mitogenicity and ulceration were significant factors in the logistic regression model, consistent with previous studies.3,4 Notably, Breslow thickness was not significantly associated with survival at 7 years in the initial multivariable models and therefore is not included in the final model. One hypothesis for the absent prognostic effect from this otherwise generally very important parameter is that the information contributed by thin Breslow thickness is conveyed by Clark level II; another explanation could be that the survival difference by Breslow thickness becomes apparent only at longer follow-up times.19 In addition, study selection was limited to lesions with Breslow thickness ≤1.0 mm as the major criterion to define T1 melanoma.
This study has several strengths and limitations. The 7-year survival end point is a limitation of the available follow-up for cases diagnosed using AJCC 7th edition staging criteria, required for capture of mitogenicity. We could only evaluate 10-year risk for models without mitogenicity. We excluded patients who died of causes other than melanoma within 7 years, which may introduce bias. However, results from a Fine-Gray competing risk analysis were similar (Tables S5A,B). Other limitations are the availability and reliability of clinical and pathologic parameters recorded in SEER.20
The variable “tumor extension” in the SEER database was used as a proxy for Clark level. Although most cases had Clark level recorded in this variable, a small percentage of cases classified as “Other” contained only a description such as “Stated as T1a with no other information on extension” (Table S1). Although limited in histopathology variables, the strength of SEER is that it is population-based, and our findings use routinely evaluated characteristics. Validation of these findings in an external data set is a high priority, but beyond the scope of this study. However, findings were developed in a training set and validated in a reserved test set.
Absence of VGP in SEER data is a limitation of SEER studies. In some other databases, the lack of tumorigenicity and/or mitogenicity (that define VGP) is strongly associated with survival.7–9 Absence of VGP was associated with 100% observed survival in a data set of 161 patients prospectively followed for at least 10 years7 and was found in one study to be the only statistically significant prognostic factor for thin level II cutaneous superficial spreading melanoma (SSM).10
VGP has been controversial because there is an element of subjectivity in its assessment.21 However, studies have found its reproducibility to be substantial and comparable to other routinely used markers (κ = 0.56 for VGP and κ = 0.71 for Breslow thickness overall; κ = 0.68 for VGP and κ = 0.68 for Breslow thickness among experienced observers).10,22 VGP has been confirmed as a biologically significant variable in many studies, including a recent meta-analysis of genomic studies.23 Its contribution to prognosis is limited to thin melanomas, because in thicker melanomas, VGP is nearly universally present.24 There are also very rare exceptions to the rule that melanomas lacking VGP do not metastasize.25 A Euro pean Organisation for Research and Treatment of Cancer (EORTC) group recommended an expanded definition with potentially better performance; however, this has not been validated.25 Nevertheless, we and others26 consider that its addition to SEER and AJCC could improve prognostication for the substantial “very-low risk” subset of melanoma cases. A parsimonious recommendation would be to incorporate VGP for T1 melanomas only, because VGP is present in virtually all thicker melanomas.
Besides physical effects of unwarranted treatment, overdiagnosis can falsely import psychological burden of disease.27–29 We aimed to identify a subset of thin melanomas with very-low risk of death. This hypothesis-generating analysis may inform further studies to identify cases that could account for a portion of over-diagnosed melanomas. The criteria for classification of both the very-low risk and high-risk cases will require further validation, ideally prospective studies, and consensus development. Some changes in treatment may need to be considered. For example, at present, sentinel node staging for prognosis is the gold standard for AJCC T1b lesions. The need for this procedure should be addressed for any such lesions that may qualify as T1b and/or high risk. Once identified and validated, we propose that a class of cases with very-low risk of death could be classified as “Melanocytic neoplasms of low malignant potential (MNLMP)”, a term analogous to those used in other low risk lesions formerly called “cancers.”30,31 This revised terminology might appropriately temper some patient apprehension that otherwise follows a diagnosis of “melanoma.”
We show in CART Model 1B that patient age, Clark level, and Breslow thickness could effectively identify patients at very-low risk of death. Application of the logistic model would require the additional variables of sex, mitogenicity, and ulceration but could provide an even more specific prognosis for those in the near-zero risk or high-risk categories. This retrospective study indicates the need for prospective studies to better characterize MNLMP cases. Such studies could evaluate factors outside those in SEER, including histopathology features such as VGP, and tools beyond histopathology, such as molecular and gene tests, and analyze survival, given the recent changes in the treatment of melanoma. This study suggests there is a real subset of patients with very-low risk of melanoma death; we hope this serves as a baseline to further develop the classification criteria to establish use of the MNLMP term in clinical practice.
Supplementary Material
ACKNOWLEDGMENTS
This study was supported by National Cancer Institute (R01 CA201376). The National Cancer Institute had no role in the study design; in the collection, analysis, and interpretation of data; in the writing of the report; or in the decision to submit the article for publication.
Funding information
National Cancer Institute, Grant/Award Number: R01 CA201376
Footnotes
AUTHOR CONTRIBUTIONS
Megan M. Eguchi: Data curation, formal analysis, investigation, methodology, software, validation, visualization, writing–original draft, and writing–review and editing. David E. Elder: Conceptualization, investigation, methodology, supervision, writing–original draft, and writing–review and editing. Raymond L. Barnhill: Writing–review and editing. Michael W. Piepkorn: Writing–review and editing. Stevan R. Knezevich: Writing–review and editing. Joann G. Elmore: Conceptualization, funding acquisition, project administration, resources, supervision, and writing–review and editing. Kathleen F. Kerr: Conceptualization, formal analysis, investigation, methodology, supervision, validation, visualization, writing–original draft, and writing–review and editing.
CONFLICT OF INTEREST
Joann G. Elmore serves as Editor-in-Chief of Primary Care (Adult) topics at UpToDate.
SUPPORTING INFORMATION
Additional supporting information can be found online in the Supporting Information section at the end of this article.
REFERENCES
- 1.Gershenwald JE, Scolyer RA, Hess KR, et al. Melanoma staging: evidence-based changes in the American Joint Committee on Cancer eighth edition cancer staging manual. CA A Cancer J Clin. 2017;67(6):472–492. doi: 10.3322/caac.21409 [DOI] [PMC free article] [PubMed] [Google Scholar]
- 2.Breslow A. Thickness, cross-sectional areas and depth of invasion in the prognosis of cutaneous melanoma. Ann Surg. 1970;172(5): 902–908. doi: 10.1097/00000658-197011000-00017 [DOI] [PMC free article] [PubMed] [Google Scholar]
- 3.Balch CM, Wilkerson JA, Murad TM, Soong SJ, Ingalls AL, Maddox WA. The prognostic significance of ulceration of cutaneous melanoma. Cancer. 1980;45(12):3012–3017. doi: [DOI] [PubMed] [Google Scholar]
- 4.Clark WH, Elder DE, Guerry D, et al. Model predicting survival in stage I melanoma based on tumor progression. J Natl Cancer Inst. 1989;81(24):1893–1904. doi: 10.1093/jnci/81.24.1893 [DOI] [PubMed] [Google Scholar]
- 5.Clark WH, From L, Bernardino EA, Mihm MC. The histogenesis and biologic behavior of primary human malignant melanomas of the skin. Cancer Res. 1969;29(3):705–727. [PubMed] [Google Scholar]
- 6.Bartlett EK, Gimotty PA, Sinnamon AJ, et al. Clark level risk stratifies patients with mitogenic thin melanomas for sentinel lymph node biopsy. Ann Surg Oncol. 2014;21(2):643–649. doi: 10.1245/s10434-013-3313-y [DOI] [PMC free article] [PubMed] [Google Scholar]
- 7.Guerry D, Synnestvedt M, Elder DE, Schultz D. Lessons from tumor progression: the invasive radial growth phase of melanoma is common, incapable of metastasis, and indolent. J Invest Dermatol. 1993; 100(3):342S–345S. doi: 10.1111/1523-1747.ep12470248 [DOI] [PubMed] [Google Scholar]
- 8.Elder DE, Guerry D, Epstein MN, et al. Invasive malignant melanomas lacking competence for metastasis. Am J Dermatopathol. 1984;6(Suppl l):55–61. [PubMed] [Google Scholar]
- 9.Clark WH, Ainsworth AM, Bernardino EA, Yang CH, Mihm CM, Reed RJ. The developmental biology of primary human malignant melanomas. Semin Oncol. 1975;2(2):83–103. [PubMed] [Google Scholar]
- 10.Lefevre M, Vergier B, Balme B, et al. Relevance of vertical growth pattern in thin level II cutaneous superficial spreading melanomas. Am J Surg Pathol. 2003;27(6):717–724. doi: 10.1097/00000478-200306000-00002 [DOI] [PubMed] [Google Scholar]
- 11.Welch HG, Black WC. Overdiagnosis in cancer. J Natl Cancer Inst. 2010;102(9):605–613. doi: 10.1093/jnci/djq099 [DOI] [PubMed] [Google Scholar]
- 12.Data from: Surveillance, Epidemiology, and End Results (SEER) Program. SEER*Stat Database: Incidence - SEER Research Data, 18 Registries, Nov 2020 Sub (2000–2018) - Linked To County Attributes - Time Dependent (1990–2018) Income/Rurality, 1969–2019 Counties, National Cancer Institute, DCCPS, Surveillance Research Program, released April 2021, based on the November 2020 submission. 2021. Accessed August 13, 2021. https://seer.cancer.gov/data-software/documentation/seerstat/nov2020/
- 13.SEER*Stat Databases: November 2020 Submission. Accessed August 13, 2021. https://seer.cancer.gov/data-software/documentation/seerstat/nov2020/
- 14.Balch CM, Gershenwald JE, Soong SJ, et al. Final version of 2009 AJCC melanoma staging and classification. J Clin Oncol. 2009;27(36): 6199–6206. doi: 10.1200/JCO.2009.23.4799 [DOI] [PMC free article] [PubMed] [Google Scholar]
- 15.Harrell FE. Regression modeling strategies: With applications to linear models, logistic regression, and survival analysis. 1st ed. Springer; 2001:94. [Google Scholar]
- 16.Vecchiato A, Zonta E, Campana L, et al. Long-term survival of patients with invasive ultra-thin cutaneous melanoma: a single-center retrospective analysis. Medicine (Baltimore). 2016;95(2):e2452. doi: 10.1097/MD.0000000000002452 [DOI] [PMC free article] [PubMed] [Google Scholar]
- 17.Gimotty PA, Elder DE, Fraker DL, et al. Identification of high-risk patients among those diagnosed with thin cutaneous melanomas. J Clin Oncol. 2007;25(9):1129–1134. doi: 10.1200/JCO.2006.08.1463 [DOI] [PubMed] [Google Scholar]
- 18.Mancini S, Crocetti E, Bucchi L, et al. Melanoma survival with Classification and Regression Trees Analysis: a complement for the communication of prognosis to patients. Ital J Dermatol Venerol. 2021;156(4):460–466. doi: 10.23736/S2784-8671.19.06402-2 [DOI] [PubMed] [Google Scholar]
- 19.Lo SN, Scolyer RA, Thompson JF. Long-term survival of patients with thin (T1) cutaneous melanomas: a Breslow thickness cut point of 0.8 mm separates higher-risk and lower-risk tumors. Ann Surg Oncol. 2018;25(4):894–902. doi: 10.1245/s10434-017-6325-1 [DOI] [PubMed] [Google Scholar]
- 20.Gimotty PA, Shore R, Lozon NL, et al. Miscoding of melanoma thickness in SEER: research and clinical implications. J Invest Dermatol. 2016;136(11):2168–2172. doi: 10.1016/j.jid.2016.05.121 [DOI] [PMC free article] [PubMed] [Google Scholar]
- 21.Bezuhly M, Appleton SE, Fadel Z, Williams JS. Reply: vertical growth phase as a prognostic factor for sentinel lymph node positivity in thin melanomas: a systematic review and meta-analysis. Plast Reconstr Surg. 2019;143(2):445e–446e. doi: 10.1097/PRS.0000000000005243 [DOI] [PubMed] [Google Scholar]
- 22.McDermott NC, Hayes DP, al-Sader MH, et al. Identification of vertical growth phase in malignant melanoma. A study of interob-server agreement. Am J Clin Pathol. 1998;110(6):753–757. doi: 10.1093/ajcp/110.6.753 [DOI] [PubMed] [Google Scholar]
- 23.Borden ES, Adams AC, Buetow KH, et al. Shared gene expression and immune pathway changes associated with progression from nevi to melanoma. Cancers (Basel). 2021(1):14. doi: 10.3390/cancers14010003 [DOI] [PMC free article] [PubMed] [Google Scholar]
- 24.Wat H, Salopek TG. Revisiting vertical growth phase and regression for thin melanoma. J Am Acad Dermatol. 2017;76(1):e27. doi: 10.1016/j.jaad.2016.09.018 [DOI] [PubMed] [Google Scholar]
- 25.Cook MG, Spatz A, Bröcker EB, Ruiter DJ. Identification of histo-logical features associated with metastatic potential in thin (<1.0 mm) cutaneous melanoma with metastases. A study on behalf of the EORTC Melanoma Group. J Pathol. 2002;197(2):188–193. doi: 10.1002/path.1093 [DOI] [PubMed] [Google Scholar]
- 26.Appleton SE, Fadel Z, Williams JS, Bezuhly M. Vertical growth phase as a prognostic factor for sentinel lymph node positivity in thin melanomas: a systematic review and meta-analysis. Plast Reconstr Surg. 2018;141(6):1529–1540. doi: 10.1097/PRS.0000000000004395 [DOI] [PubMed] [Google Scholar]
- 27.Kalf RRJ, Delnoij DMJ, Ryll B, Bouvy ML, Goettsch WG. Information patients with melanoma spontaneously report about health-related quality of life on web-based forums: case study. J Med Internet Res. 2021;23(12):e27497. doi: 10.2196/27497 [DOI] [PMC free article] [PubMed] [Google Scholar]
- 28.Kasparian NA, McLoone JK, Butow PN. Psychological responses and coping strategies among patients with malignant melanoma: a systematic review of the literature. Arch Dermatol. 2009;145(12): 1415–1427. doi: 10.1001/archdermatol.2009.308 [DOI] [PubMed] [Google Scholar]
- 29.Tesio V, Ribero S, Castelli L, et al. Psychological characteristics of early-stage melanoma patients: a cross-sectional study on 204 patients. Melanoma Res. 2017;27(3):277–280. doi: 10.1097/CMR.0000000000000348 [DOI] [PubMed] [Google Scholar]
- 30.Amin MB, Comperat E, Epstein JI, et al. The genitourinary pathology society update on classification and grading of flat and papillary urothelial neoplasia with new reporting recommendations and approach to lesions with mixed and early patterns of neoplasia. Adv Anat Pathol. 2021;28(4):179–195. doi: 10.1097/PAP.0000000000000308 [DOI] [PubMed] [Google Scholar]
- 31.Nikiforov YE, Seethala RR, Tallini G, et al. Nomenclature revision for encapsulated follicular variant of papillary thyroid carcinoma: a paradigm shift to reduce overtreatment of indolent tumors. JAMA Oncol. 2016;2(8):1023–1029. doi: 10.1001/jamaoncol.2016.0386 [DOI] [PMC free article] [PubMed] [Google Scholar]
Associated Data
This section collects any data citations, data availability statements, or supplementary materials included in this article.