

SUMMARY
Genome-wide association studies (GWAS) of serum metabolites have the potential to uncover genes that influence human metabolism. Here, we combined an integrative genetic analysis associating serum metabolites to membrane transporters with a coessentiality map of metabolic genes. This analysis revealed a connection between feline leukemia virus subgroup C cellular receptor 1 (FLVCR1) and phosphocholine, a downstream metabolite of choline metabolism. Loss of FLVCR1 in human cells strongly impairs choline metabolism due inhibition of choline import. Consistently, CRISPR-based genetic screens identified phospholipid synthesis and salvage machinery as synthetic lethal with FLVCR1 loss. Cells and mice lacking FLVCR1 exhibit structural defects in mitochondria and upregulate integrated stress response (ISR) through heme-regulated inhibitor (HRI) kinase. Finally, Flvcr1 knockout mice are embryonic lethal, which is partially rescued by choline supplementation. Altogether, our findings propose FLVCR1 as a major choline transporter in mammals and provide a platform to discover substrates for unknown metabolite transporters.
In brief
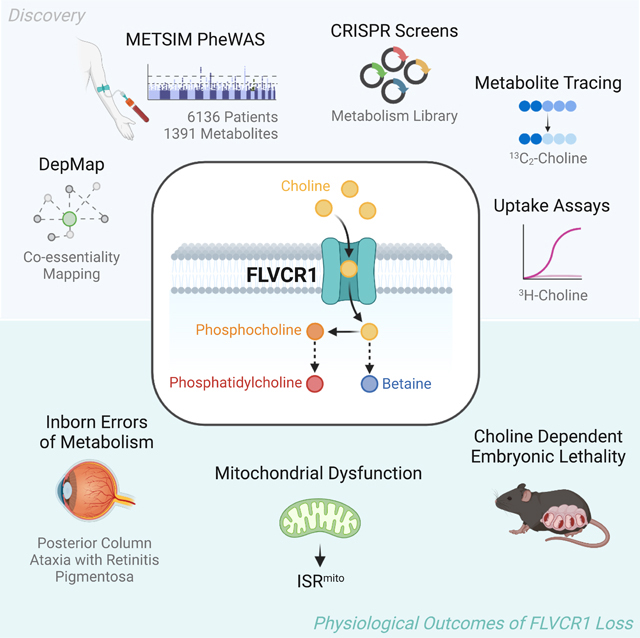
Kenny et al. query serum metabolite GWAS data to identify an association between choline metabolism and FLVCR1. Metabolite tracing, radioactive uptake experiments, and CRISPR screens demonstrate that FLVCR1 is the major plasma membrane choline transporter. Highlighting the importance of choline metabolism, FLVCR1 loss severely compromises cellular and organismal physiology.
Graphical Abstract
INTRODUCTION
Cells in multicellular organisms need a constant supply of nutrients and minerals to survive and function. Nutrient homeostasis is in part mediated by membrane carrier proteins, which facilitate the translocation of small molecule metabolites across cellular membranes. These membrane carriers comprise a functionally diverse group of proteins that differ in substrate specificity, tissue expression, subcellular localization, and topology. Consistent with the critical function of metabolites in development and growth, defects in metabolite transport have been associated with a subset of congenital disorders and diseases1. Furthermore, even non-pathogenic variants in transporter genes may underlie individual variability in physiologic outcomes and drug metabolism. There is increasing evidence that these carriers could also be targeted for therapy. For example, inhibitors of sodium-glucose co-transporters in the kidney are approved drugs for adults with diabetes1. Similarly, serotonin reuptake inhibitors are commonly used for the treatment of depression2. Despite their clear roles in physiology and disease, many of these small molecule carriers are poorly studied due to their hydrophobicity. While emerging genetic, structural, and metabolomic technologies have enabled characterization of a subset of transporters, approximately 30% of them still do not have known substrates or physiological functions3.
Here, to link biochemical pathways to uncharacterized membrane transporter genes, we used a genome-wide association study (GWAS) of plasma metabolites from a cohort of Finnish individuals, combined with coessentiality mapping of metabolic genes. This analysis identified a ubiquitously expressed plasma membrane transporter, feline leukemia virus subgroup C cellular receptor 1 (FLVCR1), as a genetic determinant of phosphocholine and phosphatidylcholine levels in human plasma. Biochemical characterization of cells lacking FLVCR1 revealed striking defects in choline metabolism. Mechanistically, we demonstrate that FLVCR1 transports choline into mammalian cells. Furthermore, a series of CRISPR-Cas9-based genetic screens identify the lysosomal phospholipid salvage pathway and choline uptake as synthetic-lethal with FLVCR1 loss. In cells lacking FLVCR1, choline deprivation results in mitochondrial dysfunction and activation of the integrated stress response (ISR). We similarly find defects in choline metabolism and mitochondrial structure as defining features of embryonic lethal Flvcr1 null mice. Consistent with the role of FLVCR1 in choline metabolism, choline supplementation in utero significantly extended developmental lifespan. Altogether, our work identifying FLVCR1 as a major high-affinity choline transporter in mammals highlights the utility of uncovering novel metabolic substrates of transporters through integrative genetic analysis.
RESULTS
An integrative genetic analysis associates serum metabolites to membrane transporters in humans
One approach to link metabolic pathways to poorly studied small molecule transporters is to leverage serum metabolomics GWAS data and determine transporters that can impact levels of particular serum metabolites, which reflects the net production by all tissues. We therefore applied a minimum-p-value gene-based approach to the METSIM GWAS dataset of 6136 men from late-settlement Finland for which 1391 plasma metabolites were measured4 (Fig. 1a). Together with the prioritization of a list of 2892 metabolic genes including enzymes and small molecule transporters, the gene-based approach had a much smaller multiple-testing burden in comparison with GWAS (with its >26 million tests and conventional significance threshold of p < 5×10⁻⁸). We then ranked the obtained entries by gene and metabolite and selected the top associations. Thus, this analysis identified potential causal genes for serum levels of individual metabolites (Fig. 1a, S1a). Of note, associations involving xenobiotics and uncharacterized compounds were excluded from further analysis (Fig. S1b). Consistent with the critical role of plasma membrane transporters (PMTs) in nutrient homeostasis, we further restricted our analysis to 306 PMTs, of which 207 were found to have significant metabolite associations (Fig. 1b).
Figure 1. An integrative genetic analysis associates serum metabolites to membrane transporters in humans.

a) Schematic showing the pipeline for the METSIM analysis. b) Summary of the METSIM analysis of 2892 metabolic genes queried for metabolite associations. Pie chart representing the number of plasma membrane transporters (PMT) for which a metabolite association was found c) Bubble plot of top-scoring metabolite-PMT associations previously reported. d) Bubble plot of undescribed metabolite-PMT associations for which the PMT had only a single significant metabolite association. Bubble color corresponds to the -log(p-val) of the association between the indicated metabolite and PMT. Bubble size represents the rank of the gene (ordered by -log(p-val) across all the analyzed metabolic genes with 1 corresponding the strongest association for the corresponding metabolite. e) Schematic showing the workflow of the integrated METSIM and DEPMAP analysis. f) Bubble plot of the integrated analysis of DepMAP and METSIM datasets. Data shown are the co-essential gene pairs with the absolute value of Pearson Correlation Coefficient (|PC|) > 0.2 computed from DepMAP CRISPR Chronos Scores that share a significant metabolite based on METSIM analysis. Bubble size represents |PC|. Bubble color corresponds to the rank of PTM for the corresponding metabolite. g) Pearson Correlation between CHKA and metabolic genes computed from CRISPR DepMAP Chronos. h) METSIM metabolite-FLVCR1 associations displayed as log(p-val) of the top-scoring marker for the given metabolite within the defined FLVCR1 genomic region vs. metabolites in alphabetical order. The dotted line indicates the significance threshold of -log(p-val) = 5. i) Associations between metabolic genes and phosphocholine or phosphatidylcholine (18:0/20:2, 20:0/18:2). Data are plotted as metabolic gene rank for the given metabolite vs. -log(p-val) of the top-scoring marker of the metabolite within the defined gene region.
To confirm the robustness of our approach, we first queried our dataset for previously reported metabolite-PMT associations, which yielded 17 metabolite-PMT pairs (Fig 1c). Among these were cholesterol and low-density lipoprotein receptor (LDLR), which is an established determinant of serum cholesterol levels5. Similarly, we identified progressive ankylosis protein (ANKH), a citrate transporter and solute carrier family 7 member 5 (SLC7A5), a kynurenine importer to affect serum levels of citrate6, and kynurenine7, respectively. Our approach also revealed 132 putative associations for which a given metabolite significantly scored for one or more PMTs (Fig. 1d, Fig. S1c, Data S1). We next integrated our results with the coessentiality dataset from DepMap, which is a collection of genomewide loss of function screens across hundreds of genomically characterized cell lines8. This enabled us to identify co-essential metabolic gene pairs, both of which associate with the same serum metabolite in the METSIM GWAS dataset (Fig. 1e,f). Furthermore, integrating two independent databases allowed us to narrow down the list of the potential hits and reduce the false positive rate. The metabolic gene pair with the strongest coessentiality was FLVCR1 and choline kinase alpha (CHKA) (Pearson correlation = 0.4) (Fig. 1g). FLVCR1 is a plasma membrane transporter previously characterized as a heme exporter9 and has been implicated in the rare autosomal-recessive disorder posterior column ataxia and retinitis pigmentosa (PCARP)10–13. CHKA catalyzes the production of phosphocholine through phosphorylation of choline. Importantly, in the METSIM dataset, FLVCR1 and CHKA are associated with phosphocholine and its downstream metabolite phosphatidylcholine (Fig. 1h,i). Given the strong link between FLVCR1 and choline metabolism, we focused our attention on FLVCR1.
FLVCR1 loss impairs choline metabolism in human cells
To begin to biochemically characterize the function of FLVCR1, we generated pairs of FLVCR1 knockout cell lines and those complemented with FLVCR1 cDNA, and profiled metabolites by liquid chromatography-mass spectrometry (LC-MS) (Fig. 2a, S2a,b). Among all detected metabolites, we found the largest reductions in the levels of choline and its downstream metabolites phosphocholine and betaine in FLVCR1-knockout cells (Fig. 2a, S2b, Data S1) and confirmed this was specific to FLVCR1 loss (Fig. S2c). Once imported into the cell, choline has multiple metabolic fates. The biosynthesis of phosphatidylcholine through the Kennedy pathway14 begins with the phosphorylation of choline by CHKA followed by a series of enzymatic reactions to generate the phosphatidylcholine, the predominant phospholipid species of cellular membranes. Additionally, choline is a key constituent of acetylcholine, a neurotransmitter, and betaine, a key metabolite in one-carbon metabolism. To directly determine whether production of downstream metabolites change in response to FLVCR1 loss, we performed metabolite isotope tracing experiments using choline ([1,2-13C2]Choline) in FLVCR1-knockout cells and those expressing FLVCR1 cDNA (Fig. 2b), Remarkably, incorporation of isotope-labelled choline into downstream metabolites phosphocholine, betaine, and glycerophosphocholine was severely blunted in FLVCR1-knockout cells (Fig. 2c–e, S2d–f). Of note, previous work15 described a shorter isoform of FLVCR1 which localizes to the mitochondria, but only the full length plasma-membrane localized isoform could rescue the phosphocholine levels of FLVCR1-knockout cells (Fig. S2g,h) and no differences were seen in choline uptake or incorporation to betaine in isolated mitochondria from FLVCR1-knockout and cDNA complemented cells (Fig. S2i). Consistent with the impairment of choline metabolism, loss of FLVCR1 also led to a depletion of phosphatidylcholine (PC) species but, surprisingly, a strong accumulation of triglycerides in a lipidomic analysis (Fig. 2f, S2j). This is in line with the observation that a decrease in PC synthesis results in larger lipid droplets16–18. Indeed, FLVCR1-knockout cells accumulate significantly more lipid droplets compared to controls (Fig. 2g, S2k).
Figure 2. FLVCR1 loss impairs choline metabolism in human cells.

a) Volcano plot showing the log2 fold change in metabolite abundance versus -log10(q value) from FLVCR1-knockout HEK293T and HeLa cells expressing a vector control or FLVCR1 cDNA cultured in choline depleted media for 24 hours. The dotted line indicates the significance threshold of FDR q<1% (-log10(q value) = 2). Statistical significance was determined by multiple two-tailed unpaired t-tests with discovery determined using the Two-stage linear step-up procedure of Benjamini, Krieger and Yekutieli. b) Molecular structure of choline and schematic for tracing of [1,2-13C2]Choline into downstream metabolites. Metabolite abundance of c) phosphocholine, d) betaine and e) glycerophosphocholine after incubation with [1,2-13C2]Choline for the indicated timepoints in FLVCR1-knockout HEK293T cells expressing a control vector or FLVCR1 cDNA. Bars represent mean ± standard deviation; n = 3. Statistical significance determined by two-tailed unpaired t-test and displayed p-values compare M+2 metabolite abundance between FLVCR1 KO and FLVCR1 KO +FLVCR1 cDNA at corresponding timepoints. f) Lipidomics analysis of FLVCR1-knockout HEK293T cells expressing a control vector or FLVCR1 cDNA cultured in choline depleted media for 24 hours. Dot plot of individual lipid species of FLVCR1-knockout cells relative to FLVCR1 KO +FLVCR1 cDNA cells and grouped by lipid class – phosphatidylcholine (PC), phosphatidylethanolamine (PE), phosphatidylserine (PS), and triglyceride (TG). Dotted line represents lipid species abundance of FLVCR1 KO +FLVCR1 cDNA cells. Median log2 fold change of FLVCR1 KO cells denoted by black line for each lipid class; n = 3. g) LipidTOX staining of FLVCR1-knockout HEK293T cells expressing a control vector or FLVCR1 cDNA. Scale bar = 5μm. Violin plot showing quantification of mean fluorescence intensity per cell. Statistical significance was determined by two-tailed unpaired t-test. n = 28 cells FLVCR1 KO; n = 39 cells FLVCR1 KO +FLVCR1 cDNA.
FLVCR1 mediates choline import
We next sought to understand the precise mechanism by which FLVCR1 regulates choline metabolism in mammalian cells. Given the genetic relationship between CHKA and FLVCR1, we first considered whether FLVCR1 impacts CHKA function. While FLVCR1 loss reduced all choline downstream metabolites, CHKA-knockout cells display a strong decrease in incorporation of isotope-labelled choline into phosphocholine, but an increase in betaine, likely due to the overflow of intracellular choline into betaine production (Fig. S2l, S2m). Consistently, we found no difference in choline kinase activity between FLVCR1 knockout cell lines and those complemented with FLVCR1 cDNA (Fig. S2n). This raises the possibility that FLVCR1 impacts processes upstream of CHKA. Notably, FLVCR1-knockout cells display no observable differences in the protein abundance of enzymes involved in phospholipid synthesis (Fig. S2o).
Choline is present in human serum at ~10μM19 and in extracellular fluid at ~3–6μM20–22. Given that choline is an essential metabolite, most mammalian cells need to take up choline from the extracellular environment at these concentrations. A high affinity transporter, SLC5A7/CHT1, has previously been identified, which enables choline reuptake only in cholinergic neurons23,24. Additionally, several transporters defined for choline transport in other tissues (SLC44A1/CTL1, SLC44A2/CTL2, SLC22A1/OCT1, SLC22A2/OCT1) have much higher Km values (50–500μM) than physiological choline concentrations25–30. However, a high affinity choline transporter expressed across mammalian cell types has not been identified. Given the ubiquitous expression pattern of FLVCR1 (Fig. S3a) and unchanged expression of previously reported choline transporters in FLVCR1 knockout cells (Fig. S3b–d), we hypothesized that FLVCR1 may mediate choline transport in most mammalian tissues.
Upon entry into the cell, CHKA phosphorylates choline to phosphocholine and traps it in the cell in a manner analogous to glucose phosphorylation by hexokinases31. The net accumulation of radiolabeled choline in cells is accordingly a function of both choline transport and trapping31,32. To test the ability of FLVCR1 to import choline, we therefore utilized radiolabeled choline ([Methyl-3H]Choline) uptake assays (Fig. 3a). Remarkably, loss of FLVCR1 blocked choline uptake in HEK293T and HeLa cells in a dose and time dependent manner (Fig. 3b,c, S3e,f). This phenotype was completely rescued by expression of FLVCR1 cDNA or the neuron specific high affinity choline transporter SLC5A724 cDNA, but not by SLC44A1 cDNA in FLVCR1-knockout cells (Fig. 3d). Similarly, phosphocholine and/or choline supplementation restored phosphocholine levels in FLVCR1-knockout cells (Fig. 3e, S3g). Previously reported choline transporters have been designated by their sensitivity to hemicholinium-3 inhibition and dependence on sodium for transport26. In contrast to SLC5A7, we found choline uptake via FLVCR1 to be independent of sodium and insensitive to hemicholinium-3 (Fig. S3h–l).
Figure 3. FLVCR1 mediates choline import in mammalian cells.

a) Schematic for radioactive choline uptake assays using 3H-choline. b) Uptake of [Methyl-3H]-Choline in FLVCR1-knockout HEK293T cells expressing a vector control or FLVCR1 cDNA incubated for indicated timepoint. Data represented as mean ± standard deviation and normalized by seeded cell number; n = 3. Statistical significance was determined by multiple two-sided unpaired t-tests with correction for multiple comparisons using the Holm-Sidak method. t=1 minute p=1.3×10⁻³; t =2 minutes p=2.3×10⁻⁵, t=5 minutes, 15 minutes, and 30 minutes p<1×10⁻⁶. c) Uptake of [Methyl-3H]-Choline in FLVCR1-knockout HEK293T cells expressing a vector control or FLVCR1 cDNA incubated with indicated dose for 30 minutes. Data represented as mean ± standard deviation and normalized by seeded cell number; n = 3. Statistical significance was determined by multiple two-sided unpaired t-tests with correction for multiple comparisons using the Holm-Sidak method. 1.34μM p=6×10⁻⁶; 2.69μM, 5.38μM, 10.75μM, and 21.5μM p<1×10⁻⁶. d) Uptake of 21.5μM [Methyl-3H]-Choline in FLVCR1-knockout HEK293T cells expressing an empty vector (EV) control, SLC44A1, FLVCR1, or SLC5A7 cDNA for 30 minutes. Data represented as mean ± standard deviation and normalized by seeded cell number; n = 3. Statistical significance determined by two-tailed unpaired t-test. e) Phosphocholine abundance in FLVCR1-knockout HeLa cells expressing a vector control or FLVCR1 cDNA after incubation with 1mM phosphocholine or 1mM choline for 24 hours. Bars represent mean ± standard deviation; n = 3. Statistical significance determined by two-tailed unpaired t-test.
We next asked whether FLVCR1 is required for mammalian cells to proliferate under choline limitation. To address this, we cultured FLVCR1-null HEK293T and HeLa cells expressing a vector control or FLVCR1 cDNA in choline depleted or replete media over multiple passages and found a subtle, albeit significant, impairment in proliferation of FLVCR1-knockout cells in choline depleted media conditions (Fig. S4a,b). Given that trace choline amounts may still be detectable in dialyzed FBS (dFBS), we further performed the proliferation assays under 1% dFBS and saw a marked decrease in the growth of FLVCR1-knockout cells which can be restored by choline repletion (Fig. 4a, S3b). These results suggest that FLVCR1 mediates choline import, and that FLVCR1-mediated choline uptake is essential for the growth of mammalian cells.
Figure 4. Metabolic pathways that compensate for FLVCR1 loss.

a) Log2 fold change in cell number of FLVCR1-knockout HeLa cells expressing a vector control or FLVCR1 cDNA grown in choline depleted or choline replete media supplemented with 1% dialyzed FBS (dFBS). Bars represent mean ± standard deviation; n = 6. Statistical significance determined by two-tailed unpaired t-test. b) Schematic of the metabolism-focused CRISPR genetic screens in FLVCR1-knockout HEK293T cells expressing a vector control or FLVCR1 cDNA cultured with or without 1mM choline supplementation. c) CRISPR gene scores in FLVCR1-knockout HEK293T cells expressing a vector control (y-axis) or FLVCR1 cDNA (x-axis). Top scoring hits color coded and previously reported potential choline transporters highlighted in gray. Pearson correlation coefficient, two-sided. d) CRISPR gene scores in FLVCR1-knockout HEK293T cells expressing a vector control and supplemented with 1mM choline (y-axis) or FLVCR1 cDNA (x-axis). Pearson correlation coefficient, two-sided. e) Comparison of gene score ranks from CRISPR screens. FLVCR1-knockout HEK293T cells expressing a vector control vs. FLVCR1 cDNA (x-axis) and FLVCR1-knockout HEK293T cells expressing a vector control grown with or without 1mM choline supplementation (y-axis). f) Individual sgRNA scores targeting FLVCR2, PCYT1A, CHKA, or PCTY2 in FLVCR1-knockout HEK293T cells expressing a vector control (color) or FLVCR1 cDNA (black). G) Phylogenetic tree of FLVCR1 homologs across model organisms (derived from TreeFam). h) Phosphocholine abundance in FLVCR1-knockout HEK293T cells expressing an empty vector control, SLC44A1, FLVCR2, FLVCR1, or SLC5A7 cDNA. Bars represent mean ± standard deviation; n = 3. Statistical significance determined by two-tailed unpaired t-test. i) Phosphocholine abundance in FLVCR1-knockout HEK293T cells expressing an empty vector control, FLVCR1, or CG1358 cDNA. Bars represent mean ± standard deviation; n = 3. Statistical significance determined by two-tailed unpaired t-test. j) Schematic of phospholipid synthesis reactions and salvage pathway. Scoring genes from CRISPR screens which are essential in FLVCR1-knockout cells and rescued with choline supplementation are highlighted with color.
Metabolic genes essential for cell proliferation upon FLVCR1 loss
FLVCR1 loss did not impact cell proliferation under standard media conditions, raising the possibility that other metabolic enzymes or transporters may compensate for its loss. To identify genes essential for cellular proliferation in the absence of FLVCR1, we performed CRISPR-Cas9-based genetic screens using a metabolism-focused single guide RNA (sgRNA) library33 in the presence and absence of supraphysiological choline (Fig. 4b). Top scoring genes from these screens were those involved in the biosynthesis of phospholipids (CHKA, PCYT2, PCYT1A, CDIPT), whose essentiality are completely abrogated upon choline supplementation (Fig. 4c–f, S4c–e). Additionally, a recently discovered lysosomal lysophospholipid transporter34–36, SPNS1, scored as differentially essential in FLVCR1-knockout cells and was choline dependent. SPNS1 mediates the transport of lysophosphotidylcholine, a lysosomal breakdown product of extracellular lipids, into the cytosol thereby providing a source for choline upon extracellular choline limitation. Consistently, lysophosphatidylcholine lipid species accumulate in the lysosome upon SPNS1 knockout which can be detected by whole-cell lipidomics (Fig. S4f). This strongly suggests that the lysosomal phospholipid salvage pathway enables cell survival when choline is depleted from proliferating cells. Other scoring genes include HMGSC1 – an enzyme which produces the cholesterol precursor mevalonate and ABCE1 – a cotranslational quality control factor associated with mitochondrial outer membrane-localized mRNA37 (Fig. 4c–f, S4c–e).
Of note, none of the previously reported choline transporters (SLC44A1, SLC44A2, SLC22A1, and SLC22A2) scored in FLVCR1-knockout cells (Fig. 4c, S4c). These results are consistent with the essential role of FLVCR1 in phosphatidylcholine metabolism. Additionally, FLVCR2, a paralog of FLVCR1 with high sequence homology38 (Fig. 4g), scored as essential in FLVCR1-knockout cells in a choline dependent manner (Fig. 4c–f, S4c–e). Like its paralog, FLVCR2 is ubiquitously expressed across human tissues (Fig. S4g). These data suggest that FLVCR2 takes up choline in a compensatory fashion upon FLVCR1 loss. To address this, we performed metabolomic assays on FLVCR1-knockout cells complemented with FLVCR2, FLVCR1, SLC5A7 and SLC44A1 cDNAs. These experiments showed that expression of FLVCR2, but not SLC44A1, restored the decrease in phosphocholine levels upon FLVCR1 loss (Fig. 4g). In line with these results, expression of FLVCR2 in FLVCR1-knockout cells partially restored radiolabeled choline uptake (Fig. S4h). The choline transport function of FLVCR1/2 is likely conserved as the Drosophila homolog, CG1358, could also rescue choline uptake and phosphocholine levels of FLVCR1-knockout cells (Fig. 4i,j, S4i).
FLVCR1-mediated choline transport is required for mitochondrial homeostasis
We next sought to determine the physiological consequences of cellular choline depletion upon FLVCR1 loss in mammalian cells. To address this in an unbiased manner, we performed RNA-Seq analysis on FLVCR1-knockout and control HeLa cells after acute exposure to choline depleted or replete media. Remarkably, only FLVCR1-knockout cells displayed a distinct transcriptional response to choline depletion, highlighting a synergy between FLVCR1 loss and choline limitation (Fig. 5a,b). Gene set enrichment analysis for upregulated transcripts revealed a strong enrichment for the integrated stress response (ISR) including amino acid deprivation, unfolded protein response, endoplasmic reticulum stress, and ATF4-activated gene expression (Fig. 5c). Given that choline phosphorylation is required for phosphatidylcholine synthesis30,31, we next asked whether a decrease in phosphocholine levels may phenocopy ISR activation by FLVCR1 loss (Fig. S5a,b). To test this, we targeted CHKA genetically by CRISPR or pharmacologically using a small molecule inhibitor. Similar to FLVCR1 loss, inhibition of CHKA resulted in ISR activation as measured by ATF4 and CHOP immunoblotting (Fig. S5c,d). Of note, this effect was blunted by supplementation of phosphocholine (Fig. S5d). The ISR is mediated by eIF2α phosphorylation by four distinct kinases (HRI, PERK, PKR, PERK) which are activated by diverse perturbations39. To identify the kinase responsible for ISR activation under choline limitation, we generated mixed population knockout cells of all four eIF2α kinases. Among these, loss of HRI, but not others, impaired induction of the ISR upon CHKA inhibition (Fig. 5d). HRI has recently been shown to be activated by mitochondrial stress via DELE144–47, a protein that translocates from the mitochondria to the cytosol where it binds and activates HRI40,41. Interestingly, DELE1 loss also blunted ISR activation (Fig. 5e, S5e,f), indicating that impairment of choline utilization activates the ISR through the mitochondrial stress response pathway.
Figure 5. FLVCR1-mediated choline uptake is required for mitochondrial homeostasis.

a) Principal component analysis (PCA) of RNA-Seq from FLVCR1-knockout HeLa cells expressing a vector control or FLVCR1 cDNA cultured in choline depleted or choline replete media for 24 hours. b) Heat map of differentially expressed genes from RNA-Seq of FLVCR1-knockout HeLa cells expressing a vector control or FLVCR1 cDNA cultured in choline depleted or choline replete media for 24 hours. c) Gene set enrichment analysis (GSEA) of significantly upregulated transcripts in FLVCR1-knockout HeLa cells expressing an empty vector control in choline depleted media vs. FLVCR1-knockout HeLa cells + FLVCR1 cDNA in choline depleted media. d) Immunoblotting of indicated proteins in HEK293T cells expressing an empty vector control (pLV2 EV) or sgRNA targeting GCN2, HRI, PKR, or PERK and treated with CHKA inhibitor RSM932A (1μM) or vehicle for 24 hours. e) Immunoblotting of indicated proteins in HEK293T cells expressing an empty vector control (pLV2 EV) or two different sgRNA targeting DELE1 and treated with CHKA inhibitor RSM932A (1μM) or vehicle for 24 hours. f) Schematic for proteomic and polar metabolomic/lipidomic profiling of mitochondria from FLVCR1-knockout HeLa cells expressing an empty vector control or FLVCR1 cDNA and after extended culture in choline depleted and replete conditions. g) Principal component analysis (PCA) of mitochondrial lipidomics from FLVCR1-knockout HeLa cells expressing a vector control or FLVCR1 cDNA. Heatmap of mitochondrial lipid species. h) Heatmap of most differentially expressed mitochondrial proteins organized by ontology from FLVCR1-knockout HeLa cells expressing a vector control or FLVCR1 cDNA cultured in choline depleted or choline replete media. Statistical significance was determined by an ANOVA test with a permutation-based FDR q<1% considered significant. i) Flow cytometry of mitochondrial membrane potential (ΔΨm) as measured by TMRM in FLVCR1-knockout HeLa cells expressing an empty vector control or FLVCR1 cDNA and after extended culture in choline depleted and replete conditions. j) Representative electron micrographs of the mitochondria of FLVCR1-knockout HeLa cells expressing an empty vector control or FLVCR1 cDNA after extended culture in choline depleted conditions (Left). Scale bar = 0.5μm. Violin plots of mitochondrial surface area, outer mitochondrial membrane (OMM) perimeter, cristae density, cristae width, and cristae junction width calculated from electron micrographs. Statistical significance was determined by two-tailed unpaired t-test. n = 107 mitochondria, n = 444 cristae, n = 255 cristae junctions FLVCR1 KO cells; n = 68 mitochondria, n = 303 cristae, n = 183 cristae junctions FLVCR1 KO +FLVCR1 cDNA cells.
To further explore how choline depletion influences mitochondria, we immunopurified mitochondria from FLVCR1-knockout HeLa cells expressing a vector control or FLVCR1 cDNA using a previously described mitochondrial purification method42 and performed quantitative metabolomics, lipidomics, and proteomics on these cells after exposure to choline depleted or replete conditions (Fig. 5f, S5g,h). Phosphatidylcholine is the most abundant phospholipid of the mitochondrial membranes. Despite this, mitochondria lack the machinery to synthesize it, and rely on the transport of PC from other cellular membranes. Consistent with this dependency, we observed a decrease in mitochondrial PC levels from FLVCR1-knockout cells compared to other phospholipids (Fig. 5g). Building upon our RNA-Seq results and previous work43,44, we next hypothesized that PC depletion may have a substantial impact on mitochondrial homeostasis. Indeed, quantitative mitochondrial proteomics identified significant changes in the mitochondrial proteome of FLVCR1-knockout cells specifically under choline deprivation (Fig. 5h, S5li). Many fundamental mitochondrial processes and components were significantly downregulated in FLVCR1-knockout cells under choline deprivation including electron transport chain complexes, iron-sulfur cluster biogenesis, the mitochondrial ribosome, and protein homeostasis (Fig. 5h). These results suggest extensive mitochondrial dysfunction in cells lacking FLVCR1 and deprived of choline. Consistently, when we compared our proteomic dataset to a list of mitochondrial proteins downregulated across diverse insults to mitochondrial homeostasis45, we found a significant overlap with proteins depletedStatistical significance determined by two in FLVCR1-knockout cells (Fig. S5j). Functionally, FLVCR1 loss coupled with choline deprivation caused drastic depolarization of the mitochondrial membrane and changes in mitochondrial ultrastructure including mitochondrial swelling and cristae disorganization (Fig. 5i,j, S5k). The extent to which these mitochondrial phenotypes underlie FLVCR1-dependent growth under choline limitation remains to be seen as expression of Ciona intestinalis alternative oxidase (AOX)46, which rescues complex III/IV defects, was not sufficient to restore proliferation of FLVCR1-knockout cells under choline deprivation (Fig. S5l). Altogether, our data implicate a functional link between choline deprivation and ISR activation through the mitochondria mediated by DELE1 and HRI.
Murine embryonic development is dependent on choline transport by Flvcr1
We next asked whether FLVCR1 loss impacts choline metabolism at the organismal level. On the C57BL/6 background, Flvcr1KO mice are embryonic lethal with death occurring around E12.5 while Flvcr1HET and Flvcr1WT mice are fully viable9. Consistent with this phenotype, Flvcr1 is ubiquitously expressed across tissues during mouse development (Fig. S6a). We therefore performed whole-embryo metabolomics on E11.5 embryos from timed matings of Flvcr1HET mice (Fig. 6a,b, S6b,c). Strikingly, we found significant drops in choline (3-fold), betaine (13-fold), and phosphocholine (43-fold) levels of Flvcr1KO embryos when compared to Flvcr1HET/WT controls (Fig. 6c). This is in contrast to a subset of amino acids, whose levels are unchanged or mildly different (maximum change of 50%) between Flvcr1KO and Flvcr1HET/WT embryos (Fig. 6c). Consistent with the metabolic phenotypes of mitochondrial dysfunction47–49, we observed a reduction (18-fold) in aspartate and an increase (3-fold) in lactate/pyruvate ratio in Flvcr1KO embryos (Fig. 6c). Mirroring our in vitro results, we also observe ISR activation and a decreased abundance of several mitochondrial proteins in Flvcr1KO embryos (Fig. 6d). When we assessed mitochondrial ultrastructure of the brain of E11.5 embryos, we found that Flvcr1KO mitochondria were enlarged with cristae density and organization severely perturbed (Fig. 6e). Building upon these findings, we next asked whether choline supplementation in utero could rescue the embryonic lethality of Flvcr1KO embryos. Acute and chronic supplementation of high levels of choline is toxic to mice50,51, precluding us from providing sufficient choline to completely rescue embryonic lethality of Flvcr1KO embryos. Therefore, we determined a maximum tolerated intraperitoneal dose of choline bitartrate and administered it to pregnant mice while on a choline supplemented diet (Fig. 6f,g). Consistent with a partial restoration of the impairment in choline metabolism, phosphocholine levels in choline supplemented Flvcr1KO embryos were still ~3 fold lower than those of choline sufficient or choline supplemented Flvcr1HET/WT embryos (Fig. S6d). Remarkably, even this tolerable dose partially restored the metabolic defects of E11.5 Flvcr1KO and significantly improved viability of Flvcr1KO in later embryonic stages (Fig. 6g, S6e ). With choline supplementation, we were able to observe live E15.5 and dead E17.5 Flvcr1KO embryos (Fig. 6g, S6e). Taken together, our data demonstrate that Flvcr1 mediated choline transport is necessary for murine embryonic development.
Figure 6. Flvcr1 mediated choline transport is essential for murine development.

a) Schematic of Flvcr1 mice used for whole embryo metabolomics. b) Representative images of embryos of indicated genotypes at E11.5. Scale bar = 1mm. c) Metabolite levels or ratio normalized by endogenous leucine between Flvcr1KO (n = 4) and Flvcr1HET (n = 6) plus Flvcr1WT (n = 2) E11.5 embryos. Bars represent mean ± standard deviation. Statistical significance determined by two-tailed unpaired t-test. d) Immunoblotting of indicated proteins in Flvcr1WT, Flvcr1HET, and Flvcr1KO whole E11.5 embryos. e) Violin plots of mitochondrial surface area, outer mitochondrial membrane (OMM) perimeter, cristae density, cristae width, and cristae junction width calculated from electron micrographs. Statistical significance was determined by two-tailed unpaired t-test. Flvcr1WT (n = 2) and Flvcr1HET (n = 1) embryos: n = 143 mitochondria, n = 662 cristae, n = 287 cristae junctions. Flvcr1KO (n = 2) embryos: n = 134 mitochondria, n = 535 cristae, n = 378 cristae junctions. Representative electron micrographs of the mitochondria of the brain of E11.5 embryos of indicated genotypes (Right). Scale bar = 0.5μm. f) Schematic of supplementation experiments performed on Flvcr1HET females at 0.5 days post coitus (dpc) with Flvcr1HET males and analysis of embryos E11.5-E19.5/P0. g) Representative images of embryos of indicated genotypes treated with choline sufficient or choline supplemented diets and injections at E15.5. Scale bar = 2.5mm. Pie charts displaying the genotypes of embryos collected E11.5–17.5 from choline sufficient or choline supplemented groups. Choline sufficient n = 53 embryos; Choline supplemented n = 48embryos. Chi-square test.
DISCUSSION
Choline is an essential small molecule with diverse roles in neurotransmitter synthesis, membrane homeostasis and one-carbon metabolism. Indeed, dietary choline deprivation has been associated with liver dysfunction, neurological disorders, and muscle damage52. Given that choline is a charged molecule, cells need to transport it from the serum and extracellular fluid via dedicated membrane carriers. In this study, we propose FLVCR1 and its paralog FLVCR2 as the major transporters of choline in mammals. This function seems to be conserved as the Drosophila homolog of FLVCR1/2 could also transport choline. Our data in human cells suggest that the vast majority of intracellular phosphocholine is generated from the phosphorylation of imported choline. FLVCR1-mediated choline uptake is essential for life as its complete loss leads to embryonic lethality, suggesting that the salvage pathway, while sufficient in culture, cannot completely compensate for mouse development in vivo.
Our results that describe FLVCR1/2 as potential choline transporters have clinical implications. Patients with missense mutations in FLVCR1 present with posterior column ataxia and retinitis pigmentosa (PCARP), an autosomal recessive neurodegenerative syndrome characterized by loss of retinal function and subsequent degeneration of the posterior columns of the spinal cord from proprioception loss10–13. Interestingly, the photoreceptor cells of the retina have high affinity for choline and require an abundance of phospholipids to maintain the large membranous surface area of the outer segment53–55. Choline availability has also been linked to retinal degeneration56–58. Further confirming our results, the connection between FLVCR1 and choline was recently described as a metabolite quantitative trait loci association in humans by two independent groups59,60. Mutations in FLVCR2 have also been reported in patients with Fowler syndrome, an autosomal recessive condition that is characterized by vasculopathy in the central nervous system and severe hydrocephaly61–63. Mice with complete or endothelial cell specific loss of FLVCR2 recapitulate the phenotypes of Fowler Syndrome64,65. Collectively, our findings reported in this study suggest that patients with mutations in FLVCR1 and FLVCR2 may benefit from dietary choline supplementation, a well-tolerated intervention66.
Finally, our results show that FLVCR1 depletion leads to changes in the mitochondrial proteome and structure, linking choline availability to mitochondrial homeostasis. Consistent with these results, FLVCR2 has also been reported to influence mitochondrial metabolism67. While the precise mechanism for the mitochondrial phenotypes we observe with FLVCR1 loss is unclear, phosphatidylcholine depletion may impact the stability of the TIM23 complex, the presequence translocase necessary for transport of mitochondrially targeted proteins into or across the mitochondrial inner membrane68. Further work is needed to decipher these connections and establish whether mitochondrial dysfunction occurs as a consequence of mitochondrial lipid remodeling under choline deprivation. Such future endeavors should also identify the molecular players involved in regulating FLVCR1 function, the structural mechanism of choline transport and the impact of choline in specific organs.
Limitations of Study
Metabolite tracing and radioactive uptake experiments strongly suggest a role for FLVCR1 in cellular choline transport. However, structural studies and liposome-based in vitro reconstituted uptake assays should be performed to definitively demonstrate transport function. In particular, identification of residues of FLVCR1 that interact with choline will uncouple the direct transport of choline from other FLVCR1 functions. Given that there are several proposed choline transporters, a comparative study is required to delineate their physiological roles and affinities for choline. Additionally, while we characterize choline as a substrate of FLVCR1, we leave open the possibility that it can have other physiological substrates. Indeed, previous work identified FLVCR1 as a heme export protein9,69–74 but we find no evidence that heme or iron influence choline uptake or incorporation (Fig. S7a–g). Additionally, we failed to identify a transcriptional or genetic signature associated with heme accumulation in our experimental system. Such function may be specific to certain cell types such as those of the erythroid lineage, which have higher heme content than the cells used in this manuscript. Finally, Flvcr1KO mice in this study are on the C57BL/6J background, which have a well-characterized mutation in nicotinamide nucleotide transhydrogenase (NNT)75 and may further complicate mitochondrial phenotypes. Given that the spectrum of phenotypes seen in Flvcr1KO embryos is highly dependent on the genetic background of the mice9, future work on the organismal function of Flvcr1 should be mindful of this consideration.
RESOURCE AVAILABILITY
Lead contact
Further information and requests for resources and reagents should be directed to and will be fulfilled by the lead contact, Kivanç Birsoy (kbirsoy@rockefeller.edu)
Materials availability
All unique reagents generated in this study are available from the lead contact upon request.
Data and code availability
Uncropped western blots and all data used to generate display items in this manuscript are available in Data S1. Proteomics data have been deposited at Proteomics Identifications Database (PRIDE) and are publicly available as of the date of publication. Accession numbers are listed in the key resources table. RNAseq data have been deposited at Gene Expression Omnibus (GEO) and are publicly available as of the date of publication. Accession numbers are listed in the key resources table.
All original code is available in this paper’s supplemental information.
Any additional information required to reanalyze the data reported in this paper is available from the lead contact upon request.
KEY RESOURCES TABLE
| REAGENT or RESOURCE | SOURCE | IDENTIFIER |
|---|---|---|
| Antibodies | ||
| ATF4 | Cell Signaling Technology | Cat#11815S; RRID: AB_2616025 |
| CHOP | Cell Signaling Technology | Cat##2895S; RRID: AB_2089254 |
| GAPDH | GeneTex | Cat# GTX627408; RRID: AB_11174761 |
| Calreticulin | Cell Signaling Technology | Cat#12238P; RRID: AB_2688013 |
| LAMP1 | Cell Signaling Technology | Cat#9091P; RRID: AB_2687579 |
| COXIV | Cell Signaling Technology | Cat#4850S; RRID: AB_2085424 |
| Beta Tubulin | GeneTex | Cat# GTX101279; RRID: AB_1952434 |
| Beta Actin | GeneTex | Cat#GTX109639; RRID: AB_1949572 |
| Vinculin | Cell Signaling Technology | Cat#4650S; RRID: AB_10559207 |
| CHKA | Cell Signaling Technology | Cat#13422S; RRID: AB_2798216 |
| CDIPT | GeneTex | Cat#GTX80599; RRID: AB_11166614 |
| PCYT1A | Sigma-Aldrich | Cat#HPA035428; RRID: AB_10602045 |
| HMOX1 | Proteintech | Cat#10701–1-AP; RRID: AB_2118685 |
| FTH1 | Cell Signaling Technology | Cat#4393S; RRID: AB_11217441 |
| FLVCR1 | Santa Cruz Biotechnology |
Cat#sc-390100 |
| NDUFS1 | Proteintech | Cat#12444–1-AP; RRID: AB_2282657 |
| OPA1 | BD Biosciences | Cat#612606; RRID: AB_399888 |
| MRPS35 | Proteintech | Cat#16457–1-AP; RRID: AB_2146521 |
| SLC44A1 | ABclonal | Cat#A15413; RRID: AB_2762321 |
| CHT1/SLC5A7 | Santa Cruz Biotechnology |
Cat#33713; RRID: AB_2189835 |
| Citrate Synthase | Cell Signaling Technology | Cat#14309; RRID: AB_2665545 |
| FLAG | Sigma-Aldrich | Cat#F1804; RRID: AB_262044 |
| Anti-Mouse IgG-HRP | Cell Signaling Technology | Cat#7076; RRID: AB_330924 |
| Anti-Rabbit IgG-HRP | Cell Signaling Technology | Cat#7074; RRID: AB_2099233 |
| AlexaFluor 568 Anti-Mouse | Invitrogen | Cat#A10037; RRID: AB_2534013 |
| AlexaFluor 488 Anti-Rabbit | Invitrogen | Cat#A21206; AB_2535792 |
| Bacterial and virus strains | ||
| NEB Stable Competent E. coli | New England Biolabs | Cat#C3040 |
| Biological samples | ||
| Chemicals, peptides, and recombinant proteins | ||
| RPMI 1640 Culture Media | Gibco | Cat#11875–093 |
| Fetal Bovine Serum | Sigma-Aldrich | Cat#12306C |
| Penicillin Streptomycin | Gibco | Cat#15140–122 |
| Trypsin | Gibco | Cat#25200 |
| RPMI 1640 Culture Medium w/o L-Glutamine, L-Methionine, Choline Chloride, Folic Acid and Vitamin B12 |
US Biological Life Sciences | Cat#R8999–21 |
| L-glutamine | Alfa Aesar | Cat#J60573 |
| L-methionine | Alfa Aesar | Cat#J61904 |
| Choline Chloride | MP Biomedicals | Cat#101386 |
| Folic Acid | Alfa Aesar | Cat#J62937 |
| Vitamin B12 | Alfa Aesar | Cat#A14894 |
| Dialyzed Fetal Bovine Serum | Gibco | Cat#26400–044 |
| Phosphocholine chloride calcium salt tetrahydrate | Sigma-Aldrich | Cat#P0378 |
| RSM932A | Cayman Chemical | Cat#215518 |
| Tunicamycin | Tocris | Cat#3516 |
| Oligomycin | Millipore | Cat#495455 |
| Hemin | Sigma-Aldrich | Cat#H9039 |
| FCCP | BioVision | Cat#2398 |
| Succinylacetone | Cayman Chemical | Cat#24401 |
| Hemicholinium-3 | Sigma-Aldrich | Cat#H108 |
| Zinc (II) Mesophoryrin IX (ZnMP) | Frontier Scientific | Cat#M40628 |
| Ammonium Iron (III) Citrate (FAC) | Sigma-Aldrich | Cat#F5879 |
| BsmBI-v2 | New England Biolabs | Cat#R0739L |
| BamHI-HF | New England Biolabs | Cat#R3136L |
| NotI-HF | New England Biolabs | Cat#3189L |
| Gibson Assembly Master Mix | New England Biolabs | Cat#E2611L |
| T4 Ligase | New England Biolabs | Cat#M0202 |
| X-tremeGENE 9 DNA Transfection Reagent | Roche | Cat#6364787001 |
| Polybrene | Sigma-Aldrich | Cat#H9268 |
| Puromycin | Sigma-Aldrich | Cat#P8833 |
| Blasticidin | Invivogen | Cat#ant-bl-1 |
| Protease Inhibitor | EMD Millipore | Cat#535140 |
| Protease Inhibitor | Sigma-Aldrich | Cat#11836170001 |
| Phosphatase Inhibitor | Roche | Cat#490685001 |
| Poly-D-Lysine | ChemCruz | Cat#sc-136156 |
| LipidTOX Deep Red | Invitrogen | Cat#H34477 |
| Prolong Gold Antifade Mountant | Invitrogen | Cat#P10144 |
| ECL Chemiluminescence | Perkin Elmer | Cat#NEL105001EA |
| ECL Chemiluminescence | Cytiva | Cat#RPN2232 |
| Donkey Serum | Jackson ImmunoResearch |
Cat##017–000-12 |
| Tetramethylrhodamine, methyl ester, perchlorate (TMRM) | Invitrogen | Cat#T668 |
| [1,2-13C2]Choline Chloride | Cambridge Isotope Laboratories | Cat#CLM-548.01 |
| Heavy Labeled Amino Acid Internal Standards | Cambridge Isotope Laboratories | Cat#MSK-A2–1.2 |
| HPLC Grade Water | Fisher Scientific | Cat#W6 |
| HPLC Grade Methanol | Fisher Scientific | Cat#A454–1 |
| HPLC Grade Acetonitrile | Fisher Scientific | Cat#A955–1 |
| [Methyl-3H]-Choline Chloride | Perkin Elmer | Cat#NET109001MC |
| Insta-Gel Plus Scintillation Cocktail | Perkin Elmer | Cat#601339 |
| Krebs-Ringer Buffer | Alfa Aesar | Cat#J67795 |
| Pierce Anti-HA Magnetic Beads | Thermo Scientific | Cat#88837 |
| Modified Davidson’s Fixative | Electron Microscopy Sciences | Cat#64133–50 |
| Critical commercial assays | ||
| Pierce BCA Protein Assay Kit | Thermo Fisher Scientific |
Cat#23227 |
| Choline Kinase Assay Kit | Abcam | Cat#ab239729 |
| RNeasy Mini Kit | Qiagen | Cat#74104 |
| TruSeq Stranded mRNA Library Prep | Illumina | Cat#20020595 |
| CellTiter-Glo Luminescent Cell Viability Assay | Promega | Cat#G7571 |
| DNeasy Blood & Tissue Kit | Qiagen | Cat#69506 |
| Deposited data | ||
| RNAseq | GEO | Accession #:GSE228126 |
| MitoIP TMT Proteomics | PRIDE | Accession #:1–20230329-151157 |
| Uncropped western blots and raw values used to generate all graphs | This Paper | Data S1 – Source Data |
| Experimental models: Cell lines | ||
| HeLa | ATCC | CCL-2 |
| HEK293T | ATCC | CRL-1573 |
| Experimental models: Organisms/strains | ||
| Mouse: C57BL/6JSmoc-Flvcr1em1Smoc | Dr. Janis Abkowitz (University of Washington)9 |
N/A |
| Oligonucleotides | ||
| sgRNA, cDNA, and Genotyping Oligonucleotides | This Study | See Table S1 |
| Recombinant DNA | ||
| plentiCRISPR-v2 puro | Addgene | Cat#982990 |
| plentiCRISPR-v1 GFP | Addgene | Cat#75159 |
| pMXS-IRES-Blast | Cell Biolabs | Cat#RTV-016 |
| pMXS-3xHA-OMP25-mCherry | 42 | N/A |
| pMXS-3xMyc-OMP25-mCherry | 42 | |
| pLV-EF1a-RFP | Dr. Navdeep Chandel (Northwestern University)46 |
N/A |
| pLV-EF1a-RFP-AOX | Dr. Navdeep Chandel (Northwestern University)46 |
N/A |
| plentiCRISPR-v1 GFP FLVCR1_sg5 | This Study | N/A |
| plentiCRISPR-v2 Puro FLVCR1_sg5 | This Study | N/A |
| plentiCRISPR-v2 Puro CHKA_sg2 | This Study | N/A |
| plentiCRISPR-v2 Puro KIAA0141/DELE1_sg1 | This Study | N/A |
| plentiCRISPR-v2 Puro KIAA0141/DELE1_sg2 | This Study | N/A |
| plentiCRISPR-v2 Puro EIF2AK3/PERK_sgRNA | This Study | N/A |
| plentiCRISPR-v2 Puro EIF2AK2/PKR_sgRNA | This Study | N/A |
| plentiCRISPR-v2 Puro GCN2_sgRNA | This Study | N/A |
| plentiCRISPR-v2 Puro EIF2AK1/HRI_sgRNA | This Study | N/A |
| plentiCRISPR-v2 Puro SPNS1_sg1 | This Study | N/A |
| plentiCRISPR-v2 Puro SPNS1_sg2 | This Study | N/A |
| pMXS-IRES-Blast FLVCR1/FLVCR1a | This Study | N/A |
| pMXS-IRES-Blast FLVCR1b | This Study | N/A |
| pMXS-IRES-Blast FLVCR2 | This Study | N/A |
| pMXS-IRES-Blast SLC44A1 | This Study | N/A |
| pMXS-IRES-Blast SLC5A7 | This Study | N/A |
| pMXS-IRES-Blast CHKA | This Study | N/A |
| pMXS-IRES-Blast CG1358 | This Study | N/A |
| Human CRISPR Metabolic Gene Knockout Library | Addgene | Cat#110066 |
| Software and algorithms | ||
| FCS Express 7 | DeNovo Software |
https://denovosoftware.com/; RRID: SCR_016431 |
| Skyline Daily v22 | MacCoss Lab |
https://skyline.ms/project/home/software/Skyline/begin.view; RRID: SCR_014080 |
| Prism 8 | GraphPad |
https://www.graphpad.com/scientificsoftware/prism; RRID: SCR_002798 |
| XCaliburQual Browser 2.2 | Thermo Scientific | https://www.thermofisher.com/order/catalog/product/OPTON-30965#/OPTON-30965; RRID: SCR_014593 |
| LipidSearch 4.2 | Thermo Fisher Scientific / Mitsui Knowledge Industries |
https://www.thermofisher.com/order/catalog/product/OPTON-30879?SID=srchsrp-OPTON-30879; |
| Proteome Discoverer v 2.5 | Thermo Fisher Scientific | https://www.thermofisher.com/order/catalog/product/OPTON-31041?SID=srch-hj-OPTON-31041 |
| Other | ||
| Z2 Coulter Counter | Beckman | Model Z2 |
| SpectraMax Microplate Reader | Molecular Devices | Model M3 |
| Primovert Microscope | Carl Zeiss | 415510-1105-000 |
| Multiphoton Microscope with Confocal Modality | Nikon | A1R MP |
| Tecnai G2-12 Transmission Electron Microscope with AMT BioSprint29 Digital Camera | FEI | G2-12 |
| FACSAriaII | BD Biosciences | 643181 |
| Attune NxT Flow Cytometer | Invitrogen | N/A |
| Bead Ruptor 24 | Omni International | N/A |
| Dionex UltiMate 3000 UPLC System | Thermo Fisher Scientific | N/A |
| Tri-Carb 2910 TR Scintillation Counter | Perkin Elmer | N/A |
| PicoLab Rodent Diet | PicoLab | Cat#5053; See Data S1 for composition |
| Choline Supplemented (20g/kg) Iron-Supplemented L-AA defined Rodent Diet | Dyets | Cat#519586; See Data S1 for composition |
| Choline Sufficient (14.48g/kg) Iron-Supplemented L-AA defined Rodent Diet | Dyets | Cat#518754; See Data S1 for composition |
EXPERIMENTAL MODEL AND SUBJECT DETAILS
Cell Lines and Growth Medium
HeLa and HEK293T cells were obtained from the ATCC. Cell line identity was authenticated using STR profiling and cell lines were verified to be free of mycoplasma contamination. Under standard culture conditions, cell lines were grown in RPMI 1640 medium (Gibco #11875–093) containing 2mM glutamine supplemented with 10% fetal bovine serum (FBS) (Sigma-Aldrich #12306C) and 1% penicillin streptomycin (Gibco #15140–122). All cells were maintained at 37°C, 21% O2, and 5% CO2.
Choline depleted and replete medium was made from powdered RPMI 1640 Medium w/o L-Glutamine, L-Methionine, Choline Chloride, Folic Acid and Vitamin B12 (US Biological Life Sciences #R8999–21). Once reconstituted, missing metabolites were added at the concentration found in standard RPMI 1640 medium: 2mM L-glutamine (Alfa Aesar #J60573), 100.7μM L-methionine (Alfa Aesar #J61904), 21.4μM choline chloride (MP Biomedicals #101386), 2.3μM folic acid (Alfa Aesar #J62937), and 3.7nM vitamin B12 (Alfa Aesar #A14894). Choline depleted and replete medium was supplemented with 10% dialyzed fetal bovine serum (dFBS) (Gibco #26400–044) and 1% penicillin streptomycin (Gibco #15140–122), unless otherwise noted.
Mice
All animal studies were performed according to a protocol approved by the Institutional Animal Care and Use Committee (IACUC) at The Rockefeller University. Animals were housed in ventilated caging on a standard light/dark cycle with food (PicoLab Rodent Diet #5053) and water provided ad libitum. Flvcr1HET mice backcrossed to a C57BL/6J background were kindly provided by Janis Abkowitz. As previously described9, to generate these mice, a construct was generated with loxP sites in the introns surrounding exon 3 of Flvcr1 with a PGK neomycin selection cassette and was used to target 129S4/SvJae ES cells. A karyotypically normal flox containing ES clone was used for blastocyst injection and male chimeras bred to female C57BL/6 mice. Heterozygous Flvcr1+/flox mice were bred to CMV-Cre+ mice to generate Flvcr1+/− CMV-Cre+ mice. Flvcr1+/− CMV-Cre+ mice were backcrossed to C57BL/6 mice to bred out Cre and achieve an inbred C57BL/6 strain. We independently confirmed the genetic background of these mice using a commercially available genetic strain genotyping service (Transnetyx MiniMUGA Background Analysis V009). These mice were confirmed inbred with no presence of commonly used constructs. Diagnostic SNP analysis indicated that the substrain of the mice is C57BL/6J. Previous reports suggest that Flvcr1KO mice in a pure C57BL/6 genetic background die at around E12.5. We set up timed matings of Flvcr1HET mice and staged embryos according to standard methods with the day of a copulatory plug identified as 0.5 days post coitus (dpc). E11.5 embryos were isolated with the aid of a dissecting microscope (Zeiss) and imaged using a Zeiss Axio Zoom.V16 steromicroscope with Axiocam 506 mono camera. Whole embryos were used for polar metabolite profiling and western blotting. Using the primers listed in Table S1, mice were genotyped with wild-type and knockout alleles producing PCR products at 374bp and 674bp, respectively.
METHOD DETAILS
Chemicals and Compounds
The following chemicals and compounds were used with doses enumerated in the figures and figure legends: Choline chloride (MP Biomedicals #67–48-1), Phosphocholine chloride calcium salt tetrahydrate (Sigma Aldrich #P0378), RSM932A (Cayman Chemical #215518), Tunicamycin (Tocris #3516), Oligomycin (Millipore #495455), Hemin (Sigma Aldrich #H9039), FCCP (BioVision #2398) Succinylacetone (Cayman Chemical #24401), Hemicholinium-3 (Sigma Aldrich #H108), Zinc(II) mesoporphyrin IX (ZnMP) (Frontier Scientific #M40628), Ammonium Iron (III) Citrate (FAC) (Sigma #F5879). For all treatments an equal amount of respective vehicle was used as the untreated control.
Generation of Knockout and Overexpression Constructs and Cell Lines
sgRNAs (listed in Table S1) were synthesized by IDT and cloned into plentiCRISPR-v2 puro (Addgene #982990) or plentiCRISPR-v1 GFP (Addgene #75159) linearized by BsmBI using a T4 ligase (NEB #M0202). cDNAs (listed in Table S1) were synthesized by IDT or Twist Biosciences and cloned into pMXS-IRES-Blast (Cell Biolabs #RTV-016) linearized with BamHI and NotI using Gibson Assembly (NEB #E2611). All construct sequences were validated by Sanger Sequencing. Previously published plasmids containing Ciona intestinalis alternative oxidase (AOX) were also used46. sgRNA expressing vectors along with lentiviral packaging vectors Delta-VPR and VSV-G were transfected into HEK293T cells using X-tremeGENE 9 DNA Transfection reagent (Roche #6364787001). cDNA expressing vectors along with retroviral packaging vectors Gag-Pol and VSG-G were transfected into HEK293T cells using X-tremeGENE 9 DNA Transfection reagent (Roche #6364787001). Virus-containing supernatant was collected 48 hours after transfected and passed through a 0.45μm filter. Target cells in 6-well tissue culture plates were spin-infected with virus and 4μg/mL polybrene by centrifugation at 2,200rpm for 80 minutes. Cells were selected by puromycin (plentiCRISPR-v2 puro), blasticidin (pMXS-IRES-BLAST), or FACS (plentiCRISPR-v1 GFP, pLV-EF1a-RFP). Transduced cells were subsequently single-cell cloned. For all constructs the matching vector without insert was used as a control.
Immunoblotting
Cells were lysed in either RIPA buffer (10mM Tris-HCl pH 7.5, 150mM NaCl, 1mM EDTA, 1% Triton X-100, 0.1% SDS) or transmembrane buffer (10mM Tris-HCl pH 7.4, 150mM NaCl, 1mM EDTA, 1% Triton X-100, 2% SDS, 0.1% CHAPS) supplemented with protease inhibitors (EMD Millipore #535140 or Sigma-Aldrich #11836170001) and phosphatase inhibitors (Roche #490685001). For western blots with embryos, after polar metabolite extraction, tissue was lysed with transmembrane buffer. For mitochondrial immunoprecipitation experiments, samples were lysed in 1% Triton X-100 Buffer (50mM Tris-HCl pH 7.4, 150mM NaCl, 1mM EDTA, 1% Triton X-100) supplemented with protease inhibitors (Sigma-Aldrich #11836170001). Lysates were sonicated, centrifuged at 14,000 rpm, and supernatant collected. Total protein was quantified using BCA Protein Assay Kit (Thermo Fisher #23227) with provided albumin standard used as a protein standard. Samples were resolved on 12%, 4–12%, or 10–20% Tris-Glycine gels (Invitrogen #XP00125BOX, #XP04125BOX, #XP10205BOX) and analyzed by standard immunoblotting techniques. Briefly, gels were transferred in CAPS buffer (10mM CAPS, 10% ethanol) to PVDF membranes (EMD Millipore #1PVH00010) and incubated with primary antibodies at 4°C overnight (ATF4, CST #11815S; CHOP, CST #2895S; GAPDH, Genetex #GTX627408; Calreticulin, CST #12238P; LAMP1, CST #9091P; COXIV, CST #4850S; Beta Tubulin, Genetex #GTX101279; Beta Actin, Genetex #GTX109639; Vinculin, CST #4650S; CHKA, CST #13422S; CDIPT, Genetex #GTX80599; PCYT1A, Sigma-Aldrich #HPA035428; HMOX1, Proteintech #10701–1-AP; FTH1, Cell Signaling #4393S; FLVCR1, Santa Cruz #sc-390100; NDUFS1 Proteintech #12444–1-AP; OPA1 BD Biosciences #612606; MRPS35 Proteintech #16457–1-AP; SLC44A1 ABClonal #A15413; SLC5A7/CHT1 Santa Cruz #sc-33713). Secondary antibody incubation was performed at room temperature for 1 hour using anti-mouse IgG-HRP (CST #7076) and anti-rabbit IgG-HRP (CST #7074). Washes were performed with 0.1% Tween-20 tris buffered saline and blots developed using ECL chemiluminescence (Perkin Elmer #NEL105001EA or Cytiva #RPN2232) and autoradiography films (Thomas Scientific #1141J52).
LipidTOX Staining, Confocal Microscopy, and Quantification
Sterile coverslips were coated with 50μg/mL Poly-D-Lysine (ChemCruz #sc-136156) for 1 hour at room temperature after which cells were seeded at a density of 50,000 cells per 6 well. The following day, cells were fixed with 4% paraformaldehyde for 20 minutes at room temperature. Cells were then stained with reconstituted LipidTOX Deep Red (Invitrogen #H34477) diluted 1:1000 in PBS for 30 minutes at room temperature. Coverslips were mounted using Prolong Gold Antifade Mountant (Invitrogen #P10144) and sealed with nail polish. Slides were imaged with a Nikon A1R MP multiphoton microscope with confocal modality, using a Nikon Plan Apo γ 60X/1.40 oil immersion objective. Signal intensity was quantified per cell using FIJI with both mean and maximum fluorescence intensity per cell captured.
Immunofluorescence Staining and Confocal Microscopy for Co-localization
Sterile coverslips were coated with 50μg/mL Poly-D-Lysine (ChemCruz #sc-136156) for 1 hour at room temperature after which cells were seeded at a density of 50,000 cells per 6 well. The following day, cells were transfected using X-tremeGENE 9 DNA Transfection reagent (Roche #6364787001) with 500ng of pMXS-IRES-BLAST plasmid containing cDNA for either FLVCR1a or FLVCR1b with a C-terminal 3X-FLAG tag. Media was changed the day after transfection and 24 hours after that cells were processed for immunofluorescence staining. First, cells were stained with Cholera Toxin Subunit B, AlexaFlour 647 conjugate (Invitrogen #C34778) diluted 1:100 in PBS for 10 minutes at room temperature. Cells were then fixed with 4% paraformaldehyde for 20 minutes at room temperature. Cells were then permeabilized with 0.5% TritonX-100 in PBS for 10 minutes at room temperature. After washing, cells were blocked in 10% Donkey Serum (Jackson ImmunoResearch #017–000-121) 2% BSA 0.5% Tween PBS for 2 hours at room temperature. Primary antibodies were diluted (FLAG, Sigma-Aldrich #F1804, 1:400; Citrate Synthase, Cell Signaling #14309, 1:200) in 10% blocking buffer and incubated overnight at 4°C. Following washes with 0.5% Tween PBS, secondary antibodies were diluted (AlexaFluor 568 Anti-Mouse, Invitrogen #A10037, 1:250; AlexaFluor 488 Anti-Rabbit, Invitrogen #A21206, 1:250) in 10% blocking buffer and incubated for 2 hours at room temperature. Nuclei were stained with 0.1μg/mL DAPi and mounted with Prolong Gold Antifade Mountant (Invitrogen #P10144) and sealed with nail polish. Slides were imaged with a Nikon A1R MP multiphoton microscope with confocal modality, using a Nikon Plan Apo γ 60X/1.40 oil immersion objective.
Choline Kinase Activity Assay
Choline kinase activity was determined in the lysates of equal numbered cell pellets using a commercially available kit (Abcam #ab239729). The assay protocol was performed according to manufacturer’s guidelines.
Assessment of Mitochondrial Membrane Potential
FLVCR1-knockout HeLa cells expressing a vector control or FLVCR1 cDNA were serially cultured in choline depleted or replete media conditions for at least one week. Cells were seeded at 50,000 cells per 12-well in choline depleted or replete media. The following day, cells were washed with PBS and media changed to choline depleted or replete media with 1% dFBS. After 24 hours, cells were stained with 100nM tetramethylrhodamine, methyl ester, perchlorate (TMRM) (Invitrogen #T668) diluted in serum free choline depleted or replete media for 30 minutes at 37°C. Following staining, cells were washed twice with PBS and collected by tryspin. Fluorescence was assessed by flow cytometry. Carbonyl cyanide 4-(trifluoromethoxy)phenylhydrazone (FCCP) (BioVision #2398) and oligomycin (Sigma-Aldrich #495455) were used as controls to depolarize or hyperpolarize the mitochondrial membrane, respectively. Cells were pretreated with 10μM FCCP prior to TMRM staining and treated with 10μM FCCP throughout staining. Following TMRM staining, cells were treated with 50μM oligomycin in flow buffer for 5 minutes prior to analysis by flow cytometry.
Zinc Mesophorphyrin Uptake and Washout Assay
Cells were seeded at 250,000 cells per 6-well. The following day, cells were incubated for 30 minutes at 37°C with 5μM zinc mesoporphyrin (ZnMP) diluted in washout buffer (25mM HEPES, pH 7.4, 130 mM NaCl, 10 mM KCl, 1mM CaCl2, 1mM MgSO4) supplemented with 2.5μM BSA76. Following incubation, cells were washed twice with washout buffer and incubated in washout buffer with 5% BSA for 30 or 90 additional minutes at 37°C. Cells were collected by trypsin and fluorescence determined by flow cytometry.
Polar Metabolite Profiling and Isotope Tracing
For in vitro polar metabolomic experiments, 250,000 cells were seeded per 6-well in triplicate per condition. The following day, cells were changed to fresh media, fresh media with vehicle/drug/supplement, or fresh media with 3mg/L [1,2-13C2]Choline chloride (Cambridge Isotope Laboratories #CLM-548.01) (as indicated in figure legends). 24 hours later, cells were washed twice with ice-cold 0.9% NaCl and polar metabolites extracted in ice cold 80% LC/MS grade methanol containing 15N and 13C fully-labeled amino acid standards (Cambridge Isotope Laboratories #MSK-A2–1.2). Extracts were vigorously shaken by vortex for 10 minutes at 4°C and spun at 14,000 rpm at 4°C for 10 minutes to remove insoluble cell debris. Supernatants were dried under nitrogen and stored at −80°C until liquid chromatography-mass spectrometry (LC-MS) was performed.
For polar metabolomic experiments from mice, E11.5 embryos were isolated, washed twice in ice cold 0.9% NaCl, and immediately flash frozen with liquid nitrogen. Polar metabolites were extracted in ice cold 80% LC/MS grade methanol containing 15N and 13C fully-labeled amino acid standards (Cambridge Isotope Laboratories #MSK-A2–1.2). Tissues were homogenized by Bead Ruptor 24 (Omni International) under cooling from liquid nitrogen. Extracts were spun at 14,000 rpm at 4°C for 10 minutes to remove insoluble cell debris. Supernatants were dried under nitrogen and stored at −80°C until liquid chromatography-mass spectrometry (LC-MS) was performed. Insoluble cell debris was used for DNA extraction to identify genotypes of embryos.
LC-MS analysis was conducted on a QExactive benchtop orbitrap mass spectrometer equipped with an Ion Max source and a HESI II Probe coupled to a Dionex Ultimate 3000 UPLC System (Thermo Fisher Scientific). External mass calibration was performed every 3 days using standard calibration mixture.
Dried polar extracts were resuspended in 60 μL of 50% acetonitrile, vortexed for 10 seconds, centrifuged for 15 minutes at (20,000 g, 4°C) and 5 μL of the supernatant was injected onto a ZIC-pHILIC 150 × 2.1mm (5μm particle size) column (EMD Millipore). Chromatographic separation was achieved using the following conditions Mobile phase A consisted of 20 mM ammonium carbonate with 0.1% (v/v) ammonium hydroxide (adjusted to pH 9.3) and mobile phase B was acetonitrile. The column oven and autosampler tray were held at 40°C and 4°C, respectively. The chromatographic gradient was run at a flow rate of 0.150 mL/min as follows: 0–22 min linear gradient from 90% to 40% B; 22–24 min: held at 40% B; 24–24.1 min: returned to 90% B; 24.1–30 min: equilibrated at 90% B.
The mass spectrometer was operated in full-scan, polarity switching mode with the spray voltage set to 3.0 kV, the heated capillary held at 275°C. The sheath gas flow was set to 40 units and the auxiliary gas flow was set to 15 units. The MS1 data acquisition was performed with the following parameters: scan range of 55–825 m/z, 70,000 resolution, 1 × 10⁶ AGC target, 80 ms injection time. A pool of all the biological samples was prepared and analyzed using a Top2 data-dependent acquisition method, with polarity switching. The data-dependent MS/MS scans were acquired at a resolution of 17,500, 1 × 10⁵ AGC target, 50 ms max injection time, 1.6 Da isolation width, stepwise normalized collision energy (NCE) of 20, 30, 40 units, 8 sec dynamic exclusion, and loop count of 2.
Relative metabolite abundances were quantified using Skyline Daily v2277 using a 3 ppm mass tolerance and a 6 sec retention time from known standards. For in vitro experiments, metabolite levels were normalized to protein abundance for each condition as measured by BCA. For in vivo experiments, metabolite levels were normalized to endogenous leucine levels.
Lipid Metabolite Profiling
For in vitro polar metabolomic experiments, 250,000 cells were seeded per 6-well in triplicate per condition. The following day, cells were changed to fresh media (as indicated in figure legends). 24 hours later, cells were washed twice with ice-cold 0.9% NaCl and cells lysed in ice cold 80% LC/MS grade methanol. Non-polar metabolites were extracted by the consecutive addition of LC/MS grade water followed by LC/MS grade chloroform. Extracts were vigorously shaken by vortex for 10 minutes at 4°C and spun at 14,000 rpm at 4°C for 10 minutes. The lower lipid-containing layer was carefully collected, dried under nitrogen, and stored at −80°C until LC-MS.
Dried lipid samples were reconstituted in 60 μL 65:30:5 acetonitrile:isopropanol:water (v/v/v), vortexed for 10 sec, centrifuged for 10 min (20,000 g, 4°C) and 5 μl of the supernatant was injected into the LC-MS in a randomized order, with separate injections for positive and negative ionization modes. Lipids were separated on an Ascentis Express C18 2.1 mm x 150mm x 2.7μm column (Supelco) connected to a Dionex UlitMate 3000 UPLC system and a QExactive benchtop orbitrap mass spectrometer (Thermo Fisher Scientific) equipped with a heated electrospray ionization (HESI) probe. Mobile phase A consisted of 10mM ammonium formate in 60:40 water: acetonitrile (v/v) with 0.1% formic acid, and mobile phase B consisted of 10mM ammonium formate in 90:10 isopropanol:acetonitrile (v/v) with 0.1% formic acid. The column oven and autosampler were held at 55°C and 4°C, respectively. The spray voltage was set to 3.5 kV and the heated capillary was held at 320°C. The sheath and auxiliary gas were set to 60 and 20 units, respectively. These conditions were held constant for both positive and negative ionization mode acquisitions. External mass calibration was performed every 3 days using standard calibration mixture.
Mass spectra were acquired, in both positive and negative ionization modes, using a Top15 data-dependent MS/MS method. The full MS scan was acquired as such; 70,000 resolution, 1 × 10⁶ AGC target, 200 ms max injection time, scan range 200 − 2,000 m/z. The data-dependent MS/MS scans were acquired at a resolution of 17,500, AGC target of 1 × 10⁵, 50 ms max injection time, 1.0 Da isolation width, stepwise normalized collision energy (NCE) of 20, 30, 40 units and 8 sec dynamic exclusion.
High-throughput identification and relative quantification of lipids was performed separately for positive and negative ionization mode data using LipidSearch 4.2 Software (Thermo Fisher Scientific/Mitsui Knowledge Industries) with the following search parameters: HCD target database, 5 ppm precursor tolerance, 8 ppm product tolerance, 1% product ion intensity threshold and an m-score threshold of 2. The alignment parameters were: 0.15–0.2 min mean retention time tolerance, A-C ID quality filter, m-score threshold of 5 and the all-isomer peaks node.
After alignment, raw peak areas for all identified lipids were exported to Microsoft Excel. Rejected lipids were removed (‘Rej’ parameter calculated by LipidSearch) and only a single adduct was retained for each lipid. Under these LC-MS conditions, we accepted the following lipid adducts for various classes; sphingolipids: [M+H]/ [M+HCOO]; cholesterol esters, diacyl- and triacylglycerides: [M+NH4]; phosphatidylcholines: [M+H] /[M+HCOO]; phosphoethanolamines: [M+H]/ [M-H]; acylcarnitines and monoacylglycerides: [M+H]; other phospholipids (PG, PI):[M+NH4]/ [M-H].
Lipids were then filtered out, if at least one biological group didn’t meet the following criteria: PQ (‘Peak Quality’ parameter calculated by LipidSearch) greater than 0.8; CV (standard deviation/mean peak area) below 0.3; R (linear correlation across a three-point dilution series of the representative (pooled) biological sample) greater than 0.8; MS/MS grade of A or B for TG, DG, MG, PE, PG, PI, ChE and HexCer; MS/MS grade of A, B, C for Cer, SM, and PC lipids.
The raw peak areas of the filtered lipids were summed by lipid class for each sample and individual lipid peak areas were normalized to the median lipid signal or protein abundance as measured by BCA for normalization.
Radioactive Choline Uptake Experiments
Cells were seeded at a concentration of 250,000 or 500,000 cells per 6-well plate in triplicate. The following day, media was aspirated and cells were incubated in room temperature Krebs-Ringer Buffer (Alfa Aesar #J67795) for 30 minutes. Cells were then incubated with indicated concentration of choline chloride in room temperature Krebs-Ringer Buffer for timepoints described in figure legends at room temperature. For all concentrations of choline chloride, 0.093% of the total choline was radioactive ([Methyl-3H]-Choline Chloride; Perkin Elmer #NET109001MC)(Choline Chloride; MP Biomedicals #67-48-1). For example, 20nM was radioactive of total 21.49μM choline used in the majority of experiments. Following incubation, cells were washed twice with ice cold Krebs-Ringer Buffer on ice. Cells were then solubilized with 200μL of 1% SDS 0.2N NaOH and transferred to a scintillation vial with 5mL of Insta-Gel Plus scintillation cocktail (Perkin Elmer #601339). Radioactivity was measured with the TopCount scintillation counter (Perkin Elmer). Radioactivity was normalized to the seeded cell number for each experiment.
For some experiments, Krebs-Ringer Buffer without Sodium (125mM KCl, 2mM CaCl2, 1mM MgCl2, 25mM KHCO3, 5.5mM HEPES, and 1mM D-glucose; pH 7.2 with KOH) or Krebs-Ringer Buffer with Sodium (120mM NaCl, 5mM KCl, 2mM CaCl2, 1mM MgCl2, 25mM NaHCO3, 5.5mM HEPES, 1mM D-Glucose; pH 7.2 with NaOH) were used. In these experiments, all incubations and washes used the same Krebs-Ringer Buffer.
For the hemicholinium-3 competition experiments, hemicholinium-3 was serially diluted in Krebs-Ringer Buffer with radioactive choline and cells were treated with both compounds at the same time.
For uptake experiments with heme or iron supplementation, cells were pre-treated with 20μM hemin (NaOH vehicle) or 0.1mg/mL ferric iron citrate (FAC) for 6 hours. Hemin, FAC, and vehicle concentrations were maintained in Krebs buffer throughout the uptake assay protocol as described above.
Rapid Mitochondrial Purification for Metabolite Profiling and Proteomics
Mitochondria were purified from HeLa FLVCR1 KO and FLVCR1 KO +FLVCR1 cDNA cells expressing a 3xHA-OMP25-mCherry (mitochondrial isolation) or 3xMyc-OMP25-mCherry (background control) construct. Cells were cultured in choline depleted or choline replete media for 2 weeks prior to this experiment. Equal cell number was seeded in 15cm plates and media was changed to choline depleted or choline replete media with 1% dFBS 24 hours prior to mitochondrial isolation. Per condition, triplicate confluent 15cm plates were washed twice with ice cold KPBS and scraped in 1mL of ice cold KPBS. Cells were pelleted via centrifugation at 1,000g for 1.5 minutes at 4°C. Cells were resuspended in 1mL of ice cold KPBS and homogenized with 30 passes of a 2mL dounce homogenizer. Homogenate was spun at 1,000g for 1.5 minutes at 4°C to pellet intact cells. 5μL of cleared homogenate was added to 45μL of TritonX Lysis Buffer as a whole cell lysate sample and 20μL of cleared homogenate was added to 120μL of methyl tert-butyl ether (MTBE) for extraction of whole cell lipids. The remaining homogenate was incubated with 200μL of prewashed anti-HA magnetic beads (Thermo Scientific #88837) on a rotator for 5 minutes at 4°C. Following incubation, beads were washed three times with ice cold KPBS. Half of the beads were incubated with 90μL TritonX Lysis Buffer for proteomics while the other half were incubated with 240μL of MTBE for lipidomics on a rotator for 10 minutes at 4°C. For proteomic samples - following incubation, eluate was collected from beads and spun at 1,000g for 1.5 minutes at 4°C to remove cellular debris and potential bead contamination. 5μL of supernatant was added to 45μL of TritonX Lysis Buffer as a mitochondrial lysate sample. The remaining supernatant was used for quantitative proteomics and stored at −80°C until LC-MS-MS. For lipidomic samples – following incubation eluate was collected from beads and added to 200μL of ice-cold LC/MS grade water. 100μL of ice-cold LC/MS grade water was also added to whole cell lipidomic samples at this point. Both whole cell and mitochondrial lipidomic samples were vigorously shaken by vortex for 10 minutes at 4°C and spun at 14,000 rpm at 4°C for 10 minutes. The lower lipid-containing layer was carefully collected, dried under nitrogen, and stored at −80°C until LC-MS.
For polar mitochondrial metabolomics, same experimental conditions were used. Once cleared, the cell homogenate was used similar to above. 5μL of cleared homogenate was added to 45μL of TritonX Lysis Buffer as a whole cell lysate sample and 20μL of cleared homogenate was added to 80μL 80% LC/MS grade methanol containing 15N and 13C fully-labeled amino acid standards (Cambridge Isotope Laboratories #MSK-A2–1.2) for whole cell polar metabolite extraction. Metabolites were extracted for 10 minutes on a rotor at 4°C. The remaining homogenate was incubated with 200μL of prewashed anti-HA magnetic beads (Thermo Scientific #88837) on a rotator for 5 minutes at 4°C. Following incubation, beads were washed three times with ice cold KPBS. 90% of the beads were incubated with 80μL 80% LC/MS grade methanol with standards for metabolomics while the remaining beads were incubated with 90μL TritonX Lysis Buffer for protein extraction on a rotator for 10 minutes at 4°C. For protein samples - following incubation, eluate was collected from beads and spun at 1,000g for 1.5 minutes at 4°C to remove cellular debris and potential bead contamination. 5μL of supernatant was added to 45μL of TritonX Lysis Buffer as a mitochondrial lysate sample. For metabolomic samples – following incubation eluate was collected from beads and transferred to a new tube. Both whole cell and mitochondrial metabolomic samples were spun at 14,000 rpm at 4°C for 10 minutes and the supernatant transferred to a new tube and stored at −80°C until LC-MS.
Uptake Assays of Isotopically Labeled Choline in Isolated Mitochondria
Mitochondria were purified from HEK293T FLVCR1 KO and FLVCR1 KO +FLVCR1 cDNA cells expressing a 3xHA-OMP25-mCherry (mitochondrial isolation) or 3xMyc-OMP25-mCherry (background control) construct. Equal cell number was seeded in 15cm plates and mitochondrial isolated 24 hours later. Per condition, triplicate confluent 15cm plates were washed twice with ice cold KPBS and scraped in 1mL of ice cold KPBS. Cells were pelleted via centrifugation at 1,000g for 1.5 minutes at 4°C. Cells were resuspended in 1mL of ice cold KPBS and homogenized with 30 passes of a 2mL dounce homogenizer. Homogenate was spun at 1,000g for 1.5 minutes at 4°C to pellet intact cells. 10μL of cleared homogenate was added to 90μL of TritonX Lysis Buffer as a whole cell lysate sample. The remaining homogenate was incubated with 200μL of prewashed anti-HA magnetic beads (Thermo Scientific #88837) on a rotator for 5 minutes at 4°C. Following incubation, beads were washed three times with ice cold KPBS. 90% of the beads were incubated with 1mL of mitochondrial transport buffer (KPBS, 10mM HEPES, 0.5mM EGTA, pH 7.35) supplemented with 3mg/L [1,2-13C2]Choline chloride (Cambridge Isotope Laboratories #CLM-548.01). Care was taken to ensure pH of mitochondrial transport buffer did not change following [1,2-13C2]Choline chloride addition. Beads were then incubated for 30 minutes at room temperature on a rotor. The remaining 10% of beads were incubated with 50μL of TritonX Lysis buffer on a rotor for 10 minutes at 4°C. For protein samples - following incubation, eluate was collected from beads and spun at 1,000g for 1.5 minutes at 4°C to remove cellular debris and potential bead contamination. 5μL of supernatant was added to 45μL of TritonX Lysis Buffer as a mitochondrial lysate sample. Mitochondrial enrichment was confirmed by western blot using mitochondrial and whole cell lysate samples. For uptake samples, beads were washed three times with ice cold KPBS following incubation. Beads were then incubated with 80μL 80% LC/MS grade methanol with standards for metabolomics on a rotator for 10 minutes at 4°C. Following incubation, metabolomic samples were spun at 14,000 rpm at 4°C for 10 minutes and the supernatant transferred to a new tube and stored at −80°C until LC-MS.
Mitochondrial Proteomics
Cysteines were reduced and alkylated using DTT and IAA. Proteins were precipitated with acetone and pellets were digested with trypsin in 200mM EPPS. Peptides were labeled with TMTpro aliquots, quenched with hydroxylamine and pooled. Pooled peptides were fractionated using high pH reverse phase spin columns (Pierce) and analyzed by LC-MS/MS with MS2 fragmentation. Data was processed using Proteome Discoverer v. 2.5 and further statistical analysis was performed within the Perseus statistical software environment78. All values were log2 transformed and normalized to the median intensity within each sample. Proteins with at least three detected peptides were filtered for further analysis. A truncated ANOVA test based on this criterion and a permutation-based FDR q<0.01 identified 411 proteins which were used to generate the principal component analysis (PCA) and heatmap.
RNA-Seq
Cells were seeded at a concentration of 250,00 cells per 6-well in triplicate in choline depleted or replete medium. The next day cells were given fresh media and 24 hours later collected for RNA extraction using the RNeasy Mini Kit (Qiagen #74104) according to manufacturer’s manual. RNA concentrations were determined using Qubit 2.0 Fluorometer (Life Technologies) and RNA integrity assessed by Agilent TapeStation 4200 (Agilent Technologies). RNA sequencing libraries were prepared using TruSeq Stranded mRNA Library Prep (Illumina #20020595) following manufacturer’s specifications. Sequencing libraries were clustered onto a single lane of a flowcell and loaded on a Illumina HiSeq Instrument according to manufacturer’s guidelines. Samples were sequenced using a 1×75bp Single End configuration. Sequencing reads were aligned to the reference genome (Homo_sapiens.GRCh38) and gene models retrieved from the TxDB.Hsapiens.UCSC.hg38.knownGene.gtf.gz Bioconductor library. Transcript expression was calculated using Salmon79 and raw read counts per gene were normalized and rlog transformed using DESeq280. Significant differentially expressed genes between conditions were identified by DESeq2with a Benjamini Hochberg adjusted p-value <0.05. Geneset Enrichment Analysis (GSEA) was performed using the fgsea() R package81.
Electron Microscopy and Quantification of Mitochondria
Cells were fixed in a solution containing 2% glutaraldehyde, and 2 mM CaCl2 in 0.1 M sodium cacodylate buffer (pH 7.2) for >1 hr at room temperature and postfixed in 1% osmium/0.8% potassium ferricyanide in 0.1 M cacodylate buffer, post-stained with uranyl acetate 1% in water and dehydrated in an ethanol series. E11.5 mouse embryos were fixed in 2% glutaraldehyde, and 2 mM CaCl2 in 0.1 M sodium cacodylate buffer (pH 7.2) for >1 hr at room temperature, then dissected into three parts and fixed longer (2 hours at RT followed by 24 hrs at 4°C) in the same fixative. Samples were postfixed in 1% osmium tetroxide in 0.1M cacodylate buffer, post-stained with uranyl acetate 1% in water and dehydrated in an acetone series. Cell and embryo samples were embedded in Eponate 12 (Ted Pella, Inc). Ultrathin sections (60–65 nm) were then counterstained with uranyl acetate and lead citrate, and images were acquired using a Tecnai G2–12 transmission electron microscope (FEI, Hillsboro, Oregon) equipped with an AMT BioSprint29 digital camera.
Mitochondrial ultrastructure was quantified from transmission electron micrographs, as previously described82,83. After setting scale measurements, mitochondrial outer membranes were traced using the freehand selection tool and the measure function used to calculate mitochondrial outer membrane perimeter and mitochondrial surface area. Within each organelle, cristae width and cristae junction width were traced using the freehand line tool and measured with the measure function. Mitochondrial density was calculated by dividing the number of observed cristae of a single mitochondrion by the surface area of that organelle.
Proliferation Assays
HeLa and HEK293T FLVCR1 KO and FLVCR1 KO +FLVCR1 cDNA cells were seeded at 1.5×10⁶ cells per 15cm plate in either choline depleted or choline replete media. Cells were maintained in media conditions and passaged together by cell line as needed with 1.5×10⁶ reseeded at each passage. With each passage, cell number was counted in triplicate and cumulative log2 population doublings calculated.
After passage in respective medias for at least 1 week, cells were seeded in 96-well plates at a concentration of 1,000 cells per well in a final volume of 200μL with indicated media conditions. Cells were seeded in at least triplicate wells per condition. For initial cell number of each condition, 40μL of Cell Titer Glo Reagent (Promega) was added and luminescence read using a SpectraMax M3 plate reader (Molecular Devices) on the day of seeding, after 5 (HEK293T) or 6 (HeLa) days of growth, luminescence was read as above. Data are presented as log2fold change in cell number relative to luminescence of initial cell number of each condition.
For proliferation assays in increasing doses of hemin, cells were seeded in 96-well plates at a concentration of 1,000 cells per well in a final volume of 100μL with indicated media conditions (i.e. choline supplementation). Cells were seeded in at least triplicate wells per condition. Once cells had attached, an additional 100μL of media from indicated conditions with hemin at varying concentrations was added to yield reported hemin concentrations in 200μL. Initial cell number was read at this timepoint and after 4 days of growth luminescence was read as above. Data are presented as log2fold change in cell number relative to luminescence of initial cell number of each condition.
CRISPR/Cas9 Genetic Screens
Metabolism-scale CRISPR knockout screens were performed as previously described33,84. Briefly, 2,989 genes encoding metabolic enzymes and small molecular transporters were targeted with a total of 23,777 sgRNAs and 50 non-targeting sgRNA controls. After cloning into lentiCRISPR-v2 puro (Addgene #982990), the pooled plasmid library was used to produce lentivirus-containing supernatants. The titer of lentiviral supernatants was determined by infection of target cells at a range of virus and counting the number of puromycin-resistant cells after 3 days of selection. For the screens, 30×106 target cells were infected at an MOI of ~0.7 and selected with puromycin. An initial pool of 30×106 cells was harvested for genomic DNA extraction at the beginning of the screen. 30×106 cells at a concentration of 3×10⁶ per 15cm plate were subjected to each experimental condition and passaged every 3 days until ~14 cumulative population doublings were reached. The following target cells and conditions were used for the screens in this study – HEK293T FLVCR1 KO cells: RPMI 1640, RPMI 1640 +1mM Choline, Choline Depleted RPMI 1640, Choline Replete RPMI 1640; HEK293T FLVCR1 KO +FLVCR1 cDNA cells: RPMI 1640. On the final day of screening, cells were harvested for genomic DNA extraction. Genomic DNA was extracted using a DNeasy Blood & Tissue Kit (Qiagen) and amplification of sgRNA inserts was performed via PCR using barcoded primers for each condition. PCR amplicons were purified and sequenced on a MiSeq (Illumina). Sequencing reads were mapped and the abundance of each sgRNA was measured. Gene score is defined as the median log2fold change in the abundance of all sgRNAs targeting a particular gene between the initial and final populations.
Choline Supplementation in Pregnant Flvcr1 Mice
Flvcr1HET females were bred with Flvcr1HET males and considered 0.5dpc on the day a copulatory plug was found. 0.5dpc Flvcr1HET females were then assigned to choline sufficient or choline supplemented treatment arms. Choline supplemented treatment consisted of a choline supplemented (20g/kg) iron-supplemented L-AA defined diet (Dyets #519586) and daily intraperitoneal injections of 200mg/kg choline bitartrate. Choline bitartrate was made by dissolving choline bitartrate (Sigma Aldrich #C1629) in PBS at 22mg/mL concentration. pH was adjusted to 7 and choline bitartrate was sterile filtered before use. To achieve 200mg/kg dosing, 9.1uL of 200mg/kg solution was injected per g bodyweight of pregnant mouse. Mice were weighed daily before injections. Choline sufficient treatment consisted of a choline sufficient (14.48g/kg) iron-supplemented L-AA defined diet (Dyets #518754) and daily intraperitoneal injections of sterile PBS (9.1uL injected per g bodyweight, weighed daily). Micro- and macro-nutrients of both diets can be found in Data S1. Of note, then choline sufficient has ~4.4x more choline than standard chow diet (PicoLab Rodent Diet #5053). Embryos or pups were collected E11.5 – E19.5/birth. Embryos were isolated with the aid of a dissecting microscope (Zeiss) and imaged using a Zeiss Axio Zoom.V16 stereomicroscope with Axiocam 506 mono camera. Embryos used for metabolomics and western blotting were flash frozen while others were fixed for 24 hours in Modified Davidson’s Fixative (Electron Microscopy Sciences #64133–50) and subsequently stored in 70% ethanol. Embryos were genotyped by yolk sac or embryonic tissue using the primers in Table S1.
Necropsy and Histopathological Assessment of Flvcr1 Embryos
Timed matings of Flvcr1HET mice were performed as above and E11.5 embyros were isolated with the aid of a dissecting microscope (Zeiss) and immediately fixed in Modified Davidson’s Fixative for 24 hours (Electron Microscopy Sciences #64133–50). Matching placentas for each embryo was also collected and fixed in 10% formalin (Sigma-Aldrich #HT501128) for 24 hours. Tissues for histology were stored in 70% ethanol after fixation until processing. Embryos were genotyped by yolk sac. Fixed embryos and placentas were grossly examined by board-certified veterinary anatomic pathologists. Body weights and body-length measurements were taken and recorded. Tissue was processed for histopathological examination by the Laboratory of Comparative Pathology (LCP) (Weill Cornell Medicine). Whole embryos were embedded for sagittal sections and slides stained by hematoxylin and eosin (H&E). Placentas were cut in half, embedded, and slides stained by (H&E). Slides were examined by board-certified veterinary anatomic pathologists at LCP and independently reviewed by a board-certified veterinary anatomic pathologist specializing in early murine development and placental pathology.
Following gross and microscopic histopathological examination of E11.5 Flvcr1WT, Flvcr1HET, Flvcr1KO by board-certified veterinary anatomic pathologists, no obvious defects or lesions could be identified to explain the embryonic lethality of Flvcr1KO embryos. All major identifiable organs and embryonal structures of the embryos were examined – the nervous system (including the brain and spinal cord), the mandibular component of the first brachial arch, the second brachial arch, the lung bud, the heart, the hepatic primordium, and the primitive gut. Previous work has attributed the embryonic lethality of Flvcr1KO mice to defective erythropoiesis9. Careful attention was therefore given to the hepatic primordium, the site of definitive hematopoiesis beginning at approximately E10.085. All embryos displayed livers populated by adequate number of hematopoietic cells that did not differ between genotypes (Fig. S6b). Additionally, there was a normal amount of intravascular circulating nucleated (immature) red blood cells in the embryonic tissues with no differences between genotypes. Taken together, this suggests that morphologically, there are no defects in definitive hematopoiesis in Flvcr1KO embryos. Additionally, no consistent differences in the placentas could be identified that would explain the embryonic lethality of Flvcr1KO mice. Despite the lack of overt defects in development, Flvcr1KO embryos were noticeably smaller as evidenced by light bodyweight and short body lengths (Fig. S6b). This is consistent with the pleiotropic role of choline in the development and function of many tissues.
To definitively determine whether Flvcr1 is required for embryonic hematopoiesis and if this loss alone can explain the embryonic lethality of Flvcr1KO mice, Flvcr1 must be deleted only in erythroid cells using an appropriate lineage specific Cre such as ErGFP-Cre86. Conditional deletion of Flvcr1 in the hematopoietic lineage has been performed in adult mice using a Mx-Cre system9,87. These studies identified severe hyperchromic macrocytic anemia and reticulocytopenia9 or severe macrocytic anemia87 as the phenotypic consequences of Flvcr1 loss in the hematopoietic lineage of adult mice. Using the same models, it was also shown that Flvcr1 loss impairs αβ T cell development70 but not hematopoietic stem cell function88. Hepatocyte-specific Flvcr1 deletion using Alb-Cre yielded adult animals with no severe pathological phenotypes, though increased hepatic iron levels were noted in null livers89. Intestinal deletion of Flvcr1 using Vil-Cre had no appreciable effect on the intestinal mucosal at steady state but were more susceptible to mortality in a dextran sulfate sodium (DSS) induced ulcerative colitis model90. Similarly, conditional deletion of Flvcr1 in adult endothelial cells using Cdh5-CreERT2 revealed no overt phenotypes, though tumor angiogenesis was impaired in xenograft models91. Retinal angiogenesis was also impaired by endothelial cell Flvcr1 loss induced immediately at birth91. Interestingly, constitutive endothelial cell deletion of Flvcr1 using Tie2-Cre was embryonic lethal at E14.5-E15.5 with intraembryonic hemorrhages visible at E12.5. The embryonic lethality of endothelial specific Flvcr1 suggests a possible explanation for the lethality Flvcr1KO embryos, though they die earlier in development. Future work will need to utilize constitutive tissue specific Cre models which can result in developmental Flvcr1 deletion to identify the precise cause of embryonic lethality of Flvcr1KO embryos. Further, much remains to be discovered in postnatal mice using conditional and constitutive Cre models. There are likely multiple tissue-specific roles of Flvcr1 given its ubiquitous expression and the necessity of choline for the metabolism of all mammalian tissues.
QUANTIFICATION AND STATISTICAL ANALYSIS
Statistical analysis was performed with built-in statistics tools in Prism8 (GraphPad Software). Statistical details of experiments including exact statistical test used, n, exact p value, and definitions of center and dispersion measurements can be found in the figure legends.
METSIM Dataset Analysis
The human metabolome is determined by the genes encoding metabolic enzymes and transporters. Therefore, we prioritized a list of 2892 genes of interest that included a union set of metabolic genes and plasma membrane transporters. The boundaries of the genes were defined according to the ENSEMBL reference human genome sequence (Homo_sapiens.GRCh38.106.gtf) ±15 kB pairs upstream and downstream. The narrow genomic regions capture a large proportion of the cis-regulatory variants92,93. Given the specified window, we applied the minimum-p-value gene-based approach to identify metabolite-gene associations from the METSIM dataset, which contains the GWAS results for blood serum level of 1391 metabolites from 6136 men4. The gene-based approach together with the gene prioritization had a much smaller multiple-testing burden than SNP-based GWAS and set the Bonferroni significance at -log10(pval) > 5 instead of the conventional GWAS significance threshold of -log10(pval) > 7.3. Then, metabolite-wise and gene-wise ranks were computed based on the observed p-value statistic (with the top rank 1 corresponding to the lowest p-value statistic or strongest association). We note that an empirical p-value can be computed using permutation, as the limiting (theoretical) distribution of the gene-based statistic is not known under the null hypothesis that a gene is not associated with a metabolite. To further prioritize the top associations, we defined the following criteria, all of which must be satisfied: (i) the gene must be ranked in top 10 for a given metabolite; (ii) metabolite must be the top score for the considered gene; (iii) -log10(p-val) > 5 of the association (defined by Bonferroni multiple test correction as described above). Conditions (i) and (iii) ensure that a gene of interest is likely to be a strong determinant of the metabolite level in the blood serum while (ii) ensures that the gene is likely to have the most immediate/direct effect on the metabolite of interest. Afterwards, based on the overlap between AMIGO GO Term “Plasma Membrane” and an in-house transporter gene list, plasma membrane transporters were selected for further analysis given their role in the control of the extra- and intracellular levels of the metabolites. The resulting entries were distributed in four categories: (a) metabolites are classified as xenobiotics/partially characterized/uncharacterized, (b) previously reported in literature associations, (c) unknown associations with metabolites that score only for one plasma membrane transporter, (d) other entries. Metabolite classification followed that used in the METSIM study4.
DepMAP and METSIM Integrated Analysis
METSIM associations were identified through the minimum-p-value approach and ranked as described above. The top associations were defined by the following criteria: (i) the gene must be ranked in top 10 for a given metabolite; (ii) -log10(p-val) > 5 of the association (defined by Bonferroni multiple test correction). Then, entries containing xenobiotics/partially characterized/uncharacterized metabolites were removed. Pearson Correlation Coefficient (PC) values were computed for the selected list of ~3000 metabolic genes from DepMap 22Q2 Public+Score, Chronos dataset. Then, we filtered interactions containing plasma membrane transporters with |PC| > 0.2. To avoid false positive hits, we removed the entries in which both genes are located on the same chromosome. Finally, to integrate METSIM and DepMap, we selected the pairs with |PC| > 0.2 in which both genes shared the same top-scoring metabolite according to our METSIM analysis.
Code for Minimum p-value Analysis of METSIM Data
      library(tidyverse)
library(doParallel)
library(optparse)
library(data.table) registerDoParallel(20)
library(stats)
library(stringr)
library(vctrs)
option_list = list(
 make_option(“--dir_fold”, action=“store”, default=NA, type=‘character’, help=“Path to data”),
 make_option(“--gene_list_dir”, action=“store”, default=NA, type=‘character’, help=“Path to gene_list”),
 make_option(“--output_folder_dir”, action=“store”, default=NA, type=‘character’, help=“Path to output_folder”))
opt = parse_args(OptionParser(option_list=option_list))
dir_fold <- opt$dir_fold
gene_list_dir <- opt$gene_list_dir
output_folder_dir <- opt$output_folder_dir
all_files <- list.files(path = dir_fold, full.names = TRUE, recursive = TRUE, pattern = “gz”)
list_genes <- read.table(gene_list_dir)
my_function <- function(all_files, i) {
 metabolite <- fread(all_files[i], header = TRUE)
 accum <- foreach (i=1:nrow(list_genes), .combine = “rbind”) %dopar% {
  gene_name <- list_genes[i, 4]
  start <- list_genes[i, 2]
  end <- list_genes[i, 3]
  chrom <- list_genes[i, 1]
  look <- filter(metabolite, (BEG > (start - 15000) & (END < end + 15000) ) & (CHROM == chrom))
  if (!(nrow(look) == 0)) {
   cbind(gene_name, look[look$LOGPVALUE == max(look[[“LOGPVALUE”]]),]) } }
rm(metabolite)
metname <- gsub(dir_fold, ““, all_files[i])
metname <- gsub(“\\_.*”, ““, metname)
colnames(accum) <- c(paste(“Gene_name”, metname), “CHROM”, “BEG”, “END”, “MARKER_ID”, “NEA”,”EA”,
“N”, “EAC”, “MAF”, “BETA”, “SEBETA”, paste(“LOGPVALUE”, metname)) return(accum) }
for (i in 1:1391) {
 index <- paste(strrep(“0”, 4-nchar(i)), i, sep = ““)
 output <- my_function(all_files, i)
 first <- paste(output_folder_dir, index, sep = “_”)
 full <- paste(first, “.txt”, sep = ““)
 write.table(output, full) }
Supplementary Material
Table S1. Oligonucleotide Sequences Related to STAR Methods.
Data S1. Unprocessed data underlying the display items in the manuscript, related to Figures 1–6 and S1–7.
Highlights.
Identification of metabolite-transporter associations from GWAS of serum metabolites
FLVCR1 is required for choline uptake and metabolism
Loss of FLVCR1 impairs mitochondrial function leading to activation of the ISRmt
Flvcr1-mediated choline transport is necessary for murine embryogenesis
ACKNOWLEDGEMENTS
We thank all members of the Birsoy laboratory for helpful suggestions. We thank Janis L. Abkowitz for generously providing the Flvcr1 mice, Michael Boehnke for providing the METSIM dataset, and Navdeep Chandel for providing pLV-EF1a-RFP-EV/AOX plasmids. We are extremely grateful to Mohamed Atmane and Sebastien Patenaude-Monette of the Laboratory of Comparative Pathology at Weill Cornell Medicine (P30 Core Grant) for performing the necropsy and histopathologic analysis of Flvcr1 embryos. We also thank Jerrold M. Ward for performing a histopathologic assessment of Flvcr1 embryos. Data was generated and/or analyzed by the Proteomics Resource Center (RRID:SCR_017797), Electron Microscopy Resource Center, Bioinformatics Resource Center, and the Flow Cytometry Resource Center at The Rockefeller University. Some figures use modified illustrations from Servier Medical Art licensed under a Creative Commons Attribution 3.0 Unported License. Graphical abstract created with BioRender.com.
T.K. is supported by NIH/NIDDK (F32 DK127836), the Shapiro-Silverberg Fund for the Advancement of Translational Research and a Merck Postdoctoral Fellowship at The Rockefeller University. A.K. is supported by a Boehringer Ingelheim Fonds PhD Fellowship. E.G. is supported by NIH/NHGRI (R01HG011138 and R35HG010718). R.K.H. is supported by an NIH-National Cancer Institute Cancer Center Support Grant (P30 CA008748)and is a Searle Scholar. K.B. is supported by the NIH/NIDDK (R01 DK123323-01), Mark Foundation Emerging Leader Award; and is a Searle and Pew-Stewart Scholar.
Footnotes
DECLARATION OF INTERESTS
K.B. is scientific advisor to Nanocare Pharmaceuticals and Atavistik Bio. Other authors declare no competing interests.
Publisher's Disclaimer: This is a PDF file of an unedited manuscript that has been accepted for publication. As a service to our customers we are providing this early version of the manuscript. The manuscript will undergo copyediting, typesetting, and review of the resulting proof before it is published in its final form. Please note that during the production process errors may be discovered which could affect the content, and all legal disclaimers that apply to the journal pertain.
REFERENCES
- 1.Neal B., Perkovic V., Mahaffey KW., de Zeeuw D., Fulcher G., Erondu N., Shaw W., Law G., Desai M., and Matthews DR. (2017). Canagliflozin and Cardiovascular and Renal Events in Type 2 Diabetes. New England Journal of Medicine 377, 644–657. 10.1056/NEJMOA1611925/SUPPL_FILE/NEJMOA1611925_DISCLOSURES.PDF. [DOI] [PubMed] [Google Scholar]
- 2.Mann JJ (2005). The Medical Management of Depression. [DOI] [PubMed] [Google Scholar]
- 3.César-Razquin A, Snijder B, Frappier-Brinton T, Isserlin R, Gyimesi G, Bai X, Reithmeier RA, Hepworth D, Hediger MA, Edwards AM, et al. (2015). A Call for Systematic Research on Solute Carriers. Cell 162, 478–487. 10.1016/J.CELL.2015.07.022. [DOI] [PubMed] [Google Scholar]
- 4.Yin X, Chan LS, Bose D, Jackson AU, VandeHaar P, Locke AE, Fuchsberger C, Stringham HM, Welch R, Yu K, et al. (2022). Genome-wide association studies of metabolites in Finnish men identify disease-relevant loci. Nature Communications 2022 13:1 13, 1–14. 10.1038/s41467-022-29143-5. [DOI] [PMC free article] [PubMed] [Google Scholar]
- 5.Goldstein JL, and Brown MS (1974). Binding and Degradation of Low Density Lipoproteins by Cultured Human Fibroblasts: COMPARISON OF CELLS FROM A NORMAL SUBJECT AND FROM A PATIENT WITH HOMOZYGOUS FAMILIAL HYPERCHOLESTEROLEMIA. Journal of Biological Chemistry 249, 5153–5162. 10.1016/S0021-9258(19)42341-7. [DOI] [PubMed] [Google Scholar]
- 6.Szeri F, Lundkvist S, Donnelly S, Engelke UFH, Rhee K, Williams CJ, Sundberg JP, Wevers RA, Tomlinson RE, Jansen RS, et al. (2020). The membrane protein ANKH is crucial for bone mechanical performance by mediating cellular export of citrate and ATP. PLoS Genet 16, e1008884. 10.1371/JOURNAL.PGEN.1008884. [DOI] [PMC free article] [PubMed] [Google Scholar]
- 7.Sinclair L. v., Neyens D, Ramsay G, Taylor PM, and Cantrell DA (2018). Single cell analysis of kynurenine and System L amino acid transport in T cells. Nature Communications 2018 9:1 9, 1–11. 10.1038/s41467-018-04366-7. [DOI] [PMC free article] [PubMed] [Google Scholar]
- 8.Tsherniak A, Vazquez F, Montgomery PG, Weir BA, Kryukov G, Cowley GS, Gill S, Harrington WF, Pantel S, Krill-Burger JM, et al. (2017). Defining a Cancer Dependency Map. Cell 170, 564–576.e16. 10.1016/J.CELL.2017.06.010. [DOI] [PMC free article] [PubMed] [Google Scholar]
- 9.Keel SB, Doty RT, Yang Z, Quigley JG, Chen J, Knoblaugh S, Kingsley PD, De Domenico I, Vaughn MB, Kaplan J, et al. (2008). A heme export protein is required for red blood cell differentiation and iron homeostasis. Science (1979) 319, 825–828. 10.1126/SCIENCE.1151133/SUPPL_FILE/KEEL_SOM.PDF. [DOI] [PubMed] [Google Scholar]
- 10.Vaughan DP, Costello DJ, and David Vaughan CP (2021). Extending the phenotype of posterior column ataxia with retinitis pigmentosa caused by variants in FLVCR1. Am J Med Genet A. 10.1002/AJMG.A.62612. [DOI] [PubMed] [Google Scholar]
- 11.Yanatori I., Yasui Y., Miura K., and Kishi F. (2012). Mutations of FLVCR1 in posterior column ataxia and retinitis pigmentosa result in the loss of heme export activity. Blood Cells Mol Dis 49, 60–66. 10.1016/J.BCMD.2012.03.004. [DOI] [PubMed] [Google Scholar]
- 12.Lachmann ES, Mautone L, and Dulz S (2021). Isolated juvenile macular dystrophy without posterior column ataxia associated with FLVCR1 mutation. 10.1080/13816810.2021.1970196, 1–3. 10.1080/13816810.2021.1970196. [DOI] [PubMed] [Google Scholar]
- 13.Rajadhyaksha AM, Elemento O, Puffenberger EG, Schierberl KC, Xiang JZ, Putorti ML, Berciano J, Poulin C, Brais B, Michaelides M, et al. (2010). Mutations in FLVCR1 Cause Posterior Column Ataxia and Retinitis Pigmentosa. The American Journal of Human Genetics 87, 643–654. 10.1016/J.AJHG.2010.10.013. [DOI] [PMC free article] [PubMed] [Google Scholar]
- 14.Kennedy EP, and Weiss SB (1956). THE FUNCTION OF CYTIDINE COENZYMES IN THE BIOSYNTHESIS OF PHOSPHOLIPIDES. Journal of Biological Chemistry 222, 193–214. 10.1016/S0021-9258(19)50785-2. [DOI] [PubMed] [Google Scholar]
- 15.Chiabrando D, Marro S, Mercurio S, Giorgi C, Petrillo S, Vinchi F, Fiorito V, Fagoonee S, Camporeale A, Turco E, et al. (2012). The mitochondrial heme exporter FLVCR1b mediates erythroid differentiation. J Clin Invest 122, 4569–4579. 10.1172/JCI62422. [DOI] [PMC free article] [PubMed] [Google Scholar]
- 16.Macfarlane DP, Zou X, Andrew R, Morton NM, Livingstone DEW, Aucott RL, Nyirenda MJ, Iredale JP, and Walker BR (2011). Metabolic pathways promoting intrahepatic fatty acid accumulation in methionine and choline deficiency: Implications for the pathogenesis of steatohepatitis. Am J Physiol Endocrinol Metab 300, 402–409. 10.1152/AJPENDO.00331.2010/ASSET/IMAGES/LARGE/ZH10021161730003.JPEG. [DOI] [PMC free article] [PubMed] [Google Scholar]
- 17.Lombardi B, Pani P, and Schlunk FF (1968). Choline-deficiency fatty liver: impaired release of hepatic triglycerides. J Lipid Res 9, 437–446. 10.1016/S0022-2275(20)42721-X. [DOI] [PubMed] [Google Scholar]
- 18.Krahmer N, Guo Y, Wilfling F, Hilger M, Lingrell S, Heger K, Newman HW, Schmidt-Supprian M, Vance DE, Mann M, et al. (2011). Phosphatidylcholine Synthesis for Lipid Droplet Expansion Is Mediated by Localized Activation of CTP:Phosphocholine Cytidylyltransferase. Cell Metab 14, 504–515. 10.1016/J.CMET.2011.07.013. [DOI] [PMC free article] [PubMed] [Google Scholar]
- 19.Mödinger Y, Schön C, Wilhelm M, and Hals PA (2019). Plasma Kinetics of Choline and Choline Metabolites After A Single Dose of SuperbaBoostTM Krill Oil or Choline Bitartrate in Healthy Volunteers. Nutrients 2019, Vol. 11, Page 2548 11, 2548. 10.3390/NU11102548. [DOI] [PMC free article] [PubMed] [Google Scholar]
- 20.Garguilo MG, and Michael AC (1996). Amperometric microsensors for monitoring choline in the extracellular fluid of brain. J Neurosci Methods 70, 73–82. 10.1016/S0165-0270(96)00105-7. [DOI] [PubMed] [Google Scholar]
- 21.Brehm R, Lindmar R, and Löffelholz K (1987). Muscarinic Mobilization of Choline in Rat Brain In Vivo as Shown by the Cerebral Arterio-Venous Difference of Choline. J Neurochem 48, 1480–1485. 10.1111/J.1471-4159.1987.TB05689.X. [DOI] [PubMed] [Google Scholar]
- 22.Bianchi L, de Micheli E, Bricolo A, Ballini C, Fattori M, Venturi C, Pedata F, Tipton KF, and della Corte L (2004). Extracellular Levels of Amino Acids and Choline in Human High Grade Gliomas: An Intraoperative Microdialysis Study*. [DOI] [PubMed] [Google Scholar]
- 23.Ferguson SM, Bazalakova M, Savchenko V, Tapia JC, Wright J, and Blakely RD (2004). Lethal impairment of cholinergic neurotransmission in hemicholinium-3-sensitive choline transporter knockout mice. Proc Natl Acad Sci U S A 101, 8762–8767. 10.1073/PNAS.0401667101/SUPPL_FILE/01667FIG7.JPG. [DOI] [PMC free article] [PubMed] [Google Scholar]
- 24.Okuda T, Haga T, Kanai Y, Endou H, Ishihara T, and Katsura I (2000). Identification and characterization of the high-affinity choline transporter. Nature Neuroscience 2000 3:2 3, 120–125. 10.1038/72059. [DOI] [PubMed] [Google Scholar]
- 25.Inazu M (2019). Functional Expression of Choline Transporters in the Blood-Brain Barrier. 10.3390/nu11102265. [DOI] [PMC free article] [PubMed] [Google Scholar]
- 26.Inazu M (2014). Choline transporter-like proteins CTLs/SLC44 family as a novel molecular target for cancer therapy. Biopharm Drug Dispos 35, 431–449. 10.1002/BDD.1892. [DOI] [PubMed] [Google Scholar]
- 27.Inazu M, Takeda H, and Matsumiya T (2005). Molecular and functional characterization of an Na+-independent choline transporter in rat astrocytes. J Neurochem 94, 1427–1437. 10.1111/J.1471-4159.2005.03299.X. [DOI] [PubMed] [Google Scholar]
- 28.Fullerto MD., Wagne L., Yua Z., and Bakovi M. (2006). Impaired trafficking of choline transporter-like protein-1 at plasma membrane and inhibition of choline transport in THP-1 monocyte-derived macrophages. Am J Physiol Cell Physiol 290, 1230–1238. 10.1152/AJPCELL.00255.2005/ASSET/IMAGES/LARGE/ZH00040647980005.JPEG. [DOI] [PubMed] [Google Scholar]
- 29.Fujita T, Shimada A, Okada N, and Yamamoto A (2006). Functional characterization of Na+-independent choline transport in primary cultures of neurons from mouse cerebral cortex. Neurosci Lett 393, 216–221. 10.1016/J.NEULET.2005.09.069. [DOI] [PubMed] [Google Scholar]
- 30.Michel V, and Bakovic M (2009). The solute carrier 44A1 is a mitochondrial protein and mediates choline transport. The FASEB Journal 23, 2749–2758. 10.1096/FJ.08-121491. [DOI] [PubMed] [Google Scholar]
- 31.Plagemann PGW (1971). Choline metabolism and membrane formation in rat hepatoma cells grown in suspension culture. 111. Choline transport and uptake by simple diffusion and lack of direct exchange with phosphatidylcholine. Journal Lipid Research 12, 715–724. 10.1016/S0022-2275(20)39460-8. [DOI] [PubMed] [Google Scholar]
- 32.Plagemann PGW, and Roth MF Permeation As the Rate-Limiting Step in the Phosphorylation of Uridine and Choline and Their Incorporation into Macromolecules by Novikoff Hepatoma Cells. Competitive Inhibition by Phenethyl Alcohol, Persantin, and Adenosine*. [DOI] [PubMed] [Google Scholar]
- 33.Zhu XG, Nicholson Puthenveedu S, Shen Y, La K, Ozlu C, Wang T, Klompstra D, Gultekin Y, Chi J, Fidelin J, et al. (2019). CHP1 Regulates Compartmentalized Glycerolipid Synthesis by Activating GPAT4. Mol Cell 74, 45–58.e7. 10.1016/j.molcel.2019.01.037. [DOI] [PMC free article] [PubMed] [Google Scholar]
- 34.He M, Kuk ACY, Ding M, Chin CF, Galam DLA, Nah JM, Tan BC, Yeo HL, Chua GL, Benke PI, et al. (2022). Spns1 is a lysophospholipid transporter mediating lysosomal phospholipid salvage. Proceedings of the National Academy of Sciences 119, e2210353119. 10.1073/PNAS.2210353119. [DOI] [PMC free article] [PubMed] [Google Scholar]
- 35.Ha HTT, Nguyen XTA, Vo LK, Leong NCP, Liu S, Nguyen DT, Lim YP, Wu JY, Nguyen TQ, Oh J, et al. (2022). SPNS1 is required for the transport of lysosphingolipids and lysoglycerophospholipids from lysosomes. bioRxiv, 2022.12.14.520377. 10.1101/2022.12.14.520377. [DOI] [Google Scholar]
- 36.Scharenberg SG, Dong W, Nyame K, Levin-Konigsberg R, Krishnan AR, Rawat ES, Spees K, Bassik MC, and Abu-Remaileh M (2022). A lysosomal lipid transport pathway that enables cell survival under choline limitation. bioRxiv, 2022.11.27.517422. 10.1101/2022.11.27.517422. [DOI] [PMC free article] [PubMed] [Google Scholar]
- 37.Wu Z, Wang Y, Lim J, Liu B, Li Y, Vartak R, Stankiewicz T, Montgomery S, and Lu B (2018). Ubiquitination of ABCE1 by NOT4 in Response to Mitochondrial Damage Links Cotranslational Quality Control to PINK1-Directed Mitophagy. Cell Metab 0. 10.1016/j.cmet.2018.05.007. [DOI] [PMC free article] [PubMed] [Google Scholar]
- 38.Ruan J, Li H, Chen Z, Coghlan A, Coin LJM, Guo Y, Hériché JK, Hu Y, Kristiansen K, Li R, et al. (2008). TreeFam: 2008 Update. Nucleic Acids Res 36, D735–D740. 10.1093/NAR/GKM1005. [DOI] [PMC free article] [PubMed] [Google Scholar]
- 39.Costa-Mattioli M, and Walter P (2020). The integrated stress response: From mechanism to disease. Science 368. 10.1126/SCIENCE.AAT5314. [DOI] [PMC free article] [PubMed] [Google Scholar]
- 40.Guo X, Aviles G, Liu Y, Tian R, Unger BA, Lin YHT, Wiita AP, Xu K, Correia MA, and Kampmann M (2020). Mitochondrial stress is relayed to the cytosol by an OMA1–DELE1–HRI pathway. Nature 2020 579:7799 579, 427–432. 10.1038/s41586-020-2078-2. [DOI] [PMC free article] [PubMed] [Google Scholar]
- 41.Fessler E, Eckl E-M, Schmitt S, Mancilla IA, Meyer-Bender MF, Hanf M, Philippou-Massier J, Krebs S, Zischka H, and Jae LT (2020). A pathway coordinated by DELE1 relays mitochondrial stress to the cytosol. Nature 2020, 1–5. 10.1038/s41586-020-2076-4. [DOI] [PMC free article] [PubMed] [Google Scholar]
- 42.Chen WW, Freinkman E, Wang T, Birsoy K, and Sabatini DM (2016). Absolute Quantification of Matrix Metabolites Reveals the Dynamics of Mitochondrial Metabolism. Cell 166, 1324–1337.e11. 10.1016/J.CELL.2016.07.040. [DOI] [PMC free article] [PubMed] [Google Scholar]
- 43.Trousil S., Kaliszczak M., Schug Z., Nguyen Q-D., Tomasi G., Favicchio R., Brickute D., Fortt R., Twyman FJ., Carroll L., et al. (2016). The novel choline kinase inhibitor ICL-CCIC-0019 reprograms cellular metabolism and inhibits cancer cell growth. Oncotarget 7, 37103–37120. 10.18632/ONCOTARGET.9466. [DOI] [PMC free article] [PubMed] [Google Scholar]
- 44.Johnson AR, Craciunescu CN, Guo Z, Teng YW, Thresher RJ, Blusztajn JK, and Zeisel SH (2010). Deletion of murine choline dehydrogenase results in diminished sperm motility. The FASEB Journal 24, 2752–2761. 10.1096/FJ.09-153718. [DOI] [PMC free article] [PubMed] [Google Scholar]
- 45.Quirós PM, Prado MA, Zamboni N, D’Amico D, Williams RW, Finley D, Gygi SP, and Auwerx J (2017). Multi-omics analysis identifies ATF4 as a key regulator of the mitochondrial stress response in mammals. J Cell Biol 216, 2027–2045. 10.1083/jcb.201702058. [DOI] [PMC free article] [PubMed] [Google Scholar]
- 46.Martínez-Reyes I, Robles Cardona L, Kong H, Vasan K, Mcelroy GS, Werner M, Kihshen H, Reczek CR, Weinberg SE, Gao P, et al. (2020). Mitochondrial ubiquinol oxidation is necessary for tumour growth. 288 | Nature | 585. 10.1038/s41586-020-2475-6. [DOI] [PMC free article] [PubMed] [Google Scholar]
- 47.Garcia-Bermudez J, Baudrier L, La K, Zhu XG, Fidelin J, Sviderskiy VO, Papagiannakopoulos T, Molina H, Snuderl M, Lewis CA, et al. (2018). Aspartate is a limiting metabolite for cancer cell proliferation under hypoxia and in tumours. Nat Cell Biol 20, 775–781. 10.1038/s41556-018-0118-z. [DOI] [PMC free article] [PubMed] [Google Scholar]
- 48.Birsoy K, Wang T, Chen WW, Freinkman E, Abu-Remaileh M, and Sabatini DM (2015). An Essential Role of the Mitochondrial Electron Transport Chain in Cell Proliferation Is to Enable Aspartate Synthesis. Cell 162, 540–551. 10.1016/J.CELL.2015.07.016. [DOI] [PMC free article] [PubMed] [Google Scholar]
- 49.Parikh S, Goldstein A, Koenig MK, Scaglia F, Enns GM, Saneto R, Anselm I, Cohen BH, Falk MJ, Greene C, et al. (2015). Diagnosis and management of mitochondrial disease: a consensus statement from the Mitochondrial Medicine Society. Genet Med 17, 689. 10.1038/GIM.2014.177. [DOI] [PMC free article] [PubMed] [Google Scholar]
- 50.Mehta AK, Arora N, Gaur SN, and Singh BP (2009). Acute toxicity assessment of choline by inhalation, intraperitoneal and oral routes in Balb/c mice. Regulatory Toxicology and Pharmacology 54, 282–286. 10.1016/J.YRTPH.2009.05.009. [DOI] [PubMed] [Google Scholar]
- 51.Hodge HC, and Goldstein MR (1942). The Acute Toxicity of Choline Hydrochloride in Mice and Rats. Exp Biol Med 51, 281–282. 10.3181/00379727-51-13937P. [DOI] [Google Scholar]
- 52.Li Z, and Vance DE (2008). Thematic Review Series: Glycerolipids. Phosphatidylcholine and choline homeostasis. J Lipid Res 49, 1187–1194. 10.1194/JLR.R700019-JLR200. [DOI] [PubMed] [Google Scholar]
- 53.Spencer WJ, Lewis TR, Pearring JN, and Arshavsky VY (2020). Photoreceptor Discs: Built Like Ectosomes. Trends Cell Biol 30, 904–915. 10.1016/j.tcb.2020.08.005. [DOI] [PMC free article] [PubMed] [Google Scholar]
- 54.Baker SA, and Kerov V (2013). Photoreceptor inner and outer segments. Curr Top Membr 72, 231–265. 10.1016/B978-0-12-417027-8.00007-6. [DOI] [PubMed] [Google Scholar]
- 55.Masland RH, and Mills JW (1980). Choline accumulation by photoreceptor cells of the rabbit retina. Proc Natl Acad Sci U S A 77, 1671–1675. 10.1073/PNAS.77.3.1671. [DOI] [PMC free article] [PubMed] [Google Scholar]
- 56.A-Wen Pu G, and Anderson RE (1983). Alteration of retinal choline metabolism in an experimental model for photoreceptor cell degeneration. Invest Ophthalmol Vis Sci 24, 288–293. [PubMed] [Google Scholar]
- 57.Hwang JS, and Shin YJ (2021). Role of Choline in Ocular Diseases. International Journal of Molecular Sciences 2021, Vol. 22, Page 4733 22, 4733. 10.3390/IJMS22094733. [DOI] [PMC free article] [PubMed] [Google Scholar]
- 58.Trujillo-Gonzalez I., Friday WB., Munson CA., Bachleda A., Weiss ER., Alam NM., Sha W., Zeisel SH., and Surzenko N. (2019). Low availability of choline in utero disrupts development and function of the retina. The FASEB Journal 33, 9194–9209. 10.1096/FJ.201900444R. [DOI] [PMC free article] [PubMed] [Google Scholar]
- 59.Xu Q, Wu C, Zhu Q, Gao R, Lu J, Valles-Colomer M, Zhu J, Yin F, Huang L, Ding L, et al. (2022). Metagenomic and metabolomic remodeling in nonagenarians and centenarians and its association with genetic and socioeconomic factors. Nature Aging 2022 2:5 2, 438–452. 10.1038/s43587-022-00193-0. [DOI] [PubMed] [Google Scholar]
- 60.Moore A, Busch MP, Dziewulska K, Francis RO, Hod EA, Zimring JC, D’Alessandro A, and Page GP (2022). Genome-wide metabolite quantitative trait loci analysis (mQTL) in red blood cells from volunteer blood donors. Journal of Biological Chemistry 298, 102706–102707. 10.1016/j.jbc.2022.102706. [DOI] [PMC free article] [PubMed] [Google Scholar]
- 61.Kvarnung M, Taylan F, Nilsson D, Albåge M, Nordenskjöld M, Anderlid BM, Nordgren A, and Syk Lundberg E (2016). Mutations in FLVCR2 associated with Fowler syndrome and survival beyond infancy. Clin Genet 89, 99–103. 10.1111/CGE.12565. [DOI] [PubMed] [Google Scholar]
- 62.Al-Murshedi F, Mirza H, Al-Saegh A, Al-Nabhani M, Al-Shabibi S, Baawain S, Al-Futaisi A, Al-Shehhi W, and Al-Maawali A (2020). Variability of non-lethal Fowler syndrome phenotype associated with FLVCR2 variants. Clin Genet 98, 520–521. 10.1111/CGE.13838. [DOI] [PubMed] [Google Scholar]
- 63.Radio FC, di Meglio L, Agolini E, Bellacchio E, Rinelli M, Toscano P, Boldrini R, Novelli A, di Meglio A, and Dallapiccola B (2018). Proliferative vasculopathy and hydranencephaly–hydrocephaly syndrome or Fowler syndrome: Report of a family and insight into the disease’s mechanism. Mol Genet Genomic Med 6, 446–451. 10.1002/MGG3.376. [DOI] [PMC free article] [PubMed] [Google Scholar]
- 64.Santander N, Lizama CO, Meky E, McKinsey GL, Jung B, Sheppard D, Betsholtz C, and Arnold TD (2020). Lack of Flvcr2 impairs brain angiogenesis without affecting the blood-brain barrier. J Clin Invest 130, 4055–4068. 10.1172/JCI136578. [DOI] [PMC free article] [PubMed] [Google Scholar]
- 65.Kalailingam P, Wang KQ, Toh XR, Nguyen TQ, Chandrakanthan M, Hasan Z, Habib C, Schif A, Radio FC, Dallapiccola B, et al. (2020). Deficiency of MFSD7c results in microcephaly-associated vasculopathy in Fowler syndrome. J Clin Invest 130, 4081–4093. 10.1172/JCI136727. [DOI] [PMC free article] [PubMed] [Google Scholar]
- 66.Mödinger Y, Schön C, Wilhelm M, and Hals PA (2019). Plasma Kinetics of Choline and Choline Metabolites After A Single Dose of SuperbaBoostTM Krill Oil or Choline Bitartrate in Healthy Volunteers. Nutrients 11. 10.3390/NU11102548. [DOI] [PMC free article] [PubMed] [Google Scholar]
- 67.Li Y, Ivica NA, Dong T, Papageorgiou DP, He Y, Brown DR, Kleyman M, Hu G, Chen WW, Sullivan LB, et al. (2020). MFSD7C switches mitochondrial ATP synthesis to thermogenesis in response to heme. Nature Communications 2020 11:1 11, 1–14. 10.1038/s41467-020-18607-1. [DOI] [PMC free article] [PubMed] [Google Scholar]
- 68.Schuler MH, di Bartolomeo F, Mårtensson CU, Daum G, and Becker T (2016). Phosphatidylcholine Affects Inner Membrane Protein Translocases of Mitochondria. Journal of Biological Chemistry 291, 18718–18729. 10.1074/JBC.M116.722694. [DOI] [PMC free article] [PubMed] [Google Scholar]
- 69.Yang Z, Philips JD, Doty RT, Giraudi P, Ostrow JD, Tiribelli C, Smith A, and Abkowitz JL (2010). Kinetics and Specificity of Feline Leukemia Virus Subgroup C Receptor (FLVCR) Export Function and Its Dependence on Hemopexin *. Journal of Biological Chemistry 285, 28874–28882. 10.1074/JBC.M110.119131. [DOI] [PMC free article] [PubMed] [Google Scholar]
- 70.Philip M, Funkhouser SA, Chiu EY, Phelps SR, Delrow JJ, Cox J, Fink PJ, and Abkowitz JL (2015). Heme Exporter FLVCR Is Required for T Cell Development and Peripheral Survival. The Journal of Immunology 194, 1677–1685. 10.4049/JIMMUNOL.1402172. [DOI] [PMC free article] [PubMed] [Google Scholar]
- 71.Doty RT, Yan X, Lausted C, Munday AD, Yang Z, Yi D, Jabbari N, Liu L, Keel SB, Tian Q, et al. (2019). Single-cell analyses demonstrate that a heme–GATA1 feedback loop regulates red cell differentiation. Blood 133, 457–469. 10.1182/BLOOD-2018-05-850412. [DOI] [PMC free article] [PubMed] [Google Scholar]
- 72.Doty RT, Fan X, Young DJ, Liang JA, Singh K, Pakbaz Z, Desmond R, Young-Baird SK, Chandrasekharappa SC, Donovan FX, et al. (2022). Studies in a mosaic DBA patient and chimeric mice reveal erythroid cell-extrinsic contributions to erythropoiesis. Blood. 10.1182/BLOOD.2021013507. [DOI] [PMC free article] [PubMed] [Google Scholar]
- 73.Allocco AL., Bertino F., Petrillo S., Chiabrando D., Riganti C., Bardelli A., Altruda F., Fiorito V., and Tolosano E. (2022). Inhibition of Heme Export and/or Heme Synthesis Potentiates Metformin Anti-Proliferative Effect on Cancer Cell Lines. Cancers 2022, Vol. 14, Page 1230 14, 1230. 10.3390/CANCERS14051230. [DOI] [PMC free article] [PubMed] [Google Scholar]
- 74.Fiorito V, Allocco AL, Petrillo S, Gazzano E, Torretta S, Marchi S, Destefanis F, Pacelli C, Audrito V, Provero P, et al. (2021). The heme synthesis-export system regulates the tricarboxylic acid cycle flux and oxidative phosphorylation. Cell Rep 35, 109252. 10.1016/j.celrep.2021.109252. [DOI] [PubMed] [Google Scholar]
- 75.Ronchi JA, Figueira TR, Ravagnani FG, Oliveira HCF, Vercesi AE, and Castilho RF (2013). A spontaneous mutation in the nicotinamide nucleotide transhydrogenase gene of C57BL/6J mice results in mitochondrial redox abnormalities. Free Radic Biol Med 63, 446–456. 10.1016/J.FREERADBIOMED.2013.05.049. [DOI] [PubMed] [Google Scholar]
- 76.Quigley JG, Yang Z, Worthington MT, Phillips JD, Sabo KM, Sabath DE, Berg CL, Sassa S, Wood BL, and Abkowitz JL (2004). Identification of a Human Heme Exporter that Is Essential for Erythropoiesis. Cell 118, 757–766. 10.1016/J.CELL.2004.08.014. [DOI] [PubMed] [Google Scholar]
- 77.Pino LK, Searle BC, Bollinger JG, Nunn B, MacLean B, and MacCoss MJ (2020). The Skyline ecosystem: Informatics for quantitative mass spectrometry proteomics. Mass Spectrom Rev 39, 229–244. 10.1002/MAS.21540. [DOI] [PMC free article] [PubMed] [Google Scholar]
- 78.Tyanova S, Temu T, Sinitcyn P, Carlson A, Hein MY, Geiger T, Mann M, and Cox J (2016). The Perseus computational platform for comprehensive analysis of (prote)omics data. Nature Methods 2016 13:9 13, 731–740. 10.1038/nmeth.3901. [DOI] [PubMed] [Google Scholar]
- 79.Patro R, Duggal G, Love MI, Irizarry RA, and Kingsford C (2017). Salmon provides fast and bias-aware quantification of transcript expression. Nature Methods 2017 14:4 14, 417–419. 10.1038/nmeth.4197. [DOI] [PMC free article] [PubMed] [Google Scholar]
- 80.Love MI, Huber W, and Anders S (2014). Moderated estimation of fold change and dispersion for RNA-seq data with DESeq2. Genome Biol 15, 1–21. 10.1186/S13059-014-0550-8/FIGURES/9. [DOI] [PMC free article] [PubMed] [Google Scholar]
- 81.Korotkevich G, Sukhov V, Budin N, Shpak B, Artyomov MN, and Sergushichev A (2021). Fast gene set enrichment analysis. bioRxiv, 060012. 10.1101/060012. [DOI] [Google Scholar]
- 82.Moscheni C, Malucelli E, Castiglioni S, Procopio A, de Palma C, Sorrentino A, Sartori P, Locatelli L, Pereiro E, Maier JA, et al. (2019). 3D Quantitative and Ultrastructural Analysis of Mitochondria in a Model of Doxorubicin Sensitive and Resistant Human Colon Carcinoma Cells. Cancers 2019, Vol. 11, Page 1254 11, 1254. 10.3390/CANCERS11091254. [DOI] [PMC free article] [PubMed] [Google Scholar]
- 83.Gomes LC, Benedetto G di, and Scorrano L (2011). During autophagy mitochondria elongate, are spared from degradation and sustain cell viability. Nature Cell Biology 2011 13:5 13, 589–598. 10.1038/ncb2220. [DOI] [PMC free article] [PubMed] [Google Scholar]
- 84.Garcia-Bermudez J, Baudrier L, Bayraktar EC, Shen Y, La K, Guarecuco R, Yucel B, Fiore D, Tavora B, Freinkman E, et al. (2019). Squalene accumulation in cholesterol auxotrophic lymphomas prevents oxidative cell death. Nature 2019 567:7746 567, 118–122. 10.1038/s41586-019-0945-5. [DOI] [PMC free article] [PubMed] [Google Scholar]
- 85.Elmore SA, Cochran RZ, Bolon B, Lubeck B, Mahler B, Sabio D, and Ward JM (2022). Histology Atlas of the Developing Mouse Placenta. Toxicol Pathol 50, 60–117. 10.1177/01926233211042270/ASSET/IMAGES/LARGE/10.1177_01926233211042270-FIG2.JPEG. [DOI] [PMC free article] [PubMed] [Google Scholar]
- 86.Wang Y, Yen FS, Zhu XG, Timson RC, Weber R, Xing C, Liu Y, Allwein B, Luo H, Yeh HW, et al. (2021). SLC25A39 is necessary for mitochondrial glutathione import in mammalian cells. Nature 2021, 1–5. 10.1038/s41586-021-04025-w. [DOI] [PMC free article] [PubMed] [Google Scholar]
- 87.Mercurio S., Petrillo S., Chiabrando D., Bassi ZI., Gays D., Camporeale A., Vacaru A., Miniscalco B., Valperga G., Silengo L., et al. (2015). The heme exporter Flvcr1 regulates expansion and differentiation of committed erythroid progenitors by controlling intracellular heme accumulation. Haematologica 100, 720–729. 10.3324/HAEMATOL.2014.114488. [DOI] [PMC free article] [PubMed] [Google Scholar]
- 88.Byon JCH, Chen J, Doty RT, and Abkowitz JL (2013). FLVCR is necessary for erythroid maturation, may contribute to platelet maturation, but is dispensable for normal hematopoietic stem cell function. Blood 122, 2903–2910. 10.1182/BLOOD-2012-10-465104. [DOI] [PMC free article] [PubMed] [Google Scholar]
- 89.Vinchi F, Ingoglia G, Chiabrando D, Mercurio S, Turco E, Silengo L, Altruda F, and Tolosano E (2014). Heme Exporter FLVCR1a Regulates Heme Synthesis and Degradation and Controls Activity of Cytochromes P450. Gastroenterology 146, 1325–1338. 10.1053/J.GASTRO.2014.01.053. [DOI] [PMC free article] [PubMed] [Google Scholar]
- 90.Fiorito V, Forni M, Silengo L, Altruda F, and Tolosano E (2015). Crucial role of FLVCR1a in the maintenance of intestinal heme homeostasis. Antioxid Redox Signal 23, 1410–1423. 10.1089/ARS.2014.6216/ASSET/IMAGES/LARGE/FIGURE7.JPEG. [DOI] [PubMed] [Google Scholar]
- 91.Petrillo S, de Giorgio F, Bertino F, Garello F, Bitonto v, Longo DL, Mercurio S, Ammirata G, Allocco AL, Fiorito v, et al. (2023). Endothelial cells require functional FLVCR1a during developmental and adult angiogenesis. Angiogenesis 2023 1, 1–20. 10.1007/S10456-023-09865-W. [DOI] [PMC free article] [PubMed] [Google Scholar]
- 92.Aguet F, Barbeira AN, Bonazzola R, Brown A, Castel SE, Jo B, Kasela S, Kim-Hellmuth S, Liang Y, Oliva M, et al. (2020). The GTEx Consortium atlas of genetic regulatory effects across human tissues. Science (1979) 369, 1318–1330. 10.1126/SCIENCE.AAZ1776/SUPPL_FILE/AAZ1776_TABLESS10-S16.XLSX. [DOI] [PMC free article] [PubMed] [Google Scholar]
- 93.Gamazon ER, Segrè A. v., van de Bunt M, Wen X, Xi HS, Hormozdiari F, Ongen H, Konkashbaev A, Derks EM, Aguet F, et al. (2018). Using an atlas of gene regulation across 44 human tissues to inform complex disease- and trait-associated variation. Nature Genetics 2018 50:7 50, 956–967. 10.1038/s41588-018-0154-4. [DOI] [PMC free article] [PubMed] [Google Scholar]
Associated Data
This section collects any data citations, data availability statements, or supplementary materials included in this article.
Supplementary Materials
Table S1. Oligonucleotide Sequences Related to STAR Methods.
Data S1. Unprocessed data underlying the display items in the manuscript, related to Figures 1–6 and S1–7.
Data Availability Statement
Uncropped western blots and all data used to generate display items in this manuscript are available in Data S1. Proteomics data have been deposited at Proteomics Identifications Database (PRIDE) and are publicly available as of the date of publication. Accession numbers are listed in the key resources table. RNAseq data have been deposited at Gene Expression Omnibus (GEO) and are publicly available as of the date of publication. Accession numbers are listed in the key resources table.
All original code is available in this paper’s supplemental information.
Any additional information required to reanalyze the data reported in this paper is available from the lead contact upon request.
KEY RESOURCES TABLE
| REAGENT or RESOURCE | SOURCE | IDENTIFIER |
|---|---|---|
| Antibodies | ||
| ATF4 | Cell Signaling Technology | Cat#11815S; RRID: AB_2616025 |
| CHOP | Cell Signaling Technology | Cat##2895S; RRID: AB_2089254 |
| GAPDH | GeneTex | Cat# GTX627408; RRID: AB_11174761 |
| Calreticulin | Cell Signaling Technology | Cat#12238P; RRID: AB_2688013 |
| LAMP1 | Cell Signaling Technology | Cat#9091P; RRID: AB_2687579 |
| COXIV | Cell Signaling Technology | Cat#4850S; RRID: AB_2085424 |
| Beta Tubulin | GeneTex | Cat# GTX101279; RRID: AB_1952434 |
| Beta Actin | GeneTex | Cat#GTX109639; RRID: AB_1949572 |
| Vinculin | Cell Signaling Technology | Cat#4650S; RRID: AB_10559207 |
| CHKA | Cell Signaling Technology | Cat#13422S; RRID: AB_2798216 |
| CDIPT | GeneTex | Cat#GTX80599; RRID: AB_11166614 |
| PCYT1A | Sigma-Aldrich | Cat#HPA035428; RRID: AB_10602045 |
| HMOX1 | Proteintech | Cat#10701–1-AP; RRID: AB_2118685 |
| FTH1 | Cell Signaling Technology | Cat#4393S; RRID: AB_11217441 |
| FLVCR1 | Santa Cruz Biotechnology |
Cat#sc-390100 |
| NDUFS1 | Proteintech | Cat#12444–1-AP; RRID: AB_2282657 |
| OPA1 | BD Biosciences | Cat#612606; RRID: AB_399888 |
| MRPS35 | Proteintech | Cat#16457–1-AP; RRID: AB_2146521 |
| SLC44A1 | ABclonal | Cat#A15413; RRID: AB_2762321 |
| CHT1/SLC5A7 | Santa Cruz Biotechnology |
Cat#33713; RRID: AB_2189835 |
| Citrate Synthase | Cell Signaling Technology | Cat#14309; RRID: AB_2665545 |
| FLAG | Sigma-Aldrich | Cat#F1804; RRID: AB_262044 |
| Anti-Mouse IgG-HRP | Cell Signaling Technology | Cat#7076; RRID: AB_330924 |
| Anti-Rabbit IgG-HRP | Cell Signaling Technology | Cat#7074; RRID: AB_2099233 |
| AlexaFluor 568 Anti-Mouse | Invitrogen | Cat#A10037; RRID: AB_2534013 |
| AlexaFluor 488 Anti-Rabbit | Invitrogen | Cat#A21206; AB_2535792 |
| Bacterial and virus strains | ||
| NEB Stable Competent E. coli | New England Biolabs | Cat#C3040 |
| Biological samples | ||
| Chemicals, peptides, and recombinant proteins | ||
| RPMI 1640 Culture Media | Gibco | Cat#11875–093 |
| Fetal Bovine Serum | Sigma-Aldrich | Cat#12306C |
| Penicillin Streptomycin | Gibco | Cat#15140–122 |
| Trypsin | Gibco | Cat#25200 |
| RPMI 1640 Culture Medium w/o L-Glutamine, L-Methionine, Choline Chloride, Folic Acid and Vitamin B12 |
US Biological Life Sciences | Cat#R8999–21 |
| L-glutamine | Alfa Aesar | Cat#J60573 |
| L-methionine | Alfa Aesar | Cat#J61904 |
| Choline Chloride | MP Biomedicals | Cat#101386 |
| Folic Acid | Alfa Aesar | Cat#J62937 |
| Vitamin B12 | Alfa Aesar | Cat#A14894 |
| Dialyzed Fetal Bovine Serum | Gibco | Cat#26400–044 |
| Phosphocholine chloride calcium salt tetrahydrate | Sigma-Aldrich | Cat#P0378 |
| RSM932A | Cayman Chemical | Cat#215518 |
| Tunicamycin | Tocris | Cat#3516 |
| Oligomycin | Millipore | Cat#495455 |
| Hemin | Sigma-Aldrich | Cat#H9039 |
| FCCP | BioVision | Cat#2398 |
| Succinylacetone | Cayman Chemical | Cat#24401 |
| Hemicholinium-3 | Sigma-Aldrich | Cat#H108 |
| Zinc (II) Mesophoryrin IX (ZnMP) | Frontier Scientific | Cat#M40628 |
| Ammonium Iron (III) Citrate (FAC) | Sigma-Aldrich | Cat#F5879 |
| BsmBI-v2 | New England Biolabs | Cat#R0739L |
| BamHI-HF | New England Biolabs | Cat#R3136L |
| NotI-HF | New England Biolabs | Cat#3189L |
| Gibson Assembly Master Mix | New England Biolabs | Cat#E2611L |
| T4 Ligase | New England Biolabs | Cat#M0202 |
| X-tremeGENE 9 DNA Transfection Reagent | Roche | Cat#6364787001 |
| Polybrene | Sigma-Aldrich | Cat#H9268 |
| Puromycin | Sigma-Aldrich | Cat#P8833 |
| Blasticidin | Invivogen | Cat#ant-bl-1 |
| Protease Inhibitor | EMD Millipore | Cat#535140 |
| Protease Inhibitor | Sigma-Aldrich | Cat#11836170001 |
| Phosphatase Inhibitor | Roche | Cat#490685001 |
| Poly-D-Lysine | ChemCruz | Cat#sc-136156 |
| LipidTOX Deep Red | Invitrogen | Cat#H34477 |
| Prolong Gold Antifade Mountant | Invitrogen | Cat#P10144 |
| ECL Chemiluminescence | Perkin Elmer | Cat#NEL105001EA |
| ECL Chemiluminescence | Cytiva | Cat#RPN2232 |
| Donkey Serum | Jackson ImmunoResearch |
Cat##017–000-12 |
| Tetramethylrhodamine, methyl ester, perchlorate (TMRM) | Invitrogen | Cat#T668 |
| [1,2-13C2]Choline Chloride | Cambridge Isotope Laboratories | Cat#CLM-548.01 |
| Heavy Labeled Amino Acid Internal Standards | Cambridge Isotope Laboratories | Cat#MSK-A2–1.2 |
| HPLC Grade Water | Fisher Scientific | Cat#W6 |
| HPLC Grade Methanol | Fisher Scientific | Cat#A454–1 |
| HPLC Grade Acetonitrile | Fisher Scientific | Cat#A955–1 |
| [Methyl-3H]-Choline Chloride | Perkin Elmer | Cat#NET109001MC |
| Insta-Gel Plus Scintillation Cocktail | Perkin Elmer | Cat#601339 |
| Krebs-Ringer Buffer | Alfa Aesar | Cat#J67795 |
| Pierce Anti-HA Magnetic Beads | Thermo Scientific | Cat#88837 |
| Modified Davidson’s Fixative | Electron Microscopy Sciences | Cat#64133–50 |
| Critical commercial assays | ||
| Pierce BCA Protein Assay Kit | Thermo Fisher Scientific |
Cat#23227 |
| Choline Kinase Assay Kit | Abcam | Cat#ab239729 |
| RNeasy Mini Kit | Qiagen | Cat#74104 |
| TruSeq Stranded mRNA Library Prep | Illumina | Cat#20020595 |
| CellTiter-Glo Luminescent Cell Viability Assay | Promega | Cat#G7571 |
| DNeasy Blood & Tissue Kit | Qiagen | Cat#69506 |
| Deposited data | ||
| RNAseq | GEO | Accession #:GSE228126 |
| MitoIP TMT Proteomics | PRIDE | Accession #:1–20230329-151157 |
| Uncropped western blots and raw values used to generate all graphs | This Paper | Data S1 – Source Data |
| Experimental models: Cell lines | ||
| HeLa | ATCC | CCL-2 |
| HEK293T | ATCC | CRL-1573 |
| Experimental models: Organisms/strains | ||
| Mouse: C57BL/6JSmoc-Flvcr1em1Smoc | Dr. Janis Abkowitz (University of Washington)9 |
N/A |
| Oligonucleotides | ||
| sgRNA, cDNA, and Genotyping Oligonucleotides | This Study | See Table S1 |
| Recombinant DNA | ||
| plentiCRISPR-v2 puro | Addgene | Cat#982990 |
| plentiCRISPR-v1 GFP | Addgene | Cat#75159 |
| pMXS-IRES-Blast | Cell Biolabs | Cat#RTV-016 |
| pMXS-3xHA-OMP25-mCherry | 42 | N/A |
| pMXS-3xMyc-OMP25-mCherry | 42 | |
| pLV-EF1a-RFP | Dr. Navdeep Chandel (Northwestern University)46 |
N/A |
| pLV-EF1a-RFP-AOX | Dr. Navdeep Chandel (Northwestern University)46 |
N/A |
| plentiCRISPR-v1 GFP FLVCR1_sg5 | This Study | N/A |
| plentiCRISPR-v2 Puro FLVCR1_sg5 | This Study | N/A |
| plentiCRISPR-v2 Puro CHKA_sg2 | This Study | N/A |
| plentiCRISPR-v2 Puro KIAA0141/DELE1_sg1 | This Study | N/A |
| plentiCRISPR-v2 Puro KIAA0141/DELE1_sg2 | This Study | N/A |
| plentiCRISPR-v2 Puro EIF2AK3/PERK_sgRNA | This Study | N/A |
| plentiCRISPR-v2 Puro EIF2AK2/PKR_sgRNA | This Study | N/A |
| plentiCRISPR-v2 Puro GCN2_sgRNA | This Study | N/A |
| plentiCRISPR-v2 Puro EIF2AK1/HRI_sgRNA | This Study | N/A |
| plentiCRISPR-v2 Puro SPNS1_sg1 | This Study | N/A |
| plentiCRISPR-v2 Puro SPNS1_sg2 | This Study | N/A |
| pMXS-IRES-Blast FLVCR1/FLVCR1a | This Study | N/A |
| pMXS-IRES-Blast FLVCR1b | This Study | N/A |
| pMXS-IRES-Blast FLVCR2 | This Study | N/A |
| pMXS-IRES-Blast SLC44A1 | This Study | N/A |
| pMXS-IRES-Blast SLC5A7 | This Study | N/A |
| pMXS-IRES-Blast CHKA | This Study | N/A |
| pMXS-IRES-Blast CG1358 | This Study | N/A |
| Human CRISPR Metabolic Gene Knockout Library | Addgene | Cat#110066 |
| Software and algorithms | ||
| FCS Express 7 | DeNovo Software |
https://denovosoftware.com/; RRID: SCR_016431 |
| Skyline Daily v22 | MacCoss Lab |
https://skyline.ms/project/home/software/Skyline/begin.view; RRID: SCR_014080 |
| Prism 8 | GraphPad |
https://www.graphpad.com/scientificsoftware/prism; RRID: SCR_002798 |
| XCaliburQual Browser 2.2 | Thermo Scientific | https://www.thermofisher.com/order/catalog/product/OPTON-30965#/OPTON-30965; RRID: SCR_014593 |
| LipidSearch 4.2 | Thermo Fisher Scientific / Mitsui Knowledge Industries |
https://www.thermofisher.com/order/catalog/product/OPTON-30879?SID=srchsrp-OPTON-30879; |
| Proteome Discoverer v 2.5 | Thermo Fisher Scientific | https://www.thermofisher.com/order/catalog/product/OPTON-31041?SID=srch-hj-OPTON-31041 |
| Other | ||
| Z2 Coulter Counter | Beckman | Model Z2 |
| SpectraMax Microplate Reader | Molecular Devices | Model M3 |
| Primovert Microscope | Carl Zeiss | 415510-1105-000 |
| Multiphoton Microscope with Confocal Modality | Nikon | A1R MP |
| Tecnai G2-12 Transmission Electron Microscope with AMT BioSprint29 Digital Camera | FEI | G2-12 |
| FACSAriaII | BD Biosciences | 643181 |
| Attune NxT Flow Cytometer | Invitrogen | N/A |
| Bead Ruptor 24 | Omni International | N/A |
| Dionex UltiMate 3000 UPLC System | Thermo Fisher Scientific | N/A |
| Tri-Carb 2910 TR Scintillation Counter | Perkin Elmer | N/A |
| PicoLab Rodent Diet | PicoLab | Cat#5053; See Data S1 for composition |
| Choline Supplemented (20g/kg) Iron-Supplemented L-AA defined Rodent Diet | Dyets | Cat#519586; See Data S1 for composition |
| Choline Sufficient (14.48g/kg) Iron-Supplemented L-AA defined Rodent Diet | Dyets | Cat#518754; See Data S1 for composition |