

Abstract
Multiple myeloma (MM) is a cancer of malignant plasma cells in the bone marrow and extramedullary sites. We previously characterized a VQ model for human high-risk MM. The various VQ lines display different disease phenotypes and survival rates, suggesting significant intra-model variation. Here, we use whole exome sequencing and copy number variation (CNV) analysis coupled with RNA-Seq to stratify the VQ lines into corresponding clusters: Group A cells had monosomy chromosome (chr) 5 and overexpressed genes and pathways associated with sensitivity to bortezomib (Btz) treatment in human MM patients. By contrast, Group B VQ cells carried recurrent amplification (Amp) of chr3 and displayed high-risk MM features, including downregulation of Fam46c, upregulation of cancer growth pathways associated with functional high-risk MM, and expression of Amp1q and high-risk UAMS-70 and EMC-92 gene signatures. Consistently, in sharp contrast to Group A VQ cells that showed short-term response to Btz, Group B VQ cells were de novo resistant to Btz in vivo. Our study highlights Group B VQ lines as highly representative of the human MM subset with ultrahigh risk.
Keywords: multiple myeloma, VQ model, high-risk multiple myeloma, genomic and transcriptional profiling, drug resistance
Introduction
Multiple myeloma (MM) is a malignancy of terminally differentiated plasma cells (PCs) that primarily grow in the bone marrow (BM) [1]. MM arises from the pre-malignant condition monoclonal gammopathy of undetermined significance (MGUS), in which the accumulation of chromosomal copy number variations (CNVs), primary translocations, and somatic mutations leads to the expansion of a clonal PC population. The molecular heterogeneity is further increased in MM by acquiring secondary CNVs and point mutations and a greatly altered landscape of DNA methylation compared to healthy PCs [2].
It is estimated that 15–20% of newly diagnosed MM (ndMM) display high-risk features and have a poor response to current treatment options [3, 4]. Genetic events, such as CNVs and translocations, play a significant role in high-risk MM (hrMM) stratification [5, 6]. These events include t(4;14), t(14;16), t(14;20), del17p13, and gain/amplification of chromosome 1q. Amplification (≥4 copies) of 1q (Amp1q) is an hrMM prognostic marker [7] and associated with upregulation of PBX1-FOXM1 axis [8], while gain of a single copy 1q is considered high risk when combined with a second hrMM chromosomal abnormality [9]. In addition, two independent and largely non-overlapping hrMM gene signatures have been validated: UAMS-70 [10] and EMC-92 or SKY92 [11].
Within the hrMM group with genomic alterations, an ultra hrMM subgroup was identified as double-hit MM with either biallelic TP53 inactivation or Amp1q in International Staging System (ISS) stage III [12]. In the recent MASTER trial, ultra hrMM patients, defined as patients with ≥2 high-risk cytogenetic abnormalities (considered as part of double-hit MM), relapsed quickly after discontinuation of therapy even following attainment of very deep responses with novel therapies and stem cell transplant [13]. Using this definition, both GRIFFIN and MASTER studies showed that the ultra hrMM patients had much shorter overall and progression-free survival than patients with 0 or 1 high-risk cytogenetic abnormality (ASH meeting Abstract # 4557, 2022). Recently, another group of ultra hrMM patients, who did not have hrMM-associated genomic alterations but were refractory to induction therapy or had early relapse within 12 months, are defined as functional hrMM [14]. They had an overall worse prognosis than genetically defined hrMM. It is becoming abundantly clear that novel approaches are required for treating hrMM, particularly ultra hrMM (double-hit MM or functional hrMM).
Murine models of MM play an essential role in dissecting mechanisms of disease growth [15] and as pre-clinical platforms for testing new anti-MM therapies [16]. The genetic basis for MM models ranges from the forced overexpression of a single MM-related oncogene such as the Eµ-MAF model [17], transgenic models in which oncogene overexpression is activated through plasma cell maturation as in the Vĸ*MYC model [18], or spontaneous MM development owing to genetic inbreeding as in the 5TMM family of myeloma models [19, 20]. Due to the heterogeneous genetic origins of human MM and the downstream pathological and therapeutic consequences, genomic characterization of these murine myeloma cells is necessary to establish what sub-type of MM they best model. Genetic landscape characterization of the 5TMM models has shown notable genomic differences between different lines, with the 5T2 line showing CNVs syntenic for gain(1q) MM whereas the 5T33 and 5TGM1 lines show CNVs syntenic for del(13q) [21]. Within transgenic MM models some chromosomal variability is also observed: CNV analysis of both primary and transplantable Vĸ*MYC showed that about 50% of sequenced lines had monosomy 5, and within these mice half additionally had monosomy 14, including a region syntenic to del(13) in human MM [22]. Further analysis of monosomy 14 Vĸ*MYC lines identified loss of the region containing the cell-cycle regulating miRNA cluster MIR15A/16–1 as driving MM progression in the Vĸ*MYC model and as a potential mechanism to explain del(13) as an early initiating CNV in the transition from MGUS to MM [23].
Previously, we developed and characterized a mouse model of MM driven by both the Vĸ*MYC transgene and oncogenic NRasLSL-Q61R inducible via IgG1-Cre [24]. This so-called VQ model shows characteristics representative of hrMM, as it is highly proliferative, develops extramedullary disease, and is enriched for the UAMS-70 high-risk gene signature compared to control PCs. In our initial study, five lines of VQ myeloma were isolated from primary mice (VQ-D1 through VQ-D5). In four of these VQ lines (VQ-D1, D2, D4, and D5), we established survival of recipient mice transplanted with donor VQ cells and carried out bulk RNA-Seq analysis. Finally, we established two VQ cell lines from two VQ-D2 recipients, termed VQ 4935 and 4938. Further drug testing of the VQ model also showed de novo resistance to the BCL-2 inhibitor venetoclax in the VQ cell lines, as well as reduced responses to the proteasome-inhibitors (PIs) bortezomib and carfilzomib in VQ-D1 recipient mice in vivo [25]. Although all VQ cells are driven by MYC dysregulation and RAS hyperactivation, different lines display distinct patterns of extramedullary disease, antibody sub-type, and survival (Figure 1A). The genetic and/or transcriptional bases for these phenotypic differences remain elusive. Additionally, what subtypes of hrMM they may individually represent (if any) are unknown. In the current study, we aim to address these questions through the molecular characterization of five VQ lines using B cell receptor (BCR) repertoire sequencing, whole exome sequencing, CNV analysis, and RNA-Seq.
Figure 1. B cell receptor repertoire analysis shows dominant clonality and low somatic hypermutation (SHM) rates in primary VQ cells and VQ cell lines.
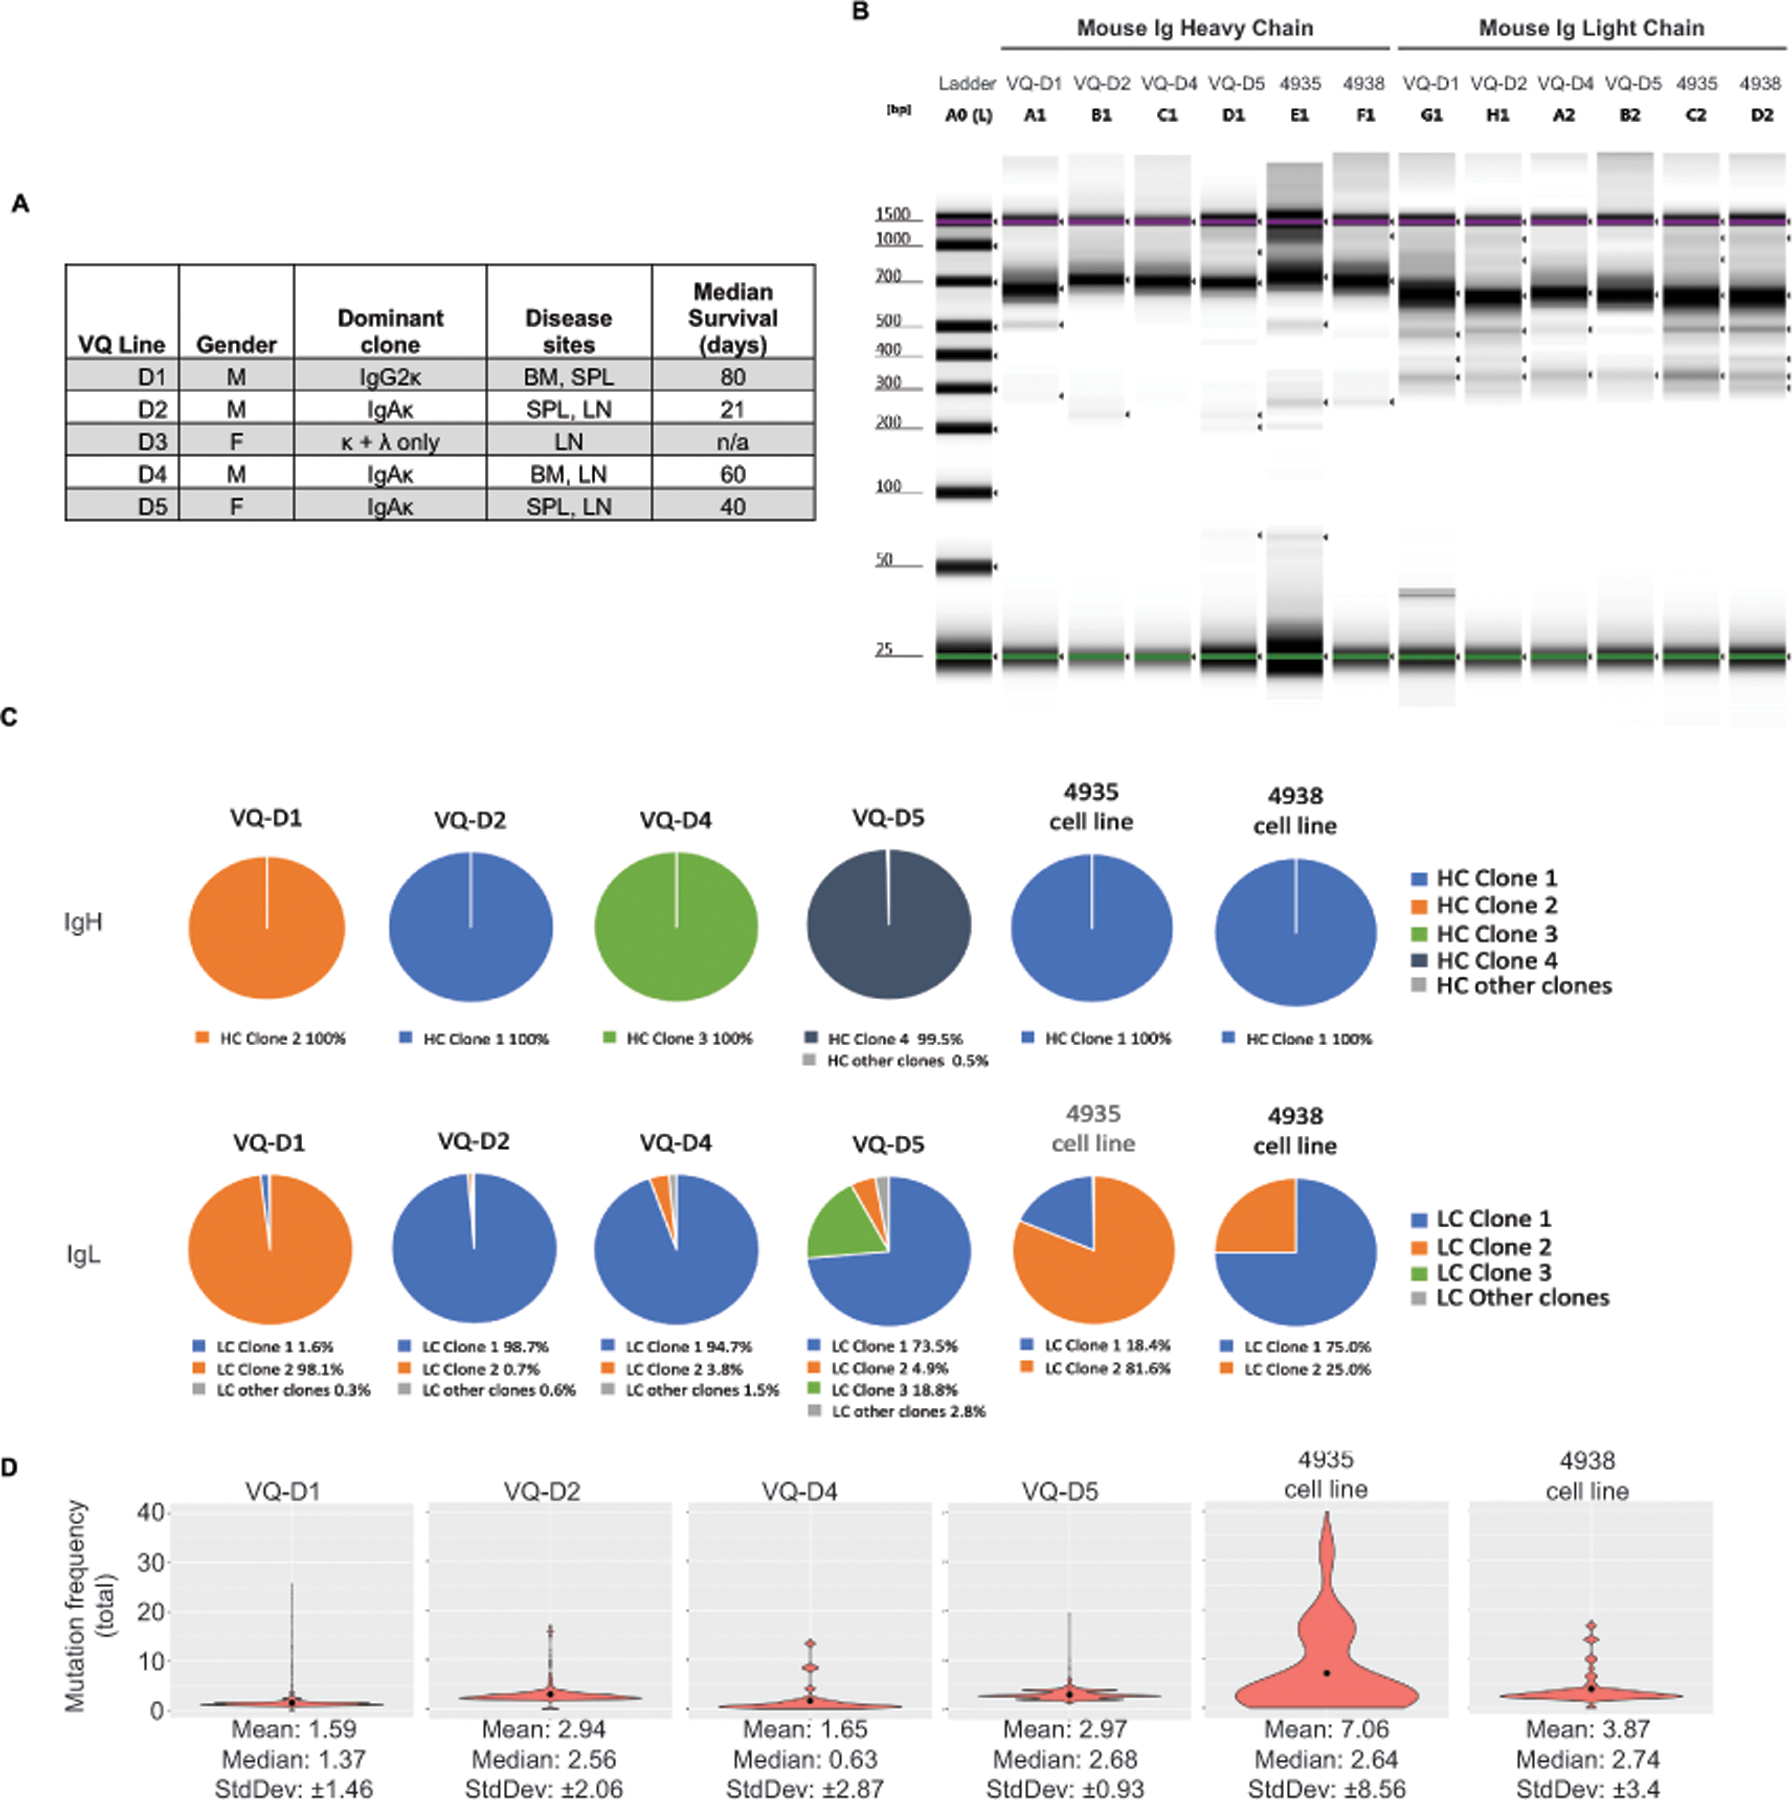
(A) Table summarizing previously established characteristics of VQ donor lines. (B-D) B cell receptor heavy-chain and light-chain repertoire analysis was carried out as described in Methods. (B) Tapestation image showing immunoglobulin heavy chain and light chain library amplification for samples in panels C and D. (C) Pie charts depicting clonal frequency for immunoglobulin heavy chain (IgH) sequences (top) and immunoglobulin light chain sequences (bottom) sequences from primary VQ cells (VQ-D1, D2, D4, and D5) and from VQ-D2 derived cell lines (4935 and 4938). (D) Violin plots showing mean (black dots) and distribution of the total somatic hypermutation frequencies across B-cell IgH sequences from primary VQ cells (VQ-D1, D2, D4, and D5) and from VQ-D2 derived cell lines (4935 and 4938).
Materials and Methods
Whole exome sequencing
Genomic DNA was extracted from CD138+ BM cells and tail tissues of moribund Vĸ*Myc; NrasLSL-Q61R/+; IgG1-Cre mice using Gentra Puregene Cell Kit (Qiagen). Whole-exome targeted capture was carried out using the SureSelect XT Mouse Exome Kit, 49.6 Mb (Cat# 5190–4641; Agilent Technologies). Exome capture, exome library amplification, and data analysis was carried out as described previously35.
Copy number variation analysis
Whole exome sequencing data was aligned to the mm10 reference genome using BWA MEM36. Copy number variation analysis was carried out using matched controls for each sample with the CNVkit Python library and command-line software toolkit to infer and visualize copy number from high-throughput DNA sequencing data as described37. Copy number calling was performed with default parameters, with the exception of increasing stringency through the use of -m clonal –purity 1 arguments.
Additional materials and methods are described in Supplemental Materials.
Data Availability Statement
The next-generation sequencing datasets generated and analyzed during the current study are available in the Sequence Read Archive (SRA) at https://www.ncbi.nlm.nih.gov/sra, with BioProject accession number PRJNA947112, and Gene Expression Omnibus (GEO) at https://www.ncbi.nlm.nih.gov/geo, with accession number GSE226833. The code and scripts for data analysis are deposited onto Github: https://github.com/BRIwanglab/Oncogene2023.
Results
B cell receptor repertoire sequencing shows low rates of somatic hypermutation in VQ myeloma
We previously characterized 4–5 VQ myeloma lines, which have distinct sites of MM growth (including the bone marrow, spleen, or lymph node) and dramatically different survival (Figure 1A) [24]. In addition, isotyping of serum antibody from 5 primary VQ mice revealed ubiquitous kappa light chain secretion, with the VQ-D3 line also secreting lambda light chain but no heavy chain (HC) (Figure 1A). All other lines (VQ-D1, D2, D4, and D5) characterized secreted IgA or IgG class-switched HC (Figure 1A), consistent with a post-germinal center derivation [26]. Germinal center B cells undergo somatic hypermutation (SHM) as part of the antibody affinity maturation process [27]. To assess SHM rates in the VQ model, we carried out high-throughput sequencing analysis of BCR repertoire [28] on four primary VQ donor lines (VQ-D1, D2, D4, and D5), as well as two cell lines derived from VQ-D2 recipient mice (4935 and 4938). Initial library preparation results showed BCR amplicons that were either clonal or oligoclonal with a dominant clone present in the four primary VQ lines (Figure 1B). Sequencing analysis showed monoclonal immunoglobulin heavy chain (IgH) sequences across all primary VQ lines as well as both cell lines (Figure 1C). In terms of immunoglobulin light chain (IgL) sequencing, VQ-D1, D2, and D4 cells showed near clonal IgL, with dominant IgL clones at a frequency of 95% or higher (Figure 1C). Meanwhile, VQ-D5 cells showed oligo-clonal IgL sequences, with three separate clones displaying a frequency of 5% or higher (Figure 1C). Although VQ 4935 and 4938 cell lines maintained clonal IgH similar to parental VQ-D2 cells, both cell lines developed a secondary IgL clone making up approximately 20–25% of sequences (Figure 1C). Interestingly, differences between IgL sequences in VQ cell lines and parental VQ-D2 cells showed clonal selection in vitro: the dominant IgL in the VQ 4935 cell line (clone 1) actually arose from a very minor clone in parental VQ-D2 cells with a frequency of only 0.7% (Figure 1C). This same IgL sequence was also present in VQ 4938 cells (clone 2) but did not become the dominant clone.
Subsequent BCR repertoire analysis of all VQ lines showed median SHM rates of IgH chains ≤3.0% (Figure 1D). This SHM frequency is comparable to levels in primary Vĸ*MYC mice, where a median frequency of 2.6% in IgH was observed [18], but significantly lower than studies in human MM patients, where median SHM rates of ~8–9% have been previously reported [29, 30]. Corroborating initial library preparation, the VQ 4935 cell line showed a higher mean in SHM (mean = 7.1) compared to other samples, which all had mean SHM of < 4 (Figure 1D). Despite this, median SHM for 4935 cells remained low at 2.64%, while both median and mean SHM rates in VQ 4938 cells were similar as those in parental VQ-D2 cells (Figure 1D). Altogether, BCR repertoire analysis shows that VQ myeloma is characterized by secretion of dominant antibody clones that underwent relatively little affinity maturation prior to BM trafficking.
Identification of recurrently mutated genes and associated pathways in VQ myeloma cells
Malignant transformation of the VQ model is driven by two common genetic events in human MM: MYC dysregulation and NRAS Q61R mutation. However, the prolonged disease latency and phenotypic heterogeneity across different VQ lines suggests the accumulation of additional driver mutations in VQ myeloma cells (Figure 1A). To identify additional mutations, we carried out whole exome sequencing (WES) of CD138+ cells from five VQ mice, as well as corresponding tail samples as germline controls. True mutations were defined as base changes with variant allele frequency (VAF) of >10% in CD138+ cells and <2.5% in matched tail samples. Overall, 11 genes were identified as being recurrently mutated in 2 or more VQ myeloma lines (Figure 2A).
Figure 2. Whole exome sequencing identifies recurrently mutated genes in VQ myeloma cells.
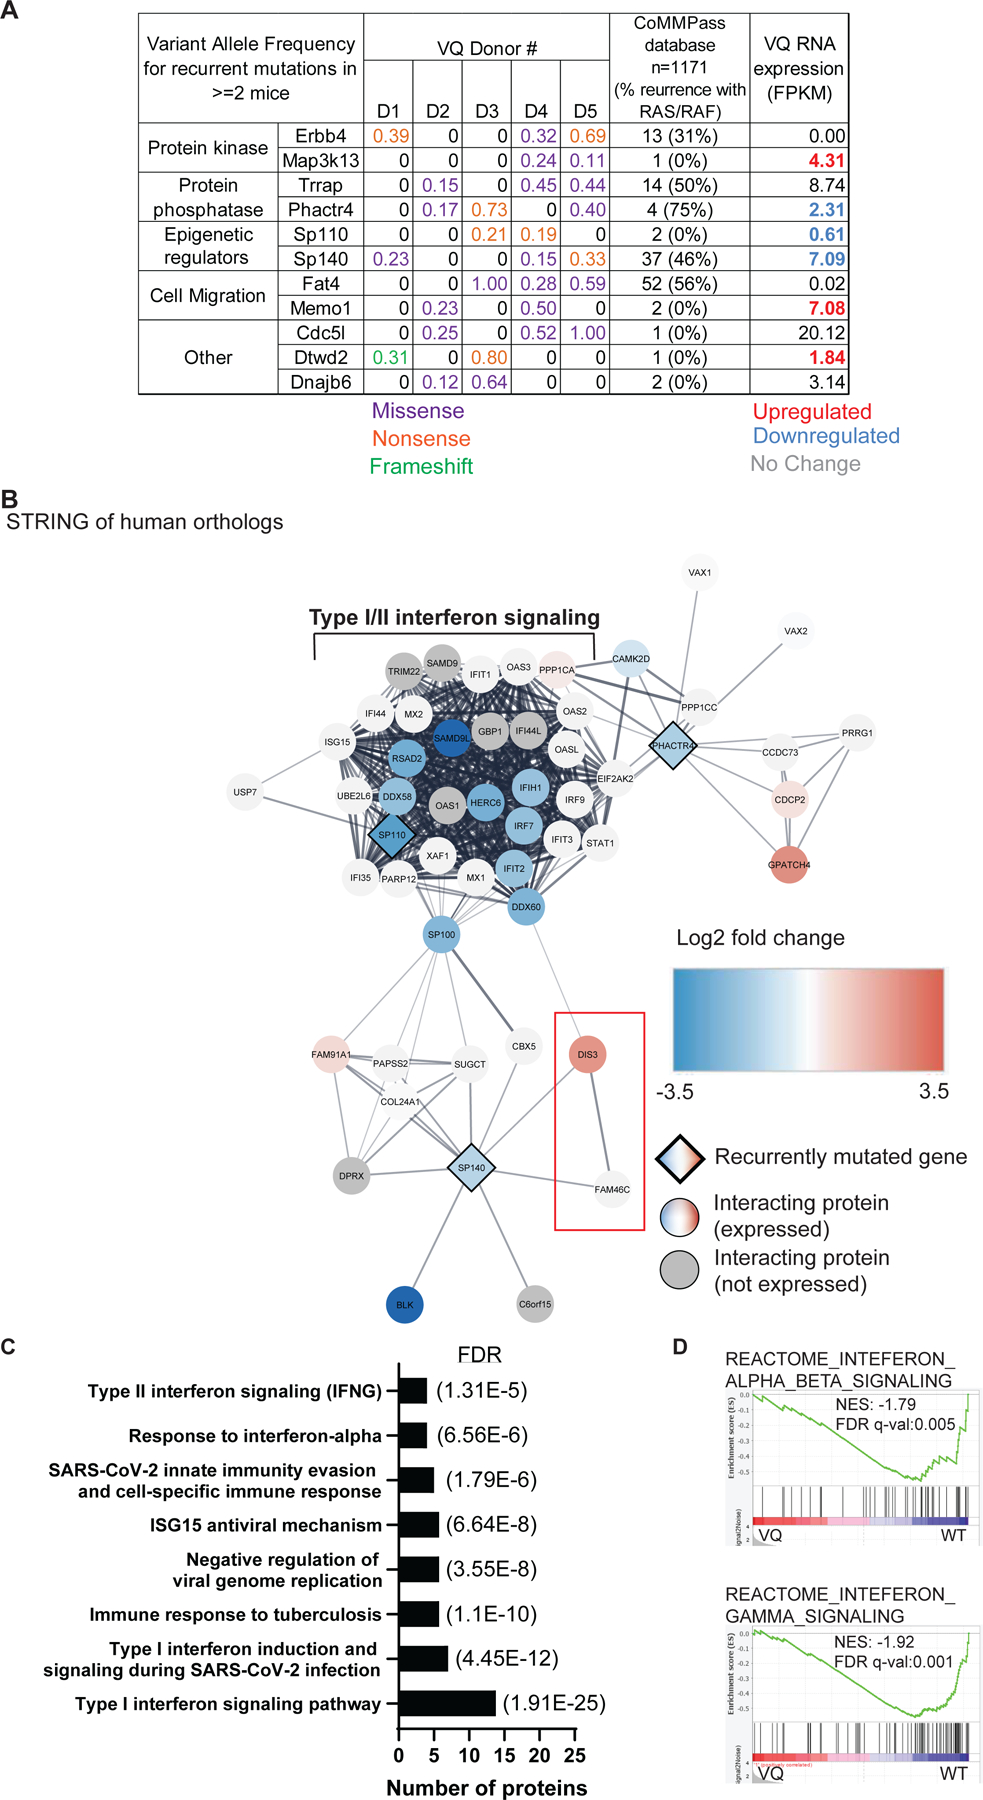
Five paired tail DNA (non-leukemia control) and genomic DNA from VQ CD138+ B220−plasma cells were subjected to whole exome sequencing as described in Materials and Methods. (A) Recurrently mutated genes (mutated in ≥ 2/4 mice) and their variant allele frequencies (VAF) in VQ cells, frequency of mutation in human orthologs as determined from a cohort of 1,171 MM patient samples from the CoMMPass database, and mRNA expression (as determined by Fragments Per Kilobase of gene per Million mapped reads FPKM) in VQ cells are shown. (B) Cytoscape-generated STRING network of recurrently mutated genes with decreased RNA expression, as well as 40 closest interacting proteins as determined by STRING analysis. Recurrently mutated genes are represented by diamonds. Interacting proteins are denoted by circles. Genes with differential expression are color-coded. (C) Select list of pathways enriched in genes highlighted in panel B. (D) GSEA of Reactome gene sets for interferon alpha/beta signaling (top) and interferon gamma signaling (bottom) between VQ and control plasma cells. NES, normalized enrichment score. FDR, false discovery rate.
To determine if these genes were recurrently mutated in human MM, mutation status of human orthologs was determined using the Multiple Myeloma Research Foundation (MMRF) CoMMPass database. Of the 11 genes, only SP140 and FAT4 were found to be mutated in >3% of patients Figure 2A), with 37 and 52 out of 1,171 patients, respectively. SP140 encodes a member of the speckled protein family of chromatin reader proteins [31], which is known to play a role in suppressing Type I interferon (IFN) signaling in both B cells [32] and macrophages [33]. Frequency of SP140 mutation ranges from 2.5–7.5% [34–37] and is found in all stages of MM development from newly diagnosed [34, 35] to drug-refractory [37] disease. FAT4 encodes a member of the protocadherin family previously identified as putative tumor suppressor gene in the context of breast [38] and colorectal cancers [39]. However, a role of FAT4 in MM pathogenesis has not been characterized. Frequency of FAT4 mutation was found in 2–12% of newly diagnosed patients [34, 36], but not significant relapsed refractory MM. Of note, SP140 and FAT4 mutations are not particularly enriched in MM patients with RAS/RAF pathway mutations as 44% of sequenced patients in the CoMMPass database carry mutations in NRAS, KRAS, or BRAF.
Next, we sought to determine expression of recurrently mutated genes and if their expression levels are altered in myeloma vs control PCs. We generated an expanded RNA-Seq dataset, which includes RNA-Seq analysis of MM cells isolated from multiple tissues from multiple recipient mice in each donor line. Minimum tissue differences were observed in Fragments Per Kilobase of transcript per Million mapped reads (FPKM) from the same mouse. We found that Erbb4 and Fat4 were not expressed in PCs (FPKM < 0.1) and 6 of the 11 recurrently mutated genes were differentially expressed in BM VQ cells compared to control PCs (Figure 2A, far right column). Among them, Map3k13, Memo1, and Dtwd2 were upregulated, while Phactr4, Sp110, and Sp140 were downregulated in VQ myeloma cells. Interestingly, none of these genes have previously been characterized in the context of MM. To determine the potential pathways affected by their dysregulation in the VQ model, we used the Cytoscape network analysis package [40] to create a protein interaction map using human orthologs of the six recurrently mutated and dysregulated genes, along with their 50 closest interacting proteins as determined by Search Tool for the Retrieval of Interacting Genes/Proteins (STRING) analysis [41] (Figure S1A). We further integrated our RNA-Seq data with the protein-protein interaction network (see Figure S1 legend at bottom right). Intriguingly, we noticed that most of the genes in this interaction network were downregulated at the transcriptional level in VQ cells. To improve the resolution of the interactome, we then focused on the proteins encoded by downregulated genes Phactr4, Sp110, and Sp140 and regenerated the STRING plot using the same parameters (Figure 2B). In addition to the Type I/II interferon (IFN) signaling node we identified previously (Figure S1A), DIS3 and FAM46C, two well-known MM suppressors [42, 43], emerged in the interactome. STRING functional enrichment of these proteins showed a significant association with both Type I and Type II IFN signaling, as well as immune responses to viral and tuberculosis infection (Figure 2C). Corroborating these findings, gene set enrichment analysis (GSEA) of VQ MM cells showed downregulation of both Type I and Type II IFN signaling compared to control PCs (Figure 2D). To validate this result, we measured the level of pSTAT1, which is downstream of IFN signaling, using phospho-flow technology in CD138+ B220− PCs from control and VQ-D1 mice (Figure S1B). Indeed, the pSTAT1 level in VQ-D1 MM cells was much lower than that in control PCs. Altogether, our data suggests that interferon signaling is downregulated in VQ myeloma cells.
Copy number variation analysis stratifies VQ myeloma lines into two clusters based on recurrent amplification of chromosome 3 and monosomy of chromosome 5
CNVs are frequent in MM and play a well-established role in predicting patient prognosis [44]. Correspondingly, genetic characterization of the 5T and Vĸ*MYC transgenic mouse models also show a prevalence of CNVs in murine myeloma cells [21, 22]. We thus sought to carry out CNV analysis of the five VQ lines using our WES data. Amplification (amp) of chromosome (chr) 3 was observed in three of the five VQ lines (Group B: VQ-D2, VQ-D3, and VQ-D5) (Figure 3A), while monosomy of chr5 was observed in the other two lines (Group A: VQ-D1 and VQ-D4, Figure 3B). In addition, monosomy chr8, trisomy chr7, and trisomy chr15 were observed in VQ-D1, VQ-D3, and VQ-D4, respectively (Figure 3A–B). Similar CNVs have also been observed in other transgenic MM models: the 5T2 line of the 5T model shows both trisomy 3 and monosomy 5 [21], whereas monosomy 5 is observed in approximately 50% of primary Vĸ*MYC lines [22].
Figure 3. Copy number variation (CNV) analysis stratifies VQ cells based on recurrent amplification of chromosome 3 and monosomy chromosome 5.

(A-B) CNV analysis was performed using the whole exome sequencing data as described in Materials and Methods. Orange dots indicate significant changes in log2 copy ratio for a given call segment in plasma cells compared to non-leukemia control samples. Location and name of tumor suppressors and oncogenes related to myeloma pathogenesis are shown in red. CNV plots are grouped according to recurrent CNV status. (C-F) Transcript levels of Nras (C), Fam46c (D), Cdk6 and Cdk4 (E), and Mmset/Whsc1 (F) are shown in CD138+ B220− cells from control and VQ recipient mice. FPKM, Fragments Per Kilobase of transcript per Million mapped reads. One-way analysis of variance with Tukey’s post-test was performed. Tissue of origin for individual samples is denoted by legend. (G-H) CD45.1 recipient mice were sub-lethally irradiated and injected with bone marrow cells from moribund VQ-D1 donor mouse or splenocytes from moribund VQ-D2 donor mouse. Six weeks (VQ-D1) or two weeks (VQ-D2) post-transplant, mice were treated with vehicle or trametinib. (G) Serum protein electrophoresis was performed to quantify the γ-globulin/Albumin (G/A) ratios in VQ-D1 and VQ-D2 recipient mice at day 21 of treatment. Two-sided t-test was performed. (H) Kaplan-Meier survival curves were plotted against days after treatment. Log-rank test was performed. Note: VQ-D1 results are combined from historical [24, 25] and new data. ns, not significant. *, p<0.05. **, p<0.01. ***, p<0.001. ****, p<0.0001.
CNVs identified in the VQ model include several tumor suppressor genes and oncogenes that are highly relevant for MM pathogenesis (Figure 3A–B, highlighted in red). Notably, chr3 includes the proto-oncogene Nras, as well as Fam46c encoding a non-canonical poly(A) polymerase that is frequently mutated in MM and acts as a tumor suppressor for MM development [45, 46]. Chr5 includes Fgfr3 and Mmset, both of which are overexpressed in t(4;14) MM patients [47], and cyclin-dependent kinase 6 (Cdk6) that was recently found to be over-expressed in immunomodulatory drug-resistant MM cells [48]. Finally, chr15 includes the transcription factor Myc. As we previously reported [24], in the presence of human MYC transgene, mouse Myc transcript was almost undetectable in VQ MM cells.
We next wanted to determine if CNVs of the affected genes correlate to their transcriptional changes in VQ vs control PCs. Using the expanded RNA-Seq dataset, we observed an approximately two-fold increase in Nras expression in Group B (VQ-D2 and VQ-D5) cells with chr3 amplification compared to control and Group A VQ lines without chr3 amplification (Figure 3C). Interestingly, our WES and RNA-Seq data suggested a balanced amplification/overexpression of WT vs mutant Nras. The activation of downstream ERK1/2 and AKT signaling was indistinguishable between Group A and B MM cells (Figure S2). Despite chr3 amplification, expression of Fam46c was significantly lower in Group B cells compared to Group A and control PCs, suggesting an epigenetic mechanism involved in Fam46c downregulation (Figure 3D). In Group A (VQ-D1 and VQ-D4) cells with monosomy chr5, Cdk6 was nearly undetectable (average FPKM < 0.5), whereas VQ-D5 cells had a 3–5-fold decrease compared to VQ-D2 cells and control PCs (Figure 3E). Compared to control PCs, Cdk4 was upregulated in Group A and further elevated in Group B MM cells (Figure 3E). We previously reported absence of Fgfr3 expression in both control and VQ myeloma PCs [25]. Despite monosomy chr5, Mmset/Whsc1 expression in Group A MM cells was comparable to that in control PCs, whereas it was approximately two-fold higher in Group B cells (Figure 3F). Taken together, our data demonstrate that gene copy numbers do not necessarily correlate with mRNA levels in VQ cells, suggesting that additional epigenetic mechanisms play an important role in controlling gene expression.
We previously showed that daily treatment of trametinib (Tra), a potent MEK inhibitor, did not lower myeloma disease burden in VQ-D1 recipients as measured by the ratio of serum gamma-globulin to albumin (G/A) using serum protein electrophoresis (SPEP) (Figure 3G). However, it significantly prolonged the survival of diseased mice [24, 25] (Figure 3H). Here, we followed the same treatment schemes in VQ-D2 recipient mice as previously carried out in VQ-D1 mice (see Materials and Methods). Two weeks after VQ-D2 transplantation, recipients were divided into two groups with comparable CBC parameters and treated with vehicle (Veh) or Tra. Three weeks later, treatment efficacy was assessed via G/A ratio using SPEP assay. Of note, the much lower G/A ratios in VQ-D2 mice is consistent with their downregulation of Fam46c expression, which leads to downregulation of protein secretory pathway [43]. Daily Tra treatment provided a survival benefit to VQ-D2 recipients similar to what has been previously observed in VQ-D1 mice (Figure 3H).
Gene transcription-based clustering of VQ lines yields highly consistent result with the CNV study
Our CNV analysis separated VQ lines into two distinct clusters based on their characteristic genomic changes, which may cause consistent global transcriptional changes in VQ cells. To test this idea, we performed unsupervised hierarchical clustering analysis of all control and VQ samples based on the transcriptional profiles generated in RNA-Seq. Not surprisingly, these samples split into three groups: Group A with monosomy chr5 (VQ-D1 and VQ-D4), Group B with chr3 amplification (VQ-D2 and VQ-D5), and control PCs (Figure 4A). Further analysis of sample similarity via t-distributed stochastic neighbor embedding (tSNE) (Figure 4B) and principal component analysis (PCA) (Figure S3) confirmed that VQ myeloma lines cluster into two distinct transcriptional subtypes. This result was not affected by tissue origins of MM cells as similar clustering result was obtained when tissue effect was removed (Figure S4). More importantly, the transcriptional clusters mirror recurrent CNVs observed in these VQ lines.
Figure 4. RNA-Seq analysis reveals two distinct transcriptional clusters of VQ myeloma.

Bulk RNA-Seq analysis was performed using flow sorted CD138+ B220− CD45.2+ cells from bone marrow (BM) of control mice (n=3) and BM, spleen (SPL), lymph node (LN), or liver (Liv) of multiple VQ-D1, VQ-D2, VQ-D4, and VQ-D5 recipients. (A) Clustered heat map of RNA-seq gene count data. Samples are color-coded by tissue sites and VQ lines as indicated. (B) tSNE analysis of gene counts data of VQ myeloma samples. Samples are color-coded by VQ lines as in panel A. Tissue of origin for individual samples is denoted by legend.
Group B VQ cells display upregulation of growth pathways and high-risk myeloma gene signatures
We next sought to differentiate transcriptional activity between Group B and Group A VQ myeloma. RNA-Seq analysis identified 3,045 differentially expressed genes (P<0.05 and Fold Change≥2), 1,565 upregulated and 1,480 downregulated in Group A vs B MM cells (Figure 5A). As one of the major drivers of VQ MM, human MYC transgene expression was highest in VQ-D2, intermediate in VQ-D4 and VQ-D5, and lowest in VQ-D1 (Figure S5). MYC expression in all the VQ lines was higher than that in control PCs but lower than that in t-Vk12653 MM cells. GSEA of hallmark signaling pathways, oncogenic signatures, and relevant MM-related gene signatures showed numerous pathways significantly upregulated in Group B VQ cells, in particular cancer growth pathways (including E2F targets, G2M checkpoint, and MYC target pathways) that are associated with functional hrMM [14] (Figure 5B). Despite upregulation of Pbx1 and Foxm1 in Group A VQ MM cells vs control PCs (Figure 5C and 5D), they did not show enrichment of PBX1-FOXM1 gene signatures (Figure S6A), which associate with proliferation and drug resistance in Amp1q MM patients [8]. By contrast, Group B VQ MM showed downregulation of Fam46c (Figure 3D), upregulation of Foxm1 (Figure 5D), and enrichment of PBX1-FOXM1 axis over Group A VQ (Figure 5E and 5F), suggesting that Group B VQ MM may represent a more malignant MM [7, 8, 49].
Figure 5. VQ Group B myeloma cells have increased expression of cancer growth pathways and Amp1q-associated PBX1-FOXM1 gene signatures.
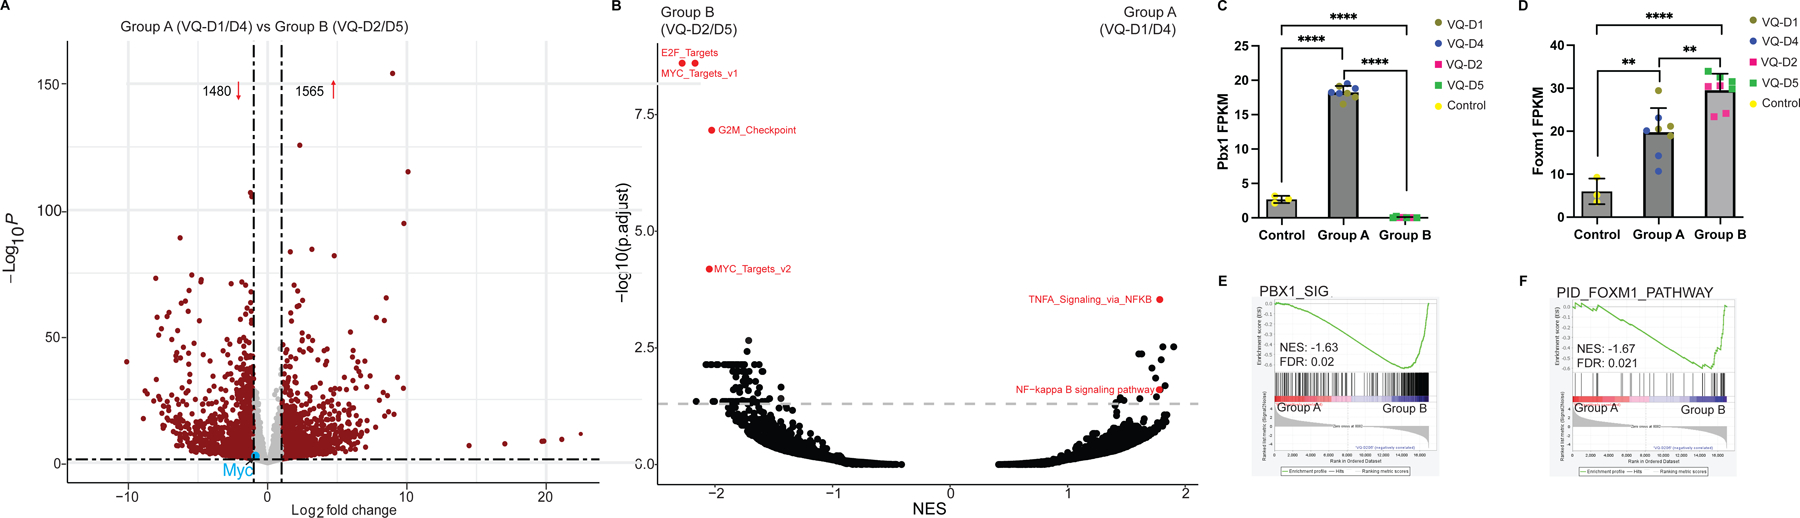
(A) Volcano plot of differentially expressed genes (red dots) in Group A (VQ-D1/D4) vs Group B (VQ-D2/D5). (B) Overview of gene set enrichment analysis between Group A (VQ-D1/D4) and Group B (VQ-D2/D5) myeloma cells. Relevant pathways are highlighted in red. (C, D) Transcript levels of Pbx1 (C) and Foxm1 (D) are shown in control and VQ Group A and B CD138+ B220− cells. (E, F) GSEA plots comparing Group A to Group B for (E) PBX1 and (F) FOXM1 gene signatures. NES, normalized enrichment score; FDR, false discovery rate; p. adj., adjusted P-value. **, p <0.01; ****, p <0.0001.
Because UAMS-70 hrMM gene signature is defined by deregulated expression of genes mapped to Chr 1 [10], it is not surprising that Group B VQ MM cells highly expressed the upregulated genes of this hrMM signature over Group A VQ and t-Vk12653 MM cells (Figure 6A and 6B), while the expression levels of the upregulated genes in UAMS-70 signature were indistinguishable between Group A VQ and t-Vk12653 MM cells (Figure S6B). Because EMC92 gene signature includes both positive and negative risk genes with different weights, we calculated the EMC-92 risk scores in Group A and B as well as t-Vk12653 MM cells based on a modified version of the published algorithm [11]. The EMC-92 risk score of Group B MM cells was significantly higher than those of Group A and t-Vk12653 cells (Figure 6C). These analyses clearly defined VQ Group B myeloma lines as having high-risk gene expression in comparison to either VQ Group A or t-Vk12653 cells. Moreover, the high-risk features (including transcriptomic changes) are not solely driven by MYC expression levels.
Figure 6. High-risk multiple myeloma gene signatures are enriched in VQ Group B compared to VQ Group A and t-Vk12653 Vĸ*Myc cells.

(A, B) GSEA plots comparing the upregulated genes in UAMS-70 gene signature between Group A (VQ-D1/D4) and Group B (VQ-D2/D5) MM cells (A) as well as between t-Vk12653 and Group B (VQ-D2/D5) cells (B). (C) EMC-92 risk scores calculated using clinical risk algorithm (see Materials and Methods) for control plasma cells, t- Vk12653 cells, and Group A and B VQ cells. Two-sided t-test with Holm Bonferroni Correction was performed. Samples are color-coded and tissues of origin for individual samples are denoted by legend. FDR, false discovery rate; NES, normalized enrichment score; ns, not significant. **, p <0.01.
Group A and Group B VQ show distinct responses to bortezomib in vivo
When studying the pathways enriched in Group A vs Group B VQ MM cells, we found that both NF-ĸB and TNF-α signaling via NF-ĸB pathways were significantly upregulated in Group A VQ (Figure 5B and 7A). We also observed comparable expression of Il2rg and increased expression of Cd74 and Tnfaip3 in Group A vs Group B myeloma cells (Figure 7B). The expression levels of these three genes are positively correlated to bortezomib (Btz) response in human MM [50]. These data suggest that Group B VQ may be more resistant to Btz treatment than Group A VQ. Consistent with this idea, the proteasome pathway was found to be upregulated in Group B vs A VQ cells (Figure 7C). In comparison to Group A VQ cells, Group B myeloma cells overexpressed Psmb2, Psmb3, Psmb4, and Psmb7 (Figure 7D and S7). To determine if downregulation of proteasome pathway sensitizes VQ MM cells to Btz, we knocked down Psmb2 (encoding β4 subunit) and Psmb7 (encoding β2 subunit, one of Btz targeted proteasome subunits [51]) separately in Group B-derived VQ MM cell lines. We found that knocking down Psmb7 (Figure 7E and 7F) or Psmb2 (Figure S7B and S7C) in VQ MM cell lines did not have significant effects on Btz sensitivity, suggesting that downregulation of a single proteasome subunit is insufficient to restore the sensitivity to Btz. Together, our results suggest that Group A and B myeloma cells may respond differently to Btz treatment.
Figure 7. Group B and Group A VQ cells display distinct responses to bortezomib in vivo.

(A) Gene set enrichment analysis (GSEA) of KEGG_ NF-kappa B signaling pathway and Hallmark_TNFA signaling via NFKB between Group A (VQ-D1/D4) and Group B (VQ-D2/D5) myeloma cells. (B) Transcript levels of NF-ĸB related genes Tnfaip3, CD74, and Il2rg in CD138+ B220− cells from Group A and B VQ myeloma mice. VQ donor of origin is color-coded as indicated. Results are presented as mean + SD. Two-sided t-Test was performed. FPKM, Fragments Per Kilobase of transcript per Million mapped reads. (C) GSEA of KEGG_Proteasome pathway between Group A (VQ-D1/D4) and Group B (VQ-D2/D5) myeloma cells. (D) Transcript levels of proteasome pathway genes Psmb6, Psmb7, and Psmb5, in CD138+ B220− cells from control and Group A and B VQ myeloma mice. These genes encode bortezomib-targeted β1, β2, and β5 subunit correspondingly. VQ donor of origin is color-coded as indicated. Results are presented as mean + SD. Two-sided t-Test was performed. (E, F) Btz dose-response curves in VQ MM 4935 (E) and 4938 (F) cell lines expressing shControl or shPsmb7. Results are presented as mean + SD. Two-sided t-Test was performed. (G, H) CD45.1 recipient mice were sub-lethally irradiated and injected with bone marrow cells from moribund VQ-D1 donor mouse or splenocytes from moribund VQ-D2 donor mouse. Six weeks (VQ-D1) or two weeks (VQ-D2) posttransplant, mice were treated with vehicle or bortezomib as described in Materials and Methods. (G) Serum protein electrophoresis was performed to quantify the γ-globulin/Albumin (G/A) ratios in VQ-D2 recipient mice at day 21 of treatment. Two-sided t-Test was performed. (H) Kaplan-Meier survival curves were plotted against days after treatment. Log-rank test was performed. Note: VQ-D1 results are taken from historical data [25]. FDR, false discovery rate; NES, normalized enrichment score; ns, not significant; p. adj., adjusted P-value. *, p <0.05; **, p <0.01; ***, p <0.001; ****, p <0.0001.
We previously established the single-agent efficacy of inhibiting the proteasome pathway in VQ-D1 via Btz [25]. Here, we followed the same Btz treatment scheme in VQ-D2 recipient mice as previously established in VQ-D1 (see Materials and Methods). Two weeks after VQ-D2 transplantation, recipients were divided into two groups with comparable CBC parameters and treated with vehicle (Veh) or Btz. Three weeks later, treatment efficacy was assessed via G/A ratio. In contrast to VQ-D1 mice, in which Btz lowered myeloma burden after three weeks of treatment and provided a moderate but significant survival boost [25], this same Btz treatment showed no efficacy in VQ-D2 mice and did not provide any survival benefit compared to Veh treated mice (Figure 7G and 7H). This in vivo study validated our molecular characterization, demonstrating that Group B VQ-D2 has de novo Btz resistance and can thus be considered higher risk than Group A VQ-D1.
Discussion
Previously, our group developed the Ras-driven VQ myeloma model and phenotypically characterized five lines derived from primary VQ mice (Figure 1A) [24]. In the current study, we combined BCR repertoire sequencing, WES, and CNV with RNA-Seq to characterize the genomic and transcriptomic landscapes of VQ MM lines. Both genomic and transcriptional analyses stratified VQ lines into two distinct clusters. Group A includes VQ-D1 and VQ-D4, which harbor monosomy chr5 and express hrMM gene signatures comparable to t-Vk12653 Vĸ*MYC myeloma. By contrast, Group B includes VQ-D2 and VQ-D5, which carry chr3 amplification and display both UAMS-70 and EMC-92 hrMM gene signatures vs Group A VQ and t-Vk12653 Vĸ*Myc myeloma. Consistent with their molecular classification, Group B myeloma cells showed de novo resistance to Btz treatment in vivo, while Group A myeloma cells exhibited a reduced response to Btz. Interestingly, both Group A and B VQ lines responded to Tra. Our molecular stratification of VQ lines provide a foundation to predict the potential outcomes of therapeutic regiments in different populations of human MM patients.
WES of five VQ lines identified 11 recurrently mutated genes (Figure 2). Human orthologs of two of these genes, FAT4 and SP140, have been identified as recurrently mutated in numerous MM patient sequencing studies [34–37]. Combining mRNA expression and mutation frequencies during human MM development, we believe that FAT4 and SP140 mutations play distinct roles in MM development. Fat4 expression was nearly undetectable at the mRNA level in both VQ and control PCs (Figure 2A). RNA-Seq data compiled by the MMRF’s CoMMPass database shows similarly low expression, with 80% of patients having <2 transcripts per million reads for the FAT4 gene (data not shown). Moreover, although FAT4 mutations were detected in a fraction of newly diagnosed patients [34, 35], they remained stable in a recent temporal sequencing study of 62 MM patients [52]. Together, these data suggest that FAT4 mutations serve a passenger role in myeloma progression. By contrast, Sp140 was found to be expressed in both control and VQ PCs and its mRNA level was significantly downregulated in VQ MM cells (Figure 2A). In MM patients, frequency of SP140 mutation increases in more advanced stages of disease [34–37] and also increased over time in the same temporal sequencing study [52]. Altogether, these data suggest that SP140 mutation plays an important role in MM development and progression.
SP140 encodes a member of the speckled protein family of chromatin reader proteins [31], and has been previously characterized for its role in downregulating interferon signaling in select immune cells [32, 33]. Sp110, encoding a homolog of Sp140 [31], was also found to be recurrently mutated in VQ cells and downregulated at the transcriptional level compared to control PCs (Figure 2A). STRING analysis showed that Sp110, along with Phosphatase and actin regulator 4 (Phactr4), whose gene was also recurrently mutated in VQ MM cells, share interactions with several proteins that were also downregulated at the mRNA level in VQ cells (Figure S1 and 2B). Pathway analysis of this group of proteins found that they were enriched in Type I and Type II interferon signaling (Figure 2C). Although Phactr4 has been found to act as a tumor suppressor in hepatocellular carcinoma due to its inhibition of the IL-6/STAT3 pathway [53] and both Sp110 and Sp140 were previously implicated in interferon signaling in response to tuberculosis infection [54], none of these genes have previously been implicated in interferon signaling in the context of MM. Evolutionarily, attenuating Type I and Type II interferon signaling could be beneficial to MM immune evasion and survival. Prior to the development of current novel therapy regiments, IFN-α2b was used as a MM treatment [55] with limited long-term use due to its systemic toxicity [56]. More recent studies in which IFN-α2b is conjugated to antibodies targeting CD38 [57] or HLA-DR [58] on the myeloma cell surface have also shown both in vitro and in vivo efficacy. Therefore, the role of Sp110 and Sp140 in shaping the interferon response in VQ as well as in human MM is an interesting question worth future consideration.
Large-scale chromosomal changes, including translocations and aneuploidies, have significant impacts on treatment outcomes in MM patient prognosis. Therefore, we performed CNV analysis in five VQ lines and identified two recurrent, mutually exclusive events: amplification of chr3, which was present in Group B (VQ-D2, D3, and D5; Figure 3A), and monosomy chr5, which was present in Group A (VQ-D1 and D4; Figure 3B). Neither of these CNVs are unique to the VQ model. Full gain(chr3) has been identified in the 5T2 line, while the 5TGM1 cells showed partial duplication [21]. Interestingly, monosomy 5 is a unifying CNV across all three murine MM models. Monosomy 5 was also observed in 5T2 cells, while only partially deleted in 5T33vv and 5TGM1 lines. Noticeably, monosomy 5 was present in 13/26 sequenced Vĸ*MYC lines [22]. The high incidence of monosomy chr5 across multiple MM models warrants further investigation.
Consistent with our CNV analysis, gene transcriptional analyses of RNA-Seq data, including non-supervised hierarchal clustering, PCA, and tSNE, identified two distinct transcriptional clusters (Figure 4 and Figure S3) regardless of their discrete tissue origins (Figure S4). Extensive pathway analysis between these two clusters as well as in comparison to the t-Vk12653 Vk*MYC line revealed the hrMM order: Group B > Group A = t-Vk12653 (Figure 5, 6, and S6). On the other hand, Group A (VQ-D1/D4) cells were enriched for the TNF-α/NF-ĸB signaling (Figure 5B and 7A) and increased expression of genes linked to Btz response in patients (Figure 7B). These transcriptional differences led us to speculate that Group B cells may be more resistant to PIs than Group A cells. In our initial study, treatment of VQ-D1 recipient mice with Btz following a dosing schedule found to be effective in the Vĸ*MYC model (1.0mg/kg Btz treatment on days 1,4,8,11) [59] was not effective as a single agent, but did provide a survival benefit when combined with the MEK inhibitor selumetinib [24]. However, in a more recent study, we found that reducing Btz dosage to current clinical practices provided a modest but significant boost to VQ-D1 survival and significantly reduced G/A ratio after three weeks of treatment [25] (Figure 7G and 7H). By contrast, in our current study we found that the same Btz treatment was completely ineffective against VQ-D2 cells, corroborating our molecular analysis.
We observed that despite chr3 amplification and Nras overexpression in Group B MM, both VQ-D1 and VQ-D2 MM cells responded to Tra treatment (Figure 3). By contrast, 5T2 MM cells showed increased resistance to Tra compared to other 5T lines, though this is complicated by the fact that the genomic region containing Kras is also duplicated in 5T2 cells [21]. Nonetheless, our results provide a strong rationale to develop Tra-based combination therapies in hrMM and relapsed refractory MM, particularly in the context of RAS mutations.
Altogether, our data further elucidate the genomic and transcriptional landscapes of the VQ model. These molecular characterizations, along with functional validation via in vivo treatment experiments, supports an intra-model stratification. Group A VQ (VQ-D1/D4) models Ras-driven MM with some hrMM features comparable to non-Ras-driven MM (e.g. t-Vk*MYC), including proliferative MM cells, extramedullary disease, and partial response to Btz [24, 25, 59]. Compared to t-Vk12653 and Group A VQ MM, Group B MM displays many features associated with hrMM or even ultra hrMM, including downregulation of Fam46c, upregulation of UAMS-70 and EMC-92 hrMM gene signatures, PBX1-FOXM1 gene signatures associated with Amp1q, and pathways associated with functional hrMM, and de novo resistance to venetoclax in vitro and Btz in vivo. Our results suggest that t-Vk12653 and Group A VQ may represent advanced MM patients without ultrahigh risk features, while Group B VQ may represent ultra hrMM.
Supplementary Material
Acknowledgments
We would like to thank the University of Wisconsin Carbone Comprehensive Cancer Center (UWCCC) for use of its Shared Services (Small Molecule Screening Facility, Flow Cytometry Laboratory, Transgenic Animal Facility, and Experimental Pathology Laboratory) to complete this research. We would also like to thank Dr. Robert Burns for his assistance in initiating the CNV study. The Graphical Abstract for this work was created with BioRender.com. This work was supported by a postdoctoral fellowship from the NIH grant T32 GM081061 to EF, the startup fund 252840–00 from Marshfield Clinic Research Foundation to ZW, R01CA252937 to FA, R01CA152108 to JZ, R01AI079087 and R01HL130724 to DW, and additional support from the Trillium Fund, UWCCC Developmental Therapeutics Program Pilot Awards, and Immunotherapy Pilot Award.
Footnotes
Competing Interests statement:
We declare that no conflict of interest exists.
Competing Interests Statement:
We declare no competing financial interests.
References
- 1.Palumbo A, Anderson K. Multiple myeloma. N Engl J Med 2011; 364: 1046–1060. [DOI] [PubMed] [Google Scholar]
- 2.Walker BA, Wardell CP, Chiecchio L, Smith EM, Boyd KD, Neri A et al. Aberrant global methylation patterns affect the molecular pathogenesis and prognosis of multiple myeloma. Blood 2011; 117: 553–562. [DOI] [PubMed] [Google Scholar]
- 3.Caro J, Al Hadidi S, Usmani S, Yee AJ, Raje N, Davies FE. How to Treat High-Risk Myeloma at Diagnosis and Relapse. Am Soc Clin Oncol Educ Book 2021; 41: 291–309. [DOI] [PubMed] [Google Scholar]
- 4.Solimando AG, Da Via MC, Cicco S, Leone P, Di Lernia G, Giannico D et al. High-Risk Multiple Myeloma: Integrated Clinical and Omics Approach Dissects the Neoplastic Clone and the Tumor Microenvironment. J Clin Med 2019; 8. [DOI] [PMC free article] [PubMed] [Google Scholar]
- 5.Mikhael JR, Dingli D, Roy V, Reeder CB, Buadi FK, Hayman SR et al. Management of newly diagnosed symptomatic multiple myeloma: updated Mayo Stratification of Myeloma and Risk-Adapted Therapy (mSMART) consensus guidelines 2013. Mayo Clin Proc 2013; 88: 360–376. [DOI] [PubMed] [Google Scholar]
- 6.D’Agostino M, Cairns DA, Lahuerta JJ, Wester R, Bertsch U, Waage A et al. Second Revision of the International Staging System (R2-ISS) for Overall Survival in Multiple Myeloma: A European Myeloma Network (EMN) Report Within the HARMONY Project. J Clin Oncol 2022; 40: 3406–3418. [DOI] [PubMed] [Google Scholar]
- 7.Avet-Loiseau H, Attal M, Campion L, Caillot D, Hulin C, Marit G et al. Long-term analysis of the IFM 99 trials for myeloma: cytogenetic abnormalities [t(4;14), del(17p), 1q gains] play a major role in defining long-term survival. J Clin Oncol 2012; 30: 1949–1952. [DOI] [PubMed] [Google Scholar]
- 8.Trasanidis N, Katsarou A, Ponnusamy K, Shen YA, Kostopoulos IV, Bergonia B et al. Systems medicine dissection of chr1q-amp reveals a novel PBX1-FOXM1 axis for targeted therapy in multiple myeloma. Blood 2022; 139: 1939–1953. [DOI] [PubMed] [Google Scholar]
- 9.Locher M, Steurer M, Jukic E, Keller MA, Fresser F, Ruepp C et al. The prognostic value of additional copies of 1q21 in multiple myeloma depends on the primary genetic event. Am J Hematol 2020; 95: 1562–1571. [DOI] [PMC free article] [PubMed] [Google Scholar]
- 10.Shaughnessy JD Jr., Zhan F, Burington BE, Huang Y, Colla S, Hanamura I et al. A validated gene expression model of high-risk multiple myeloma is defined by deregulated expression of genes mapping to chromosome 1. Blood 2007; 109: 2276–2284. [DOI] [PubMed] [Google Scholar]
- 11.Kuiper R, Broyl A, de Knegt Y, van Vliet MH, van Beers EH, van der Holt B et al. A gene expression signature for high-risk multiple myeloma. Leukemia 2012; 26: 2406–2413. [DOI] [PubMed] [Google Scholar]
- 12.Walker BA, Mavrommatis K, Wardell CP, Ashby TC, Bauer M, Davies F et al. A high-risk, Double-Hit, group of newly diagnosed myeloma identified by genomic analysis. Leukemia 2019; 33: 159–170. [DOI] [PMC free article] [PubMed] [Google Scholar]
- 13.Costa LJ, Chhabra S, Medvedova E, Dholaria BR, Schmidt TM, Godby KN et al. Daratumumab, Carfilzomib, Lenalidomide, and Dexamethasone With Minimal Residual Disease Response-Adapted Therapy in Newly Diagnosed Multiple Myeloma. J Clin Oncol 2022; 40: 2901–2912. [DOI] [PubMed] [Google Scholar]
- 14.Soekojo CY, Chung TH, Furqan MS, Chng WJ. Genomic characterization of functional high-risk multiple myeloma patients. Blood cancer journal 2022; 12: 24. [DOI] [PMC free article] [PubMed] [Google Scholar]
- 15.Rossi M, Botta C, Arbitrio M, Grembiale RD, Tagliaferri P, Tassone P. Mouse models of multiple myeloma: technologic platforms and perspectives. Oncotarget 2018; 9: 20119–20133. [DOI] [PMC free article] [PubMed] [Google Scholar]
- 16.Cooke RE, Koldej R, Ritchie D. Immunotherapeutics in Multiple Myeloma: How Can Translational Mouse Models Help? J Oncol 2019; 2019: 2186494. [DOI] [PMC free article] [PubMed] [Google Scholar]
- 17.Morito N, Yoh K, Maeda A, Nakano T, Fujita A, Kusakabe M et al. A novel transgenic mouse model of the human multiple myeloma chromosomal translocation t(14;16)(q32;q23). Cancer Res 2011; 71: 339–348. [DOI] [PubMed] [Google Scholar]
- 18.Chesi M, Robbiani DF, Sebag M, Chng WJ, Affer M, Tiedemann R et al. AID-dependent activation of a MYC transgene induces multiple myeloma in a conditional mouse model of post-germinal center malignancies. Cancer Cell 2008; 13: 167–180. [DOI] [PMC free article] [PubMed] [Google Scholar]
- 19.Radl J, De Glopper ED, Schuit HR, Zurcher C. Idiopathic paraproteinemia. II. Transplantation of the paraprotein-producing clone from old to young C57BL/KaLwRij mice. J Immunol 1979; 122: 609–613. [PubMed] [Google Scholar]
- 20.Garrett IR, Dallas S, Radl J, Mundy GR. A murine model of human myeloma bone disease. Bone 1997; 20: 515–520. [DOI] [PubMed] [Google Scholar]
- 21.Maes K, Boeckx B, Vlummens P, De Veirman K, Menu E, Vanderkerken K et al. The genetic landscape of 5T models for multiple myeloma. Sci Rep 2018; 8: 15030. [DOI] [PMC free article] [PubMed] [Google Scholar]
- 22.Chesi M, Stein CK, Garbitt VM, Sharik ME, Asmann YW, Asmann YW et al. Monosomic Loss of MIR15A/MIR16–1 Is a Driver of Multiple Myeloma Proliferation and Disease Progression. Blood Cancer Discovery 2020. [DOI] [PMC free article] [PubMed]
- 23.Avet-Loiseau H, Li JY, Morineau N, Facon T, Brigaudeau C, Harousseau JL et al. Monosomy 13 is associated with the transition of monoclonal gammopathy of undetermined significance to multiple myeloma. Intergroupe Francophone du Myelome. Blood 1999; 94: 2583–2589. [PubMed] [Google Scholar]
- 24.Wen Z, Rajagopalan A, Flietner E, Yun G, Chesi M, Furumo Q et al. Expression of NrasQ61R and MYC transgene in germinal center B cells induces a highly malignant multiple myeloma in mice. Blood 2021; 137: 61–74. [DOI] [PMC free article] [PubMed] [Google Scholar]
- 25.Flietner E, Wen Z, Rajagopalan A, Jung O, Watkins L, Wiesner J et al. Ponatinib sensitizes myeloma cells to MEK inhibition in the high-risk VQ model. Sci Rep 2022; 12: 10616. [DOI] [PMC free article] [PubMed] [Google Scholar]
- 26.Gonzalez D, van der Burg M, Garcia-Sanz R, Fenton JA, Langerak AW, Gonzalez M et al. Immunoglobulin gene rearrangements and the pathogenesis of multiple myeloma. Blood 2007; 110: 3112–3121. [DOI] [PubMed] [Google Scholar]
- 27.Maul RW, Gearhart PJ. AID and somatic hypermutation. Adv Immunol 2010; 105: 159–191. [DOI] [PMC free article] [PubMed] [Google Scholar]
- 28.Turchaninova MA, Davydov A, Britanova OV, Shugay M, Bikos V, Egorov ES et al. High-quality full-length immunoglobulin profiling with unique molecular barcoding. Nat Protoc 2016; 11: 1599–1616. [DOI] [PubMed] [Google Scholar]
- 29.Medina A, Jimenez C, Sarasquete ME, Gonzalez M, Chillon MC, Balanzategui A et al. Molecular profiling of immunoglobulin heavy-chain gene rearrangements unveils new potential prognostic markers for multiple myeloma patients. Blood cancer journal 2020; 10: 14. [DOI] [PMC free article] [PubMed] [Google Scholar]
- 30.Ferrero S, Capello D, Svaldi M, Boi M, Gatti D, Drandi D et al. Multiple myeloma shows no intra-disease clustering of immunoglobulin heavy chain genes. Haematologica 2012; 97: 849–853. [DOI] [PMC free article] [PubMed] [Google Scholar]
- 31.Fraschilla I, Jeffrey KL. The Speckled Protein (SP) Family: Immunity’s Chromatin Readers. Trends Immunol 2020; 41: 572–585. [DOI] [PMC free article] [PubMed] [Google Scholar]
- 32.Karaky M, Fedetz M, Potenciano V, Andres-Leon E, Codina AE, Barrionuevo C et al. SP140 regulates the expression of immune-related genes associated with multiple sclerosis and other autoimmune diseases by NF-kappaB inhibition. Hum Mol Genet 2018; 27: 4012–4023. [DOI] [PubMed] [Google Scholar]
- 33.Ji DX, Witt KC, Kotov DI, Margolis SR, Louie A, Chevee V et al. Role of the transcriptional regulator SP140 in resistance to bacterial infections via repression of type I interferons. eLife 2021; 10. [DOI] [PMC free article] [PubMed] [Google Scholar]
- 34.Hu Y, Chen W, Wang J. Mutations In Thirty Hotspot Genes In Newly Diagnosed Chinese Multiple Myeloma Patients. Onco Targets Ther 2019; 12: 9999–10010. [DOI] [PMC free article] [PubMed] [Google Scholar]
- 35.Walker BA, Mavrommatis K, Wardell CP, Ashby TC, Bauer M, Davies FE et al. Identification of novel mutational drivers reveals oncogene dependencies in multiple myeloma. Blood 2018; 132: 587–597. [DOI] [PMC free article] [PubMed] [Google Scholar]
- 36.Bolli N, Avet-Loiseau H, Wedge DC, Van Loo P, Alexandrov LB, Martincorena I et al. Heterogeneity of genomic evolution and mutational profiles in multiple myeloma. Nature communications 2014; 5: 2997. [DOI] [PMC free article] [PubMed] [Google Scholar]
- 37.Kortum KM, Mai EK, Hanafiah NH, Shi CX, Zhu YX, Bruins L et al. Targeted sequencing of refractory myeloma reveals a high incidence of mutations in CRBN and Ras pathway genes. Blood 2016; 128: 1226–1233. [DOI] [PMC free article] [PubMed] [Google Scholar]
- 38.Qi C, Zhu YT, Hu L, Zhu YJ. Identification of Fat4 as a candidate tumor suppressor gene in breast cancers. Int J Cancer 2009; 124: 793–798. [DOI] [PMC free article] [PubMed] [Google Scholar]
- 39.Wei R, Xiao Y, Song Y, Yuan H, Luo J, Xu W. FAT4 regulates the EMT and autophagy in colorectal cancer cells in part via the PI3K-AKT signaling axis. J Exp Clin Cancer Res 2019; 38: 112. [DOI] [PMC free article] [PubMed] [Google Scholar]
- 40.Franz M, Lopes CT, Huck G, Dong Y, Sumer O, Bader GD. Cytoscape.js: a graph theory library for visualisation and analysis. Bioinformatics 2016; 32: 309–311. [DOI] [PMC free article] [PubMed] [Google Scholar]
- 41.Szklarczyk D, Gable AL, Nastou KC, Lyon D, Kirsch R, Pyysalo S et al. The STRING database in 2021: customizable protein-protein networks, and functional characterization of user-uploaded gene/measurement sets. Nucleic Acids Res 2021; 49: D605–D612. [DOI] [PMC free article] [PubMed] [Google Scholar]
- 42.Lohr JG, Stojanov P, Carter SL, Cruz-Gordillo P, Lawrence MS, Auclair D et al. Widespread genetic heterogeneity in multiple myeloma: implications for targeted therapy. Cancer Cell 2014; 25: 91–101. [DOI] [PMC free article] [PubMed] [Google Scholar]
- 43.Fucci C, Resnati M, Riva E, Perini T, Ruggieri E, Orfanelli U et al. The Interaction of the Tumor Suppressor FAM46C with p62 and FNDC3 Proteins Integrates Protein and Secretory Homeostasis. Cell reports 2020; 32: 108162. [DOI] [PubMed] [Google Scholar]
- 44.Avet-Loiseau H, Li C, Magrangeas F, Gouraud W, Charbonnel C, Harousseau JL et al. Prognostic significance of copy-number alterations in multiple myeloma. J Clin Oncol 2009; 27: 4585–4590. [DOI] [PMC free article] [PubMed] [Google Scholar]
- 45.Mroczek S, Chlebowska J, Kulinski TM, Gewartowska O, Gruchota J, Cysewski D et al. The non-canonical poly(A) polymerase FAM46C acts as an onco-suppressor in multiple myeloma. Nature communications 2017; 8: 619. [DOI] [PMC free article] [PubMed] [Google Scholar]
- 46.Zhu YX, Shi CX, Bruins LA, Jedlowski P, Wang X, Kortum KM et al. Loss of FAM46C Promotes Cell Survival in Myeloma. Cancer Res 2017; 77: 4317–4327. [DOI] [PMC free article] [PubMed] [Google Scholar]
- 47.Kalff A, Spencer A. The t(4;14) translocation and FGFR3 overexpression in multiple myeloma: prognostic implications and current clinical strategies. Blood cancer journal 2012; 2: e89. [DOI] [PMC free article] [PubMed] [Google Scholar]
- 48.Ng YLD, Ramberger E, Bohl SR, Dolnik A, Steinebach C, Conrad T et al. Proteomic profiling reveals CDK6 upregulation as a targetable resistance mechanism for lenalidomide in multiple myeloma. Nature communications 2022; 13: 1009. [DOI] [PMC free article] [PubMed] [Google Scholar]
- 49.Boyd KD, Ross FM, Walker BA, Wardell CP, Tapper WJ, Chiecchio L et al. Mapping of chromosome 1p deletions in myeloma identifies FAM46C at 1p12 and CDKN2C at 1p32.3 as being genes in regions associated with adverse survival. Clin Cancer Res 2011; 17: 7776–7784. [DOI] [PMC free article] [PubMed] [Google Scholar]
- 50.Broyl A, Hose D, Lokhorst H, de Knegt Y, Peeters J, Jauch A et al. Gene expression profiling for molecular classification of multiple myeloma in newly diagnosed patients. Blood 2010; 116: 2543–2553. [DOI] [PubMed] [Google Scholar]
- 51.Besse A, Besse L, Kraus M, Mendez-Lopez M, Bader J, Xin BT et al. Proteasome Inhibition in Multiple Myeloma: Head-to-Head Comparison of Currently Available Proteasome Inhibitors. Cell Chem Biol 2019; 26: 340–351 e343. [DOI] [PubMed] [Google Scholar]
- 52.Farswan A, Jena L, Kaur G, Gupta A, Gupta R, Rani L et al. Branching clonal evolution patterns predominate mutational landscape in multiple myeloma. Am J Cancer Res 2021; 11: 5659–5679. [PMC free article] [PubMed] [Google Scholar]
- 53.Cao F, Liu M, Zhang QZ, Hao R. PHACTR4 regulates proliferation, migration and invasion of human hepatocellular carcinoma by inhibiting IL-6/Stat3 pathway. Eur Rev Med Pharmacol Sci 2016; 20: 3392–3399. [PubMed] [Google Scholar]
- 54.Pichugin AV, Yan BS, Sloutsky A, Kobzik L, Kramnik I. Dominant role of the sst1 locus in pathogenesis of necrotizing lung granulomas during chronic tuberculosis infection and reactivation in genetically resistant hosts. Am J Pathol 2009; 174: 2190–2201. [DOI] [PMC free article] [PubMed] [Google Scholar]
- 55.Mellstedt H, Ahre A, Bjorkholm M, Holm G, Johansson B, Strander H. Interferon therapy in myelomatosis. Lancet 1979; 1: 245–247. [DOI] [PubMed] [Google Scholar]
- 56.Fritz E, Ludwig H. Interferon-alpha treatment in multiple myeloma: meta-analysis of 30 randomised trials among 3948 patients. Ann Oncol 2000; 11: 1427–1436. [DOI] [PubMed] [Google Scholar]
- 57.Pogue SL, Taura T, Bi M, Yun Y, Sho A, Mikesell G et al. Targeting Attenuated Interferon-alpha to Myeloma Cells with a CD38 Antibody Induces Potent Tumor Regression with Reduced Off-Target Activity. PLoS One 2016; 11: e0162472. [DOI] [PMC free article] [PubMed] [Google Scholar]
- 58.Rossi EA, Rossi DL, Cardillo TM, Stein R, Goldenberg DM, Chang CH. Preclinical studies on targeted delivery of multiple IFNalpha2b to HLA-DR in diverse hematologic cancers. Blood 2011; 118: 1877–1884. [DOI] [PMC free article] [PubMed] [Google Scholar]
- 59.Chesi M, Matthews GM, Garbitt VM, Palmer SE, Shortt J, Lefebure M et al. Drug response in a genetically engineered mouse model of multiple myeloma is predictive of clinical efficacy. Blood 2012; 120: 376–385. [DOI] [PMC free article] [PubMed] [Google Scholar]
Associated Data
This section collects any data citations, data availability statements, or supplementary materials included in this article.
Supplementary Materials
Data Availability Statement
The next-generation sequencing datasets generated and analyzed during the current study are available in the Sequence Read Archive (SRA) at https://www.ncbi.nlm.nih.gov/sra, with BioProject accession number PRJNA947112, and Gene Expression Omnibus (GEO) at https://www.ncbi.nlm.nih.gov/geo, with accession number GSE226833. The code and scripts for data analysis are deposited onto Github: https://github.com/BRIwanglab/Oncogene2023.