

Abstract
Phosphodiesterase‐5 (PDE5) is responsible for regulating the concentration of the second messenger molecule cGMP by hydrolyzing it into 5′‐GMP. PDE5 is implicated in erectile dysfunction and cardiovascular diseases. The substrate binding site in the catalytic domain of PDE5 is surrounded by several dynamic structural motifs (including the α14 helix, M‐loop, and H‐loop) that are known to switch between inactive and active conformational states via currently unresolved structural intermediates. We evaluated the conformational dynamics of these structural motifs in the apo state and upon binding of an allosteric inhibitor (evodiamine) or avanafil, a competitive inhibitor. We employed enhanced sampling‐based replica exchange solute scaling (REST2) method, principal component analysis (PCA), time‐lagged independent component analysis (tICA), molecular dynamics (MD) simulations, and well‐tempered metadynamics simulations to probe the conformational changes in these structural motifs. Our results support a regulatory mechanism for PDE5, where the α14 helix alternates between an inward (lower activity) conformation and an outward (higher activity) conformation that is accompanied by the folding/unfolding of the α8′ and α8″ helices of the H‐loop. When the allosteric inhibitor evodiamine is bound to PDE5, the inward (inactive) state of the α14 helix is preferred, thus preventing substrate access to the catalytic site. In contrast, competitive inhibitors of PDE5 block catalysis by occupying the active site accompanied by stabilization of the outward conformation of the α14 helix. Defining the conformational dynamics underlying regulation of PDE5 activation will be helpful in rational design of next‐generation small molecules modulators of PDE5 activity.
Keywords: conformational dynamics, inhibitor binding, molecular dynamics, phosphodiesterase, principal component analysis, replica exchange, structural transition, well‐tempered metadynamics

1. INTRODUCTION
Phosphodiesterase‐5 (PDE5), a member of the phosphodiesterase (PDE) family, is responsible for the hydrolysis of the second messenger cyclic guanosine monophosphate (cGMP) to 5′‐GMP (Ahmed et al., 2021). PDE5 is a therapeutic target for the treatment of erectile dysfunction, benign prostatic hyperplasia, and pulmonary arterial hypertension (Ahmed et al., 2021; Baillie et al., 2019; Samidurai et al., 2023; Udeoji & Schwarz, 2012). For the treatment of these diseases, many marketed drugs (sildenafil, vardenafil, tadalafil, and avanafil) have been developed (Ahmed et al., 2021; Baillie et al., 2019; Hsieh et al., 2020; Udeoji & Schwarz, 2012). These drugs competitively bind to the catalytic site of PDE5 and prevent the hydrolysis of cGMP, thus elevating the cellular concentration of cGMP. The first generation drugs targeting PDE5 (sildenafil, vardenafil, and tadalafil) also inhibit other members of the PDE family (e.g., PDE1, PDE6, and/or PDE11) due to their structural similarity with PDE5 (Hsieh et al., 2020; Huang et al., 2013; Maurice et al., 2014). The side effects of these drugs can lead to visual disturbance, hearing loss, and dyspepsia (Huang et al., 2013; Martin‐Morales, 2009; Morales et al., 1998). Avanafil, a second generation PDE5 inhibitor, has better isoform selectivity for PDE5 (Hsieh et al., 2020; Sakamoto et al., 2014). Recently, an evodiamine derivative ( S‐7e, termed “evodiamine” hereafter) has also been reported as an allosteric inhibitor of PDE5 (Zhang et al., 2020).
PDE5 is a multidomain protein having two N‐terminal tandem GAF domains (GAFa and GAFb) and a C‐terminal catalytic domain (residues 536–859) (Biswas et al., 2008; Biswas & Visweswariah, 2011; Blount et al., 2007; Corbin et al., 2009; Zoraghi et al., 2005). The binding of cGMP to an allosteric site, located in the GAFa domain, is reported to activate the PDE5 catalytic domain by inducing conformational changes (Biswas et al., 2008; Biswas & Visweswariah, 2011; Corbin et al., 2009; Rybalkin et al., 2003; Zoraghi et al., 2005). Using experimental bioluminescence resonance energy transfer (BRET) method, some conformational changes in the catalytic domain of PDE5 have been reported due to inhibitor or cGMP binding in the catalytic site, or cGMP binding in the allosteric site in the GAFa domain (Biswas et al., 2008; Biswas & Visweswariah, 2011). The experimental findings suggest that PDE5 catalytic domain exists in two distinct conformational forms: “basal form” with low catalytic turnover and the “activated form,” when cGMP hydrolysis is elevated (Biswas et al., 2008; Biswas & Visweswariah, 2011; Blount et al., 2007; Corbin et al., 2009; Francis et al., 1998). In addition, PDE5 persists in the catalytically active form for a longer time period after 5′‐GMP or the inhibitors dissociate from the catalytic site (Blount et al., 2007; Corbin et al., 2009; Francis et al., 1998). However, the complete mechanistic details of these two distinct conformational forms are unknown, thus limiting efforts for the rational design of next‐generation modulators of PDE5.
In the catalytic domain of PDE5, the entrance to the catalytic site is surrounded by the H‐loop (residues 659–679, yellow cartoon in Figure 1), the α14 helix (residues 772–797, green cartoon in Figure 1), and the adjoining M‐loop (residues 798–812, purple cartoon in Figure 1) (Hsieh et al., 2020; Wang et al., 2006, 2007). The H‐loop is suggested to undergo structural changes on binding of inhibitors, thereby contributing to the inhibition of PDE5 (Hsieh et al., 2020; Wang et al., 2007; Zhang et al., 2020). These ligand‐dependent conformational changes include: (1) the H‐loop adopting an unfolded conformation in the apo state (Figure 1, left most panel) and in the vardenafil‐bound PDE5 structures (PDB:2H40 and 1UHO, respectively); (2) the appearance of a small α‐helical structure (α8″ helix, Leu672 through Leu675) in the sildenafil‐bound PDE5 (PDB:2H42); (3) a small α‐helical structure (α8′ helix, Asn662 through Arg667) in the evodiamine‐bound PDE5 (Figure 1, middle panel, PDB:6VBI); and (4) two small α‐helical structures, that is, α8′ and α8″ helices (Figure 1, right most panel) in the avanafil, tadalafil, and 5′‐GMP bound PDE5 structures (PDB:6L6E, 1XOZ, and 1T9S, respectively) (Hsieh et al., 2020; Wang et al., 2007). Ke and Wang (Ke & Wang, 2007) reported that the H‐loop has structural variations distinctive of the PDE5 family in which the H‐loop contains two small α‐helices (α8′ and α8″). The α14 helix has a helical structure, but its conformation is unresolved when the catalytic site is unoccupied, in the apo and evodiamine‐bound PDE5 structures (PDB:2H40 and 6VBI, respectively). Further, the M‐loop may fold into small helices formed between the residues Asp803 and Met805, and between the residues Arg807 and Lys812 (Hsieh et al., 2020). Li et al. (2014) reported that the residues His617, His653, Asp654, and Asp764 in the catalytic site of PDE5 assist the hydrolysis reaction, whereas the residues Leu725, Asp764, Leu765, Val782, Phe786, and Phe820 interact and stabilize the cGMP molecule. The residues Phe786 and Phe820 are critical, and reported to participate in π–π stacking with cGMP and inhibitor molecules (Hsieh et al., 2020; Huang et al., 2013; Li et al., 2014).
FIGURE 1.

Details of the structural motifs in the catalytic domain (residues 536–859) of PDE5 based on X‐ray structures. The catalytic site is buried between the H‐loop formed by the residues 659–679 (yellow), the α14 helix formed by the residues 772–797 (green), and the adjoining M‐loop formed by the residues 798–812 (purple). (Left most panel) The catalytic domain in the apo form (PDB:2H40), with partially resolved α14 helix and the M‐loop. The H‐loop is unfolded and is in the outward position relative to the catalytic site. The catalytic site is highlighted with an oval shape (red dotted line). (Middle panel) The conformation of the catalytic domain of PDE5 bound to evodiamine in the allosteric site (PDB:6VBI), with partially resolved α14 helix and the M‐loop. The H‐loop has an inward orientation toward the catalytic site. (Right most panel) The catalytic domain of PDE5 bound to avanafil in the catalytic site (PDB:6L6E). The α14 helix and the M‐loop are fully resolved in this structure. In this state, the H‐loop is comprised of partially folded helices (α8′ and α8″).
The allosteric binding site of evodiamine is located in the catalytic domain of PDE5, at the N‐terminus of the α14 helix (middle panel, Figure 1). The binding site is comprised of the residues Phe564, Ile778, Leu781, Tyr612, Asp563, Arg616, Asn620, Asp764, and His617 (Zhang et al., 2020). It has been reported that the binding of evodiamine induces large conformational changes in the H‐loop (PDB:6VBI), thereby preventing the binding of cGMP to the catalytic site in PDE5 (Zhang et al., 2020).
The fully resolved crystal structures of PDE5, in the 5′‐GMP‐bound (PDB:1T9S) or the inhibitor‐bound (PDB:6L6E, 1XOZ, 1UHO, and 2H42) states are available (Gupta et al., 2020; Hsieh et al., 2020). However, the conformational states of key structural motifs in the “basal form” remain unknown due to unresolved residues in the α14 helix and the M‐loop in the apo structure of PDE5 (PDB:2H40). Moreover, the mechanism of allosteric inhibition is also unclear due to unresolved structures of the α14 helix and the M‐loop in the evodiamine‐bound structure of PDE5 (PDB:6VBI). Using enhanced sampling methods and conventional molecular dynamics (MD) simulations, we probed the conformational changes in the catalytic domain of PDE5 when (1) the catalytic site is unoccupied, and (2) the catalytic site is occupied by a competitive inhibitor (avanafil) or (3) an allosteric inhibitor (evodiamine) is bound to the catalytic domain.
MD simulations and enhanced sampling methods are important tools to probe the conformational dynamics in proteins (Kapakayala & Nair, 2021; Schuster et al., 2019; Srivastava et al., 2022; Tripathi et al., 2018; Vashisth et al., 2013). While MD simulations of PDE6 have suggested conformational changes in the α12 helix (Gupta et al., 2020; Pattis et al., 2019), previous simulations of the catalytic domain of PDE5 have provided general information on the motions of the M‐loop and H‐loop (Huang et al., 2018; Pattis et al., 2019) but no insights into the coupling of these motions with the α14 helix. Using the replica exchange solute scaling (REST2) method, a replica exchange‐based enhanced sampling method that provides exhaustive sampling (Kapakayala & Nair, 2021; Mlýnský et al., 2022; Wang et al., 2011, 2012), we studied conformational dynamics in the structural motifs of the catalytic site that are known to be implicated in the activation of the PDE5 catalytic domain (Biswas et al., 2008; Biswas & Visweswariah, 2011). We analyzed the conformational changes in the structural motifs surrounding the catalytic site of PDE5 by applying the principal component analysis (PCA) and time‐lagged independent component analysis (tICA) on the trajectories generated by the REST2 method. We further performed independent all‐atom conventional MD simulations and well‐tempered metadynamics (WT‐MTD) simulations to understand the flexibility and the stability of the conformational states.
This work was conducted in three different states: the apo‐form (termed PDE5‐apo, with the catalytic site unoccupied), the evodiamine‐bound form (termed PDE5‐evodiamine, with the catalytic site unoccupied and an allosteric site occupied by evodiamine), and the avanafil‐bound form (termed PDE5‐avanafil, with the catalytic site occupied by avanafil). Our results revealed that in the apo‐form, the α14 helix can span both an inward (catalytic site closed and catalytically inactive) and an outward state (catalytic site open and catalytically active). In addition, the transitions between the inward and the outward sates of the α14 helix are coupled with the motion and folding/unfolding of α8′ and α8″ helices within the H‐loop. In the competitive inhibitor‐bound form, the α14 helix remains in the outward state, which keeps the catalytic site accessible for a longer time period, even after the dissociation of the inhibitor. In the evodiamine‐bound form, the inward state of the α14 helix is preferred, thus making the catalytic site inaccessible to cGMP, thus providing a plausible mechanism for allosteric inhibition. Moreover, WT‐MTD simulations also revealed that the inward state of the α14 helix is energetically favorable in the apo and evodiamine‐bound PDE5.
2. METHODS
2.1. Simulation setup
We used the initial coordinates of the catalytic domain of PDE5 (residues 536–859) based on the avanafil‐bound structure of PDE5 (PDB:6L6E), where all structural motifs are fully resolved, to generate the apo and evodiamine‐bound structures of PDE5. The PDE5‐apo system was created by removing the avanafil molecule from the avanafil‐bound PDE5 structure (PDB:6L6E), because significant residues are missing from the α14 helix and the H‐loop in the PDE5‐apo crystal structure (PDB:2H40) (Figure 1 and Figure S1). Similarly, due to the missing α14 helix in the evodiamine‐bound structure of PDE5 (PDB:6VBI) (Zhang et al., 2020), the PDE5‐evodiamine system was generated by docking evodiamine in the prepared apo structure of the PDE5 with AutoDock‐4.2 (Morris et al., 2009) (Figure S1).
Each of the three systems (PDE5‐apo, PDE5‐evodiamine, and PDE5‐avanafil) was prepared using the CHARMM‐GUI tool (Lee et al., 2016), solvated with TIP3P (Mark & Nilsson, 2001) water molecules, and neutralized with Na+ and Cl− ions (at 150 mM concentration). MD simulations were performed using the GROMACS‐2018 package (Abraham et al., 2015), patched with the PLUMED‐2.7 plugin (Bonomi et al., 2019). The CHARMM36m force‐field was used for the protein atoms (Lee et al., 2016) and the CGenFF force‐field for parameterizing ligands (Vanommeslaeghe et al., 2009). Each system was briefly equilibrated in the NPT ensemble for 10 ns using the Berendsen barostat (Berendsen et al., 1984) at a pressure of 1 atm and using the velocity‐rescale thermostat (Bussi et al., 2007) at a temperature of 300 K. An integration time‐step of 2 fs was used in all MD simulations and the coordinates were saved at every 40 ps. Each system was further equilibrated for 100 ns in the NVT ensemble at a temperature of 300 K using the velocity‐rescale thermostat (Bussi et al., 2007). MD simulations for each system were performed in four consecutive stages: (1) a 100 ns conventional MD equilibration, (2) a 200 ns long REST2 simulation, (3) two independent 500 ns long conventional MD simulations initiated from selected metastable state structures obtained using PCA (vide infra), and (4) free energy calculations using the WT‐MTD simulations.
2.2. Replica exchange solute scaling
In the replica exchange (i.e., parallel tempering) method, molecular configurations are exchanged between the replicas running in parallel, each at a different temperature {T 0, T 1, …, T n }, where the temperature is distributed between T 0, the lowest, and T n , the highest temperature (Liu et al., 2005). This improves the overall sampling of the replica running at the temperature T 0. In comparison, in the REST2 method (Liu et al., 2005; Wang et al., 2011), the replicas running in parallel are effectively heated up by scaling down the potential energies of selected solute atoms (defined using a “hot” region) in different replicas using the scaling factors . The conformations are exchanged between the replicas based on the Metropolis exchange criterion (Kapakayala & Nair, 2021; Wang et al., 2011). This improves the overall sampling of the unscaled replica at .
For the apo system, the PDE5 residues within the catalytic site (660–683, 724–730, and 765–820), and for the evodiamine and avanafil‐bound systems, additionally, the ligand molecules (evodiamine and avanafil, respectively) were assigned to the “hot” regions. In REST2 simulations, the effective temperature of a given replica i is calculated using the following equation:
| (1) |
where T i is the effective temperature of the replica i, T 0 is the temperature of the unscaled replica (i = 0), that is, the starting temperature, and in which T max is the maximum effective temperature, and n is the total number of replicas. We created n = 32 replicas (i = 0–31), with a starting temperature T 0 of 300 K, and the maximum effective temperature T max of 900 K, corresponding to a scaling factor , where and . The dihedral and the non‐bonded (Columbic and Lennard‐Jones) potential energies were correspondingly scaled‐down by the scaling factor of the replica i. We exchanged conformations between the adjacent replicas at every 2 ps with the averaged exchange acceptance probability of ~20%. Using these criteria, we performed a 200 ns REST2 simulation for each system under the NVT ensemble, and saved the coordinates at every 5 ps.
Using the trajectories generated by the REST2 method, we further performed the PCA and tICA analyses to identify the fast and slow modes, respectively, in the structural motifs surrounding the catalytic site of PDE5. In addition, we identified various metastable states on the free energy landscape projected along the first and second principal components. To probe the stability and dynamics of the structures corresponding to various metastable states, we performed two independent MD simulations (each 500 ns long), starting from the structures corresponding to selected metastable states. We conducted six MD simulations each for the apo (two simulations corresponding to three metastable states A1, A2, and A3) and the evodiamine‐bound (two simulations corresponding to three metastable states E1, E2, and E3) systems, and four simulations for the avanafil‐bound system (two simulations corresponding to each of the two metastable states V1 and V2). Each conventional MD simulation based on a metastable state is labeled with a unique designation (e.g., simulations starting from a structure derived from the metastable state termed A1 are labeled as A1′ and A1″). All conventional MD simulations were performed in the NVT ensemble at a temperature of 300 K, with coordinates saved at every 40 ps.
2.3. Conformational analyses
We performed the PCA analysis of each REST2 trajectory to identify the essential conformational modes (Amadei et al., 1993; de Groot et al., 1996; Tripathi et al., 2018) in structural motifs surrounding the catalytic site in PDE5. In the PCA method, a covariance (C) matrix of the atomic fluctuations is initially calculated. The covariance matrix is then diagonalized to obtain the eigenvectors and the corresponding eigenvalues. The eigenvectors represent the directions of motion along the principal components (PCs). The elements of the covariance matrix are provided by the following equation:
| (2) |
where  represents the time average, and x
i
and x
j
are the Cartesian coordinates of the atoms i and j. We also constructed the free energy landscape (Frauenfelder et al., 1991; Tripathi et al., 2016) by calculating the probability distributions of the top two eigenvectors corresponding to the first and second principal components (PC1 and PC2), respectively. The free energy was estimated using the following equation:
represents the time average, and x
i
and x
j
are the Cartesian coordinates of the atoms i and j. We also constructed the free energy landscape (Frauenfelder et al., 1991; Tripathi et al., 2016) by calculating the probability distributions of the top two eigenvectors corresponding to the first and second principal components (PC1 and PC2), respectively. The free energy was estimated using the following equation:
| (3) |
where P i is the probability density function of the eigenvectors obtained from the REST2 simulation, and P max is the maximum of the probability density function, k B is the Boltzmann constant, and T is the temperature (300 K) of the unscaled replica from the REST2 simulation. The free energy basins pointing to various metastable states were also identified.
In addition, we also performed the tICA analysis (Ahalawat & Mondal, 2018; Naritomi & Fuchigami, 2011; Pérez‐Hernández et al., 2013) for each REST2 trajectory. This analysis has been previously used with replica‐exchange (RE) simulations to develop a tICA‐RE method for extracting slow order parameters in flexible molecular systems (Demuynck et al., 2018). We first evaluated different features (the torsion angles, coordinates, and interatomic distances of the backbone atoms in PDE5) using scores based on the variational approach for Markov processes (VAMP2) (Noé & Clementi, 2015; Wu & Noé, 2019). We identified the backbone torsion angles as having a higher score than the other features. Accordingly, we performed tICA using the backbone torsion angles as a feature with a lag‐time of 1 ns. We used the MDTraj python package (McGibbon et al., 2015) for computing the angles, coordinates, and distances used as various features, and the pyEMMA (Scherer et al., 2015) package for evaluating the VAMP2 scores and for performing tICA.
The analyses of conventional MD trajectories were performed using GROMACS built‐in utilities. The root mean squared deviation (RMSD) was calculated for the backbone atoms of the protein, taking the initial structure as a reference. The root mean squared fluctuation (RMSF) per residue was calculated for the C α atoms of the PDE5 residues for each MD trajectory, taking the initial structure as a reference. RMSF was calculated to monitor the flexibility of each residue, in particular the α14 helix and the H‐loop residues.
Moreover, to probe the motion of the α14 helix, the angle () between the center of mass of the C α atoms of three groups of residues (group 1: Arg794, Lys795, and Glu796), (group 2: Arg777, Ile778, and Ala779), and (group 3: Leu727, Tyr728, and Ile729) was calculated (Figure S2A). Likewise, to monitor the motion of the H‐loop, the angle between the C α atoms of the residues Asp764, Ser668, and Ala823 () was calculated (Figure S2B).
All hydrogen bonds (H‐bonds) were calculated using the hydrogen bond donor‐acceptor interatomic distance criterion of 3.5 Å and the hydrogen–donor–acceptor angle criterion of 30°. The salt bridges were calculated via VMD (Humphrey et al., 1996) by using a distance cutoff of 5 Å between any of the oxygen atoms for acidic residues and the nitrogen atoms for basic residues. All images were rendered using VMD (Humphrey et al., 1996) and Chimera (Pettersen et al., 2004).
The evolutionary conservation of residues participating in key interactions was analyzed using the ConSurf webserver (https://consurf.tau.ac.il/consurf_index.php) (Ashkenazy et al., 2016; Chorin et al., 2019). This webserver provides the evolutionary conservation of protein residues on the basis of HMMER as the homolog search algorithm, multiple sequence alignment, and phylogenetic analysis (Ashkenazy et al., 2016; Chorin et al., 2019). The residues are classified based on the degree of conservation from 0 (highly variable) to 9 (highly conserved) (Chorin et al., 2019).
2.4. WT‐MTD simulations
To estimate the free energy changes associated with the inward/outward transitions in the α14 helix, we performed WT‐MTD simulations (Barducci et al., 2008; Laio & Parrinello, 2002; Sharawy et al., 2022; Valsson et al., 2016). We selected three collective variables (CVs): the defining the inward and the outward state of the α14 helix (CV1), the helicity of the residues of the H‐loop (CV2, defined by ALPHARMSD [Pietrucci & Laio, 2009] keyword, as implemented in PLUMED [Bonomi et al., 2019]), and the interactions between the nitrogen and oxygen atoms of the H‐loop and the α14 helix defined by the coordination numbers (CV3), with a cutoff of 4 Å. The helicity of the H‐loop (residues 659–579) was incorporated to sample the folding and unfolding of α8′ and α8″ helices, taking the structure of the H‐loop with folded α8′ and α8″ helices in the avanafil‐bound PDE5 structure (PDB:6L6E) as a reference. The three‐dimensional Gaussians were deposited with a width of 1° (CV1), 0.05 (CV2), and 0.2 (CV3). We used a Gaussain height of 0.28 kcal mol−1. The Gaussian bias was deposited at every 1 ps with a biasfactor of 20. We performed WT‐MTD simulation for the apo (300 ns) and evodiamine‐bound (200 ns) systems to observe multiple inward/outward transitions of the α14 helix.
3. RESULTS
During the initial 100 ns equilibration, we observed that the PDE5 structures in three different forms (apo, evodiamine‐bound, and avanafil‐bound) showed stable RMSD profiles (~1 Å), and minor fluctuations (1–2 Å) in the H‐loop, and the α14 helix motifs (traces of RMSD and RMSF values shown in Figure S3). Using these equilibrated structures, we performed REST2 simulations for PDE5 in each of the three states. To monitor the conformational dynamics of the structural motifs in the catalytic site of PDE5, we also performed the PCA and tICA analyses on conformations generated via REST2 simulations. Apart from the fluctuations in the H‐loop, as reported in previous studies (Pattis et al., 2019; Zhang et al., 2020), we also observed a significant flexibility in the α14 helix, which is a key structural motif near the catalytic site of PDE5.
3.1. Conformational dynamics of structural motifs in the catalytic site of PDE5
We performed the PCA to identify significant conformational changes near the catalytic site of PDE5 in the apo and inhibitor bound states of PDE5. In Figure 2, for each of the three states, we show the free energy profile projected along the first and second principal components (PC1 and PC2) as well as the structures corresponding to the metastable states observed in each free energy profile. For the apo system, we identified four metastable states (labeled A1, A2, A3, and A4) and analyzed their representative structures (Figure 2). The structures corresponding to the metastable states in the apo form indicate movements in the α14 helix, as quantified by the angle (), besides the fluctuations in the H‐ and M‐loops of the catalytic site (Figure 2). On the basis of the PDE5 crystal structures, we characterized the θ H values above 60° as the outward state of the α14 helix, and below 60° as the inward state of the α14 helix.
FIGURE 2.
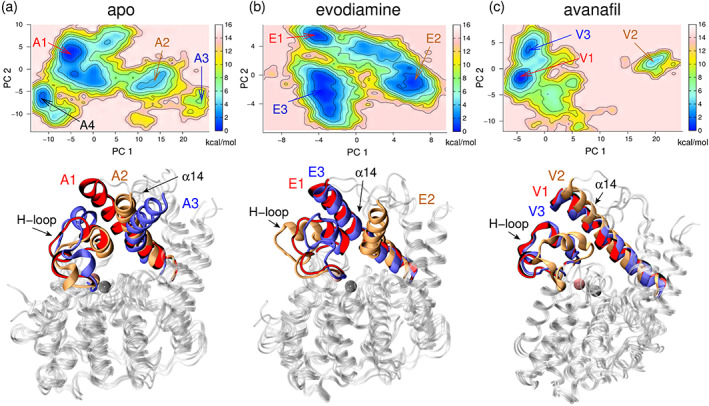
The free energy surface and the structures corresponding to the metastable states. (Top panel) The free energy surface and the metastable states are labeled for each of the three PDE5 states (apo, evodiamine‐bound, and avanafil‐bound). (Lower panel) The representative structures of PDE5 corresponding to the metastable states are shown in cartoon representations. The conformations of the H‐loop and the α14 helix in each metastable state are uniquely colored and shown in cartoon representations. In the free energy surface of the PDE5‐apo form (a), four metastable states are labeled: A1 (red), A2 (orange), A3 (blue), and A4 (black). The PDE5 structure corresponding to the A1 (red), A2 (orange), and A3 (blue) states are shown, and the structure of the A4‐state is similar to the A1‐state (see Figure S4D). In the free energy surface of the PDE5‐evodiamine form (b), three metastable states are shown: E1 (red), E2 (orange), and E3 (blue). In the free energy surface of PDE5‐avanafil form (c), three metastable states labeled V1 (red), V2 (orange), and V3 (blue), are shown. The PDE5 structure of the V3‐state is similar to the V1‐state. The zinc (gray) and the magnesium (pink) ions, located in the catalytic site, are shown as spheres.
In the apo system, the structure corresponding to the metastable state A1 showed an outward (θ H = 75°) orientation of the α14 helix, similar to the α14 helix orientation in the substrate or inhibitor‐bound PDE5 crystal structures (Figure 2a, structural motifs shown in red, and Figure S4A–C). The A2‐state represents an intermediate state (θ H = 51°) between the inward and the outward conformations of the α14 helix (Figure 2a, structural motifs shown in orange). Whereas, the A3‐state represents the inward conformation (θ H = 40°) of the α14 helix (Figure 2a, structural motifs shown in blue). The A4‐state has an outward (θ H = 78°) conformation of the α14 helix, similar to the A1‐state, but with an unfolded α8″ helical motif in the H‐loop and some deviations in the M‐loop (Figure S4D).
Overall, along PC1, the α14 helix showed the inward and the outward conformational movement, whereas along PC2, minor fluctuations in the M‐loop and the H‐loop were observed (Figure S5). In particular, along PC1 the inward motion of the α14 helix is accompanied by the outward motion of the H‐loop (Figure S5A). Importantly, we observed that the movement of the α14 helix and the H‐loop triggers changes in the shape and the size of the catalytic site (see Section 3.5). Specifically, in the A1‐state, the outward conformation of the α14 helix provides an easy access to the catalytic site, whereas in the A3‐state, the inward conformation of the α14 helix occludes the catalytic site.
In the evodiamine‐bound state, we observed three metastable states termed as E1, E2, and E3 (Figure 2b). In the E1‐state, the α14 helix is in the outward conformation (θ H = 76°) (Figure 2b, structural motifs shown in red). However, in the E2‐state, the α14 helix is in an inward conformation (θ H = 37°) (Figure 2b, structural motifs shown in orange). The E3‐state is similar to the E1‐state in terms of the conformation of the α14 helix (θ H = 69°), but this state reveals flexibility in the H‐loop (Figure 2b, structural motifs shown in blue). In the E2‐state, the inward orientation of the α14 helix, similar to the A3‐state in the apo form, was observed. Overall, along PC1, we observed the inward movement of the α14 helix occluding the catalytic site, similar to the apo system.
For the avanafil‐bound system, we observed three metastable states (V1, V2, and V3) in the free energy profile (Figure 2c). In the PDE5 structure corresponding to the V1‐state, the outward orientation (θ H = 72°) of the α14 helix is similar (θ H = 75°) to the avanafil‐bound crystal structure of PDE5 (PDBID: 6L6E) (Figure 2c, structural motifs shown in red). In the V2‐state, the orientation of α14 helix (θ H = 63°) is outward as well (Figure 2c, structural motifs shown in orange). The V3‐state reveals orientations of the α14 helix and the H‐loop similar to the V1‐state (Figure 2c, structural motifs shown in blue). In the structures corresponding to the metastable states of the avanafil‐bound state, we observed fluctuations in the H‐ and M‐loops of the catalytic site, without any fluctuations in the α14 helix, in comparison to apo or evodiamine‐bound PDE5.
3.2. Time‐lagged independent component analysis
We first calculated the VAMP2 scores for various input features: the backbone torsion angles, the coordinates of the backbone atoms, and the interatomic distances between the backbone atoms (Figure S6). On the basis of the VAMP2 scores, we performed tICA using the backbone torsion angles as the input feature with a lag time of 1 ns. We note that the tICA analysis was performed on each REST2 trajectory which spanned a total timescale of 6.4 μs (200 ns/replica for 32 replicas). Then, we identified the metastable conformational states on the free energy surface (FES) projected along the first and second time‐lagged independent components (tIC1 and tIC2) (Figure 3). The conformational states observed in the FES projected along independent components (Figure 3) are distinctly identifiable along the tIC1 (three states, apo; four states, evodiamine‐bound; and three states, avanafil‐bound) and correspond to the peaks in the distributions of the time‐series data on the tIC1 (Figure S7). We also note that the tICA analysis was only used to identify the structural motifs undergoing slow conformational motions, but their transitions were independently explored using metadynamics simulations (vide infra).
FIGURE 3.
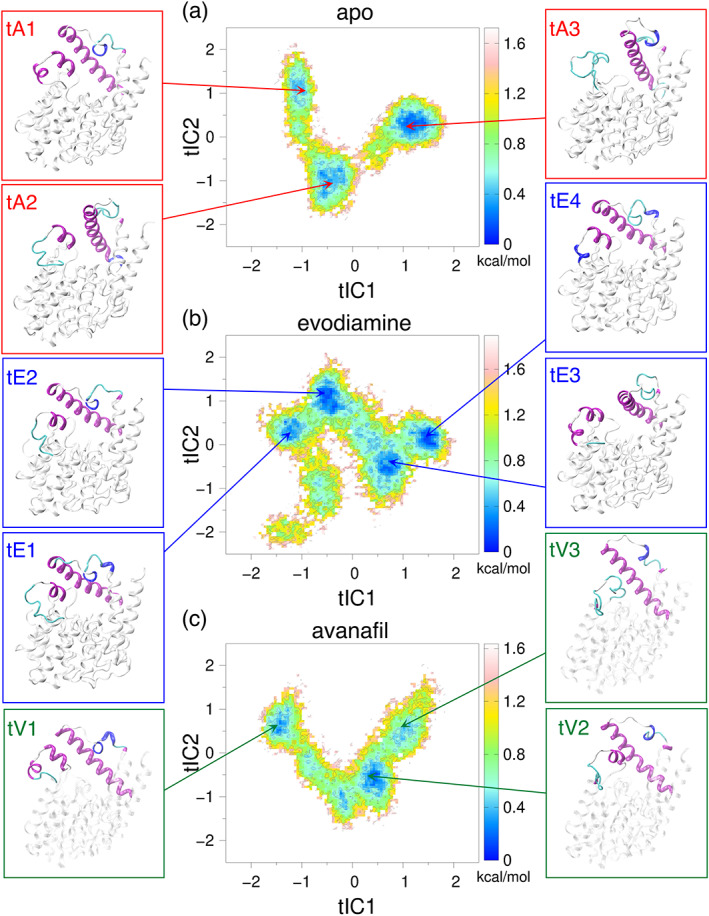
The time‐lagged independent component analysis (tICA) using backbone torsions as the input feature and a lag time of 1 ns. The free energy surface was projected along the first and second time‐lagged independent components (tIC1 and tIC2) to identify the key states for (a) apo, (b) evodiamine‐bound, and (c) avanafil‐bound systems. The representative structures corresponding to the metastable states are shown in colored boxes: apo (red boxes), evodiamine‐bound (blue boxes), and avanafil‐bound (green boxes). The secondary structure elements of the H‐loop, the α14 helix, and M‐loop are colored: α helix (magenta), 310 helix (blue), turn (gray), and coil (white). The remaining protein backbone is shown in each snapshot as a transparent white cartoon.
In the apo system, the tA1‐state represents the folded conformation (folded α8′ and α8″ helices) of the H‐loop (Figure 3a, and the representative structures in red boxes). The tA2‐state represents the partially folded conformation (folded α8′ helix and unfolded α8″ helix) of the H‐loop, whereas the tA3‐state represents the unfolded conformation (unfolded α8′ and α8″ helices) of the H‐loop. These tICA results suggest that the unfolding of the helices of the H‐loop is a slow process. In the tA1‐state, the outward orientation of the α14 helix was observed, but in the tA2‐state, both the inward and the outward orientations of the α14 helix were observed. Whereas in the tA3‐state, mostly the inward orientation of the α14 helix was observed (Figure 3a, and the representative structures in red boxes).
In the evodiamine‐bound system, the tE1‐state and the tE2‐state represent the partially folded (folded α8′ helix) conformation of the H‐loop (Figure 3b, and the representative structures in blue boxes). The tE1 and tE2 states differ in the folding of the M‐loop residues. Both the tE1 and tE2‐states represent the outward orientation of the α14 helix. The tE3‐state represents the folded conformation of the H‐loop (folded α8′ and α8″ helices) and the α14 helix in the inward conformation. Although the tE4‐state also represents the folded conformation of the H‐loop, the α14 helix is in its outward orientation (Figure 3b, and the representative structures in blue boxes).
In the avanafil‐bound system, the tV1‐state represents the folded (folded α8′ and α8″ helices) conformation of the H‐loop, the tV2‐state represents the partially folded (unfolded α8″ helix) conformation of the H‐loop, whereas the tV3‐state represents the unfolded (unfolded α8′ and α8″ helices) conformation of the H‐loop. In all these three states, we observed different conformations (folded, partially folded, and unfolded helices) of the H‐loop whereas the α14 helix was in the outward state (Figure 3c, and the representative structures in green boxes).
Overall, our tICA results showed that the folding/unfolding of the α8′ and α8″ helices of the H‐loop is a slow process, and it is coupled with the inward/outward motion of the α14 helix.
3.3. MD simulations based on the structures derived from the metastable states
Taking the initial structure corresponding to each of the metastable states, identified from the free energy profiles of PC1 and PC2 (Figure 2), we performed two independent (500 ns long) conventional all‐atom MD simulations (e.g., simulations starting from the structure corresponding to the A1‐state are termed as A1′ and A1″). In Figure 4, we show the probability distributions of the angle (Figure S2) to monitor the movement of the α14 helix (the values >60° represent the outward orientation, and the values <60° represent the inward orientation of the α14 helix).
FIGURE 4.
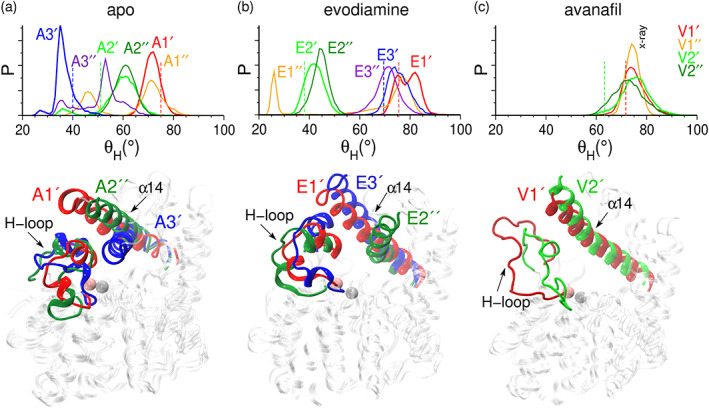
The distributions of and the structures corresponding to the mean values in distributions. (Top panels) The distributions of in different MD simulations starting from the structures corresponding to the metastable states of (a) apo, (b) evodiamine‐bound, and (c) avanafil‐bound systems. The value of in the initial structure corresponding to a given metastable state is shown as a dashed line. (Bottom panels) The conformations of the α14 helix and the H‐loop, in the representative structures from the selected states, are colored and labeled.
The orientation of the α14 helix in the structure corresponding to the A1‐state is outward (θ H = 75°, Figure 4a, red dashed line). The A1′ simulation initiated from the structure corresponding to the A1‐state primarily showed an outward orientation of the α14 helix (Figure 4a, the distributions and the structural motifs shown in red). Whereas, the A1″ simulation showed a transition to the inward state of the α14 helix (Figure 4a, the distributions shown in orange, Figures S8 and S9A). In the structure corresponding to the A2‐state, the α14 helix is in an intermediate conformational state (θ H = 51°, Figure 4a, green dashed line). The A2′ simulation initiated from this state showed transitions between the inward and the outward states of the α14 helix (Figure 4a, distribution in light green, and Figure S8), although the helix also remained in the outward state in the A2″ simulation (Figure 4a, the distributions and the structural motifs in dark green). The orientation of the α14 helix in the structure corresponding to the A3‐state is inward (θ H = 40°, Figure 4a, blue dashed line). The A3′ simulation initiated from the structure of the A3‐state primarily showed an inward state of the α14 helix (Figure 4a, the distributions and the structural motifs shown in blue). Whereas, the A3″ simulation showed transitions between the inward and the outward states of the α14 helix (Figure 4a, the distribution in violet, Figures S8 and S9B).
Overall, MD simulations initiated from the representative structures corresponding to the metastable states (A1, A2, and A3) of the apo form revealed that the α14 helix can readily make transitions between the inward and the outward states. Moreover, in the A1″ and A2′ simulations, an outward to inward transition in the α14 helix is coupled with the outward motion of the H‐loop (see the time traces of values in Figure S8, and the α14 helix/H‐loop structures in Figure S9A). Importantly, in the A3″ simulation, we observed that the inward to the outward transition of the α14 helix is in conjunction with the inward movement of the H‐loop (see the time traces of values in Figure S8 and the α14 helix/H‐loop structures in Figure S9B). In addition, the inward movement of the H‐loop is driven by the unfolding of the α8′ and α8″ helical motifs within the H‐loop. The unfolding of these small helices is followed by the inward movement of the H‐loop, which keeps the α14 helix in the outward direction. We also analyzed the secondary structure profile of the H‐loop residues, and observed that the α8′ helix is stable in the A1′, A1″, A2′, and A2″ simulations (Figure S10). While, in the A3′ simulations, it is partially unfolded into a 310 helix, and it is completely unfolded in the A3″ simulation, thereby providing a higher flexibility to the H‐loop (Figure S10). Due to the unfolding of the α8′ helix, we observed a higher RMSF value for the residues in the H‐loop and in the α14 helix in the A3″ simulation (Figure S11A). Moreover, the unfolded conformation of the H‐loop observed in the A3″ simulation is similar to the conformation of the H‐loop present in the crystal structure of PDE5 in the apo state (PDB:2H40) (Figure S9).
We also performed two independent (each 500 ns long) MD simulations, starting with the structures corresponding to each of the three (E1, E2, and E3) states of the evodiamine‐bound PDE5. The orientation of the α14 helix in the structure corresponding to the E1‐state is outward (θ H = 76°, red dashed line). The E1′ simulation, which is initiated from the structure of the E1‐state, showed a stable outward conformation of the α14 helix (Figure 4b, the distributions and the structural motifs shown in red), whereas in the E1″ simulation, the α14 helix showed a transition to the inward state (Figure 4b, distributions in orange, and traces of values in Figure S12). The orientation of the α14 helix in the structure corresponding to the E2‐state is inward (θ H = 37°, green dashed line), and both simulations initiated from the structure of the E2‐state (E2′ and E2″) showed stable inward conformations of the α14 helix (Figure 4b, the distributions in green, and the distributions and the structural motifs in dark green, respectively). The orientation of the α14 helix in the structure corresponding to the E3‐state is outward (θ H = 69°, blue dashed line) and both simulations initiated from the structure of the E3‐state (E3′ and E3″) showed stable outward conformations of the α14 helix (Figure 4b, the distributions in blue, and the distributions and the structural motifs in violet, respectively). Overall, in the evodiamine‐bound simulations a stable inward orientation of the α14 helix, similar to the apo state, is observed. In the simulations initiated from the representative structures of the metastable states of the evodiamine‐bound state, the H‐loop and the α14 helix showed stable conformations (except in the E1″ simulation due to the inward transition of the α14 helix), as indicated by the RMSF values (Figure S11B). In addition, the α8′ helix located within the H‐loop remains folded, but the α8″ helix unfolds (Figure S13).
We further performed two independent MD simulations (each 500 ns long) starting from the structures corresponding to the V1 and V2 states of the avanafil‐bound PDE5. The orientation of the α14 helix in the structure corresponding to the V1‐state is outward (θ H = 72°, red dashed line), and both simulations (V1′ and V1″) started from this structure revealed stable outward orientations of the α14 helix (Figure 4c, distribution and structural motifs shown in red, and distribution shown in orange, respectively). Similarly, the orientation of the α14 helix in the structure corresponding to the V2‐state is outward (θ H = 63°, green dashed line), and both simulations starting from the structure corresponding to the V2‐state (V2′ and V2″) revealed stable outward orientations of the α14 helix (Figure 4c, distribution and structural motifs shown in green, and distribution shown in dark green, respectively). Overall, in simulations of the avanfil‐bound state, the α14 helix remained stable in an outward conformation. The stable orientation of the α14 helix is also evident from the lower RMSF values observed for the α14 helix and the M‐loop residues (Figure S11C). However, the H‐loop showed a higher flexibility, as revealed by the higher RMSF values of the residues located in this structural motif (Figure S11C). The flexibility of the H‐loop is driven by the unfolding of the α8′ and α8″ helices within the H‐loop, as observed in simulations labeled V1′ and V2″ (Figure S14).
3.4. Salt‐bridging interactions between the helical and the loop motifs
To further probe the interactions driving conformational changes in the α14 helix and the H‐loop, we analyzed the salt‐bridging and hydrogen‐bonding interactions between the α14 helix and the H‐loop (Figure 5 and Figure S15). In apo simulations (A1′ and A2″), we observed that the residues E793 or E796 in the α14 helix form stable salt‐bridging interactions with the residue R667 of the H‐loop (Figure 5a,d). In addition, several hydrogen bonds between the α14 helix and the H‐loop residues: E796:O ε –Y664:O η H, E793:O ε –S663:O γ H, and Q789:O ε –N661:N/N δ , further stabilize the α14 helix in its outward conformation (Figure S15). Collectively, these salt‐bridging and hydrogen‐bonding interactions keep the α14 helix and the H‐loop together, when the α14 helix is in an outward state. On disruption of these interactions, the α14 helix transitions to an inward state, where it is stabilized by the E796–K730 salt‐bridging interaction, as observed in simulations labeled A3′ and A3″ (Figure 5a). In addition, the salt‐bridging interactions (E780–K810 and D791–R807) between the α14 helix and the M‐loop residues, and within the M‐loop residues (D803–K809 and D803–K812) stabilize the α14 helix and the M‐loop (Figure 5a).
FIGURE 5.
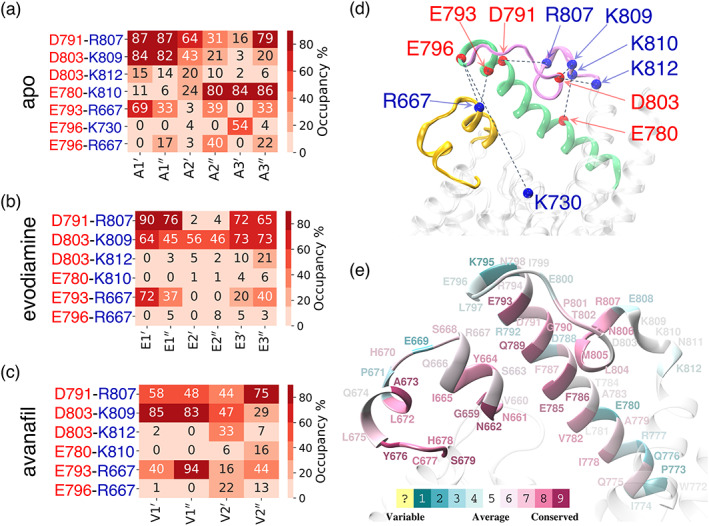
The occupancies of the salt‐bridging interactions between the H‐loop and the α14 helix residues and the participating residues are highlighted. The occupancies of the salt‐bridging interactions are shown for the (a) six independent simulations of the apo form, (b) six independent simulations of the evodiamine‐bound form, and (c) four independent simulations of the avanafil‐bound form. (d) The salt‐bridging interactions (black dotted lines) between the α14 helix (green), the H‐loop (yellow), and the M‐loop (purple) are shown. The C α atoms of the acidic residues (red spheres) and of the basic residues (blue spheres) are shown. These interactions stabilize the structural motifs surrounding the catalytic site and mediate the inward and the outward conformational transition of the α14 helix. (e) The color coded conservation scores of the residues of the H‐loop and the α14 helix obtained from the Consurf webserver (Ashkenazy et al., 2016; Chorin et al., 2019) are also depicted on the PDE5 structure.
The E793–R667 salt‐bridging interactions between the α14 helix and the H‐loop residues, stabilizing the α14 helix in an outward orientation, were observed for the evodiamine‐bound PDE5 (Figure 5b). The salt‐bridging interactions (E796–R667 and E793–R667) between the α14 helix and the H‐loop residues, stabilizing the α14 helix in an outward conformation, were also observed in the avanafil‐bound PDE5, in all four conventional MD simulations (Figure 5c).
In addition, we also analyzed the conservation of the residues of the H‐loop and the α14 helix using Consurf webserver (Figure 5e and Figure S16). The results showed that the α14 helix residues facing the catalytic site (viz., E793, D791, Q789, E785, and F786) are highly conserved. Three of these residues (E793, D791, and Q789) in the α14 helix and the residues R667, Y664, and N661 (α8′ helix) that participate in salt‐bridging and hydrogen‐bonding interactions are also well conserved. We observed that the residue E796 on the C‐terminus of the α14 helix is evolutionary variable but participates in salt‐bridging interactions. In addition, in the H‐loop, the residues 668–671 between the α8′ and α8″ helices are evolutionary variable, whereas the residues within the α8′ and α8″ helices are evolutionary conserved. This is consistent with the importance of folding/unfolding of the α8′ and α8″ helices in the coordination of conformational changes between the α14 helix and the H‐loop.
3.5. Water content within the binding pocket
To probe the water content near the binding pocket, we calculated the number of water molecules (N w) within 8 Å of the selected atoms (Asp764:O or Leu765:C γ or ILE768:C γ ) in the catalytic site of PDE5 (Figure 6 and Figure S17). We observed that in the outward state of the α14 helix (in simulations labeled A1′ and A1″) on average ~20 water molecules are present within the catalytic site, and the inward transition of the α14 helix (e.g., in the A1″ simulation, after 300 ns), decreases the average number of water molecules to ~14 (Figure 6, blue traces and representative structures in the blue boxes). Likewise, in the inward state of the α14 helix (in the A3′ and A3″ simulations), the catalytic site of PDE5 is nearly closed and only ~12 water molecules are present. However, when the α14 helix moves to an outward state (in the A3″ simulation), the number of water molecules occupying the catalytic site increases up to ~20 (Figure 6, red traces and representative structures in red boxes).
FIGURE 6.
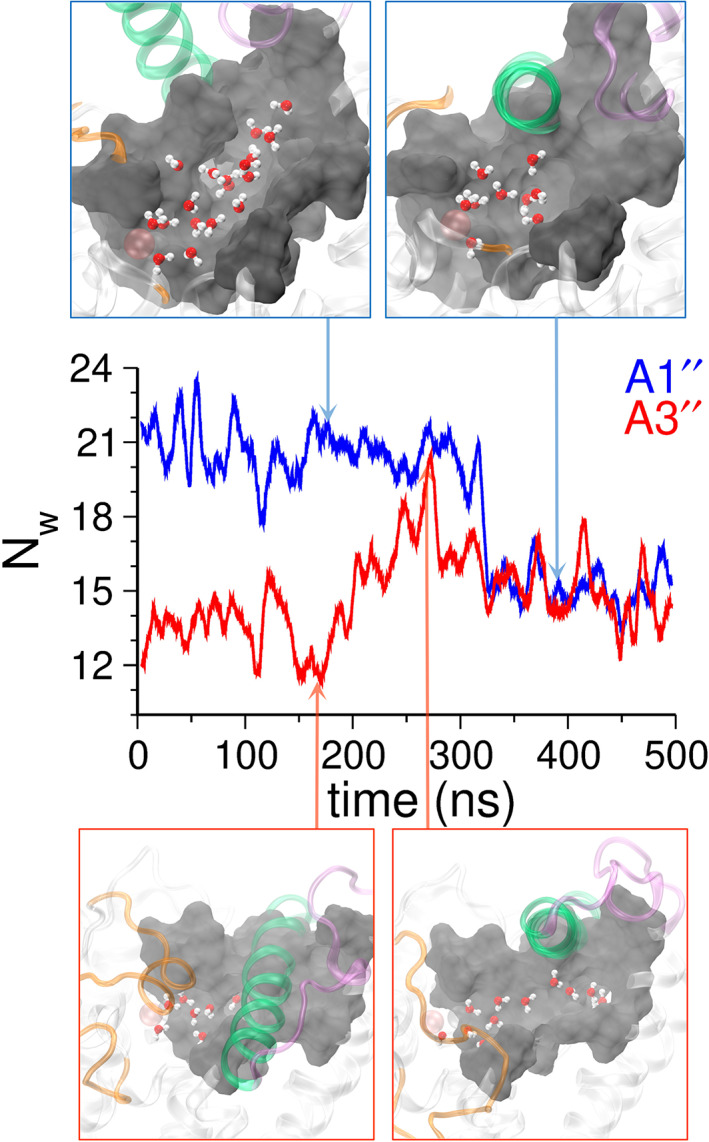
The number of water molecules (N w) in the catalytic site of PDE5. N w was calculated based on the number of water molecules within 8 Å of the Asp764:O or Leu765:C γ or ILE768:C γ atoms of the residues in the PDE5 catalytic site. Shown are the traces of N w for the A1″ (blue) and A3″ (red) simulations. In A1″ simulation, the α14 helix makes a transition from an outward (N w = ~20) to an inward state (N w = ~14). The representative structures highlighting the α14 helix (green) in the outward state and the inward state are shown in blue boxes. In the A3″ simulation, the inward state of the α14 helix has inaccessible catalytic site (N w = ~12). However, due to the complete unfolding of the H‐loop (yellow) and the outward motion of the α14 helix, the catalytic site of PDE5 opens and N w increases (~20). In the catalytic site of PDE5, the H‐loop (yellow), the α14 helix (green), and the M‐loop (purple) are shown in cartoon representations, and the water molecules are shown in CPK representations (oxygen atoms in red and hydrogen atoms in white). The zinc (gray) and magnesium (pink) ions are shown as spheres. The N w traces of all apo and evodiamine‐bound simulations are shown in Figure S17.
In the evodiamine‐bound simulations representing the outward state of the α14 helix, as in E1′ and E1″ simulations (Figure S17, red and blue traces), the N w value is ~18, but the transition of this helix to the inward state decreases the N w value (~10). In the E2′ and E2″ simulations representing the inward state of the α14 helix (Figure S17, red and blue traces), the N w value is between 12 and 15, indicative of a contracted catalytic site. Overall, in the outward state of the α14 helix, where the catalytic site is open, more number of water molecules are present (N w = ~20), whereas in the inward state of the α14 helix, where the catalytic site is contracted, the water content decreases (N w = ~12).
3.6. Interactions of evodiamine and avanafil with PDE5
In all simulations of the evodiamine‐bound state of PDE5, His617:N δ H formed stable hydrogen bonds with the methoxy (O2) and the carbonyl oxygen (O1) atoms of evodiamine (Figure 7a and Figure S18). Moreover, other stable hydrogen bonds with the residues Asp563 and Asn614 were also observed. These hydrogen‐bonding interactions stabilize the evodiamine molecule in the allosteric pocket of PDE5. Moreover, the residues interacting with evodiamine (His617, Tyr612, Asn614, and Asp563) are evolutionary conserved residues in the PDE5 family (Figure S16). Zhang et al. (2020) reported that evodiamine binding is unique to PDE5 family, due to structural variation in the allosteric pocket in the other members of PDE family.
FIGURE 7.
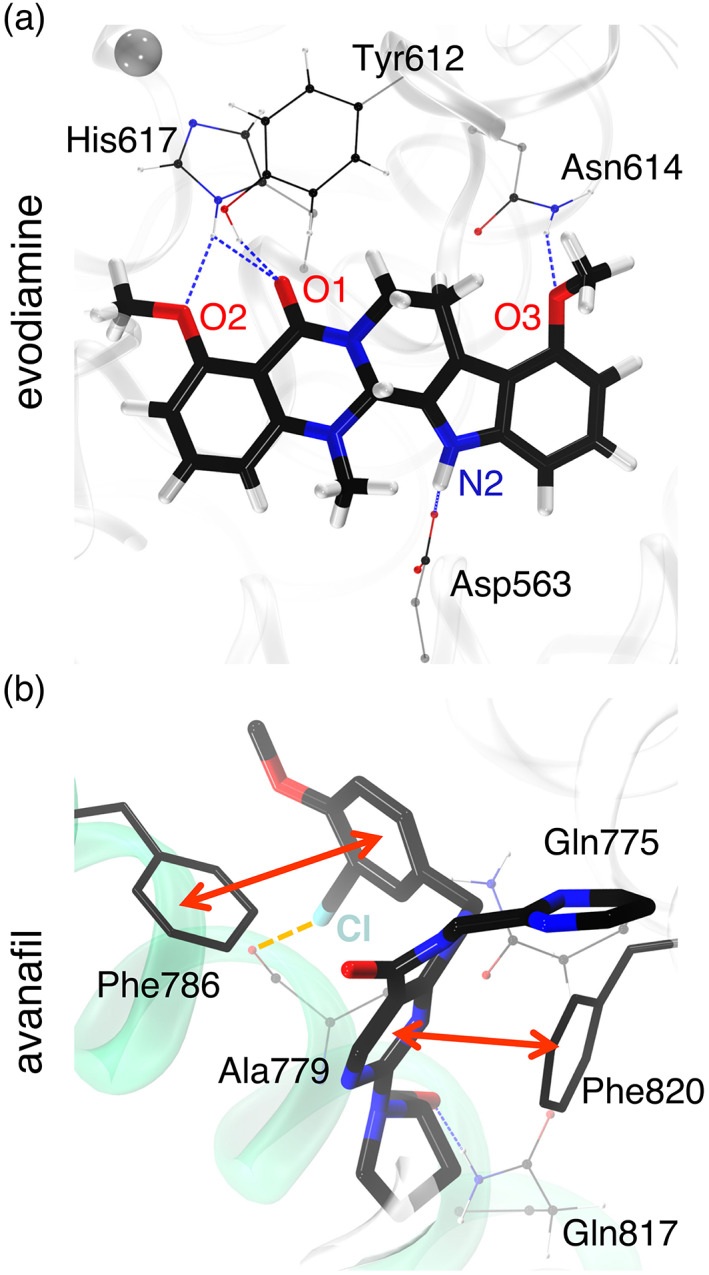
The PDE5 structure bound to evodiamine and avanafil. (a) PDE5 bound to evodiamine in the allosteric site. The hydrogen bonds formed with the residues His617, Tyr612, Asn614, and Asp563 are shown using blue dashed lines. The residues are shown in ball and stick representations, and the evodiamine molecule is shown in a licorice representation. (b) PDE5 bound to avanafil (licorice representation) in the catalytic site. The π–π interactions with the residues Phe786 and Phe820 are shown via red arrows. The halogen bond between avanafil:Cl and Ala:779:O atoms, is shown via an orange dashed line. The hydrogen bond with Gln817 is shown using a blue dashed line. The atoms are uniquely colored: black, carbon; red, oxygen; blue, nitrogen; white, hydrogen; and cyan, chlorine.
In all simulations of the avanafil‐bound state of PDE5, we observed that the avanafil molecule (Ava:O7 atom) makes stable hydrogen bonds with specific atoms in the residues Gln775:N ε and Gln817:N/O ε , implicated in control of the substrate specificity of PDE5 (Figure 7b) (Hsieh et al., 2020; Zhang et al., 2004). We also observed that the Cl—O halogen bond with the carbonyl oxygen of Ala779 was maintained (Figure 7b, orange dashed line and Figure S19A). Likewise, we observed that the Phe786 residue formed an edge to face π–π interaction with the 3‐chloro‐4‐methoxybenzyl moiety of the avanafil (Figure 7b, red arrow and Figure S19B). Overall, 3‐chloro‐4‐methoxybenzyl moiety makes a stable halogen bond and the π–π interaction with the residues in the α14 helix. In addition, the pyrimidinecarboxaminde ring of avanafil forms a stable π–π interaction with the Phe820 residue (Figure 7, red arrow and Figure S19C). The pyrimidinylmethyl group of avanafil is flexible because it is observed in multiple orientations. The residues Gln775, Gln817, Ala779, Phe776, and Phe820 interacting with avanafil are also evolutionary conserved residues in the PDE5 family (Figure S16).
3.7. Well‐tempered metadynamics
The PCA analysis revealed that the inward/outward motion in the α14 helix is an important mode (Figure 2), and the tICA results further showed that the folding/unfolding of the helices in the H‐loop is also an important mode (Figure 3) in the conformational dynamics of the catalytic site of PDE5. In addition, we observed the salt‐bridging and hydrogen‐bonding interactions between the H‐loop and the α14 helix residues participating in the conformational changes of structural motifs in the catalytic site (Figure 5). Taking insights from these observations, we selected three CVs including the angle (defining the α14 helix inward/outward motion), helicity of the residues of the H‐loop (defining the folding/unfolding of helices in the H‐loop), and the interactions between the H‐loop and the α14 helix, defined by the coordination numbers with a distance cutoff of 4 Å between the nitrogen and the oxygen atoms of the H‐loop and the α14 helix. The values of helicity above 4 define the folded state of the α8′ and α8″ helices, values between 2 and 4 define the folded state of the α8′ helix and unfolded state of α8″ helix, whereas values below 2 define the unfolded state of the α8′ and α8″ helices (Figure S20). Using these three CVs, we performed WT‐MTD simulations for the apo and evodiamine‐bound PDE5 systems, to estimate the free energy of the inward and the outward conformational states of the structural motifs in the catalytic site. We did not perform WT‐MTD simulations for avanafil‐bound PDE5, because the avanafil molecule occupies the catalytic site and restricts conformational transitions in the α14 helix.
In the WT‐MTD simulation of the apo system, we observed that the α14 helix transitioned from the outward state to the inward state (Figure S21A). The H‐loop also showed transitions between the folded and unfolded states, as indicated by the helicity CV traces (Figure S21B). Moreover, the number of interactions between the residues of the H‐loop and the α14 helix decreased in the inward state of the α14 helix (Figure S21C). We also observed that the inward state of the α14 helix is stabilized by π–π stacking between the residues Phe876 and Phe820 (Figure S21D). In the FES projected along the and helicity CVs, we observed a minimum for the inward state (Figure 8a, and the representative structure in red box) and another minimum for the outward state (Figure 8a, and the representative structure in blue box). Similarly, in the FES projected along the and interactions CVs, we observed a minimum for the inward state (Figure S22A, and the representative structure in red box) and another minimum for the outward state (Figure S22A, and the representative structure in blue box). For the apo system, the free energy barrier to transitions between the inward and the outward states is within 6 kcal mol−1 (Figure 8a). The free‐energy difference between the inward and the outward conformational states is ~−3 kcal mol−1, showing that the inward state is preferred in the apo system (Figure 8a).
FIGURE 8.
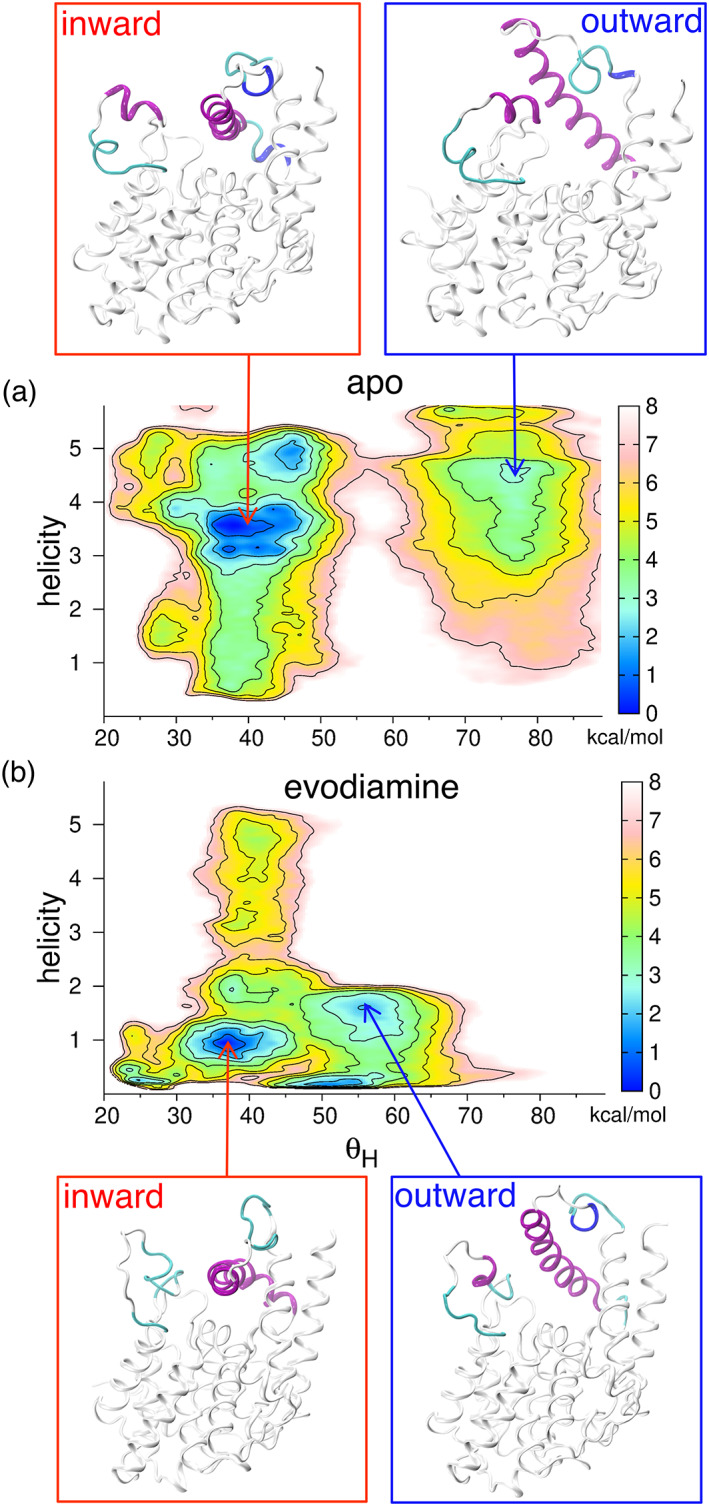
Two‐dimensional free energy surfaces obtained from well‐tempered metadynamics simulations. (a) For the apo system, the minimum for the inward state (the representative structure in red box) and another minimum for the outward state (and the representative structure in blue box) of the α14 helix are shown. (b) For the evodiamine‐bound system, the minimum for the inward state (and the representative structure in red box) and another minimum for the outward state (and the representative structure in blue box) of the α14 helix are shown. The free energy contours are drawn at every 1 kcal mol−1. Color bar indicates the scale of the free energy surface (lower, blue; higher, pink).
In the WT‐MTD simulation of the evodiamine‐bound system, we observed inward/outward conformational transitions in the α14 helix (Figure S23A), and the folding/unfolding transitions in the H‐loop, as seen from the helicity plot (Figure S23B). In addition, we also observed that the interactions between the residues of the H‐loop and the α14 helix were lost in the inward state of the α14 helix, whereas when the α14 helix moves outward, the residues of the H‐loop interact with the residues of the α14 helix (Figure S23C). We observed that the inward state of the α14 helix is stabilized by the π–π stacking interactions between the residues Phe876 and Phe820 (Figure S23D). In the FES projected along the and helicity CVs, we observed a minimum for the inward state (Figure 8b, and the representative structure in red box) and another minimum for the outward state (Figure 8b, and the representative structure in blue box). Likewise, in the FES projected along the and interactions CVs, we observed a minimum for the inward state (Figure S22B, and the representative structure in red box) and another minimum for the outward state (Figure S22B, and the representative structure in blue box). The free‐energy difference between the inward and outward conformational states is ~−2 kcal mol−1, which indicates that the inward conformation is favored in the evodiamine‐bound state (Figure 8b).
4. DISCUSSION
This study for the first time has revealed the dynamic inward and outward movements of the α14 helix in the PDE5 apo state (Figure 2a) that are coupled to the flexible H‐ and M‐loops whose conformational dynamics had previously been inferred from static crystal structures (Wang et al., 2007). We also determined that relatively slow folding/unfolding of the transient α8′ and α8″ helices within the H‐loop (Figure 3a) are coupled with the inward/outward conformational dynamics of the 14 helix (Figure 4a; Figures S8 and S9). Free energy calculation indicates that in the apo state, the inward state of α14 helix is energetically favored (Figure 8a and Figure S22), assisted by the favorable π–π stacking interactions between the residues Phe786 and Phe820 (Figure 8a and Figure S21). Our results are consistent with a model in which the lower activity (“basal”) state of PDE5 reflects the predominance of the energetically favored inward conformation of the α14 helix coupled with the unfolded state of the α8′ and α8″ helices within the H‐loop which together results in restricted access to the active site of the enzyme. In the absence of allosteric activation of PDE5 by cGMP binding to its regulatory GAFa domain (Rybalkin et al., 2003), basal levels of cGMP hydrolysis likely result from the energetically unfavored transition to the outward conformation of the α14 helix that enable transient substrate access to the active site. The observation that the folding/unfolding of the α‐helical elements of the H‐loop is relatively slow (Figure 3a) may provide a structural explanation for the observation that pre‐incubation of substrate or PDE5 active site inhibitors can induce changes in inhibitor binding affinity and dissociation kinetics at the PDE5 active site (Blount et al., 2007). The “activated” form of PDE5 is represented by the folded α8′ and α8″ helices within the H‐loop and the outward conformation of the α14 helix stabilized by hydrogen bonding and salt‐bridging interactions with the H‐loop residues, similar to 5′‐GMP bound structure of PDE5 (PDB:1T9S).
In the evodiamine‐bound state of PDE5, we observed that the α14 helix retains its flexibility and can adopt an inward conformation thus restricting the access of cGMP to the catalytic site (Figures 4b and 6). The free energy calculations revealed that the inward conformation of the α14 helix is energetically favorable in comparison to the outward conformation (Figure 8b and Figure S22B). It has been previously suggested that the binding of evodiamine to the allosteric site in PDE5 prevents the substrate‐activity via an inward motion of the H loop, thus occluding the catalytic site of PDE5 (Zhang et al., 2020). However, our results suggest a model in which the binding of evodiamine promotes the energetically favored inward state of the α14 helix, in addition to the conformational changes in the H‐loop, which collectively restrict the access to the catalytic site. The energetically unfavored outward state of the α14 helix is likely responsible for the low activity in the evodiamine‐bound PDE5 (Zhang et al., 2020).
In the catalytic site occupied (i.e., avanafil‐bound) state of PDE5, the drug molecule stabilizes the α14 helix in an outward conformation (Figure 2c), whereas the H‐loop is conformationally dynamic. The results showed various conformational states of the H‐loop: an unfolded conformation (as in vardenafil‐bound PDE5 structure, PDB:1UHO), a folded α8″ helix conformation (as in sildenafil‐bound PDE5 structure PDB:2H42), and a folded α8′ and α8″ helices conformation (as in tadalafil and 5′‐GMP bound PDE5 structures PDB: 1XOZ and 1T9S, respectively). These results are consistent with a model in which occupancy of the active site by avanafil displaces the α14 helix into an outward conformation that is coupled with a more dynamic conformational ensemble of the H‐loop in which the α8′ and α8″ helical elements are in a more rapid ordered‐disordered equilibrium than is observed for the apo or evodiamine‐bound states of PDE5.
The conformational dynamics of several structural elements of the PDE5 catalytic domain reported in this study will enable future efforts to delineate the entire allosteric communication network leading from cGMP binding to the GAFa regulatory domain to the catalytic domain (specifically the dynamic α14 helix and H‐loop structural elements) that increase the catalytic rate of cGMP hydrolysis in the catalytic domain. Further, the mechanistic insights from this work will enable the rational design of novel allosteric inhibitors that can more precisely modulate PDE5 activity than is possible with conventional active site competitive inhibitors.
5. CONCLUSION
Overall, our results suggest that when the catalytic site is unoccupied (apo or allosteric inhibitor bound forms), the inward movement of the α14 helix occludes the catalytic site and keeps PDE5 in the inactive state. The α14 helix inward conformation is stabilized by the π–π stacking interactions between the residues Phe786 and Phe820. Although the inward state of the α14 helix is energetically preferred, the transition to the outward state is possible in coordination with the dynamics of the H‐loop, which is likely responsible for the low activity in the apo and evodiamine‐bound PDE5. The binding of cGMP to the GAFa domain likely promotes the conformational transition in the α14 helix to an outward state and the concomitant formation of the α8′ and α8″ helices within the H‐loop which stabilizes the outward state of α14 helix via interactions with the residues of H‐loop, thereby converting the PDE5 into an “activated” form (Blount et al., 2007; Corbin et al., 2009). In contrast, for the avanafil‐bound PDE5, the stable outward conformation of the α14 helix is observed with the dynamic conformational ensemble in the H‐loop. The α14 helix inward/outward transitions are mediated by the folding/unfolding of short helices in the H‐loop and the interactions between the H‐loop and the α14 helix residues (E793–R667, E796–R667, and E796–K730). We observed that the residues of the α8′ and α8″ helices in the H‐loop, and residues participating in interactions between the H‐loop and the α14 helix are evolutionary conserved. In summary, our data suggest that the inward and outward transitions of the α14 helix coupled with the folding/unfolding of short helices within the neighboring H‐loop, which alter the accessibility of the catalytic site, are likely responsible for the “basal” or the “activated” conformational states of PDE5. These mechanistic details of the conformational dynamics of the key structural motifs will assist in designing improved inhibitors of PDE5.
AUTHOR CONTRIBUTIONS
Shubhandra Tripathi: Conceptualization (equal); data curation (lead); formal analysis (lead); investigation (lead); methodology (lead); visualization (lead); writing – original draft (lead); writing – review and editing (equal). Rick H. Cote: Funding acquisition (supporting); writing – review and editing (equal). Harish Vashisth: Conceptualization (equal); funding acquisition (lead); project administration (lead); resources (lead); supervision (lead); writing – review and editing (equal).
CONFLICT OF INTEREST STATEMENT
The authors declare no conflicts of interest.
Supporting information
Data S1: Supporting Information
ACKNOWLEDGMENTS
We acknowledge the financial support provided by the National Institute of Health (NIH) through Grant Nos. R35GM138217 (Harish Vashisth), R01EY033403 (Rick H. Cote), and P20GM113131 (Rick H. Cote). We are grateful for computational support through the following resources: Premise, a central shared HPC cluster at UNH supported by the Research Computing Center, and Biomade, a heterogeneous CPU/GPU cluster supported by the NSF EPSCoR award (OIA‐1757371).
Tripathi S, Cote RH, Vashisth H. Coupling of conformational dynamics and inhibitor binding in the phosphodiesterase‐5 family. Protein Science. 2023;32(8):e4720. 10.1002/pro.4720
Review Editor: Nir Ben‐Tal
REFERENCES
- Abraham MJ, Murtola T, Schulz R, Páll S, Smith JC, Hess B, et al. GROMACS: high performance molecular simulations through multi‐level parallelism from laptops to supercomputers. SoftwareX. 2015;1–2:19–25. [Google Scholar]
- Ahalawat N, Mondal J. Assessment and optimization of collective variables for protein conformational landscape: GB1 β‐hairpin as a case study. J Chem Phys. 2018;149(9):094101. [DOI] [PubMed] [Google Scholar]
- Ahmed WS, Geethakumari AM, Biswas KH. Phosphodiesterase 5 (PDE5): structure‐function regulation and therapeutic applications of inhibitors. Biomed Pharmacother. 2021;134:111128. [DOI] [PubMed] [Google Scholar]
- Amadei A, Linssen ABM, Berendsen HJC. Essential dynamics of proteins. Proteins. 1993;17(4):412–425. [DOI] [PubMed] [Google Scholar]
- Ashkenazy H, Abadi S, Martz E, Chay O, Mayrose I, Pupko T, et al. ConSurf 2016: an improved methodology to estimate and visualize evolutionary conservation in macromolecules. Nucleic Acids Res. 2016;44(W1):W344–W350. [DOI] [PMC free article] [PubMed] [Google Scholar]
- Baillie GS, Tejeda GS, Kelly MP. Therapeutic targeting of 3′, 5′‐cyclic nucleotide phosphodiesterases: inhibition and beyond. Nat Rev Drug Discov. 2019;18(10):770–796. [DOI] [PMC free article] [PubMed] [Google Scholar]
- Barducci A, Bussi G, Parrinello M. Well‐tempered metadynamics: a smoothly converging and tunable free‐energy method. Phys Rev Lett. 2008;100(2):020603. [DOI] [PubMed] [Google Scholar]
- Berendsen HJC, Postma JPM, van Gunsteren WF, DiNola A, Haak JR. Molecular dynamics with coupling to an external bath. J Chem Phys. 1984;81(8):3684–3690. [Google Scholar]
- Biswas KH, Sopory S, Visweswariah SS. The GAF domain of the cGMP‐binding, cGMP‐specific phosphodiesterase (PDE5) is a sensor and a sink for cGMP. Biochemistry. 2008;47(11):3534–3543. [DOI] [PubMed] [Google Scholar]
- Biswas KH, Visweswariah SS. Distinct allostery induced in the cyclic GMP‐binding, cyclic GMP‐specific phosphodiesterase (PDE5) by cyclic GMP, sildenafil, and metal ions. J Biol Chem. 2011;286(10):8545–8554. [DOI] [PMC free article] [PubMed] [Google Scholar]
- Blount MA, Zoraghi R, Bessay EP, Beasley A, Francis SH, Corbin JD. Conversion of phosphodiesterase‐5 (PDE5) catalytic site to higher affinity by PDE5 inhibitors. J Pharmacol Exp Ther. 2007;323(2):730–737. [DOI] [PubMed] [Google Scholar]
- Bonomi M, Bussi G, Camilloni C, Tribello GA, Banáš P, Barducci A, et al. Promoting transparency and reproducibility in enhanced molecular simulations. Nat Methods. 2019;16(8):670–673. [DOI] [PubMed] [Google Scholar]
- Bussi G, Donadio D, Parrinello M. Canonical sampling through velocity rescaling. J Chem Phys. 2007;126(1):014101. [DOI] [PubMed] [Google Scholar]
- Chorin AB, Masrati G, Kessel A, Narunsky A, Sprinzak J, Lahav S, et al. ConSurf‐DB: an accessible repository for the evolutionary conservation patterns of the majority of PDB proteins. Protein Sci. 2019;29(1):258–267. [DOI] [PMC free article] [PubMed] [Google Scholar]
- Corbin JD, Zoraghi R, Francis SH. Allosteric‐site and catalytic‐site ligand effects on PDE5 functions are associated with distinct changes in physical form of the enzyme. Cell Signal. 2009;21(12):1768–1774. [DOI] [PMC free article] [PubMed] [Google Scholar]
- de Groot BL, Amadei A, Scheek RM, van Nuland NAJ, Berendsen HJC. An extended sampling of the configurational space of HPr from E. coli . Proteins. 1996;26(3):314–322. [DOI] [PubMed] [Google Scholar]
- Demuynck R, Wieme J, Rogge SMJ, Dedecker KD, Vanduyfhuys L, Waroquier M, et al. Protocol for identifying accurate collective variables in enhanced molecular dynamics simulations for the description of structural transformations in flexible metal–organic frameworks. J Chem Theory Comput. 2018;14(11):5511–5526. [DOI] [PMC free article] [PubMed] [Google Scholar]
- Francis SH, Chu DM, Thomas MK, Beasley A, Grimes K, Busch JL, et al. Ligand‐induced conformational changes in cyclic nucleotide phosphodiesterases and cyclic nucleotide‐dependent protein kinases. Methods. 1998;14(1):81–92. [DOI] [PubMed] [Google Scholar]
- Frauenfelder H, Sligar SG, Wolynes PG. The energy landscapes and motions of proteins. Science. 1991;254(5038):1598–1603. [DOI] [PubMed] [Google Scholar]
- Gupta R, Liu Y, Wang H, Nordyke CT, Puterbaugh RZ, Cui W, et al. Structural analysis of the regulatory GAF domains of cGMP phosphodiesterase elucidates the allosteric communication pathway. J Mol Biol. 2020;432(21):5765–5783. [DOI] [PMC free article] [PubMed] [Google Scholar]
- Hsieh CM, Chen CY, Chern JW, Chan NL. Structure of human phosphodiesterase 5A1 complexed with avanafil reveals molecular basis of isoform selectivity and guidelines for targeting α‐helix backbone oxygen by halogen bonding. J Med Chem. 2020;63(15):8485–8494. [DOI] [PubMed] [Google Scholar]
- Huang X, Xu P, Cao Y, Liu L, Song G, Xu L. Exploring the binding mechanisms of PDE5 with chromeno[2, 3‐c]pyrrol‐9(2H)‐one by theoretical approaches. RSC Adv. 2018;8(53):30481–30490. [DOI] [PMC free article] [PubMed] [Google Scholar]
- Huang YY, Li Z, Cai YH, Feng LJ, Wu Y, Li X, et al. The molecular basis for the selectivity of tadalafil toward phosphodiesterase 5 and 6: a modeling study. J Chem Inf Model. 2013;53(11):3044–3053. [DOI] [PubMed] [Google Scholar]
- Humphrey W, Dalke A, Schulten K. VMD: Visual molecular dynamics. J Mol Graph. 1996;14(1):33–38. [DOI] [PubMed] [Google Scholar]
- Kapakayala AB, Nair NN. Boosting the conformational sampling by combining replica exchange with solute tempering and well‐sliced metadynamics. J Comput Chem. 2021;42(31):2233–2240. [DOI] [PubMed] [Google Scholar]
- Ke H, Wang H. Crystal structures of phosphodiesterases and implications on substrate specificity and inhibitor selectivity. Curr Top Med Chem. 2007;7(4):391–403. [DOI] [PubMed] [Google Scholar]
- Laio A, Parrinello M. Escaping free‐energy minima. Proc Natl Acad Sci U S A. 2002;99(20):12562–12566. [DOI] [PMC free article] [PubMed] [Google Scholar]
- Lee J, Cheng X, Swails JM, Yeom MS, Eastman PK, Lemkul JA, et al. CHARMM‐GUI input generator for NAMD, GROMACS, AMBER, OpenMM, and CHARMM/OpenMM simulations using the CHARMM36 additive force field. J Chem Theory Comput. 2016;12(1):405–413. [DOI] [PMC free article] [PubMed] [Google Scholar]
- Li Z, Wu Y, Feng LJ, Wu R, Luo HB. Ab initio QM/MM study shows a highly dissociated SN2 hydrolysis mechanism for the cGMP‐specific phosphodiesterase‐5. J Chem Theory Comput. 2014;10(12):5448–5457. [DOI] [PubMed] [Google Scholar]
- Liu P, Kim B, Friesner RA, Berne BJ. Replica exchange with solute tempering: a method for sampling biological systems in explicit water. Proc Natl Acad Sci U S A. 2005;102(39):13749–13754. [DOI] [PMC free article] [PubMed] [Google Scholar]
- Mark P, Nilsson L. Structure and dynamics of the TIP3P, SPC, and SPC/E water models at 298 K. J Phys Chem A. 2001;105(43):9954–9960. [Google Scholar]
- Martin‐Morales A. Vardenafil for the treatment of erectile dysfunction: an overview of the clinical evidence. Clin Interv Aging. 2009;4:463. [DOI] [PMC free article] [PubMed] [Google Scholar]
- Maurice DH, Ke H, Ahmad F, Wang Y, Chung J, Manganiello VC. Advances in targeting cyclic nucleotide phosphodiesterases. Nat Rev Drug Discov. 2014;13(4):290–314. [DOI] [PMC free article] [PubMed] [Google Scholar]
- McGibbon RT, Beauchamp KA, Harrigan MP, Klein C, Swails JM, Hernández CX, et al. MDTraj: a modern open library for the analysis of molecular dynamics trajectories. Biophys J. 2015;109(8):1528–1532. [DOI] [PMC free article] [PubMed] [Google Scholar]
- Mlýnský V, Janeček M, Kührová P, Fröhlking T, Otyepka M, Bussi G, et al. Toward convergence in folding simulations of RNA tetraloops: comparison of enhanced sampling techniques and effects of force field modifications. J Chem Theory Comput. 2022;18(4):2642–2656. [DOI] [PubMed] [Google Scholar]
- Morales A, Gingell C, Collins M, Wicker P, Osterloh I. Clinical safety of oral sildenafil citrate (VIAGRATM) in the treatment of erectile dysfunction. Int J Impotence Res. 1998;10(2):69–73. [DOI] [PubMed] [Google Scholar]
- Morris GM, Huey R, Lindstrom W, Sanner MF, Belew RK, Goodsell DS, et al. AutoDock4 and AutoDockTools4: automated docking with selective receptor flexibility. J Comput Chem. 2009;30(16):2785–2791. [DOI] [PMC free article] [PubMed] [Google Scholar]
- Naritomi Y, Fuchigami S. Slow dynamics in protein fluctuations revealed by time‐structure based independent component analysis: the case of domain motions. J Chem Phys. 2011;134(6):065101. [DOI] [PubMed] [Google Scholar]
- Noé F, Clementi C. Kinetic distance and kinetic maps from molecular dynamics simulation. J Chem Theory Comput. 2015;11(10):5002–5011. [DOI] [PubMed] [Google Scholar]
- Pattis JG, Kamal S, Li B, May ER. Catalytic domains of phosphodiesterase 5, 6, and 5/6 chimera display differential dynamics and ligand dissociation energy barriers. J Phys Chem B. 2019;123(4):825–835. [DOI] [PMC free article] [PubMed] [Google Scholar]
- Pérez‐Hernández G, Paul F, Giorgino T, Fabritiis GD, Noé F. Identification of slow molecular order parameters for Markov model construction. J Chem Phys. 2013;139(1):015102. [DOI] [PubMed] [Google Scholar]
- Pettersen EF, Goddard TD, Huang CC, Couch GS, Greenblatt DM, Meng EC, et al. UCSF chimera? A visualization system for exploratory research and analysis. J Comput Chem. 2004;25(13):1605–1612. [DOI] [PubMed] [Google Scholar]
- Pietrucci F, Laio A. A collective variable for the efficient exploration of protein Beta‐sheet structures: application to SH3 and GB1. J Chem Theory Comput. 2009;5(9):2197–2201. [DOI] [PubMed] [Google Scholar]
- Rybalkin SD, Rybalkina IG, Shimizu‐Albergine M, Tang XB, Beavo JA. PDE5 is converted to an activated state upon cGMP binding to the GAF A domain. EMBO J. 2003;22(3):469–478. [DOI] [PMC free article] [PubMed] [Google Scholar]
- Sakamoto T, Koga Y, Hikota M, Matsuki K, Murakami M, Kikkawa K, et al. The discovery of avanafil for the treatment of erectile dysfunction: a novel pyrimidine‐5‐carboxamide derivative as a potent and highly selective phosphodiesterase 5 inhibitor. Bioorg Med Chem Lett. 2014;24(23):5460–5465. [DOI] [PubMed] [Google Scholar]
- Samidurai A, Xi L, Das A, Kukreja RC. Beyond erectile dysfunction: cGMP‐specific phosphodiesterase 5 inhibitors for other clinical disorders. Annu Rev Pharmacol Toxicol. 2023;63(1):585–615. [DOI] [PubMed] [Google Scholar]
- Scherer MK, Trendelkamp‐Schroer B, Paul F, Pérez‐Hernández G, Hoffmann M, Plattner N, et al. PyEMMA 2: a software package for estimation, validation, and analysis of Markov models. J Chem Theory Comput. 2015;11(11):5525–5542. [DOI] [PubMed] [Google Scholar]
- Schuster KD, Mohammadi M, Cahill KB, Matte SL, Maillet AD, Vashisth H, et al. Pharmacological and molecular dynamics analyses of differences in inhibitor binding to human and nematode PDE4: implications for management of parasitic nematodes. PLoS One. 2019;14:1–24. [DOI] [PMC free article] [PubMed] [Google Scholar]
- Sharawy M, Pigni NB, May ER, Gascón JA. A favorable path to domain separation in the orange carotenoid protein. Protein Sci. 2022;31(4):850–863. [DOI] [PMC free article] [PubMed] [Google Scholar]
- Srivastava M, Mittal L, Kumari A, Agrahari AK, Singh M, Mathur R, et al. Characterizing (un)binding mechanism of USP7 inhibitors to unravel the cause of enhanced binding potencies at allosteric checkpoint. Protein Sci. 2022;31(9):e4398. [DOI] [PMC free article] [PubMed] [Google Scholar]
- Tripathi S, Srivastava G, Sharma A. Molecular dynamics simulation and free energy landscape methods in probing L215H, L217R and L225M βI‐tubulin mutations causing paclitaxel resistance in cancer cells. Biochem Biophys Res Commun. 2016;476(4):273–279. [DOI] [PubMed] [Google Scholar]
- Tripathi S, Srivastava G, Singh A, Prakasham A, Negi AS, Sharma A. Insight into microtubule destabilization mechanism of 3, 4, 5‐trimethoxyphenyl indanone derivatives using molecular dynamics simulation and conformational modes analysis. J Comput Aided Mol Des. 2018;32(4):559–572. [DOI] [PubMed] [Google Scholar]
- Udeoji DU, Schwarz ER. Tadalafil as monotherapy and in combination regimens for the treatment of pulmonary arterial hypertension. Ther Adv Respir Dis. 2012;7(1):39–49. [DOI] [PubMed] [Google Scholar]
- Valsson O, Tiwary P, Parrinello M. Enhancing important fluctuations: rare events and metadynamics from a conceptual viewpoint. Annu Rev Phys Chem. 2016;67(1):159–184. [DOI] [PubMed] [Google Scholar]
- Vanommeslaeghe K, Hatcher E, Acharya C, Kundu S, Zhong S, Shim J, et al. CHARMM general force field: a force field for drug‐like molecules compatible with the CHARMM all‐atom additive biological force fields. J Comput Chem. 2009;31(4):671–690. [DOI] [PMC free article] [PubMed] [Google Scholar]
- Vashisth H, Storaska AJ, Neubig RR, Brooks CL. Conformational dynamics of a regulator of G‐protein signaling protein reveals a mechanism of allosteric inhibition by a small molecule. ACS Chem Biol. 2013;8(12):2778–2784. [DOI] [PMC free article] [PubMed] [Google Scholar]
- Wang H, Liu Y, Huai Q, Cai J, Zoraghi R, Francis SH, et al. Multiple conformations of phosphodiesterase‐5. J Biol Chem. 2006;281(30):21469–21479. [DOI] [PubMed] [Google Scholar]
- Wang H, Ye M, Robinson H, Francis SH, Ke H. Conformational variations of both phosphodiesterase‐5 and inhibitors provide the structural basis for the physiological effects of vardenafil and sildenafil. Mol Pharmacol. 2007;73(1):104–110. [DOI] [PMC free article] [PubMed] [Google Scholar]
- Wang L, Berne BJ, Friesner RA. On achieving high accuracy and reliability in the calculation of relative protein–ligand binding affinities. Proc Natl Acad Sci U S A. 2012;109(6):1937–1942. [DOI] [PMC free article] [PubMed] [Google Scholar]
- Wang L, Friesner RA, Berne BJ. Replica exchange with solute scaling: a more efficient version of replica exchange with solute tempering (REST2). J Phys Chem B. 2011;115(30):9431–9438. [DOI] [PMC free article] [PubMed] [Google Scholar]
- Wu H, Noé F. Variational approach for learning Markov processes from time series data. J Nonlinear Sci. 2019;30(1):23–66. [Google Scholar]
- Zhang KYJ, Card GL, Suzuki Y, Artis DR, Fong D, Gillette S, et al. A glutamine switch mechanism for nucleotide selectivity by phosphodiesterases. Mol Cell. 2004;15(2):279–286. [DOI] [PubMed] [Google Scholar]
- Zhang T, Lai Z, Yuan S, Huang YY, Dong G, Sheng C, et al. Discovery of evodiamine derivatives as highly selective PDE5 inhibitors targeting a unique allosteric pocket. J Med Chem. 2020;63(17):9828–9837. [DOI] [PubMed] [Google Scholar]
- Zoraghi R, Bessay EP, Corbin JD, Francis SH. Structural and functional features in human PDE5A1 regulatory domain that provide for allosteric cGMP binding, dimerization, and regulation. J Biol Chem. 2005;280(12):12051–12063. [DOI] [PubMed] [Google Scholar]
Associated Data
This section collects any data citations, data availability statements, or supplementary materials included in this article.
Supplementary Materials
Data S1: Supporting Information