Abstract
Quantitative differential phase-contrast (DPC) imaging is one of the commonly used methods for phase retrieval. However, quantitative DPC imaging requires several pairwise intensity measurements, which makes it difficult to monitor living cells in real-time. In this study, we present a single-shot quantitative DPC imaging method based on the combination of deep learning (DL) and color-encoded illumination. Our goal is to train a model that can generate an isotropic quantitative phase image (i.e., target) directly from a single-shot intensity measurement (i.e., input). The target phase image was reconstructed using a linear-gradient pupil with two-axis measurements, and the model input was the measured color intensities obtained from a radially asymmetric color-encoded illumination pattern. The DL-based model was trained, validated, and tested using thirteen different cell lines. The total number of training, validation, and testing images was 264 (10 cells), 10 (1 cell), and 40 (2 cells), respectively. Our results show that the DL-based phase images are visually similar to the ground-truth phase images and have a high structural similarity index (>0.98). Moreover, the phase difference between the ground-truth and DL-based phase images was smaller than 13%. Our study shows the feasibility of using DL to generate quantitative phase imaging from a single-shot intensity measurement.
1. Introduction
Quantitative phase imaging (QPI) is a powerful imaging technique that can retrieve phase information of a sample without any labeling (or staining) agents [1–3]. QPI has been used in many fields such as physiology, pharmacology, and cell biology and has shown promising results in a wide range of biomedical applications such as dynamic monitoring of cell membrane characteristics, investigations of morphological and biochemical changes of imaging cells, and drug screening and selection [1–3]. Today, several different QPI techniques have been developed, including holography [4], transport of intensity equation [5,6], differential phase contrast (DPC) [7,8] and Fourier ptychography [9,10]. Among these techniques, DPC seems to be a promising method for imaging living cells in vitro due to its rapid imaging acquisition, short reconstruction time, and good system stability.
In quantitative DPC, phase distribution can be retrieved by deconvolving the DPC image with the calculated phase transfer function (PTF) [8]. In general, the DPC image is obtained from intensity measurements of two complementary illumination patterns, and at least 2-axis measurements (i.e., 4 images) are required. To achieve real-time quantitative DPC imaging (>30 fps), several single-shot imaging techniques [11–13] based on the color-multiplexed illumination have been proposed. The price to pay is to reconstruct phase anisotropically [11], or significantly reduce system throughput [13]. In addition, these single-shot imaging methods assume no dispersion in the sample. However, the refractive index changes with wavelength. One recent study showed that single-shot quantitative DPC imaging could be achieved by using the Polarsens camera integrated with a polarisation filter mask [14]. However, in order to provide four separate polarisation-resolved images, the size of the phase image is cut in half.
Deep learning (DL) is a branch of machine learning that has been shown to be successful in many different fields including optical microscopy [15,16]. For example, DL was applied to optimize illumination pattern in QPI [17,18]. In addition, one previous study showed that DL had the ability to blindly restore the quantitative in-focus phase image from an out-of-focus intensity image [19]. One recent study showed the feasibility of using DL to generate one 12-axis reconstructed isotropic phase image from 1-axis reconstructed anisotropic phase image [20]. This indicates that the number of required intensity measurements can be reduced from 24 to 2. Thus, the DL-based method [20] is a two-shot quantitative DPC imaging method. Because the two intensity measurements obtained from two different pupil patterns require ∼1 second for changing the illumination pattern, the DL-based method [20] is difficult to achieve fast data acquisition (>30 fps). This means that a single-shot quantitative DPC imaging method is required. To our knowledge, it is still unknown whether DL has the ability to achieve single-shot quantitative DPC imaging.
In this study, our aim is to provide single-shot quantitative DPC imaging by using DL. Specifically, we build a DL-based model designed to generate one isotropic phase image from a single-shot intensity measurement. The input was the color intensity measurements obtained from a radially asymmetric color-encoded illumination pattern shown in [21]. The target was the phase image obtained using a linear-gradient pupil with two-axis measurements [22]. The DL-based model was trained, validated, and tested using thirteen different cell lines. To evaluate the performance of the proposed method, we calculated the structural similarity index (SSIM) [23] between the ground-truth and DL-based phase images. We also drew several regions of interest (ROIs) and computed the phase differences between the ground-truth and DL-based phase images.
2. Materials and methods
2.1. System setup and phase retrieval of quantitative DPC imaging
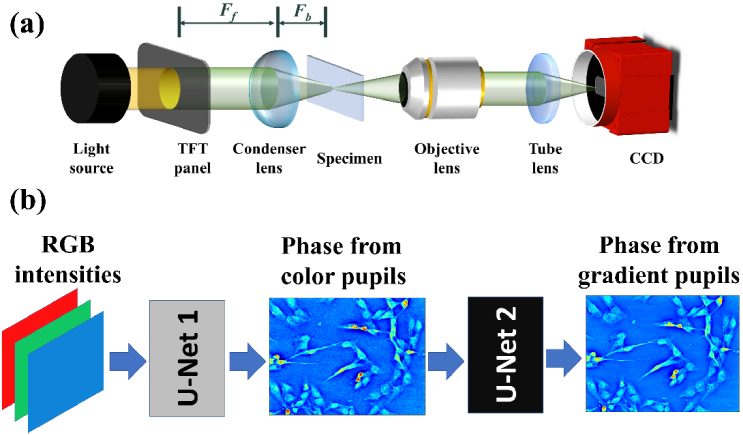
As shown in Fig. 1(a), the system setup of the quantitative DPC imaging is based on a commercial inverted microscope system (Olympus IX70). The light source is a tungsten halogen lamp. A thin-film transistor (TFT) panel (2.8′′ TFT Touch Shield) controlled by an Arduino control board (UNO32) is served as digital pupils for different illumination patterns [21,22]. The TFT panel module located at the front focal plane of the condenser lens has a pixel array of 240 320 with a pixel size of 180 μm. The radially asymmetric color-encoded illumination pattern [21] generated by the TFT panel is the illumination with wavelengths of 456, 532, and 603 nm. The specimen is placed at the back focal plane of a condenser (LA1951-ML, Thorlab). The front and back focal lengths of the condenser are 25.3 mm (Ff) and 17.6 mm (Fb), respectively. A objective lens with a magnification of 10X and a numerical aperture of 0.3 (LMPLN10XIR, Olympus) is used to image the sample, and the intensity measurement is performed by a color camera (Alvium 1800 U-500c) with 2.2 μm pixel size, 67 fps and 1944 2592 pixels.
Fig. 1.
(a) Schematic diagram of quantitative DPC microscopic setup. Illumination patterns displayed on a TFT panel were used as the pupil, which is located at the front focal (Ff) plane of the condenser lens, and the specimen is placed at the back focal ((Fb)) plane of the condenser. Color intensity images of different illumination patterns were captured by color camera. (b) Flowchart of DL-based single-shot quantitative DPC imaging. The color intensity images obtained from a radially asymmetric color-encoded illumination pattern were fed into the first U-Net model which was designed to generate phase images reconstructed using two radially asymmetric color-encoded illumination patterns. We trained the first U-Net model, fixed model parameters, and trained the second U-Net model for generating phase images reconstructed using a linear-gradient pupil with two-axis measurements.
Typically, the quantitative phase distribution can be retrieved by deconvolving the measured DPC image with the calculated PTF. In brief, based on the weak phase assumption, there is a linear relationship between the DPC image ( ) and the phase image ( ) in the spatial-frequency domain [8].
| (1) |
where denotes PTF and denotes the coordinates in the spatial frequency. To perform phase retrieval, we measure the pairwise intensity distribution ( , ) along the j-th axial direction with complementary illumination and calculate the DPC image ( ) as follows:
| (2) |
where denotes the spatial coordinates. The phase distribution in Eq. (1) can be retrieved by one-step deconvolution [8].
| (3) |
where denotes inverse Fourier transform, denotes complex conjugation of PTF along the j-th axial direction, J is the total number of paired measurements, and γ is the Tikhonov regularization parameter which is introduced to avoid singularity in PTF inversion.
2.2. DL-based single-shot quantitative DPC imaging
Figure 1(b) shows the flowchart of DL-based single-shot quantitative DPC imaging. The proposed DL-based model consists of two U-Net models [24]. The first U-Net model is designed to generate one phase image from its color intensity images. The color intensity images used as the input images were the raw images obtained from the color camera with one radially asymmetric color-encoded illumination pattern shown in [21], and the target image was the phase image reconstructed using two color intensity images (i.e., 2 measurements) obtained with two radially asymmetric color-encoded illumination patterns. We used the radially asymmetric color-encoded pattern simply because it can provide uniform illumination and three intensity distributions in different directions in a single shot. However, the phase image obtained from the color pupil may not be the optimal phase image. As a result, we design a second U-Net model that aims to generate the phase image reconstructed using the linear-gradient pupil with two-axis measurements [22]. The phase image obtained from the linear-gradient pupil was the target image of the second U-Net model. We trained the first U-Net model, fixed the parameters of the first U-Net model, and trained the second U-Net model.
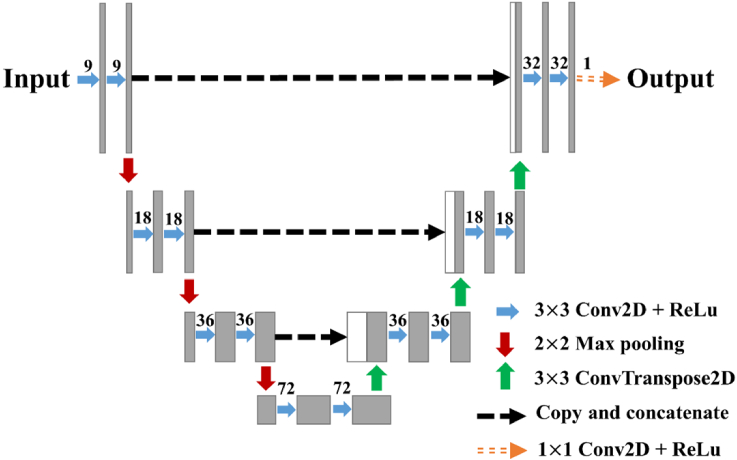
As shown in Fig. 2, the U-Net model consists of fifteen two-dimensional (2D) convolutional layers with a kernel size of 1 1 for the last convolutional layer and that of 3 3 for the remaining layers. The number of filters is 9, 9, 18, 18, 36, 36, 72, 72, 36, 36, 18, 18, 9, 9 and 1. Each 2D convolutional layer is followed by a rectified linear unit (ReLu) activation function. The U-Net model has three max-pooling layers with a pool size of 2 2 and three 2D transposed convolutional layers with a kernel size of 3 3 and stride of 2. The U-Net model includes three copy-and-concatenate operations that copy the extracted feature maps from the encoder and concatenate them to the decoder. Both the first and second U-Net models used the same architecture shown in Fig. 2.
Fig. 2.
The U-Net model. The right blue arrow represents a 2D convolutional layer with a kernel size of 3 3, followed by a ReLu activation function. The number shown at the top of each blue arrow denotes the number of filters. The downward arrow represents a max-pooling layer with a pool size of 2 2. The upward arrow represents a 2D transposed convolutional layer with a kernel size of 3 3 and stride of 2. The black dashed arrow indicates a copy and concatenate operation. The last layer is a 2D convolutional layer with a kernel size of 1 1, followed by a ReLu activation function
2.3. Data collection and pre-processing
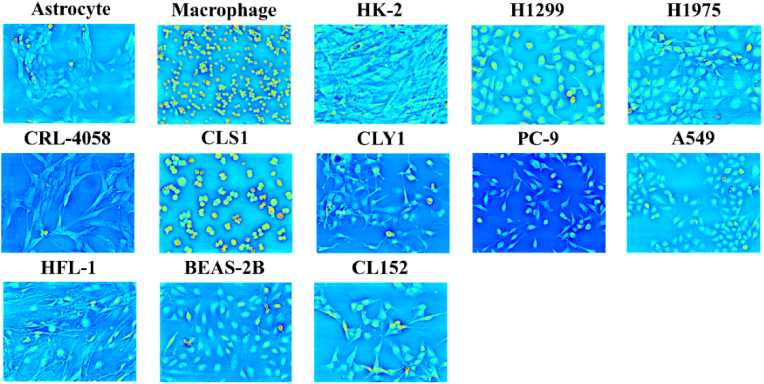
To evaluate the performance of the proposed method, we prepared thirteen different types of living cells: astrocyte, macrophage, HK-2, H1299, H1975, CRL-4058, CLS1, CLY1, PC-9, A549, HFL1, BEAS-2B, and CL152 (Fig. 3). HK-2 is a proximal tubular cell line derived from a normal human adult male kidney. H1299 and H1975 are cell lines isolated from the lungs of a nonsmoking female with non-small cell lung cancer. CRL-4058 is an hTERT-immortalized lung fibroblast cell, and CLS1 is a lung adenosquamous carcinoma cell line. CLY1, PC-9, and A549 are a lung adenocarcinoma cell line. HFL1 is a fibroblast cell line that was isolated from the lung of a normal embryo. BEAS-2B is a human non-tumorigenic lung epithelial cell line. CL152 is a lung squamous carcinoma cell line. The images of the first ten cell types were used for training the proposed DL-based model. The images of HFL1 were used as validation data. The images of the last two cell types (i.e. BEAS-2B and CL152) were used to test the performance of the trained DL-based model. The total number of training, validation, and testing images was 264, 10, and 40, respectively. To optimize the performance of the proposed DL-based model, there are several pre-processing steps. First, due to the presence of color leakage between the illumination source and color camera, a color-leakage correction algorithm was implemented to calibrate each color channel [12]. In brief, the color intensity measurement obtained from the color camera is modeled as [12]:
| (4) |
where is the intensity signal measured from the ith channel of the color camera, is the intensity signal measured from a single color under illumination in one color source, and MCL is a 3 3 pre-measuring color-leakage matrix. The element denotes the detector response of the color-i channel to the light of color j. In practice, the element of MCL can be obtained by measuring the signal in the ith channel of the color camera under the illumination of color i only. Once the MCL is experimentally obtained, the light intensity measurement at each color can be corrected by solving Eq. (4). Second, owing to inhomogeneous illumination, we record the background images that take DPC measurements without any sample [8]. Each color-calibrated intensity image was then divided by the corresponding background image (i.e. the image captured in a state of no object). Note that the color-leakage correction algorithm was also applied to the background images. Third, because of the presence of artifacts in the image margin, all input and target images were cropped to 1800 2400 pixels. Finally, the minimum and maximum values computed from all target images were used to normalized each target image to the range of 0 and 1. Similarly, all input intensity images were normalized by their minimum and maximum values. The pre-processing time was about 18 seconds that were mainly spent on correcting the color leakage.
Fig. 3.
Examples of phase images of thirteen different types of cells.
2.4. Model training and evaluation
In this work, the mean squared error was used as loss function to train each U-Net model. We used the Adam optimizer (beta1 = 0.9, beta2 = 0.999, epsilon = 10−8) [25] with the learning rate of 5 10−3 to minimize the loss function. The number of epochs was 500, and the batch size was set to 2. The best model was determined from the epoch with the lowest loss value over the full validation dataset. Model training and prediction were implemented using TensorFlow 2.8.0 and Python 3.8.10 on a workstation equipped with two NVIDIA GeForce RTX 3090 cards. The total training time of the studied two U-Net models was about 4 hours, and the inference time for predicting one phase image (1800 2400) from one color intensity image (1800 2400 3) was about 0.5 seconds.
To evaluate whether the DL-based model can generate phase image from single-shot color intensity measurements, the DL-based phase images (i.e. output of U-Net 2) were visually compared with the ground-truth phase images obtained from the linear-gradient pupil with two-axis measurements [22]. We also computed the SSIM value [23] between the ground-truth and DL-based phase images. To quantitatively evaluate the proposed method, we drew several ROIs and computed the phase differences between the ground-truth and DL-based phase images. Moreover, we compared our results with the phase images reconstructed using the two radially asymmetric color-encoded illumination patterns (i.e. 2 intensity measurements) [21].
3. Results and discussion
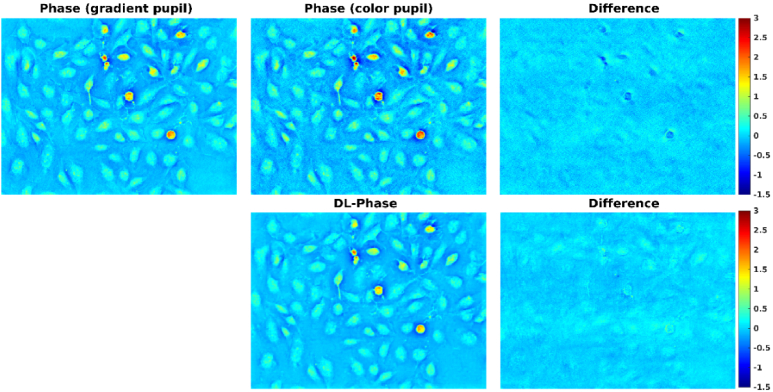
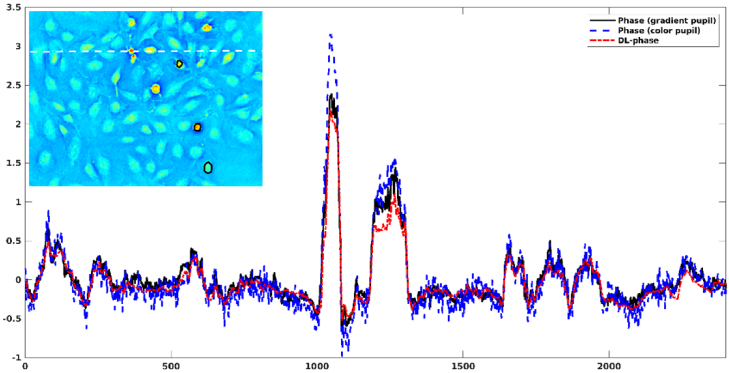
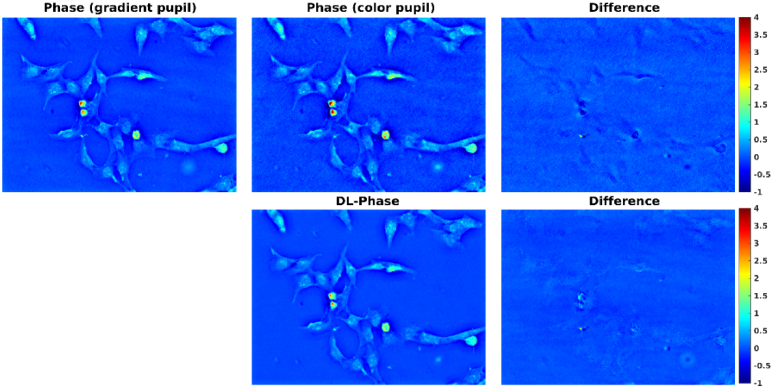
Figure 4 shows a comparison of BEAS-2B phase images obtained from gradient pupil (i.e. ground truth), color pupil, and DL. It can be observed that the DL-based phase image was visually similar to the ground-truth phase image. In contrast, the phase image obtained from color pupil appears noisier visually than both the ground-truth and DL-based phase images. We also found that the color-encoded illumination method tended to overestimate the phase values. Figure 5 shows the profile of BEAS-2B phase images obtained from gradient pupil, color pupil, and DL. Similar results can be observed. Table 1 summarizes the phase values of three ROIs for the BEAS-2B phase images obtained from gradient pupil, color pupil, and DL. A 10%∼13% error in predicting phase values was observed from the DL-based phase image as compared with the ground-truth phase image. However, the color-encoded phase image introduced a positive bias of 14%∼21%.
Fig. 4.
Comparison of BEAS-2B phase images obtained from gradient pupil (i.e. ground truth), color pupil, and DL.
Fig. 5.
Profiles (white dashed line) of BEAS-2B phase images obtained from gradient pupil (i.e. ground truth), color pupil, and DL. The black line represents the ROIs used for evaluating the phase difference.
Table 1. Phase values of three ROIs calculated from three BEAS-2B phase images obtained from gradient pupil (i.e. ground truth), color pupil, and DL.
| Phase from gradient pupil | Phase from color pupil | DL-based phase | |
|---|---|---|---|
| ROI1 | 1.90±0.12 | 2.17±0.24 | 1.71±0.09 |
| ROI2 | 1.31±0.14 | 1.57±0.16 | 1.14±0.09 |
| ROI3 | 0.44±0.17 | 0.54±0.18 | 0.40±0.10 |
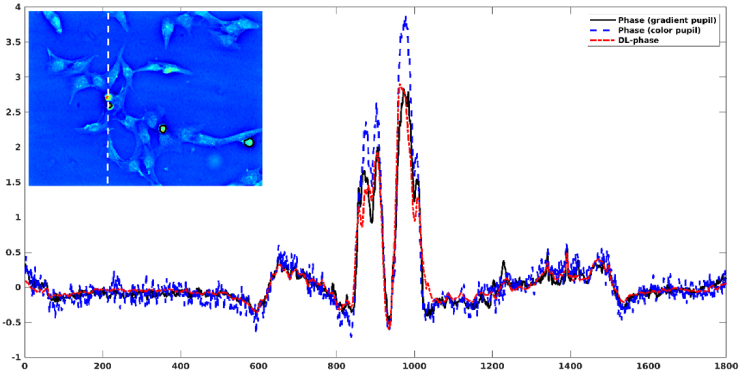
To further evaluate the model performance, the results of the other testing cell type were presented. Figure 6 shows a comparison of CL152 phase images obtained from gradient pupil, color pupil, and DL. Figure 7 shows the profile of CL152 phase images obtained from gradient pupil, color pupil, and DL. Table 2 summarizes the phase values of three ROIs for the CL152 phase images obtained from gradient pupil, color pupil, and DL. The phase difference between the ground-truth phase image and the DL-based phase image was -7%∼12%. In contrast, the color-encoded phase image had a positive bias of 15%∼34% in predicting phase values. Finally, we calculated the SSIM index between different phase images, and the mean value averaged over 40 testing images was presented. The mean SSIM value between the ground-truth phase image and the DL-based phase image was 0.9865 0.0013. In contrast, the mean SSIM value between the ground-truth phase image and the color-encoded phase image was 0.9417 0.0015. The results indicated that compared to the color-encoded phase image, the DL-based phase image was closer to the ground-truth phase image. Note that the DL-based phase images shown in Fig. 4–7 were the outputs of U-Net 2. The DL-based phase images obtained from U-Net 1 can be found in Supplement 1 (2.4MB, pdf) (Figs. S1 and S2).
Fig. 6.
Comparison of CL152 phase images obtained from gradient pupil (i.e. ground truth), color pupil, and DL.
Fig. 7.
Profiles (white dashed line) of CL152 phase images obtained from gradient pupil (i.e. ground truth), color pupil, and DL. The black line represents the ROIs used for evaluating the phase difference.
Table 2. Phase values of three ROIs calculated from three CL152 phase images obtained from gradient pupil (i.e. ground truth), color pupil, and DL.
| Phase from gradient pupil | Phase from color pupil | DL-based phase | |
|---|---|---|---|
| ROI1 | 2.60±0.33 | 3.48±0.37 | 2.77±0.21 |
| ROI2 | 1.02±0.24 | 1.18±0.23 | 0.90±0.16 |
| ROI3 | 1.50±0.39 | 1.90±0.50 | 1.46±0.32 |
As shown in Fig. 4 and 6, no obvious difference along any specific direction was observed. This indicates that the predicted phase image should be isotropic. Note that the target phase image reconstructed using a linear-gradient pupil with two-axis measurements was isotropic. The predicted phase image should be isotropic as well. To further evaluate whether the predicted phase image has isotropic resolution, we measured the full width at half maximum (FWHM) along the vertical, horizontal, and diagonal directions in a small and circular lesion. If the FWHMs of different directions are close, the phase image should be isotropic. As shown in Supplement 1 (2.4MB, pdf) (Fig. S3), the predicted phase image had similar FWHMs along different directions (i.e. horizontal FWHM = 4.50 , vertical FWHM = 5.46 , left diagonal FWHM = 4.36 , and right diagonal FWHM = 3.88 ). Note that the small lesion we evaluated may not be a perfect circle. We expect that the FWHMs of different directions may be slightly different. We also found that the FWHMs of the predicted phase image were close to those of the target phase image (i.e. horizontal FWHM = 4.60 , vertical FWHM = 5.83 , left diagonal FWHM = 5.38 , and right diagonal FWHM = 4.17 ). These results indicate that the predicted phase image should have isotropic resolution, but further evaluation is required.
The results showed that the two separate U-Net models performed well. However, it is possible to train an end-to-end network that performs the conversion from color intensity to phase. Based on our preliminary test, the two separate U-Net models performed better than the end-to-end network. This is because the end-to-end network not only performs the intensity-phase conversion, but also considers the effect of sample dispersion [11] and chromatic aberration [26] on the reconstructed phase image. Using only one neural network may obtain sub-optimal results. As a result, we implemented two U-Net models. The first U-Net model is designed to perform the conversion from intensity to phase, and the phase error caused by the sample dispersion and chromatic aberration is reduced by the second U-Net model. It should be noted that the two separate U-Net models had the same architecture. Based on our preliminary test, changing the model parameters (e.g. the number of filters, the kernel size, and the up-sampling and down-sampling operators) provided limited improvement.
Like the previous studies [11–13], our study proposed a single-shot quantitative DPC imaging method. The proposed DL-based method only required one intensity measurement for phase reconstruction. More importantly, the proposed method performed a task of intensity-to-phase translation. Our study is thus different from the previous study [20] that required two intensity measurements to perform the task of 1-axis to 12-aixs phase translation. Because the proposed method requires one intensity measurement, the fast data acquisition for quantitative DPC imaging is achievable and dependent on camera frame rate. This means that the proposed method allows data acquisition at the maximum frame rate of the camera (67 fps). Moreover, the inference time for predicting one phase image (1800 2400) from one color intensity image (1800 2400 3) was about 0.5 seconds. The inference time may be further reduced by using a powerful GPU card and optimizing the U-Net model. However, the time of data pre-processing (∼18 seconds per image) is the bottleneck for real-time quantitative DPC imaging. The high computational time of pre-processing was due to the pixel-by-pixel color-leakage correction. This problem exists not only in the proposed method, but also in the previous developed methods [11–13]. Parallel processing based a multi-core processor is one option to reduce the computational time of pre-processing. In fact, we observed that the color-leakage matrix (MCL) of each pixel was similar, and the coefficient of variation was less than 3%. This indicates that it is possible to perform color-leakage correction using the same color-leakage matrix. Therefore, the time of correcting color leakage can be reduced to about 0.05 seconds. The performance of the proposed DL-based method based on the fast color-leakage correction will be evaluated in our future work.
Our experimental results showed the feasibility of using DL to produce quantitative phase imaging from a single-shot intensity measurement. Despite these promising results, there is still room for improvement. First, the number of images used for model training was 264 which was small. The model performance may be further improved by increasing the number of training images. However, we cannot increase the number of training images because of large image size (i.e., 1800 2400) and limited GPU memory. Alternatively, we can use a patch-based training method to alleviate the memory problem. However, the patch-based method often suffers from obvious blocky artifacts. Second, we used color intensity images obtained from the radially asymmetric color-encoded illumination pattern [21]. This color-encoded pattern may not be the optimal color pattern. The results obtained from other color-multiplexed illumination patterns [11–13] should be evaluated. As also shown by previous studies [17,18], it is possible to apply DL to optimize the single-shot color illumination pattern. Third, most of our images were obtained from pulmonary cell lines. Although different lung cancer cell lines were evaluated, the generalization ability of the trained model should be further validated using unseen cell types. To improve the model’s generalization, increasing the number of different cell types is necessary.
4. Conclusion
We proposed a single-shot quantitative DPC imaging based on the combination of DL and color-encoded illumination. The color intensities measured from a radially asymmetric color-encoded illumination pattern were used as input to the DL-based model which was trained to generate isotropic quantitative phase imaging. This means that the DL-based model is designed to convert the single-shot intensity measurement into its corresponding phase image. The DL-based phase images were visually similar to the phase images obtained using the linear-gradient illumination with two-axis measurements. Our experimental results demonstrate that DL may be an alternative technique for providing single-shot quantitative phase imaging.
Acknowledgements
This work was supported by the following projects “Application of deep learning in light-sheet imaging and differential phase contrast imaging” with grant number: NTU-CC-112L892903, “Developing three-dimensional culture system to investigate tumourigenic vascular and extracellular matrix remodeling in pulmonary cancers” with grant number: NTU-CC-112L892906, “Design and development of multimodal high-resolution three-dimensional imaging for cancer studies” with grant number: NTU-CC-112L892902, “High-resolution imaging-based identification of phenotyping organoids exposure to environmental carcinogen to studying the tumorigenesis” with grant number: NTU-CC-112L892905 from National Taiwan University, Taiwan. This work was also supported by MOST 111-2635-E-002-001 from Ministry of Science Technology, Taiwan.
Funding
National Science and Technology Council10.13039/100020595 (MOST 111-2635-E-002-001); National Taiwan University10.13039/501100006477 (NTU-CC-112L892902, NTU-CC-112L892903, NTU-CC-112L892905, NTU-CC-112L892906).
Disclosures
The authors declare that there are no conflicts of interest.
Data availability
Data underlying the results presented in this paper are not publicly available but may be obtained from the authors upon reasonable request. See Supplement 1 (2.4MB, pdf) for supporting content.
Supplemental document
See Supplement 1 (2.4MB, pdf) for supporting content.
References
- 1.Park Y. K., Depeursinge C., Popescu G., “Quantitative phase imaging in biomedicine,” Nat. Photonics 12(10), 578–589 (2018). 10.1038/s41566-018-0253-x [DOI] [Google Scholar]
- 2.Cacace T., Bianco V., Ferraro P., “Quantitative phase imaging trends in biomedical applications,” Opt. Lasers Eng. 135, 106188 (2020). 10.1016/j.optlaseng.2020.106188 [DOI] [Google Scholar]
- 3.Nguyen T. L., Pradeep S., Judson-Torres R. L., Reed J., Teitell M. A., Zangle T. A., “Quantitative phase imaging: recent advances and expanding potential in biomedicine,” ACS Nano 16(8), 11516–11544 (2022). 10.1021/acsnano.1c11507 [DOI] [PMC free article] [PubMed] [Google Scholar]
- 4.Rappaz B., Depeursinge C., Marquet P., Emery Y., uche E. C., Colomb T., Magistretti P. J., “Digital holographic microscopy: a noninvasive contrast imaging technique allowing quantitative visualization of living cells with subwavelength axial accuracy,” Opt. Lett. 30(5), 468–470 (2005). 10.1364/OL.30.000468 [DOI] [PubMed] [Google Scholar]
- 5.Teague M. R., “Deterministic phase retrieval: a Green’s function solution,” J. Opt. Soc. Am. 73(11), 1434–1441 (1983). 10.1364/JOSA.73.001434 [DOI] [Google Scholar]
- 6.Zuo C., Qu W., Chen Q., Asundi A., “High-speed transport-of-intensity phase microscopy with an electrically tunable lens,” Opt. Express 21(20), 24060–24075 (2013). 10.1364/OE.21.024060 [DOI] [PubMed] [Google Scholar]
- 7.Hamilton D. K., Sheppard C. J. R., “Differential phase contrast in scanning optical microscopy,” J. Microsc. 133(1), 27–39 (1984). 10.1111/j.1365-2818.1984.tb00460.x [DOI] [Google Scholar]
- 8.Waller L., Tian L., “Quantitative differential phase contrast imaging in an LED array microscope,” Opt. Express 23(9), 11394–11403 (2015). 10.1364/OE.23.011394 [DOI] [PubMed] [Google Scholar]
- 9.Zheng G., Horstmeyer R., Yang C., “Wide-field, high-resolution Fourier ptychographic microscopy,” Nat. Photonics 7(9), 739–745 (2013). 10.1038/nphoton.2013.187 [DOI] [PMC free article] [PubMed] [Google Scholar]
- 10.Sun J., Zuo C., Zhang L., Chen Q., “Resolution-enhanced Fourier ptychographic microscopy based on high-numerical-aperture illuminations,” Sci. Reports 7(1), 1–11 (2017). [DOI] [PMC free article] [PubMed] [Google Scholar]
- 11.Phillips Z. F., Chen M., Waller L., “Single-shot quantitative phase microscopy with color-multiplexed differential phase contrast (cDPC),” PLoS One 12(2), e0171228 (2017). 10.1371/journal.pone.0171228 [DOI] [PMC free article] [PubMed] [Google Scholar]
- 12.Lee W., Jung D., Ryu S., Joo C., Park Y., Best C. A., Badizadegan K., Dasari R. R., Feld M. S., Kuriabova T., Henle M. L., Levine A. J., “Single-exposure quantitative phase imaging in color-coded LED microscopy,” Opt. Express 25(7), 8398–8411 (2017). 10.1364/OE.25.008398 [DOI] [PubMed] [Google Scholar]
- 13.Fan Y., Sun J., Chen Q., Pan X., Trusiak M., Zuo C., “Single-shot isotropic quantitative phase microscopy based on color-multiplexed differential phase contrast,” APL Photonics 4(12), 121301 (2019). 10.1063/1.5124535 [DOI] [Google Scholar]
- 14.Kalita R., Flanagan W., Lightley J., Kumar S., Alexandrov Y., Garcia E., Hintze M., Barkoulas M., Dunsby C., French P. M. W., “Single-shot phase contrast microscopy using polarisation-resolved differential phase contrast,” J. Biophotonics 14(12), e202100144 (2021). 10.1002/jbio.202100144 [DOI] [PubMed] [Google Scholar]
- 15.Zhang Y., Ozcan A., Göröcs Z., Wang H., Günaydin H., Rivenson Y., “Deep learning microscopy,” Opt. 4(11), 1437–1443 (2017). [Google Scholar]
- 16.Melanthota S. K., Gopal D., Chakrabarti S., Kashyap A. A., Radhakrishnan R., Mazumder N., “Deep learning-based image processing in optical microscopy,” Biophys. Rev. 14(2), 463–481 (2022). 10.1007/s12551-022-00949-3 [DOI] [PMC free article] [PubMed] [Google Scholar]
- 17.Diederich B., Wartmann R., Schadwinkel H., Heintzmann R., “Using machine-learning to optimize phase contrast in a low-cost cellphone microscope,” PLoS One 13(3), e0192937 (2018). 10.1371/journal.pone.0192937 [DOI] [PMC free article] [PubMed] [Google Scholar]
- 18.Kellman M. R., Bostan E., Repina N. A., Waller L., “Physics-based learned design: optimized coded-illumination for quantitative phase imaging,” IEEE Trans. Comput. Imaging 5(3), 344–353 (2019). 10.1109/TCI.2019.2905434 [DOI] [Google Scholar]
- 19.Ding H., Meng Z., Ma J., Li F., Yuan C., Nie S., eng S. F., “Auto-focusing and quantitative phase imaging using deep learning for the incoherent illumination microscopy system,” Opt. Express 29(17), 26385–26403 (2021). 10.1364/OE.434014 [DOI] [PubMed] [Google Scholar]
- 20.Li A. C., yas S. V., Lin Y. H., Huang Y. Y., Huang H. M., Luo Y., “Patch-based U-Net model for isotropic quantitative differential phase contrast imaging,” IEEE Trans. Med. Imaging 40(11), 3229–3237 (2021). 10.1109/TMI.2021.3091207 [DOI] [PubMed] [Google Scholar]
- 21.Lin Y. H., Li A. C., Vyas S., Huang Y. Y., Yeh J. A., Luo Y., “Isotropic quantitative differential phase contrast microscopy using radially asymmetric color-encoded pupil,” J. Phys. Photonics 3(3), 035001 (2021). 10.1088/2515-7647/abf02d [DOI] [Google Scholar]
- 22.Chen H. H., Lin Y. Z., Luo Y., “Isotropic differential phase contrast microscopy for quantitative phase bio-imaging,” J. Biophotonics 11(8), e201700364 (2018). 10.1002/jbio.201700364 [DOI] [PubMed] [Google Scholar]
- 23.Wang Z., Bovik A. C., Sheikh H. R., Simoncelli E. P., “Image quality assessment: from error visibility to structural similarity,” IEEE Trans. on Image Process. 13(4), 600–612 (2004). 10.1109/TIP.2003.819861 [DOI] [PubMed] [Google Scholar]
- 24.Ronneberger O., ischer P.F, Brox T., “U-Net: convolutional networks for biomedical image segmentation,” Int. Conf. Med. Image Comput. Comput. Interv. Springer 234–241 (2015). [Google Scholar]
- 25.Kingma D. P., Ba J. L., “Adam: A method for stochastic optimization,” ArXiv, (2015). 10.48550/arXiv.1412.6980 [DOI]
- 26.Peng T., Ke Z., Zhang S., Shao M., Yang H., Liu X., Zou H., Zhong Z., Zhong M., Shi H., Fang S., Lu R., Zhou J. A., “Compact real-time quantitative phase imaging system,” Preprints 2022, 2022040109 (2022). 10.20944/preprints202204.0109.v1 [DOI] [Google Scholar]
Associated Data
This section collects any data citations, data availability statements, or supplementary materials included in this article.
Data Availability Statement
Data underlying the results presented in this paper are not publicly available but may be obtained from the authors upon reasonable request. See Supplement 1 (2.4MB, pdf) for supporting content.


