Abstract
A common method for characterizing microplastics (MPs) involves capturing the plastic particles on a filter after extraction and isolation from the sediment particles. Microplastics captured on the filter are then scanned with Raman spectroscopy for polymer identification and quantification. However, scanning the whole filter manually using Raman analysis is a labor-intensive and time-consuming process. This study investigates a subsampling method for Raman spectroscopic analysis of microplastics (defined here as 45 −1000 μm in size) present in sediments and isolated onto laboratory filters. The method was evaluated using spiked MPs in deionized water and two environmentally contaminated sediments. Based on statistical analyses, we found quantification of a sub-fraction of 12.5% of the filter in a wedge form was optimal, efficient, and accurate for estimating the entire filter count. The extrapolation method was then used to assess microplastic contamination in sediments from different marine regions of the United States.
Keywords: Microplastics, Sediments, Raman spectroscopy, Subsampling, Marine
Introduction
Microplastics (MP) are ubiquitous in many environments1–4. Based on guidance adopted by the State of California in 2020, MPs are defined as particles ranging in size from five mm to 1 nm5 and derived from either primary or secondary sources6,7. Primary MPs are manufactured in the micro-size range6,8, while secondary MPs are generated by the breakdown of larger plastic particles due to biological, chemical, and physical degradation9–12. MPs are mainly transported into marine and estuarine environments by hydrologic and aeolian processes8,13. Despite the low density of many MPs, they can sink and accumulate in sediments over time due to various mechanisms including weathering, agglomeration, biofouling, bioturbation, incorporation into phytoplankton aggregates, and discharge within the fecal pellets of aquatic organisms after consumption14–18.
Assessing adverse effects associated with MPs is an active area of scientific investigation. For example, sediments contaminated with MPs may cause adverse impacts on the marine benthos due to their ingestion and accumulation19,20. Along with the polymers that comprise the MPs, manufacturers amend additives into plastic formulations to reduce degradation by microbes and sunlight, as well as to enhance the polymer’s plasticity and color. These additives include phthalates, bisphenol A (BPA), nonylphenols, and brominated flame retardants which are known toxicants and endocrine disruptors21–23. For these reasons, the identification and quantification of MPs in sediments is crucial to further understanding the potential exposure and effects on benthic life.
Previous studies have identified the presence of MPs in marine24–28 and estuarine sediments29–36. However, the extraction, identification, and quantification methods of MPs in sediments vary greatly among studies. A common methodology for determining MPs in sediments involves capturing the plastic particles on a filter after isolation and extraction from the sediment particles. The MPs captured on the filter are then scanned using analytical techniques for polymer identification and quantification. One frequently applied identification method is Raman spectroscopy, a vibrational spectroscopic method applied for identifying specific polymers through characterization of their unique spectral fingerprints37–39. When coupled with microscopy, Raman spectroscopy provides chemical, morphological and quantitative (e.g., shape, size, abundance) characteristics of the particles40–42. An important advantage of Raman spectroscopy is its ability to detect and identify particles in smaller size ranges (e.g., 1–10 μm)37, 43–45 compared to other identification techniques (e.g., Fourier transform infrared (FTIR) spectrometry). However, few studies report these smaller size ranges because the analysis is a tedious process requiring longer measurement times depending on the sample composition, particle isolation, extraction, counting methodologies, particles numbers, and instrument parameters45,46. For example, spectral identification of just a single particle can require between 0.5 s to five minutes as reported by previous studies40. Consequently, manually scanning an entire filter (e.g., 47 mm diameter) using Raman is a labor-intensive and time-consuming process, taking several days to analyze a single filter46,47.
As a result of those challenges with Raman spectroscopy, automated maps are usually generated, and a subsample of the particles are examined to reduce the scanning time required to analyze all the particles. Subsampling methods vary from a few particles (e.g., 10 particles) on a filter to a sub-fraction of 50% of the total filter40. While, to the best of our knowledge, a limited number of studies have been performed assessing subsampling48–50, a rigorous statistical analysis selecting an appropriate filter subsample has not been conducted. Recently, De Frond et al.50 recommended a random particle counting strategy balancing quantifying fewer particles to assess basic proportions of types of particles (e.g., anthropogenic, natural) versus more thorough quantification to characterize the diversity of particles within each type. Because of the range of possible subsampling approaches, choosing the most representative sub-fraction of the filter is uncertain and remains an open question51.
The main goal of this study was to determine the most appropriate sub-fraction of the filter to analyze using Raman spectroscopy, which can then be extrapolated to determine the total number of MP on the whole filter while minimizing time spent performing the analysis. After initial evaluation of the ‘optimal’ representative fraction using MPs spiked into deionized water and two environmentally-contaminated sediments, the method was used to assess microplastic contamination in several marine and estuarine sediments along the coast of the United States including the Northeast, Mid-Atlantic, and southern California collected from the U.S. EPA’s ten geographic regions (https://www.epa.gov/aboutepa/regional-and-geographic-offices).
Methods and Materials
Filter Sub-fractioning Study
Overview
To evaluate subsampling of the filters, we analyzed multiple sections of a filter using Raman spectroscopy and subsequent extrapolation to the whole filter to determine total MP particles in several validation samples (i.e., four DI water solutions, two environmentally-contaminated sediments). To determine the ‘optimal’ sub-fraction of a given filter to count, we evaluated (1) the accuracy of extrapolation to estimate the total number of MP particles on the filter, (2) the time required to analyze a given sub-fraction of the filter, and (3) the precision of the replicated count estimates. For this investigation, ‘optimal’ was a relative balancing of the maintenance of accuracy and precision while reducing counting time in comparison to the analysis of the entire filter. This analysis was performed on deionized (DI) water spiked with selected plastics (50 to 3000 μm). In addition, as a confirmation step, two environmental sediments from the U.S. EPA regions sampled in this investigation were also analyzed. DI water samples were performed using analytical grade Milli-Q water to avoid any particle contamination. More detail on the collection and preparation of both types of samples is provided below. Specific sediment samples used in this sub-fractioning study were from the Northeast (Narragansett Bay, RI – Region 1 station 4) and the West Coast (Long Beach, CA – Region 9 station 5) of the United States. Polymer particle target sizes ranged between 45–1000 μm. Statistical analyses were used to identify the filter sub-fraction which was optimal for estimating the entire filter count (see description below).
MPs in DI Water
Four solutions were each prepared in 100 mL of DI water spiked with polymer particles. One solution contained polyethylene (PE) microbeads, another polyvinyl chloride (PVC) fragments, a third polyethylene terephthalate (PET) fibers, and lastly, a combination of all three polymers (Table 1). Surfactant (Tween 80 Biocompatible surfactant, Cospheric, CA, USA) with a concentration of 1ml/L was added to the solution to disperse the plastic particles. Each solution included five replicates (n = 5) and was mixed using a magnetic stirrer to ensure homogeneous dispersion of the particles. An aliquot of the mixture (10 ml) was filtered on a polycarbonate track-etched (PCTE) membrane filter (47 mm diameter, 0.45μm pore size, GVS) using vacuum filtration. Particles were counted by placing a 5 mm × 5 mm grid sheet under the filter and scanning the filter with Raman spectroscopy square by square within defined fractions. Fractions were chosen in wedge forms to include the dispersion of particles from the center of the filter to the outer edge. Using Raman, we scanned the following sub-fraction sections of each of the filters: whole filter area (100%), three-quarter of the filter (75%), half of the filter (50%), one quarter of the filter (25%), a sector of 45° of the filter (12.5%), and a sector of 22° of the filter (6.25%) (Figure 1). Along with the quantification information, the processing time needed to scan each filter section using the Raman microscope was recorded. As noted above, these studies were performed with each MP solution using five replicates allowing the calculation of precision estimates including the relative standard deviation (RSDs).
Table 1).
Polymer type, color, morphology, sizes, amounts and sources of MP amended to deionized water solutions for the sub-sampling component of this study. For the ‘All Polymers’ treatment, the specific information below for each individual polymer was combined into a single treatment.
| Polymer type | Color and morphology | Polymer size range (μm) | Amount (mg) | Source |
|---|---|---|---|---|
| Polyethylene (PE) | Blue Microbeads | 180–212 | 100 | Cospheric, Goleta, CA, USA |
| Polyvinyl chloride (PVC) | Orange Fragments | 500–1000 | 100 | PVC pipe, Home Depot, North Kingstown, RI, USA |
| Polyethylene terephtalate (PET) | White Fibers | 50 wide x 3000 long | 100 | Embroidery floss, Mini Fibers, Inc., Johnson City, TN, USA |
Figure (1).
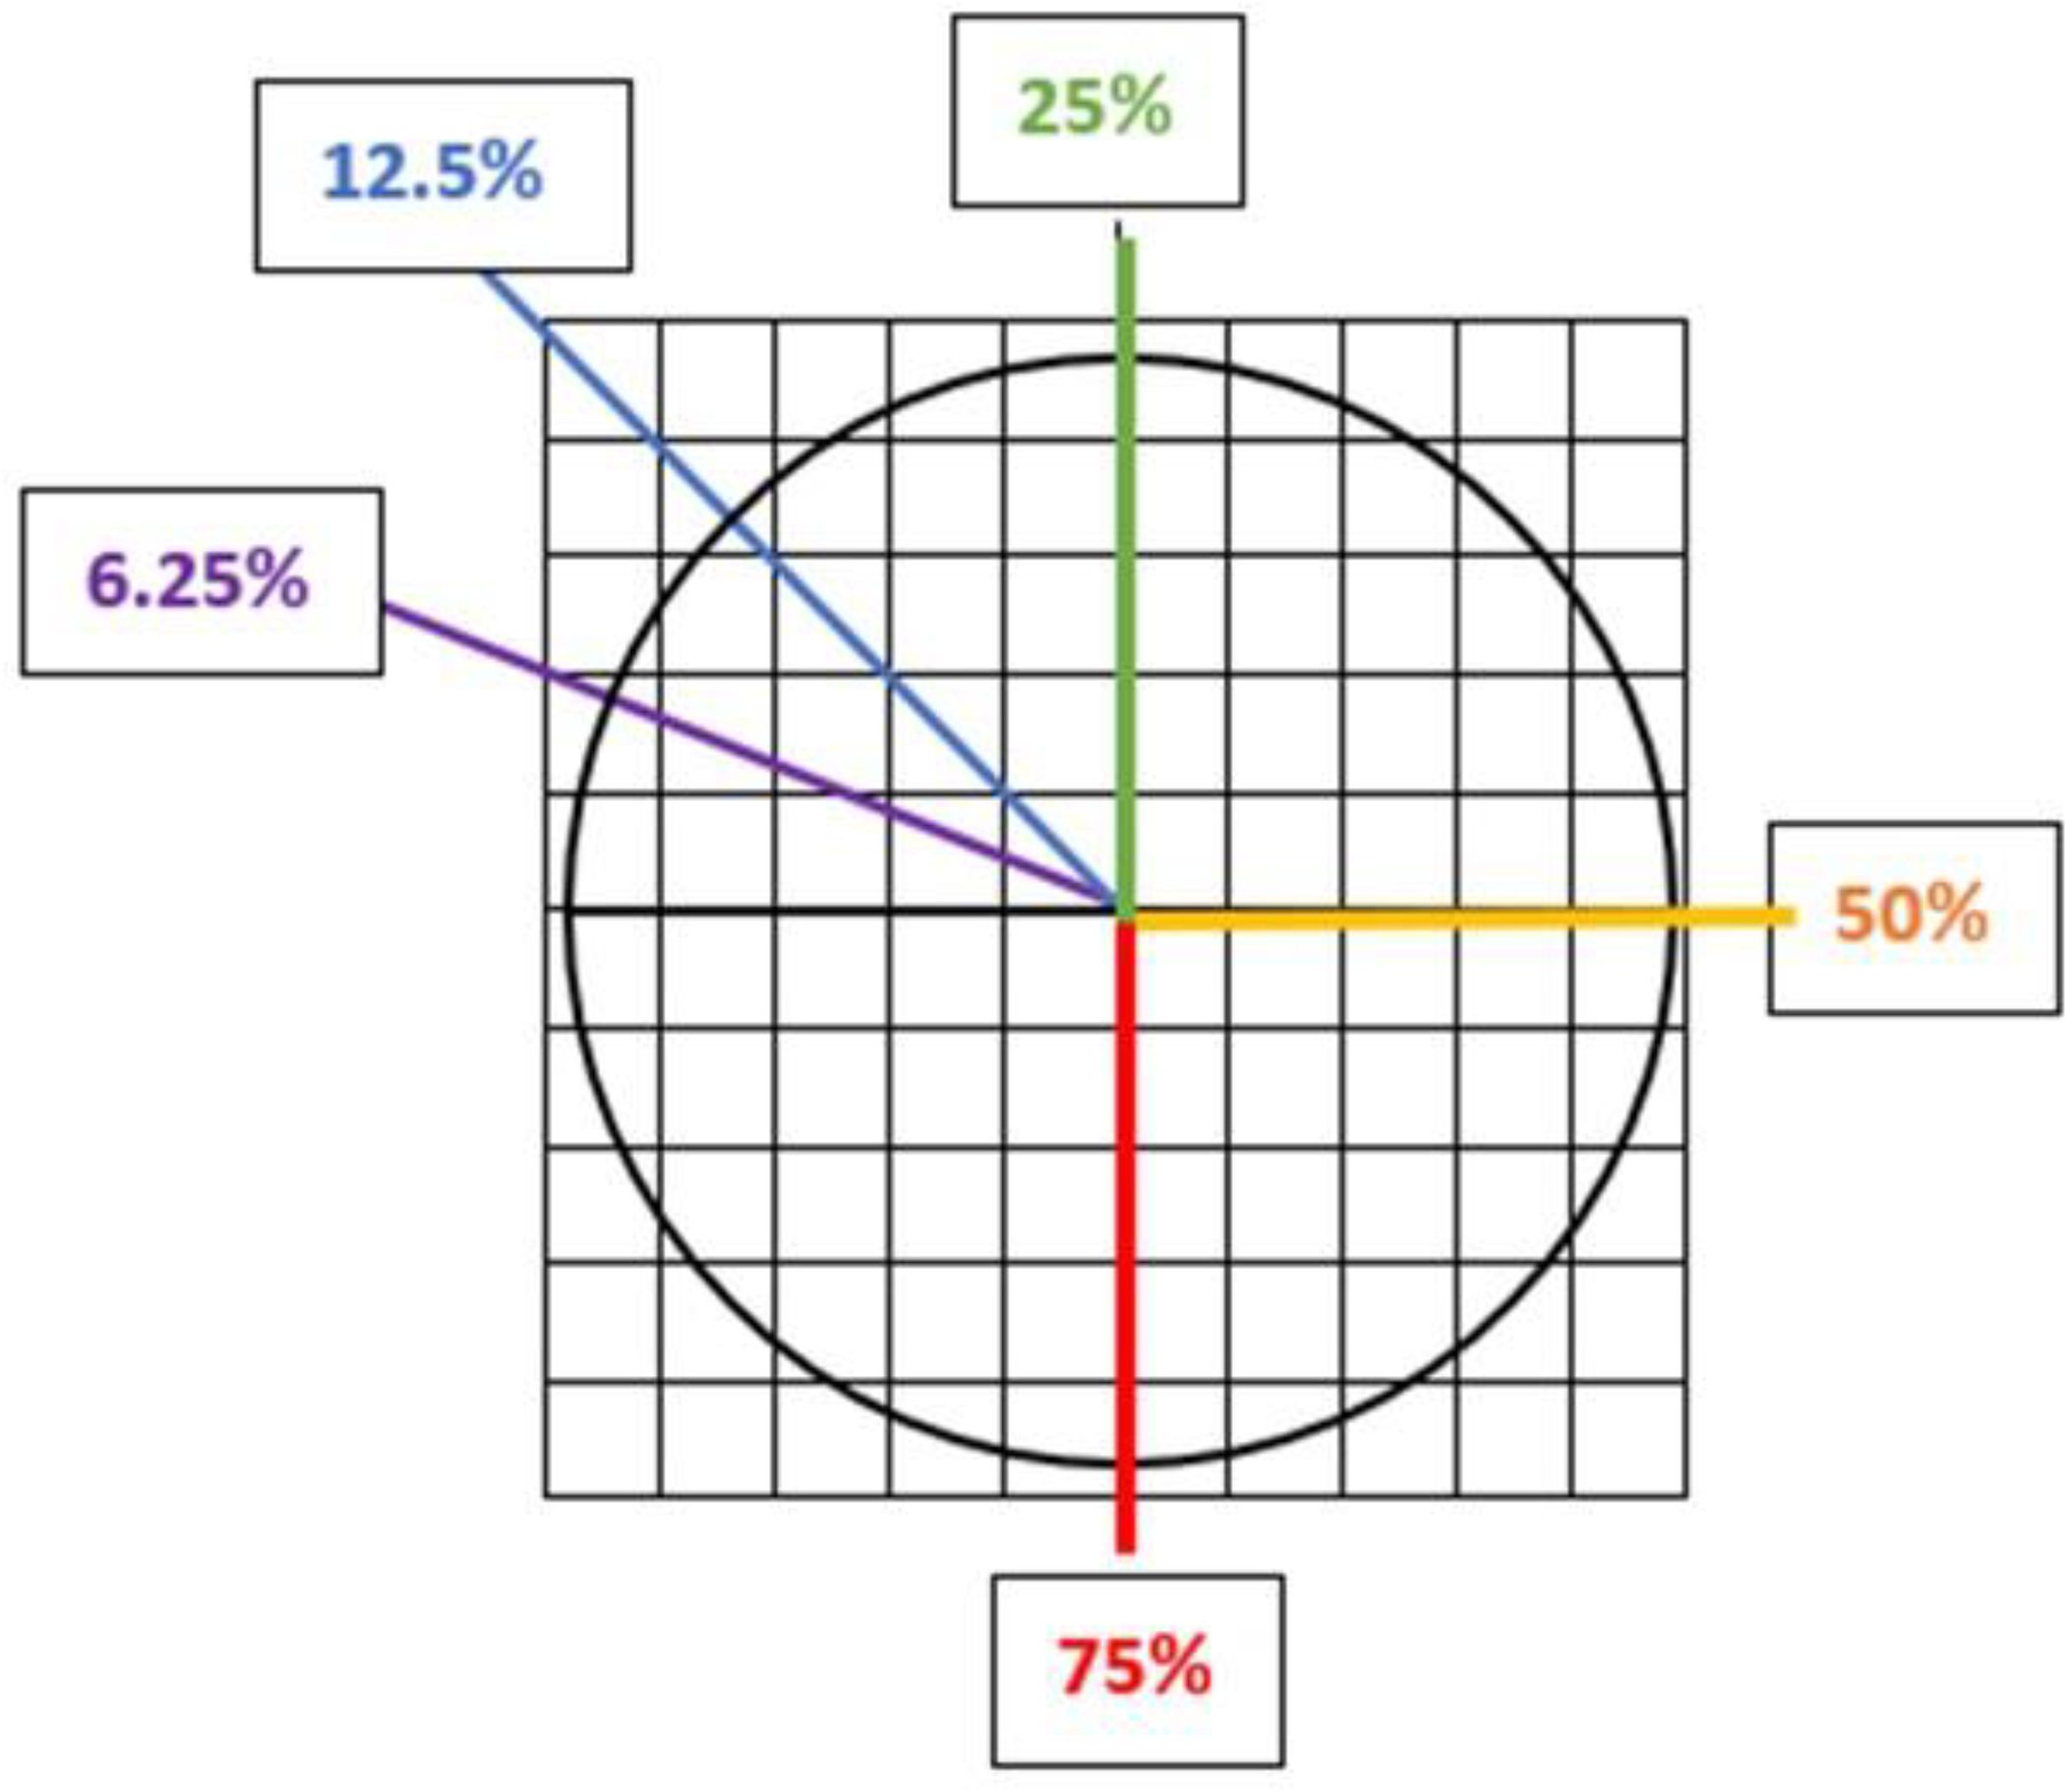
Illustration of the subsections of filters scanned by Raman spectroscopy for the subsampling component of this study.
MPs in Environmentally Contaminated Sediments
Following isolation and extraction of MPs from the sediments, they were placed on a filter and treated as described above for the DI water samples. Unlike the DI water study described above, the MPs in these sediments were from environmental contamination and not from laboratory spiking. The section below describes how the sediments were collected and the MPs isolated and extracted from the samples used in this part of the study. Specifically, the two sediment samples were from Region 1 station 4 (n = 1) and Region 9 station 5 (n = 1) (Figure 2).
Figure (2).
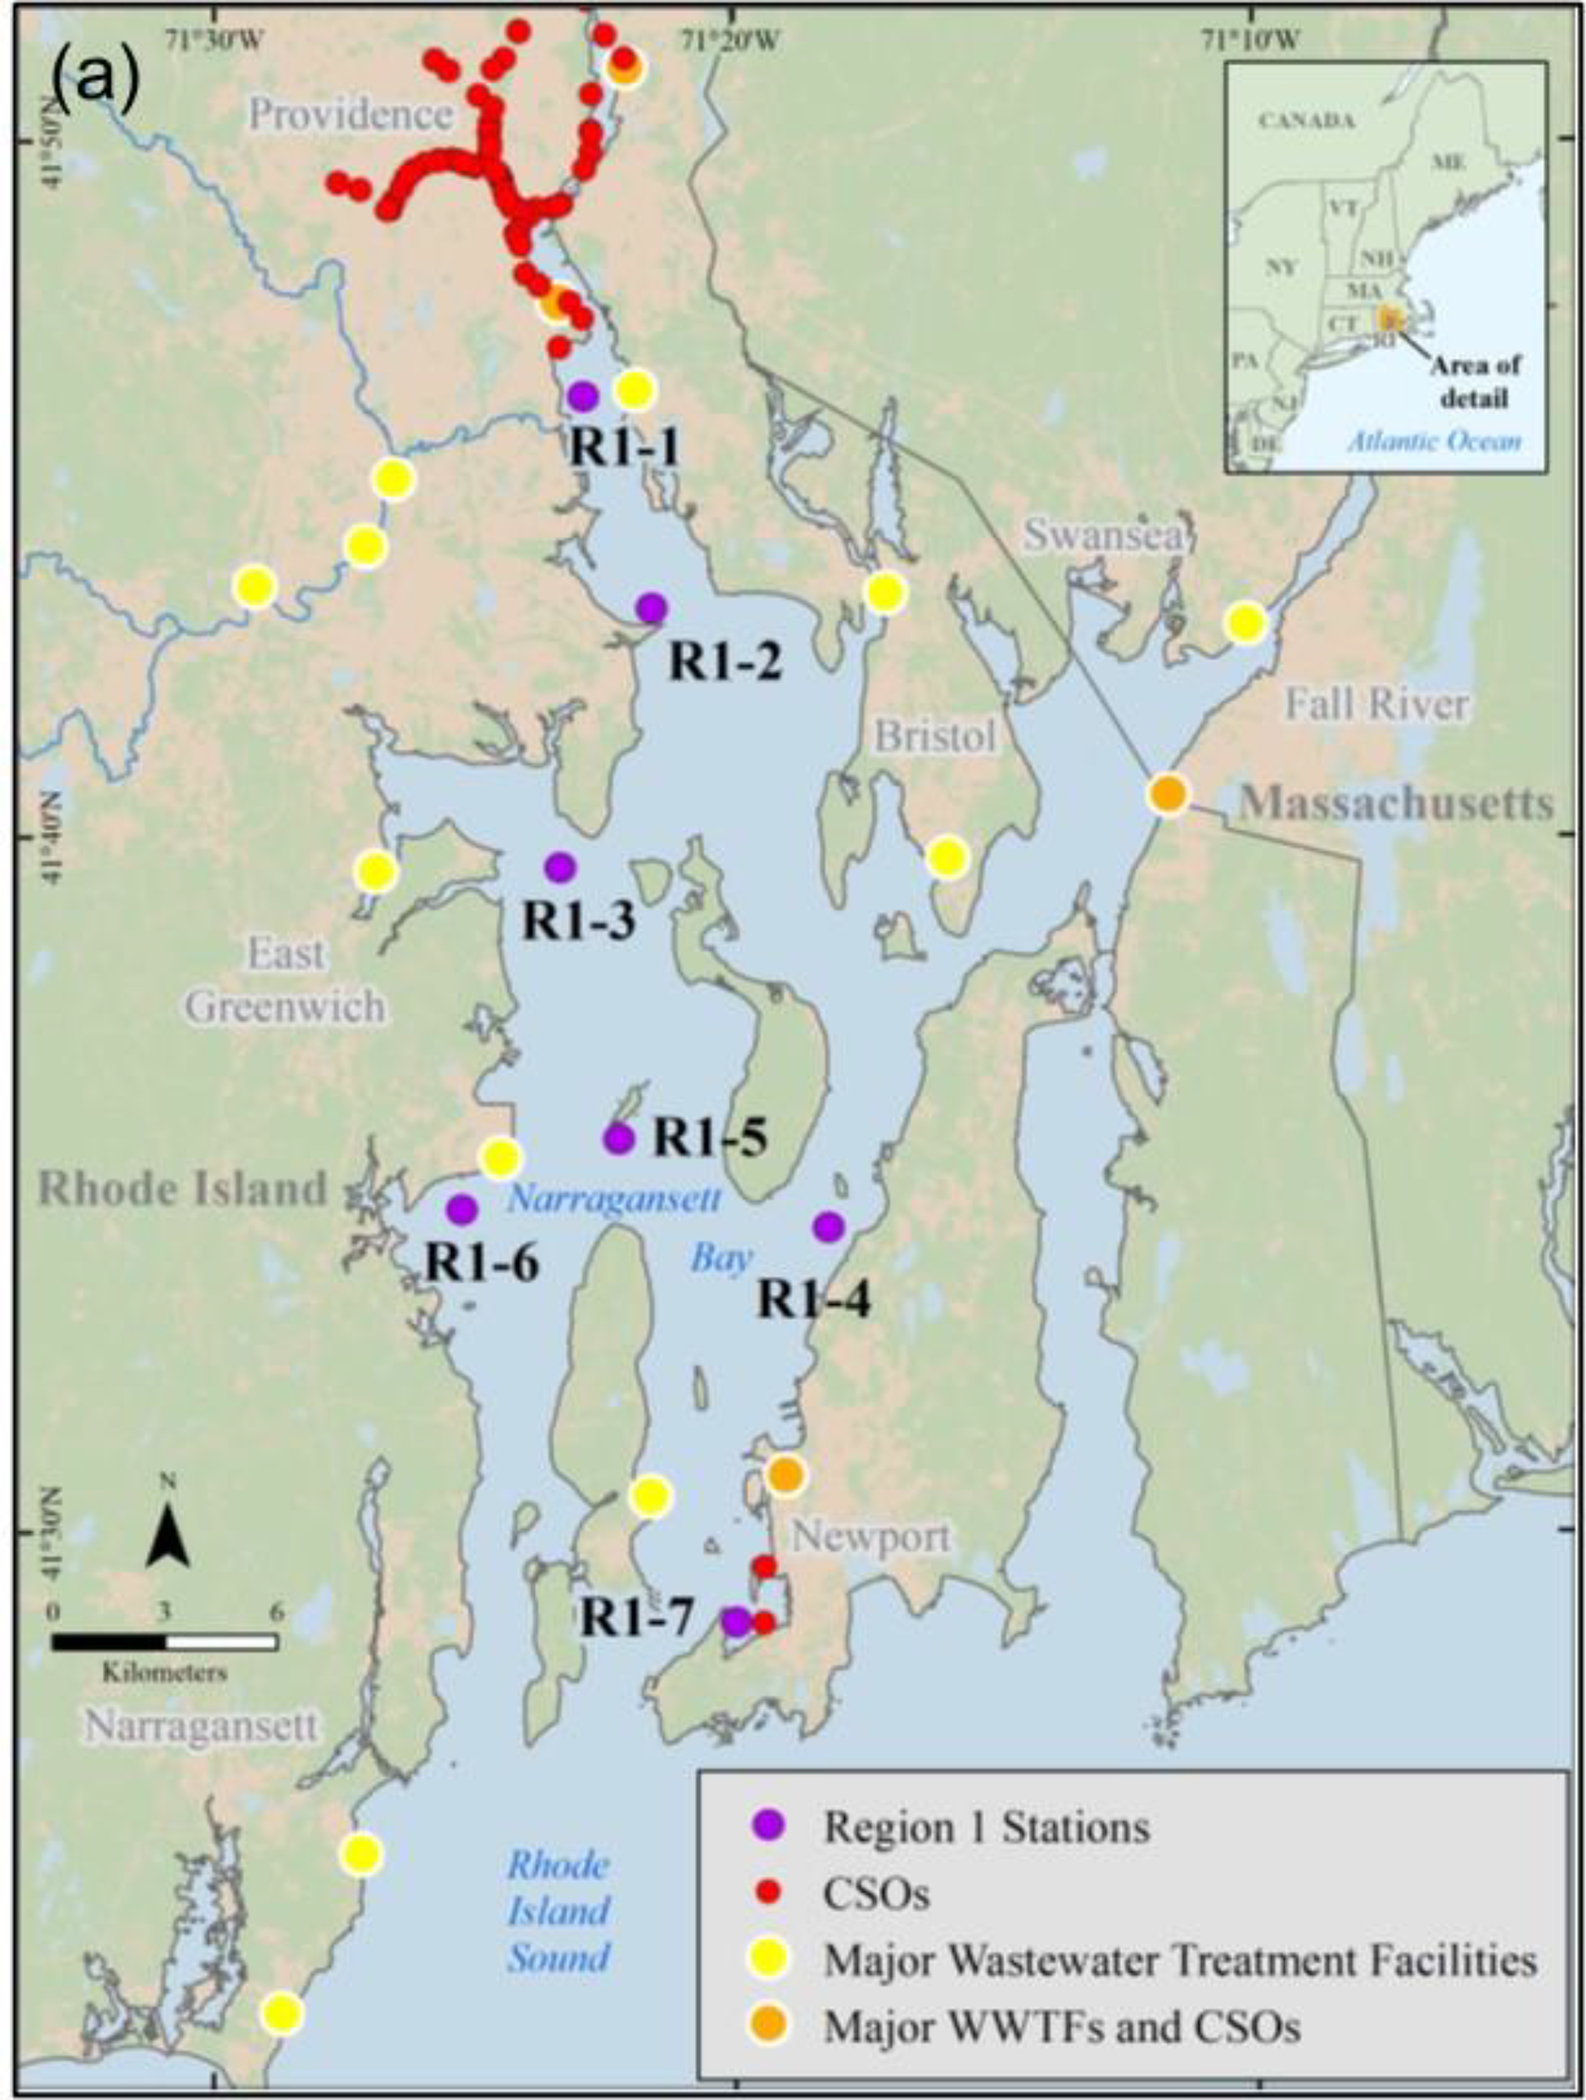
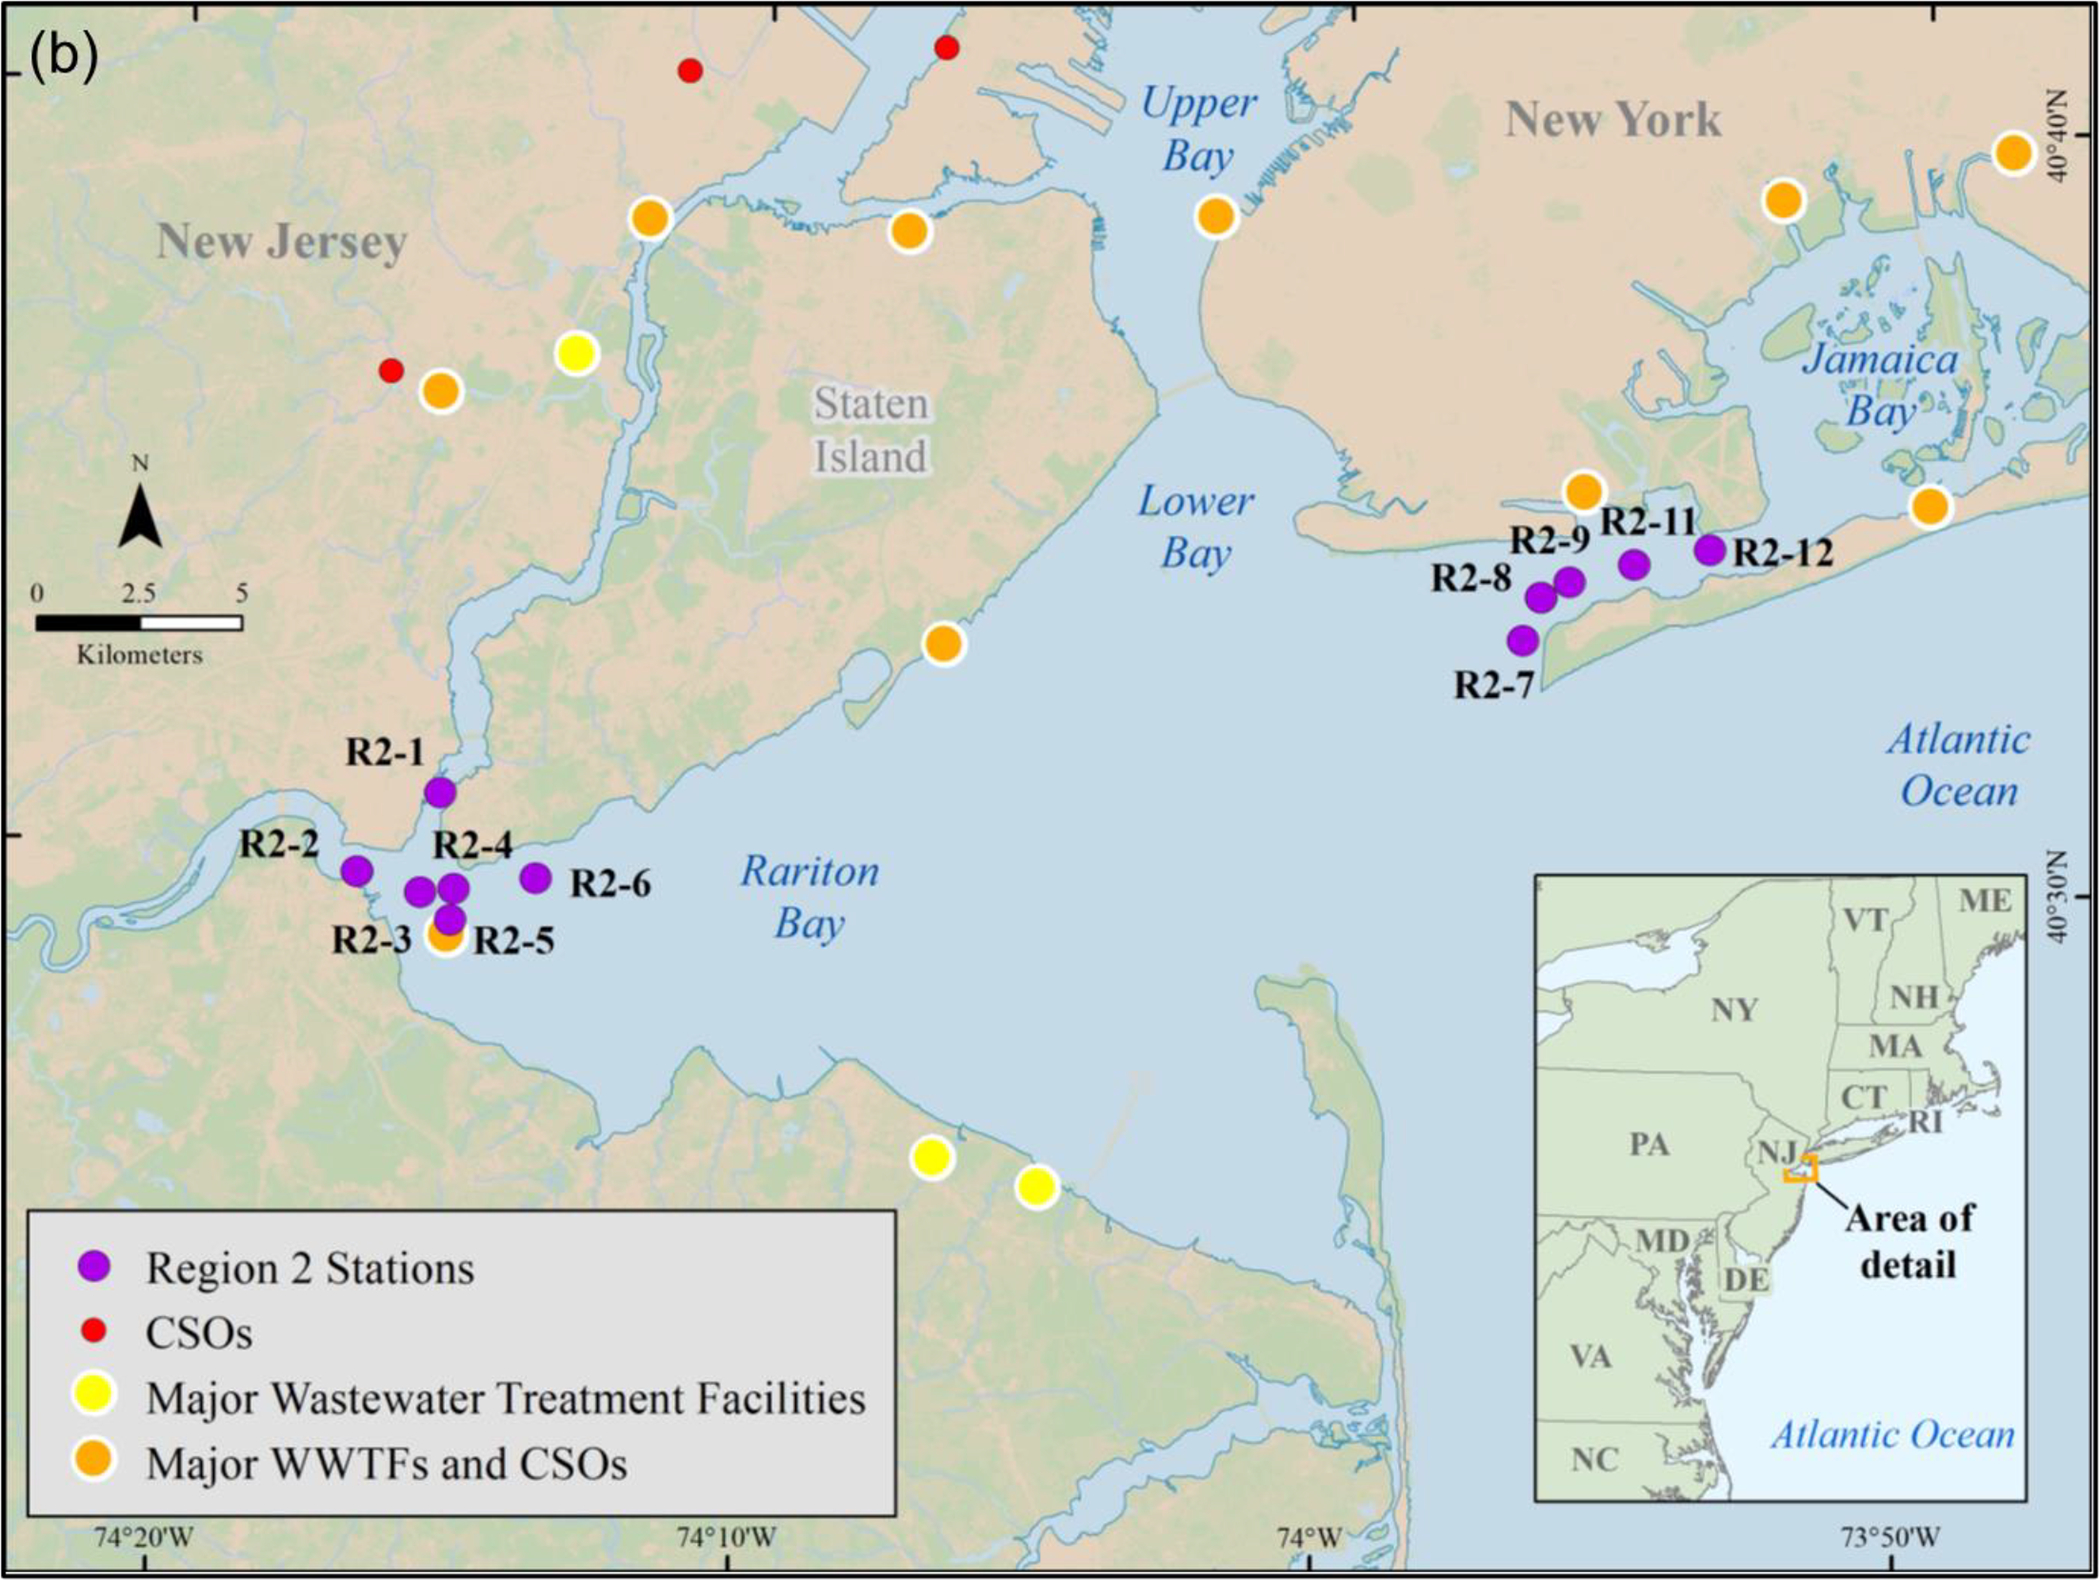
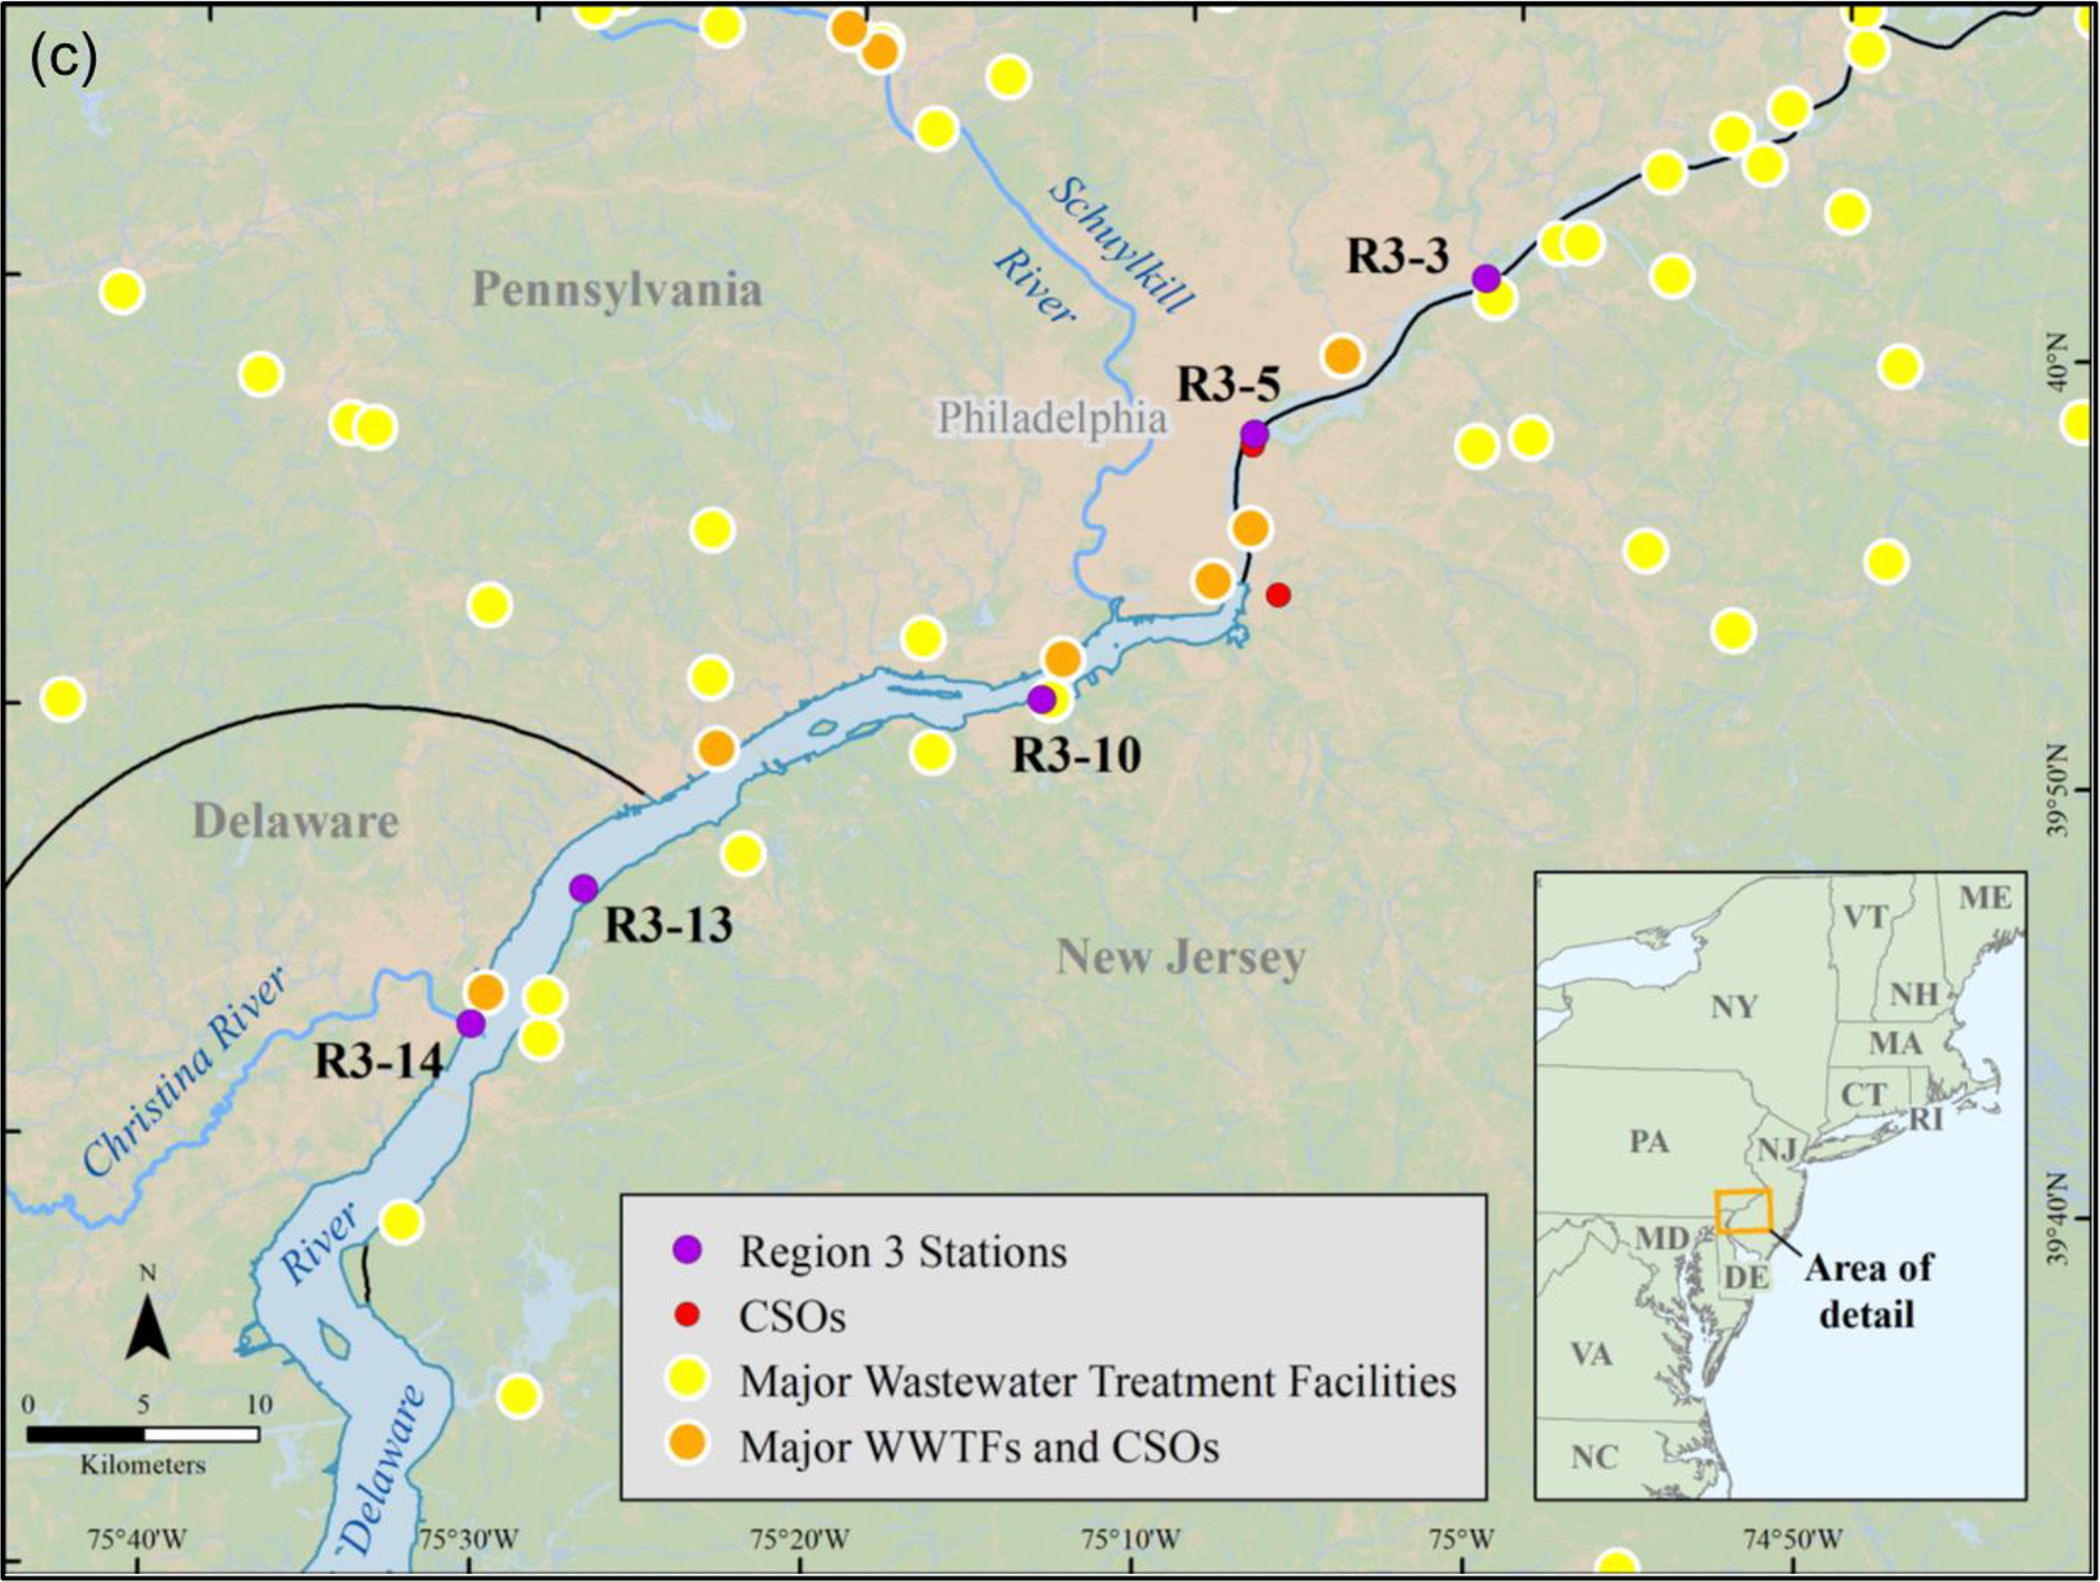
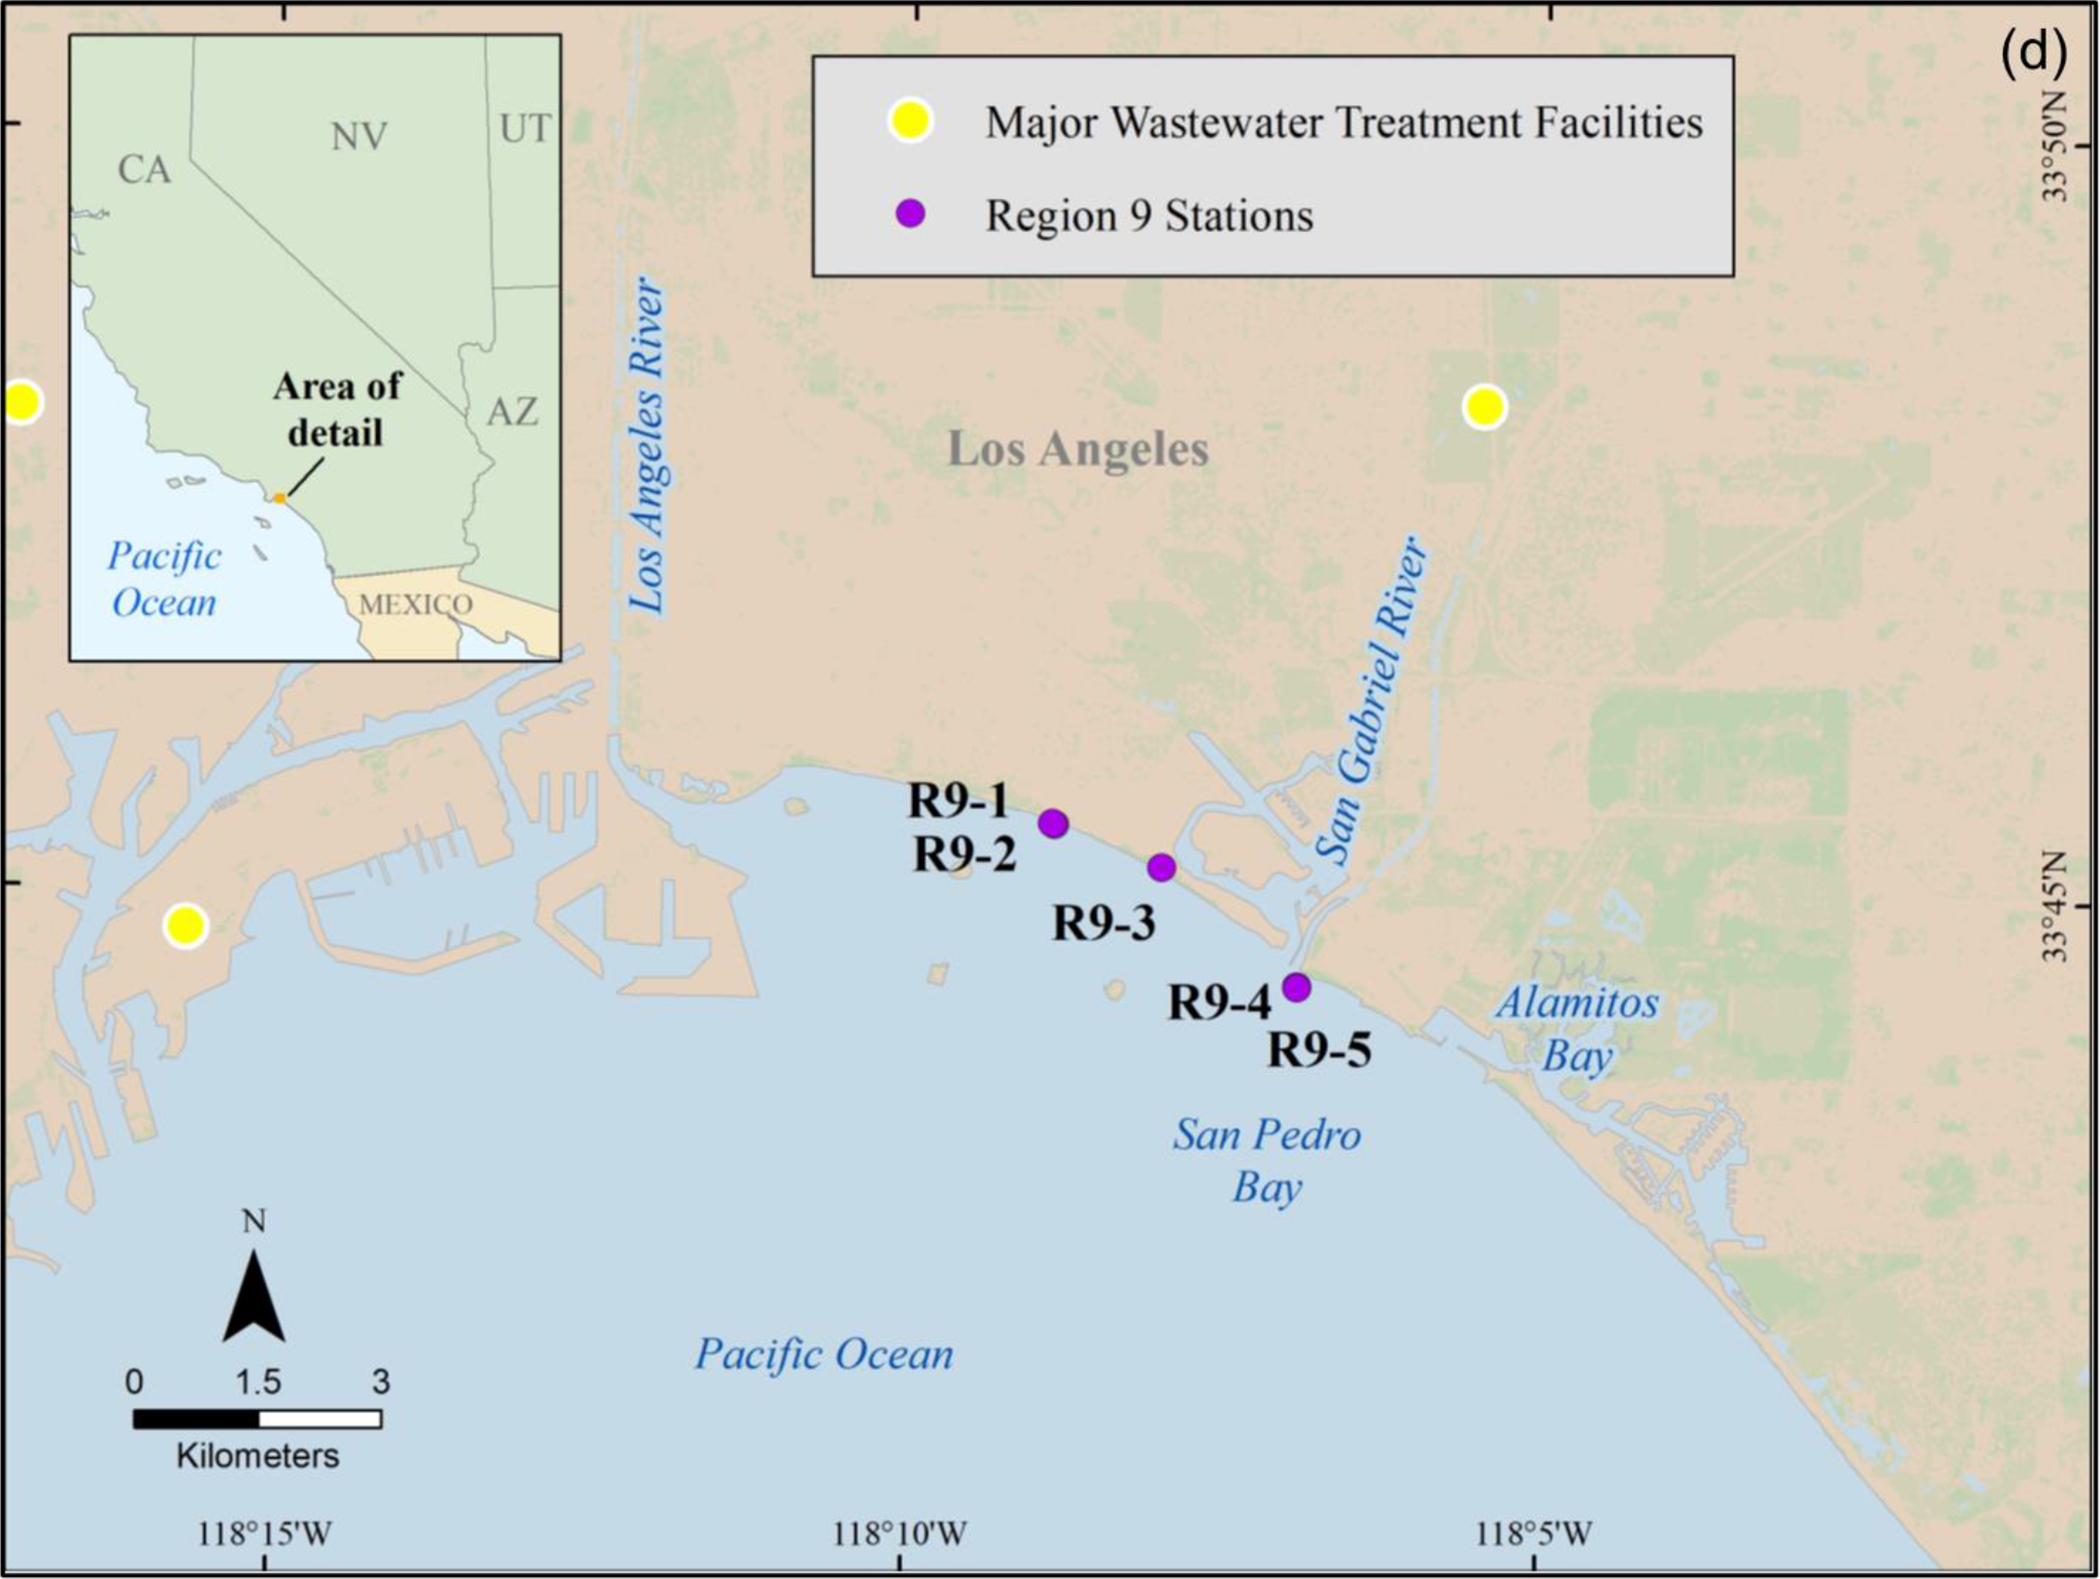
U.S. EPA regional sediment sampling sites (a) Narraganset Bay, RI, USA (Region 1), (b) Coney Island, NY, USA (Region 2), (c) Delaware River, MD, PA and NJ, USA (Region 3), and (d) Long and Seal beaches, CA, USA (Region 9).
MPs in Regional Sediments
Surficial sediment samples (top 5 cm) were collected from several marine and estuarine locations in three different U.S. EPA regions across the United States: (a) New York Harbor (New York and New Jersey - Region 2), (b) Delaware River (Delaware, Pennsylvania and New Jersey - Region 3), and (c) Long and Seal Beaches (California - Region 9). Sampling stations within each Region were chosen based on their proximal land use patterns (e.g., wastewater facilities, combined sewage overflows (CSOs)) to ensure that a wide range of sediment environments and potential plastic sources were captured (Figure 2). In total, 21 locations were sampled (SM Table S1). The number of stations sampled differed per region; for example, Regions 3 and 9 had the smallest number of stations (5 stations) whereas Region 2 had the greatest number of stations (11 stations). Samples from Region 1 in Narragansett Bay (Rhode Island, USA) were also used in the current study for comparison purposes. Region 1 samples were part of a previously published study from this laboratory that developed a hybridized method to extract MPs from sediments, which is used in the present study52.
Samples were stored in clean glass jars at 4°C in the dark until used. Upon retrieval, a stainless-steel spatula was used to homogenize the sediment samples and divide them into 100 g subsamples. The composition of sediments was a mix of primarily silty samples (e.g., NY Harbor, Delaware River, Narragansett Bay) and dominantly sandy (e.g., Long and Seal Beaches). The grain size distribution of each sediment sample was determined with triplicate analysis using a MasterSizer 3000 instrument (Malvern Palanytical LTD, Malvern, UK) (SM Table S2).
Sediment samples were processed to isolate and extract the MPs following an optimized hybrid extraction method52. Briefly, sample processing consisted of three main steps: (1) sieving the 100 g (wet sediment) samples into two class sizes (45 to <250 μm and 250 to 1000 μm), (2) separating with high- and low-density sodium bromide solutions with densities of 1.3 and 1.5 g/cm3 for each size class, and (3) filtering the supernatant onto 20 μm PCTE filters using a vacuum pump. After processing, each sample was separated into four treatment filters by size class and solution density. Filters were oxidized using 30% hydrogen peroxide to reduce natural organic matter interferences. Particles in the upper size range (250 to 1000 μm) were picked with metal forceps using a 10x magnification dissecting stereoscope (Nikon SMZ745-T), enumerated, categorized according to their shape (e.g., fragment, pellet, sphere, fiber, film), color, and sizes and then placed on double-sided sticky tape on glass slides for later Raman spectroscopic identification. Smaller particle sizes (45 to <250 μm) were retained on the filters for Raman scanning and stored in pre-cleaned petri dishes.
Quality Assurance/Quality Control
For Regional sediments, samples were collected minimizing exposure to ambient plastic contamination whenever possible. In addition, collection personnel wore brightly colored cotton clothing so that any contamination from this source could be readily identified. Collection blanks consisted of air blanks (i.e., clean filters in a petri dish) used during sample collections, and water blanks with DI water performed during sample laboratory processing. For the laboratory activity, samples were processed in a facility dedicated to MP research. The facility has minimum efficiency reporting value (MERV-13) filtration. MERV-13 filters remove 90% of particles in the 3–10 μm range, 90% of particles in the 1–3 μm range, and 75% of particles in the 0.3–1 μm range. The facility is also equipped with a HEPA filtered laminar flow cabinet where all samples were processed to avoid airborne particle contamination. As with the field collections, cotton laboratory coats dyed with bright pink and purple colors were used during all processing to assist in identifying contamination. Milli-Q water operational blanks and air blanks were analyzed alongside the environmental samples to assess potential laboratory contamination. To correct for procedural contamination in our samples, we subtracted the average number of MP particles found in the blanks from each sample type by matching the polymer type and morphology (e.g., PET fiber, PP fragment). Finally, to assess extraction recovery of MPs from environmental sediment samples, MPs of known polymer type, shape and size were added to a subset of samples as internal standards (SM Table S3). These MPs were added to the samples at the beginning of the sediment extraction52.
Raman Spectroscopy
MP polymer types were identified using an inVia Qontor Raman Microscope (Renishaw plc., Gloucestershire, UK). The analyses were performed with a 785 nm excitation laser, 10s integration time, 1 accumulation, a spectral range of 200 to 3600 cm−1, laser power of 1%, and an objective with 20x, 50x and 100x magnifications. For the Regional sediment samples, single point analysis was used for the upper size range particles (i.e., 250 to 1000 μm) where spectra were recorded at the center of each particle. For the small size range particles (i.e., 45 to <250 μm) retained on filters, a sub-fraction of the filter was analyzed as determined in the previously mentioned sub-fraction studies.
Based on the spectroscopy, montage pictures were acquired to capture particles across the filter surface and spectra were collected by running automated maps. Spectra were processed using Wire software (WIRE 5.4) to remove fluorescence background, perform baseline subtraction, noise filtration, and other commonly applied clean-up techniques. Identification of the polymers was achieved using built-in and external library database searches (e.g., polymer, inorganic, Slopp, Slopp-E, OpenSpecy)53,54. For this investigation, the following common plastic polymers were in the library: polypropylene (PP), polyester (PES), PE, polystyrene (PS), polyurethane (PU), PVC, polyamide (PA), polybutadiene (PB), PET, in addition to a collection of copolymers, additives, and inorganic substances. Spectral matches with High Quality Index (HQI) above 70% were accepted as a good polymer identification. Matches with HQIs between 40 and 70% were considered individually based on visual confirmation of the spectra for certain functional groups that were present. The remaining matches with HQIs below 40% were disregarded. For this investigation, the percentages of particles fitting in each matching category were 33% for HQI above 70%; 65% for HQI between 40 and 70%, and 2% for HQIs below 40%. These criteria were chosen considering the same particle may exhibit different Raman spectral intensity and shifts in peak because of environmental weathering, the presence of additives, or occurrence of other chemicals in the particle’s composition. Additionally, factors such as the instrument type, spectral measurements, and signal to noise ratio can cause different Raman spectral intensities which lowers the comparability to the Raman databases55.
Statistical Analysis
For the analysis of the DI water solutions spiked with selected plastics, five replicate MP counts in each filter fraction (i.e., 6.25% to 100%) were performed. Extrapolation involved multiplying a given sub-fraction count by a factor to estimate the count at 100% filter. For example, the extrapolation for the 6.25% sub-fraction counts involved multiplication by 16. Following extrapolation, a multi-factor ANOVA (with replicate as a blocking factor) was performed comparing mean MP counts. If the ANOVA F-test detected significant differences at p ≤ 0.05, a Dunnett’s multiple comparison test was performed to identify which filter sub-fractions were significantly different from the entire filter (100%). In addition to the hypothesis testing with ANOVA, the RSD of the extrapolated MP counts for each DI water sample sub-fraction was evaluated. The RSDs were used to assess if their magnitude could be explained simply by imprecision resulting from random counting error (described by a Poisson distribution) or if the sub-fractionation itself introduced additional error56.
For filter sub-fractions generated from the environmental sediments selected from Regions 1 and 9 (which were not replicated; n = 1 for each Region), statistical analyses were performed using the non-parametric Kruskal-Wallis test to determine if any sub-fraction MP count extrapolations were significantly different from the actual count for the entire filter. If differences were detected, the post-hoc Dwass, Steel, Critchlow-Fligner pairwise comparison method was used57 to identify specific sub-fraction extrapolations significantly different from the entire filter (100%). Two endpoints were used to assess differences between counts for the entire filter and extrapolated counts: relative accuracy and absolute bias. Results of these statistical analyses were used to select a filter sub-fraction to analyze the remaining Regional sediments in order to estimate total filter counts. In addition to the statistical analyses of the filter sub-fractions, one-factor ANOVA (p ≤ 0.05) was used to determine if significant differences existed in MP abundances between Regions.
Results and Discussion
Filter Sub-fractioning
DI water samples
For the analysis of the DI water solutions, the numbers of MPs and polymer types found in each sub-fraction are summarized in SM Table S4. Figure 3a shows the extrapolated count values of the particles including individual polymer types and total polymers. For two of the MP DI solutions, statistical analyses of the total counts found no significant differences between the 100% treatment and 75%, 50%, 25%, 12.5% or 6.25% fractions (Table 2). However, for two of MP DI solutions, extrapolation of the 6% fraction was statistically greater than the 100% treatment (and the other fractions were not significantly different). The results illustrate that extrapolating from the smaller filter fractions leads to counting inaccuracy. For example, at the 6.25% measured sub-fraction, the extrapolation resulted in an error of 53% for the PET count and 36% for the total number of particles. However, at a larger sub-fraction (e.g., 12.5% and higher), the extrapolation error decreases with the increasing measured fraction (0 to 13% error). Based on this finding, we concluded the 12.5% fraction of the filter could be counted to estimate the entire filter. Table 3 shows the time consumption for scanning each sub-fraction; as expected, less time was required for analyzing the smaller fractions (e.g., 12.5% and 25%). The total time calculated includes the minutes required for Raman sample preparation, acquiring montage pictures, and scanning the particles. The scanning time depends mainly on the number of the particles retained in each filter fraction.
Figure (3).
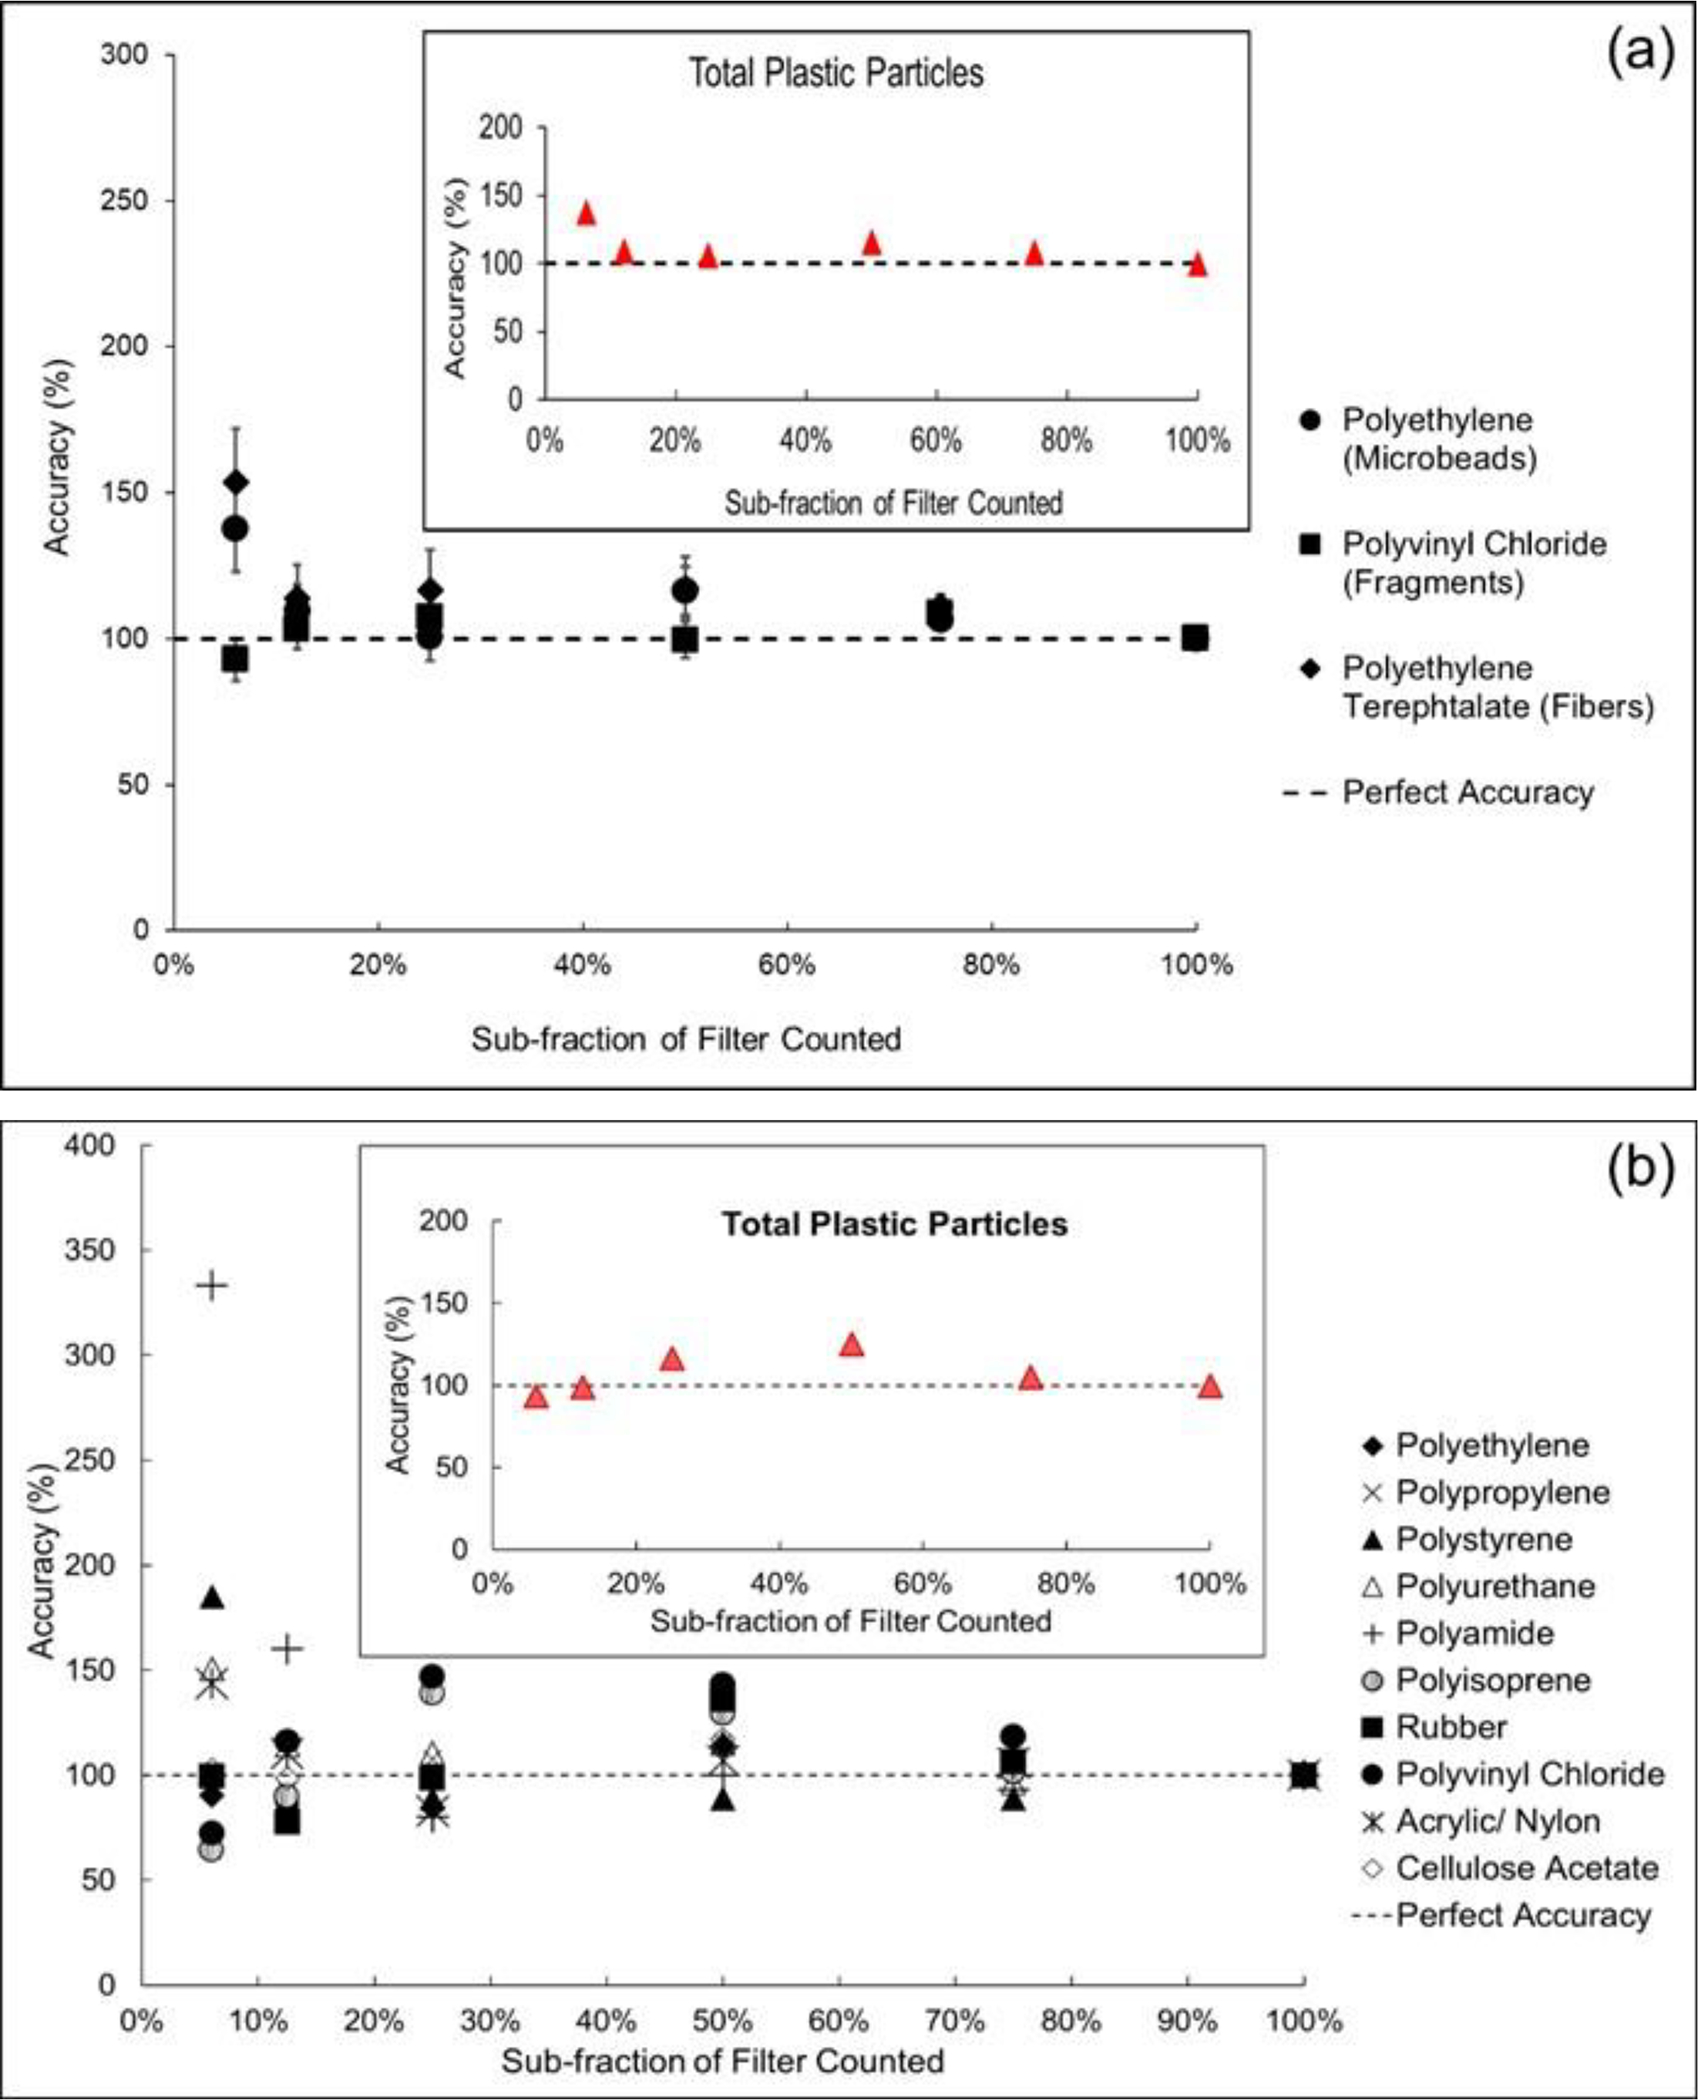
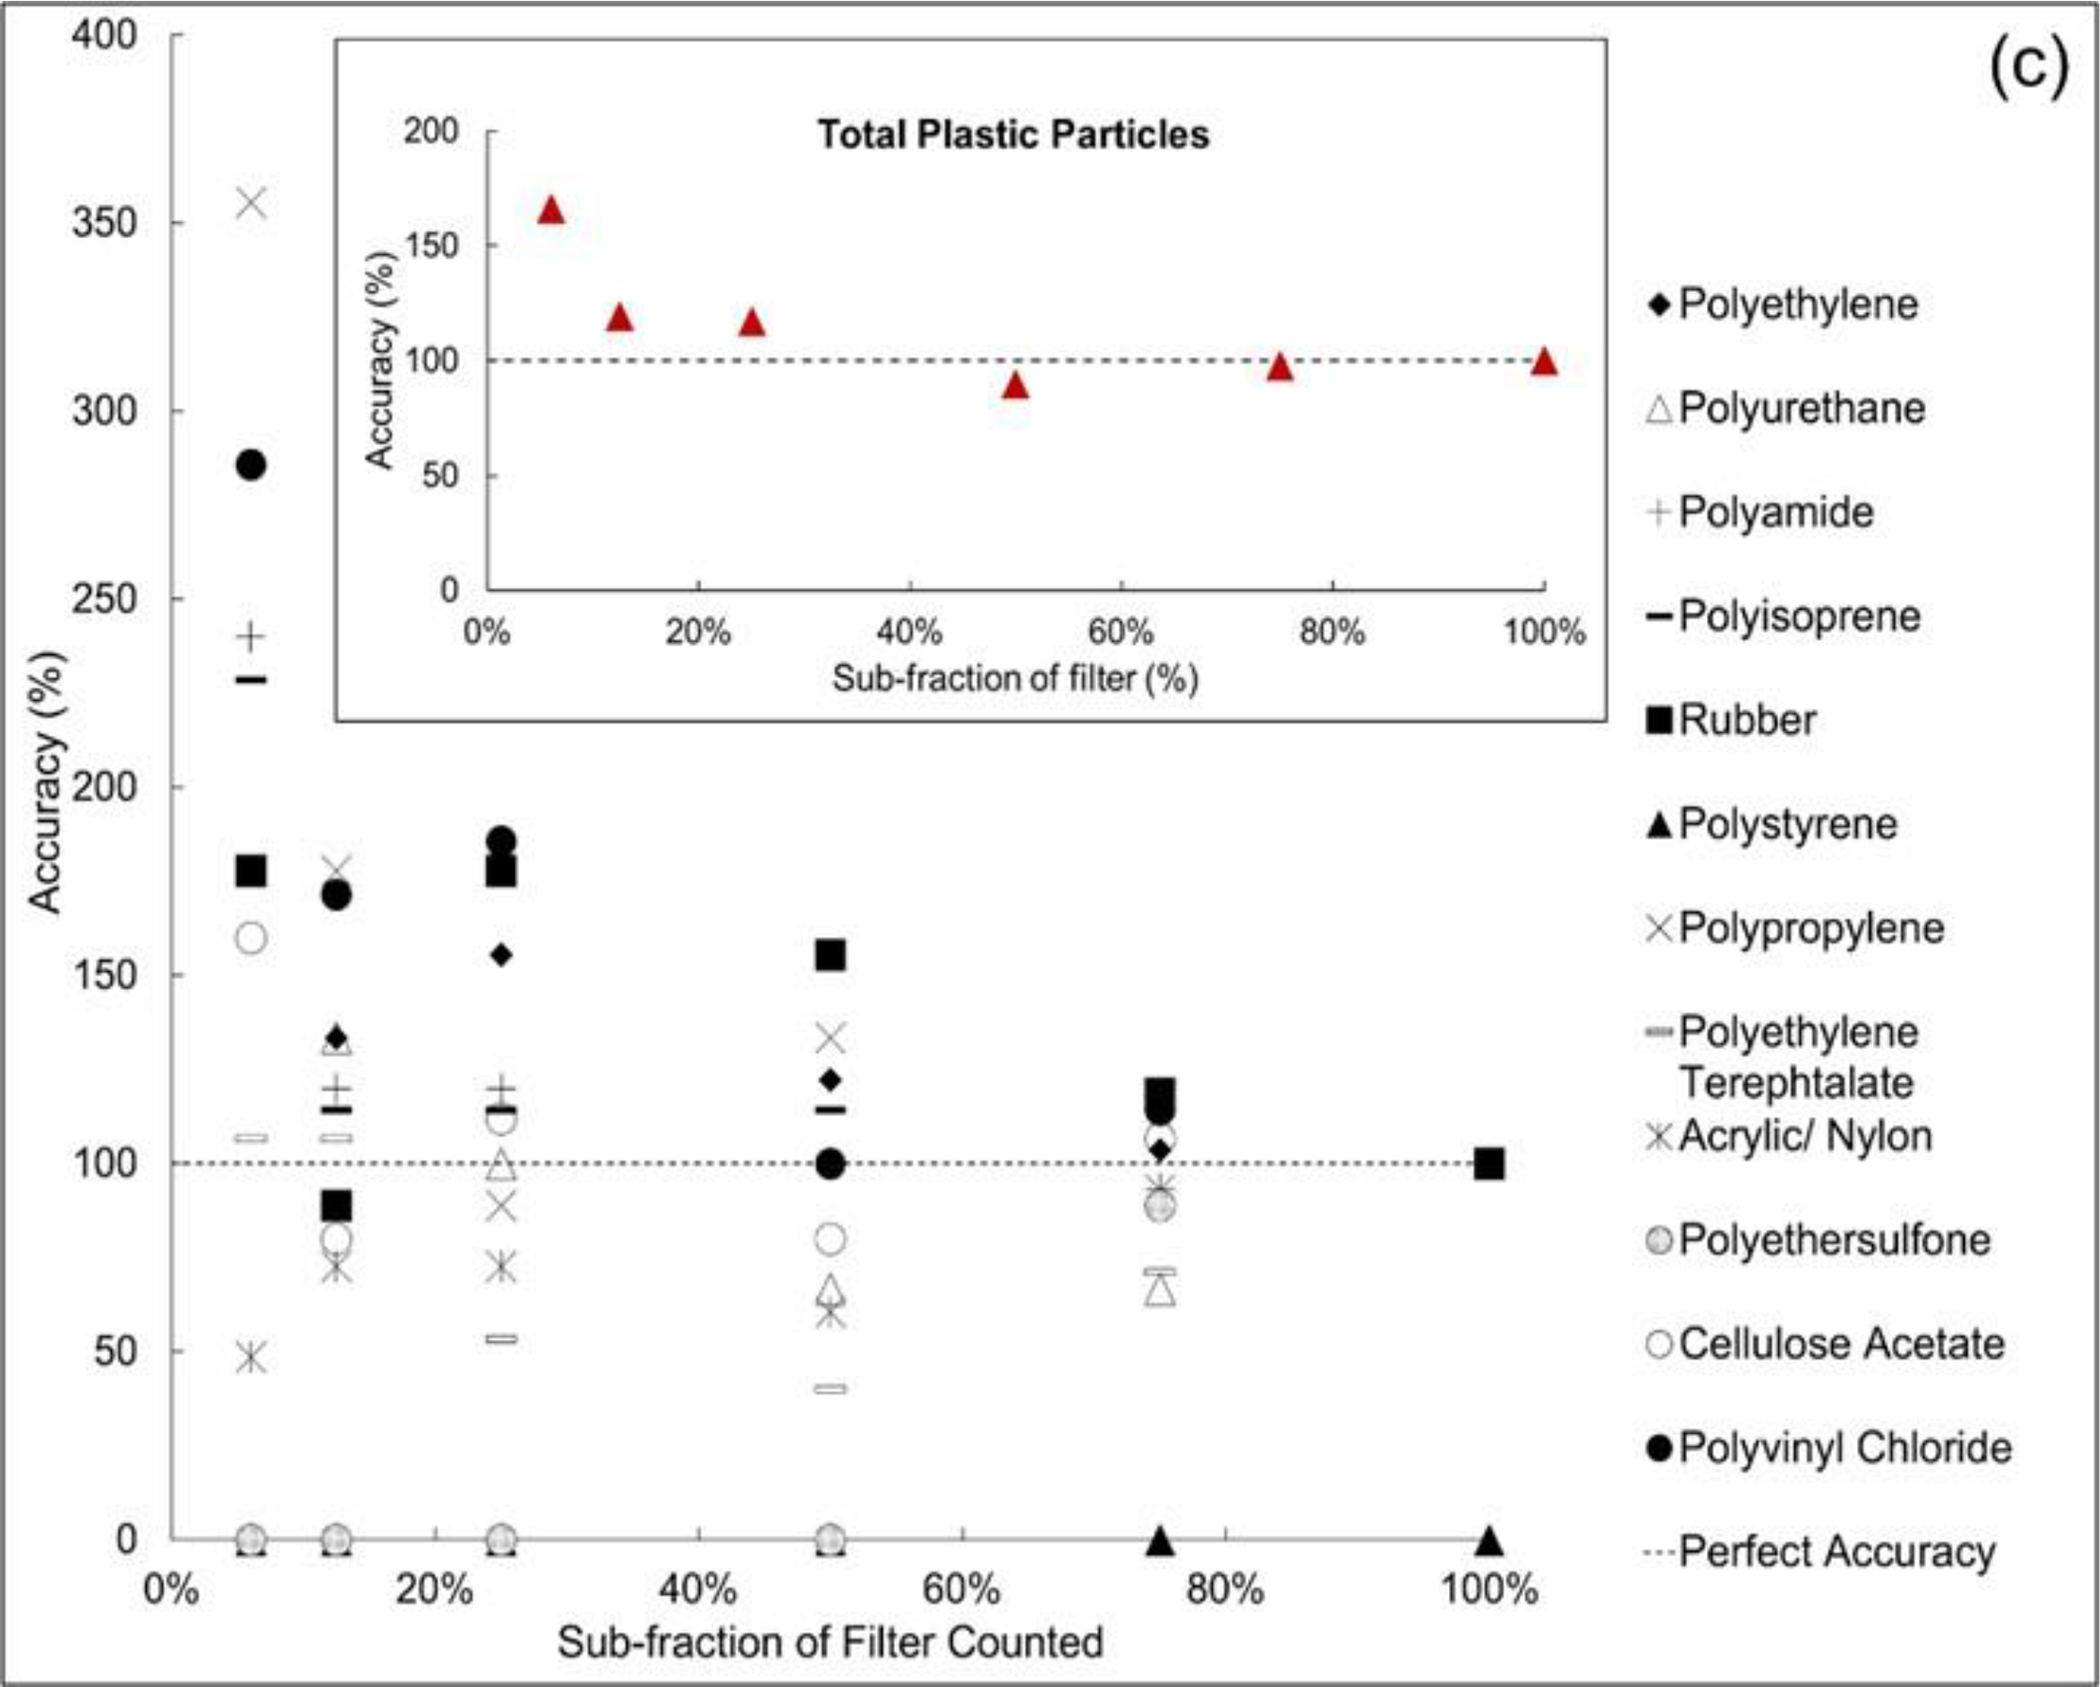
Extrapolated accuracy values for several polymers for the (a) DI water MP solutions, (b) Region 1 station 4, and (c) Region 9 station 5. The insets illustrate ‘total plastic’ extrapolation accuracy. Accuracy is defined as the ratio of the number of polymer particles counted in a filter fraction and the polymer particles counted in the entire filter multiplied by 100. In each plot, perfect accuracy is represented by the horizontal dashed line.
Table 2).
Summary of statistical analyses performed on DI water and two environmental sediments as part of the subsampling component of this study. For these analyses, the dependent variable was the sum of all polymers detected.
| Sample Type | Sample ID | Statistical Tests | Statistical Endpoint | Difference Among All Filter Fractions | Individual Differences between Filter Fractions |
|---|---|---|---|---|---|
| DI water | 1 | Multi-factor ANOVA followed by Dunnett’s Test (100% used as control) | Significant difference between means |
No: F-test: 2.79; p = 0.057 | No significant differences detected, not performed. |
| 2 | No: F-test: 0.61; p = 0.691 | No significant differences detected, not performed. | |||
| 3 | Yes: F-test: 3.76; p = 0.021 | Extrapolation of 6% filter wedge was greater than 100% counted | |||
| 4 | Yes: F-test: 4.98; p = 0.007 | Extrapolation of 6% filter wedge was greater than 100% counted | |||
| Sediment 1 | Region 1; 4A-B1 | Kruskal-Wallis followed by Dwass, Steel, Critchlow-Fligner pairwise comparisons | Relative accuracy | No: X2 = 5.02; p = 0.286 | No significant differences detected |
| Absolute bias | Yes: X2 = 12.3; p = 0.015 | Extrapolation of 6% filter wedge was greater than the 75% filter wedge extrapolation | |||
| Sediment 2 | Region 9; 5B-B1 | Kruskal-Wallis followed by Dwass, Steel, Critchlow-Fligner pairwise comparisons | Relative accuracy | Yes: X2=10.0, p = 0.040 | No significant differences detected. |
| Absolute bias | Yes: X2=23.6, p < 0.001 | Extrapolation of 6% filter wedge was greater than 12, 50 and 75% filter wedge extrapolations |
Table 3).
Summary of time consumed during Raman analysis scanning of four replicate filter samples in the subsampling component of the DI water study. Preparation includes placing the filter on a 5 mm × 5 mm grid sheet using Skin Tac liquid adhesive and holding it in-place on the Raman microscope stage using magnets.
| Raman Time Consumption (Minutes) | |||||||
|---|---|---|---|---|---|---|---|
| 6.25% | 12.5% | 25% | 50% | 75% | 100% | ||
| Sample 1 | Filter Preparation | 20 | 20 | 20 | 20 | 20 | 20 |
| Generating Maps | 150 | 200 | 240b | 170 | 180 | 150 | |
| Scanning Timea | 44 | 71 | 148 | 307 | 493 | 609 | |
| Total Time | 214 | 291 | 408 | 497 | 693 | 779 | |
| Sample 2 | Filter Preparation | 25 | 25 | 25 | 25 | 25 | 25 |
| Generating Maps | 40 | 90 | 180 | 190 | 160 | 170 | |
| Scanning Time | 44 | 59 | 133 | 361 | 429 | 466 | |
| Total Time | 109 | 174 | 338 | 576 | 614 | 661 | |
| Sample 3 | Filter Preparation | 15 | 15 | 15 | 15 | 15 | 15 |
| Generating Maps | 40 | 100 | 190 | 180 | 170 | 160 | |
| Scanning Time | 43 | 66 | 129 | 289 | 410 | 529 | |
| Total Time | 98 | 181 | 334 | 484 | 595 | 704 | |
| Sample 4 | Filter Preparation | 20 | 20 | 20 | 20 | 20 | 20 |
| Generating Maps | 30 | 90 | 140 | 150 | 170 | 170 | |
| Scanning Time | 51 | 83 | 170 | 294 | 360 | 420 | |
| Total Time | 101 | 193 | 330 | 464 | 550 | 610 | |
| Average Time Consumption (min) | 131 | 210 | 353 | 505 | 613 | 689 | |
| Standard Deviation | 55.9 | 54.7 | 37.1 | 49.1 | 59.7 | 71.5 | |
| Standard Error | 27.9 | 27.4 | 18.6 | 24.5 | 29.9 | 35.8 | |
Scanning time depends on the number of particles. Normally, it requires 1.2 minutes to scan one particle.
Technical difficulties – the computer and instrument needed to be restarted several times.
Results of the analysis of the sub-fraction RSDs found the sub-fractionation process did increase expected error above simple imprecision resulting from random counting error (Figure S1). The ratio of observed RSDs to the expected Poisson error ranged from 1.0 to 1.7, 3.1 to 7.9, and 3.6 to 6.3 for fragments, microbeads and fibers, respectively. The fragments showed the smallest additional error while the microbeads demonstrated the largest. This trend correlated with the number of particles counted on the filter sub-fractions, with the microbeads having approximately seven times more particles counted than the fragments for any given filter sub-fraction. As expected, the ratio also increased (i.e., the additional error increased) as the sub-fraction of the filter being counted became smaller (SM Figure S1). However, compared to the ratios determined when counting the entire filter (100%), the increase in error for the 12.5 sub-fraction (selected based on the ANOVA described above), increased by 42% to 71% for the fibers and microbeads while decreasing by 27% for the fragments. The increased error resulting from counting the 12.5% sub-fraction is clearly not desirable but the advantage gained in time and labor savings must be considered in balancing the practicality of using the 12.5% sub-fraction versus optimal accuracy (i.e., counting 100% of each filter). More specifically, counting the 12.5% sub-fraction saved 2 hr, 5 hr, 7 hr and 8 hr of counting when compared to the 25%, 50%, 75% and 100% sub-fractions, respectively. In addition, the accuracy of counts in the 12.5% and larger sub-fractions were of a similar magnitude (Figure 3a). This suggests counting a larger fraction does not necessarily result in greater accuracy.
Environmental sediments
Extrapolated fractional results for the two environmental sediment samples from a silty particle sediment (Region 1: Station 4) and a beach sand (Region 9: Station 5) are shown in Figure 3b and 3c. For both sediments, like the DI water study, statistical analysis found that extrapolation from the 6.25% fraction was significantly greater than extrapolations based on the other filter fractions (Table 2). Specifically, for the Region 1 sediment, the relative accuracy endpoint did not find significant differences, but the absolute bias endpoint did identify the 6.25% sub-fraction as significantly greater than the 75% filter fraction. Similarly, for the Region 9 sediment, the relative bias endpoint did not find any differences while the absolute bias found the 6.25% filter fraction was significantly greater than the 12.5%, 50% and 75% sub-fractions. These results also demonstrate that extrapolating from the smaller filter fractions leads to unacceptable counting inaccuracy. For example, at the 6.25% sub-fraction, the extrapolation of plastic polymers resulted in large range of errors between 10 and 230%. Additionally, the highest extrapolation errors occurred in a few polymer types such as PA (140% in Region 9 and 230% in Region 1), PP (36% in Region 1 and 255% in Region 9), and PVC (28% Region 1 and 185% in Region 9).
Both the DI water and environmental sediment data suggest using the 6.25% sub-fraction to estimate the entire filter counts of MPs would result in statistically significant over-estimations. Based on the analysis of the statistical differences between sub-fractions and the time consumed in the analysis of the DI water and two sediments, we adopted the 12.5% sub-fraction of the filters to count for the Regional sediment samples discussed below. Using this sub-fraction, the 12.5% count results were multiplied by 8 to extrapolate to the entire filter.
Environmental Regional Sediments
Overview
Spiked MP particles were successfully recovered from sediment samples at greater than 70%52. For the operation and air blanks, an average of 14 particles (range: 9 to 18 particles) were found and subtracted from the average MP concentrations for each Regional sediment sample. Microplastic particles were quantified in sediment samples collected from three of the four regions (i.e., Region 2, 3 and 9). Region 1 sediments were analyzed as part of an earlier study from our laboratory52 and included here for comparison of differences among regions of the country. Results for all samples include concentrations for each particle size fraction, particle shape, size, color, and polymers identified in the 12.5% filter subset of particles (SM Table S5). On average, a total of 40 and 1200 particles per 100 g wet sediment were chemically analyzed in the upper (250 to 1000 μm) and lower (45 to <250 μm) size ranges per sediment sample, respectively. The overall microplastic abundances do not include MP concentrations from three samples in Regions 1 and 2 (Region 1 station 4, Region 2 stations 8 and 9). These samples had very large numbers of cellulose acetate (CA) particles (e.g., estimated millions of particles) which would bias the conclusions for the behavior of the other polymers. These three samples are discussed below and in a separate publication52. Figure 4a shows MP abundances (number of particles/100 g wet sediment sample) averaged (± standard deviation) for all stations within each of the four regions.
Figure (4).
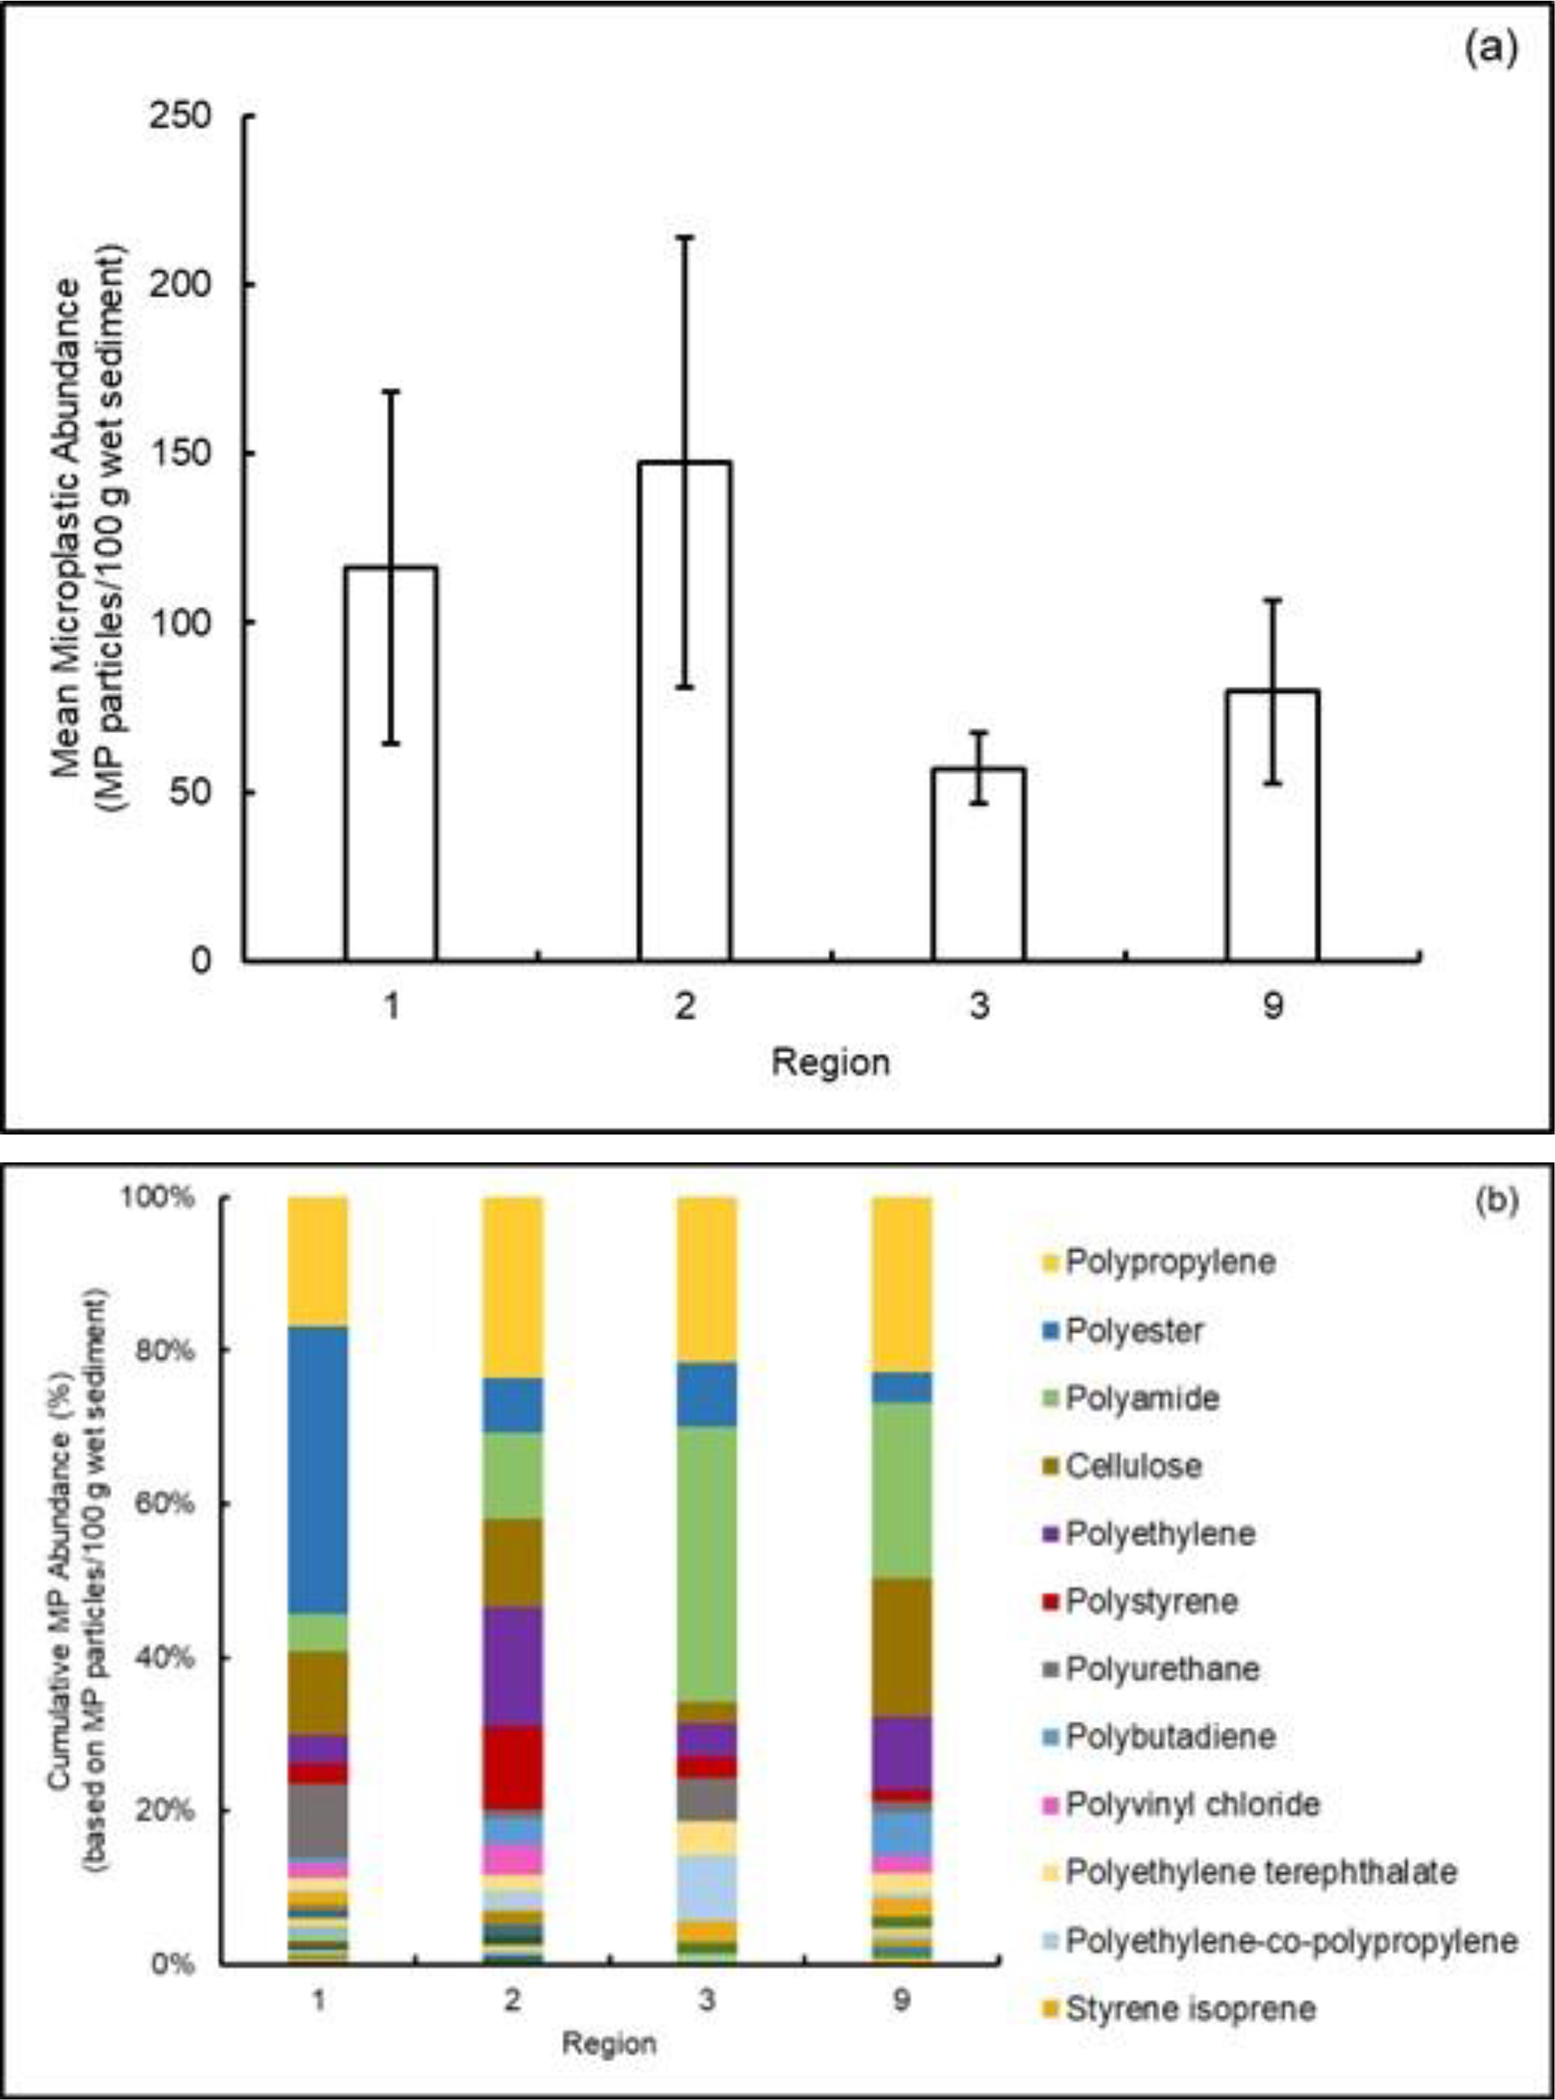
Summary of results of analyses on regional sediments including (a) mean ± standard deviation abundance of microplastic particles (in 100 g wet sediment) and (b) cumulative abundance (%) of the detected polymers. Note: the 12 most abundant polymers are listed here, SM Figure S3 lists all polymers detected. Regions 1, 2, 3 and 9 consisted of 7, 11, 5 and 5 stations, respectively. Data for Region 1 from Cashman et al.52.
Overall microplastic abundances
Results showed MP abundances ranging from 5 to 400 particles/100 g wet sediment in the different regions with the average MP concentrations of 1160 ± 960, 1218 ± 1260, 570 ± 180, and 796 ± 483 MP particles/Kg wet sample for Regions 1, 2, 3 and 9, respectively. This result is consistent with previous studies of sediments where MP concentrations ranged from 11 to 12,000 MP/Kg sample58–64. The wide range of MP abundances reflects differences among sediments as well as variations in particle size and sampling techniques, isolation and extraction methods, and identification approaches.
The highest number of MPs were found in Region 2 (Station 7) with a concentration of 3970 particles/Kg wet weight, while the minimum also occurred in Region 2 (Station 12) with a concentration of 50 particles/Kg wet weight representing a range of up to two orders of magnitude among the different stations. Samples 7 to 12 in Region 2 were taken outside the Jamaica Bay Wildlife Refuge. This area is subject to a variety of sources of MPs such as wastewater treatment plants (WWTPs) effluent, tire wear particles and other road runoff, as well as recreational fishing and boating. The circulation is generally tidally controlled, and while there may be some local deposition at Station 7 from longshore transport of sand, we cannot determine that the differences result from circulation patterns. Region 2 stations 1 to 6 are located in Raritan Bay, New Jersey are more industrialized in nature. The Raritan Bay, Raritan River and the Arthur Kill are home to numerous industries and more than 20 U.S. EPA Superfund sites. Both areas have high-density human populations and receive treated municipal effluent as well as storm-water runoff which is a major-sources of MPs65. The wide range of MP concentrations are likely due to river flow, marine and estuarine currents and tidal action, and proximity to sources. These factors are likely to contribute to the overall heterogeneity and lack of obvious spatial distribution patterns within the Region.
While no statistically significant differences in MP abundances were found among the regions, Region 3 generally had the lowest levels of MPs. This was unexpected as this region includes numerous WWTPs, combined sewer overflows (CSOs) (Figure 2), and several marinas (SM Figure S2). Interestingly, a recent study observed that MP abundance, measured in surficial sediments, decreases exponentially with increasing sediment grain size66. These observations were also reported in beach sand67. This may explain our observations for low MP abundance in Regions 3 and 9 (Figure 4a) where the sediments are mostly sand with coarser particle distributions than the finer sediments from Regions 1 and 2 (SM Table S2). In addition, the Region 3 sediments were collected from the only riverine system in this investigation and may have higher flow rates and flushing of the MPs. Recently, Samandra et al.68 noted similar complexities in understanding MP behavior in dynamic urban riverine systems in Australia. Region 9 had the second lowest MP abundances among the regions and the least number of WWTPs with a lower human population served in comparison with the other regions. However, Region 9 has a high number of marinas which can be point sources of MPs69. In addition, a recent study on the West Coast pointed to storm water runoff as a major source of MP pollution as compared to WWTPs70.
Types of polymers measured
Raman analysis of particles from regional sediment samples showed a mixture of polymers (Figure 4a, b, SM Figure S3). The most abundant polymers across all regions were in descending order: PP, PES, PA, PE, PS, PU, PVC, polybutadiene, PET, and others (SI Table S3). These polymers in sediments have been reported in a review detailing the magnitude of plastic pollution in different parts of the world58. Knowledge of the presence of these polymers can be critical with determining their source attribution. For example, PP is frequently used in fishing nets and plastic bottles, two common sources of plastic pollution in sediments due to fragmentation. In contrast, PES is used in clothing, a major source of microfiber release, PE is used in manufacturing of food packaging and plastic bags, and PB is commonly found in tire wear particles an indicator of road run-off71.
Polymer shapes, colors and sizes
In addition to the abundance and types of polymers, MPs morphology (e.g., shape, color and size) was also recorded in our study since the deposition of MPs in sediments can be affected by these variables72. Further, morphology can also influence ecological effects of MPs73. MPs particle shapes were similar among the four Regional environments and categorized into seven major shapes: fragment, fiber, film, flake, sphere, pellet and foam. Our results showed fragments were the most abundant shape in the sediment samples followed by fibers, accounting for 61.3% and 15.6%, respectively, with the minor presence of the remaining shapes (Figure 5a). This result is consistent with the findings of previous studies where both fragments and fibers were the two most common microplastic shapes58. As noted earlier, MP fragments are usually the result of physical, chemical and biological degradation of large plastic pieces through weathering processes, while fibers can be released from textiles, ropes, and fishing nets74,75. Additionally, ongoing research in our laboratory and others (e.g., Southern California Coastal Water Research Project, Costa Mesa, CA, USA)76 indicate fibers may be under-reported in environmental samples given their relatively small diameters allowing passage through isolation method sieves and filters that impede larger particles.
Figure (5).
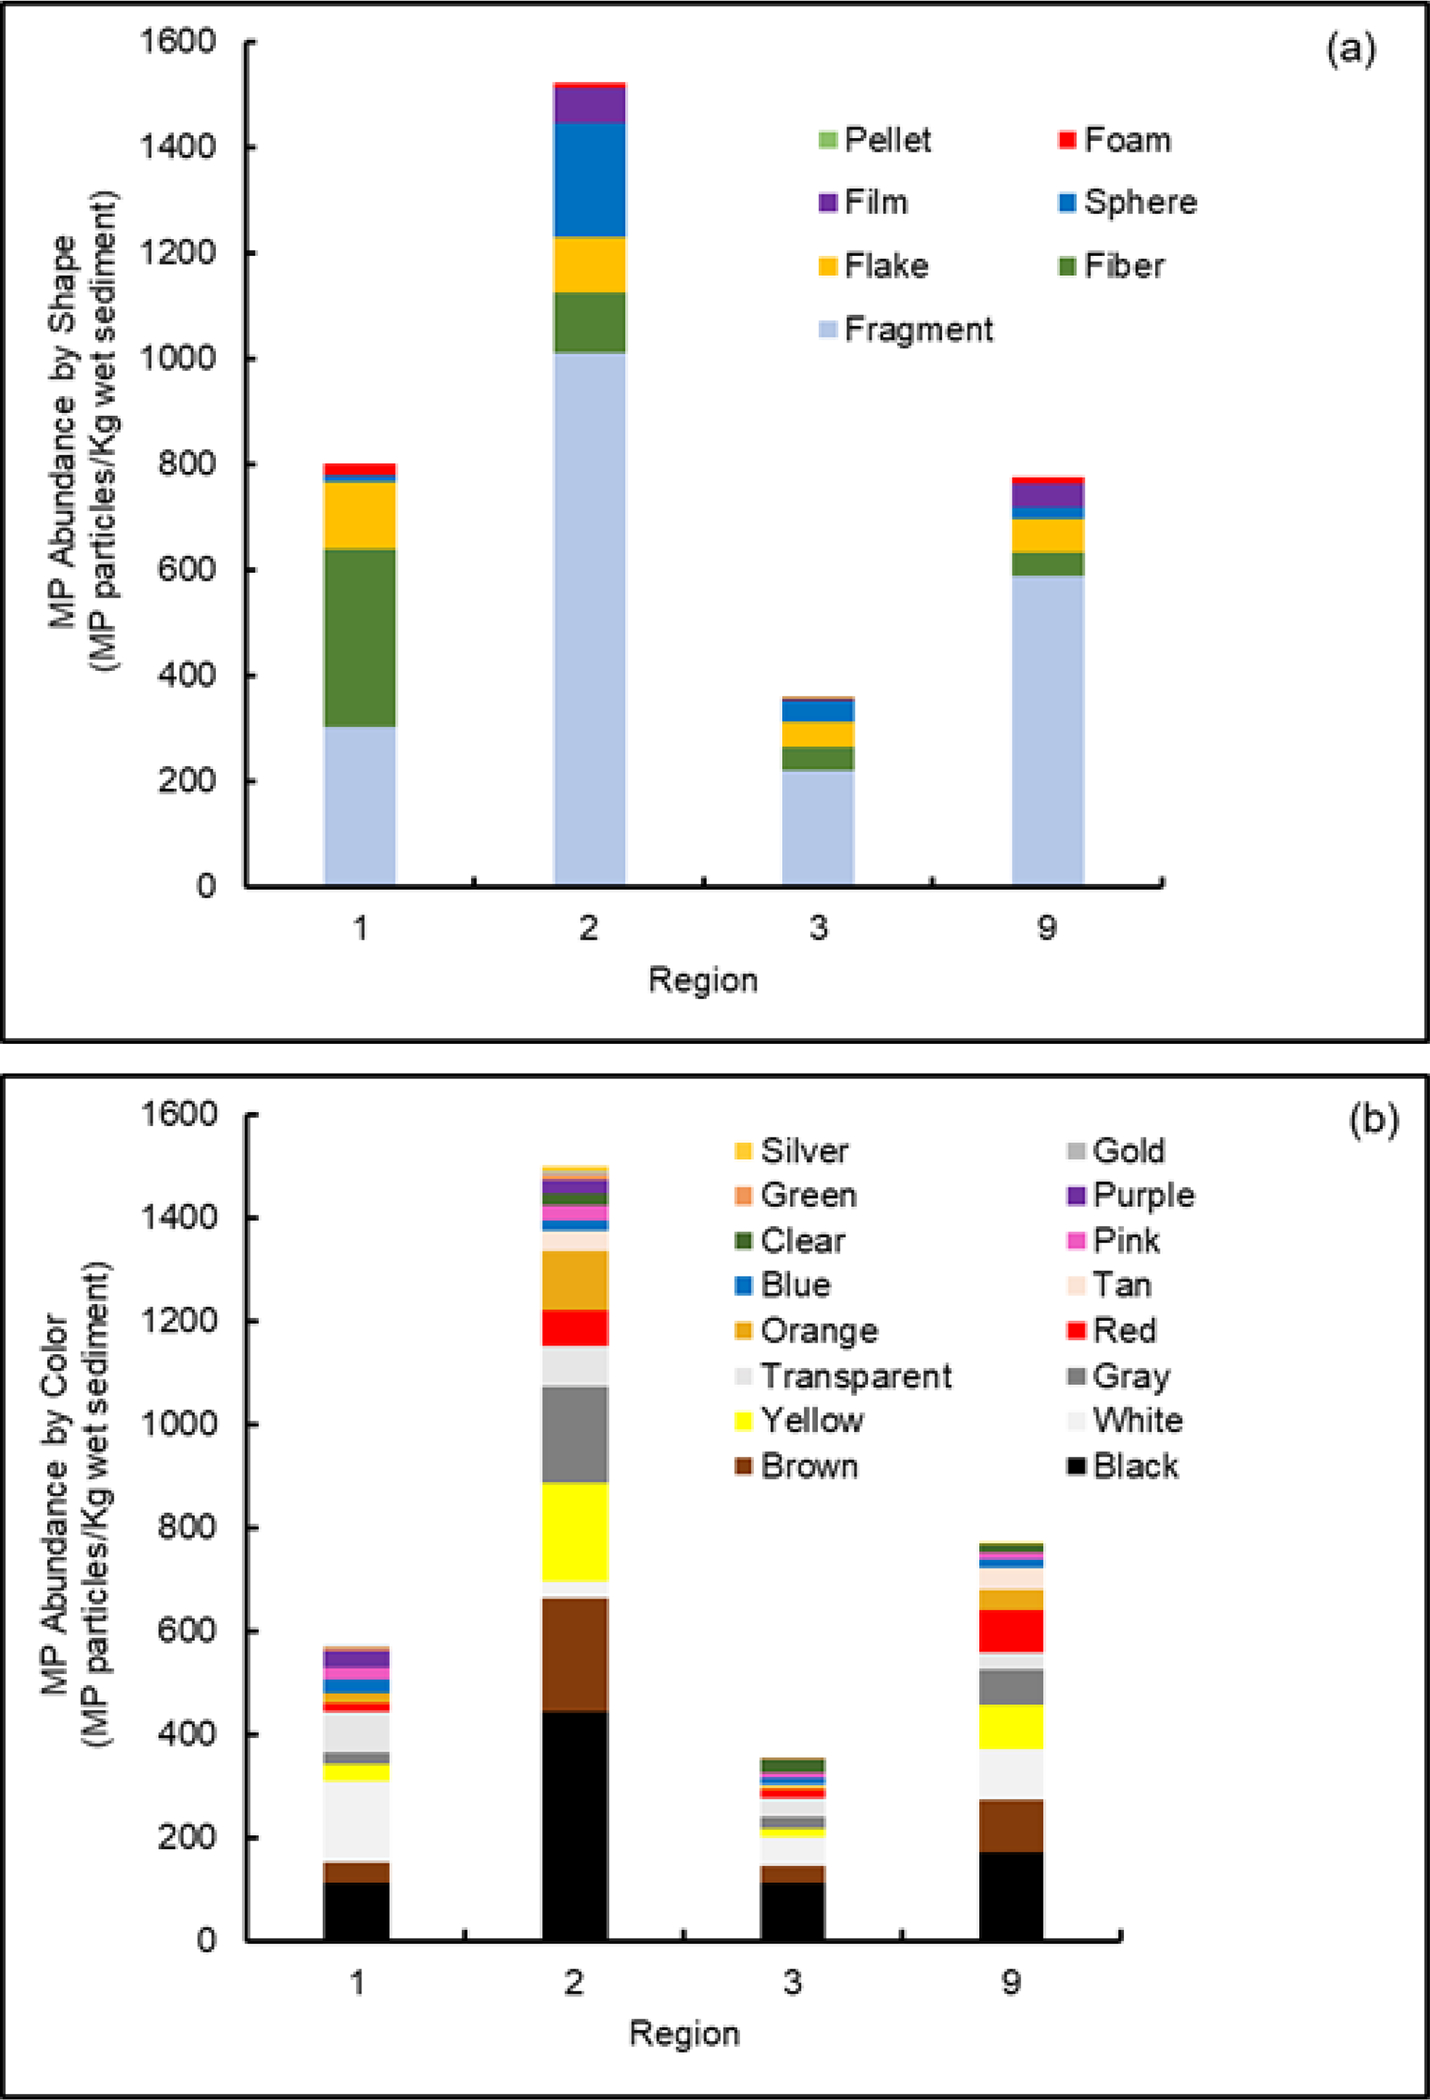
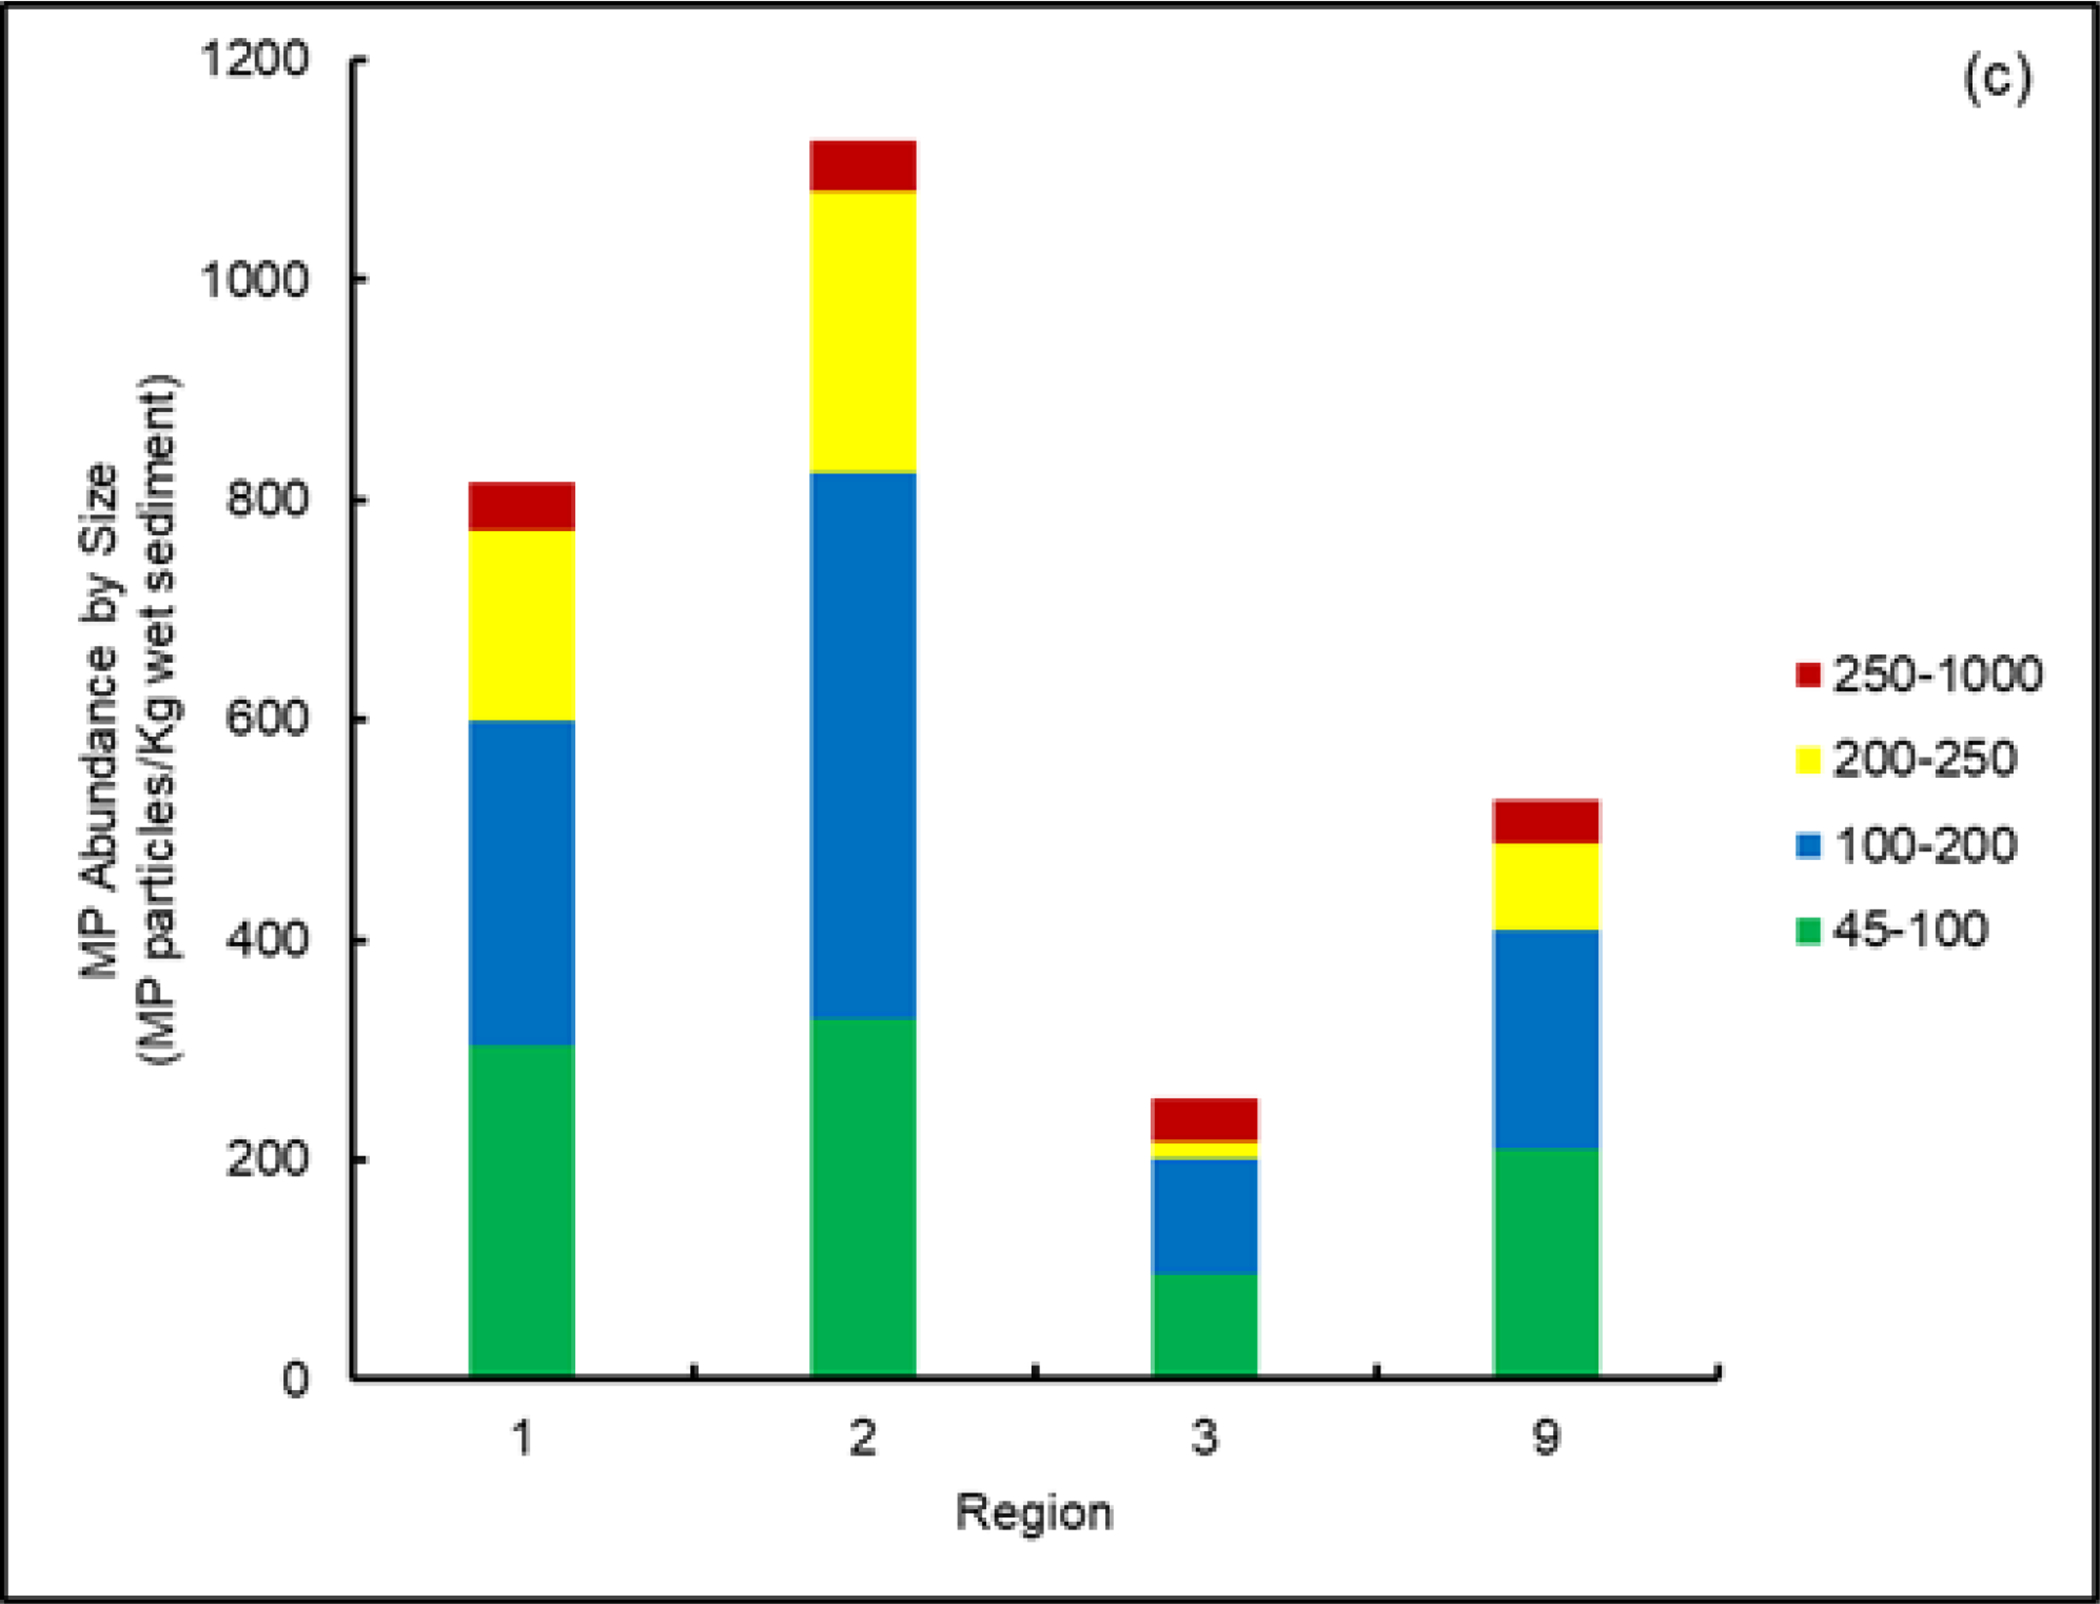
Summary of the abundance of microplastic particles across regions by (a) shape, (b) colors, and (c) size ranges (based on 100 g wet sediment). Data for Region 1 from Cashman et al.52.
Interestingly, there was a high abundance of CA fibers (approximately 6,000,000) in both Regions 1 and 2 at multiples stations (e.g., R1 (station 4) and R2 (stations 8 and 9)). These fibers are transparent with diameters of 5 μm and lengths of 300 μm and occurred in small bundles forming a fragment or mat shape (SM Figure S4). As noted above, the CA fibers were not accounted for within our polymer counts because of their unusual shape and extremely high abundances in comparison with the other polymer particles (at these stations). Not including them provides a better representation of the general distribution of all of the polymers present. The presence and origin of these CA fibers was discussed thoroughly in a previous paper52. Cashman et al.52 speculated that in Region 1 (Narraganset Bay, RI) this polymer may have originated from manufacturing of CA textiles used in marine industries. While the same may be true of CA fiber masses found in Region 2 (NY/ NJ Harbor) where recreational boating occurs, we cannot be certain of the source of this large number of CA fibers.
Like the shapes, findings for the MP colors showed a broad spectrum (Figure 5b) with black, brown and white being the most abundant colors averaging 26%, 15% and 11%, respectively. The numbers of these achromatic colors can be attributed to the difficulty of observing the exact color, especially for the smaller size range particles that are identified by Raman mapping as colors are difficult to determine with this type of spectroscopy. In addition, oxidation of sediment samples (performed to remove natural organic matter that can interfere with analysis) can “bleach” many of the brighter colors. Variability in MP colors is also reported in previous studies77,78.
Similar to shape and color, MPs sizes were recorded and classified into four categories: 45 to 100, 100 to 200, 200 to 250, and 250 to 1000 μm. All sediment samples from the four Regions were found to have more smaller-sized MPs (e.g., 45 to 200 μm); for example, 74.8% of all particles were dominated by this size category (Figure 5c). This is consistent with several previous studies79,80. The high abundance of smaller MPs is most likely due to the breakdown by degradation processes of larger plastic particles resulting in their increased accumulation in the sediment.
Conclusions
In this study, we describe a subsampling method for the Raman-based spectroscopic measurement of microplastics present in sediments. The subsampling method is intended to ensure an accurate representation of all particles when using a sub-fraction of the filter to extrapolate to the entire filter (i.e., 100%). Statistical analyses showed a 12.5% fraction of the filter in a wedge shape provides an appropriate representation of the filter. This was demonstrated using a variety of the most common plastic polymers (i.e., PE, PVC, PET) in different sizes and shapes ranging between 50 to 3000 μm in several DI water solutions. A comparison of the time necessary to quantify 100% of a filter for MPs versus counting only a sub-fraction of the filter to estimate total MPs demonstrated how practical and useful the extrapolation approach can be for efficiently quantifying and identifying MPs in environmental samples (e.g., as would be performed in a monitoring program). For example, we found counting only 12.5% of a filter reduced the time necessary to characterize a sediment sample by 69%. This decreased time per sample increases the ability of monitoring programs to consider including the presence of MP in sediments as a routine measurement. We also validated the subsampling method using two environmentally contaminated sediments arriving at results that agreed with the findings from the DI water study. Beyond this, replicate analysis of the DI water amended with known MPs is useful for quantifying imprecision and understanding the relative error of environmental measurements. Finally, applying the subsampling method, 28 environmentally contaminated sediments from four coastal Regions of the United States were assessed for the presence of MPs. Results from that analysis agreed largely with similar studies performed on other coastal sediments. This component of the investigation contributes to our growing understanding of MP distributions, abundances and types in coastal areas and continues to reveal information necessary to identify sources of MP contamination.
Supplementary Material
Acknowledgements
We acknowledge the support from the Regional Applied Research Effort Program (RARE Project 1896). The authors also appreciate the insightful comments on the draft manuscript by the internal reviewers Tara Burke, James Farnan and Sandra Robinson. In addition, the authors appreciate recommendations for statistical analyses provided by Kenneth Miller (General Dynamics Information Technology, Alexandria, VA, USA). This work was performed while Dounia El Khatib and Troy Langknecht were ORISE research associates at the U.S. EPA’s ORD/CEMM Atlantic Coastal Environmental Sciences Division (Narragansett, RI).
Footnotes
This is CEMM/ACESD Contribution: ORD-053593
Mention of trade names or commercial products does not constitute endorsement or recommendation for use. The views expressed in this article are those of the authors and do not necessarily represent the views or policies of the U.S. Environmental Protection Agency.
References
- 1.Wagner M, Scherer C, Alvarez-Munoz D, Brennholt N, Bourrain X, Buchinger S, Fries E, Grosbois C, Klasmeier J, Marti T, Rodriguez-Mozaz S, Urbatzka R, Vethaak AD, Winther-Nielsen M, Reifferscheid G 2014. Microplastics in freshwater ecosystems: what we know and what we need to know. Environmental Sciences Europe. 26: 1–9. 10.1186/s12302-014-0012-7 [DOI] [PMC free article] [PubMed] [Google Scholar]
- 2.Lasee S, Mauricio J, Thompson WA, Karnjanapiboonwong A, Kasumba J, Subbiah S, Morse AN, Anderson TA 2017. Microplastics in a freshwater environment receiving treated wastewater effluent. Integrated Environmental Assessment and Management. 13:528–532. 10.1002/ieam.1915 [DOI] [PubMed] [Google Scholar]
- 3.Free CM, Jensen OP, Mason SA, Eriksen M, Williamson NJ, Boldgiv B 2014. High-levels of microplastic pollution in a large, remote, mountain lake. Marine Pollution Bulletin. 85: 156–163. 10.1016/j.marpolbul.2014.06.001 [DOI] [PubMed] [Google Scholar]
- 4.Eriksen M, Mason S, Wilson S, Box C, Zellers A, Edwards W, Farley H, Amato S 2013. Microplastic pollution in the surface waters of the Laurentian Great Lakes. Marine Pollution Bulletin 77:177–182. 10.1016/j.marpolbul.2013.10.007 [DOI] [PubMed] [Google Scholar]
- 5.State of California. 2020. State Water Resources Control Board Resolution No. 2020–0021 Adoption of Definition of ‘Microplastics In Drinking Water’. Sacramento, CA, USA: https://www.waterboards.ca.gov/board_decisions/adopted_orders/resolutions/2020/rs2020_0021.pdf [Google Scholar]
- 6.Fendall LS, Sewell MA, 2009. Contributing to marine pollution by washing your face: Microplastics in facial cleansers. Marine Pollution Bulletin. 58:1225–1228. 10.1016/j.marpolbul.2009.04.025 [DOI] [PubMed] [Google Scholar]
- 7.Browne M, Crump P, Niven S, Teuten E, Tonkin A, Galloway T, Thompson R 2011. Accumulation of microplastic on shorelines worldwide: sources and sinks. Environmental Science and Technology 45:9175–9179. 10.1021/es201811s [DOI] [PubMed] [Google Scholar]
- 8.Siegfried M, Koelmans AA, Besseling E, Kroeze C 2017. Export of microplastics from land to sea. A modelling approach. Water Research. 127:249–257. 10.1016/j.watres.2017.10.011 [DOI] [PubMed] [Google Scholar]
- 9.Hernandez LM, Yousefi N, Tufenkji N, 2017. Are there nanoplastics in your personal care products? Environmental Science and Technology Letters. 4:280–285. 10.1021/acs.estlett.7b00187 [DOI] [Google Scholar]
- 10.Duis K, Coors A, 2016. Microplastics in the aquatic and terrestrial environment: sources (with a specific focus on personal care products), fate and effects. Bridging Science and Regulation at the Regional and European Level. 28:1–25. 10.1186/s12302-015-0069-y [DOI] [PMC free article] [PubMed] [Google Scholar]
- 11.Cole M, Lindeque P, Halsband C, Galloway TS, 2011. Microplastics as contaminants in the marine environment: A review. Marine Pollution Bulletin 62:2588–2597. 10.1016/j.marpolbul.2011.09.025 [DOI] [PubMed] [Google Scholar]
- 12.ter Halle A, Ladirat L, Gendre X, Goudouneche D, Pusineri C, Routaboul C, Tenailleau C, Duployer B, Perez E, 2016. Understanding the fragmentation pattern of marine plastic debris. Environmental Science and Technology 50:5668–5675. 10.1021/acs.est.6b00594 [DOI] [PubMed] [Google Scholar]
- 13.Jambeck JR, Geyer R, Wilcox C, Siegler TR, Perryman M, Andrady A, Narayan R, Law KL 2015. Plastic waste inputs from land into the ocean. Science 347:768–771. DOI: 10.1126/science.1260352 [DOI] [PubMed] [Google Scholar]
- 14.Näkki P, Setälä O, Lehtiniemi M, 2019. Seafloor sediments as microplastic sinks in the northern Baltic Sea – Negligible upward transport of buried microplastics by bioturbation. Environmental Pollution 249:74–81. 10.1016/j.envpol.2019.02.099 [DOI] [PubMed] [Google Scholar]
- 15.Long M, Moriceau B, Gallinari M, Lambert C, Huvet A, Raffray J, Soudant P 2015. Interactions between microplastics and phytoplankton aggregates: Impact on their respective fates. Marine Chemistry 175:39–46. 10.1016/j.marchem.2015.04.003 [DOI] [Google Scholar]
- 16.Kowalski N; Reichardt AM; Waniek JJ 2016. Sinking rates of microplastics and potential implications of their alteration by physical, biological, and chemical factors. Marine Pollution Bulletin 109:310–319. 10.1016/j.marpolbul.2016.05.064 [DOI] [PubMed] [Google Scholar]
- 17.Kooi M; Nes E. H. v.; Scheffer M; Koelmans AA 2017. Ups and downs in the ocean: effects of biofouling on vertical transport of microplastics. Environmental Science and Technology 51:7963–7971. 10.1021/acs.est.6b04702 [DOI] [PMC free article] [PubMed] [Google Scholar]
- 18.Cole M; Lindeque PK; Fileman E; Clark J; Lewis C; Halsband C; Galloway TS 2016. Microplastics alter the properties and sinking rates of zooplankton faecal pellets. Environmental Science and Technology 50:3239–3246. 10.1021/acs.est.5b05905 [DOI] [PubMed] [Google Scholar]
- 19.Galloway TS; Cole M; Lewis C, 2017. Interactions of microplastic debris throughout the marine ecosystem. Nature Ecology and Evolution 1:116. [DOI] [PubMed] [Google Scholar]
- 20.Courtene-Jones W; Quinn B; Gary SF; Mogg AOM; Narayanaswamy BE 2017. Microplastic pollution identified in deep-sea water and ingested by benthic invertebrates in the Rockall Trough, North Atlantic Ocean. Environmental Pollution 231:271–280. 10.1016/j.envpol.2017.08.026 [DOI] [PubMed] [Google Scholar]
- 21.Hermabessiere L, Dehaut A, Paul-Pont I, Lacroix C, Jezequel R, Soudant P, Duflos G. 2017. Occurrence and effects of plastic additives on marine environments and organisms: a review. Chemosphere. 182: 781–793. 10.1016/j.chemosphere.2017.05.096 [DOI] [PubMed] [Google Scholar]
- 22.Liu W, Zhao Y, Shi Z, Li Z, Liang X. 2020. Ecotoxicoproteomic assessment of microplastics and plastic additives in aquatic organisms: A review. Comparative Biochemistry Physiology Part D: Genomics and Proteomics. 36:100713. 10.1016/j.cbd.2020.100713 [DOI] [PubMed] [Google Scholar]
- 23.Barrick A, Champeau O, Chatel A, Manier N, Northcott G, Tremblay LA. 2021. Plastic additives: challenges in ecotox hazard assessment. Peer J. 9: e11300. 10.7717/peerj.11300 [DOI] [PMC free article] [PubMed] [Google Scholar]
- 24.Reed S, Clark M, Thompson R, Hughes KA 2018. Microplastics in marine sediments near Rothera Research Station, Antarctica. Marine Pollution Bulletin. 133:460–463. 10.1016/j.marpolbul.2018.05.068 [DOI] [PubMed] [Google Scholar]
- 25.Piehl S, Mitterwallner V, Atwood EC, Bochow M, Laforsch C 2019. Abundance and distribution of large microplastics (1–5 mm) within beach sediments at the Po River Delta, northeast Italy. Marine Pollution Bulletin. 149:110515. 10.1016/j.marpolbul.2019.110515 [DOI] [PubMed] [Google Scholar]
- 26.Nuelle M-T, Dekiff JH, Remy D, Fries E 2014. A new analytical approach for monitoring microplastics in marine sediments. Environmental Pollution 184:161–169. 10.1016/j.envpol.2013.07.027 [DOI] [PubMed] [Google Scholar]
- 27.Martin J, Lusher A, Thompson RC, Morley A 2017. The deposition and accumulation of microplastics in marine sediments and bottom water from the Irish Continental Shelf. Science Reports 7:10772–10779. 10.1038/s41598-017-11079-2 [DOI] [PMC free article] [PubMed] [Google Scholar]
- 28.Claessens M, Meester SD, Landuyt LV, Clerck KD, Janssen CR 2011. Occurrence and distribution of microplastics in marine sediments along the Belgian coast. Marine Pollution Bulletin. 62:2199–2204. 10.1016/j.marpolbul.2011.06.030 [DOI] [PubMed] [Google Scholar]
- 29.Wessel CC, Lockridge GR, Battiste D, Cebrian J 2016. Abundance and characteristics of microplastics in beach sediments: Insights into microplastic accumulation in northern Gulf of Mexico estuaries. Marine Pollution Bulletin. 109:178–183. 10.1016/j.marpolbul.2016.06.002 [DOI] [PubMed] [Google Scholar]
- 30.Wang J, Peng J, Tan Z, Gao Y, Zhan Z, Chen Q, Cai L 2017. Microplastics in the surface sediments from the Beijiang River littoral zone: Composition, abundance, surface textures and interaction with heavy metals. Chemosphere. 171:248–258. 10.1016/j.chemosphere.2016.12.074 [DOI] [PubMed] [Google Scholar]
- 31.Sruthy S, Ramasamy EV 2017. Microplastic pollution in Vembanad Lake, Kerala, India: The first report of microplastics in lake and estuarine sediments in India. Environmental Pollution 222:315–322. 10.1016/j.envpol.2016.12.038 [DOI] [PubMed] [Google Scholar]
- 32.McEachern K, Alegria H, Kalagher AL, Hansen C, Morrison S, Hastings D 2019. Microplastics in Tampa Bay, Florida: Abundance and variability in estuarine waters and sediments. Marine Pollution Bulletin 148:97–106. 10.1016/j.marpolbul.2019.07.068 [DOI] [PubMed] [Google Scholar]
- 33.Klein S, Worch E, Knepper TP 2015. Occurrence and spatial distribution of microplastics in river shore sediments of the Rhine-Main area in Germany. Environmental Science and Technology 49:6070–6076. 10.1021/acs.est.5b00492 [DOI] [PubMed] [Google Scholar]
- 34.Corcoran PL, Norris T, Ceccanese T, Walzak MJ, Helm PA, Marvin CH 2015. Hidden plastics of Lake Ontario, Canada and their potential preservation in the sediment record. Environmental Pollution 204:17–25. 10.1016/j.envpol.2015.04.009 [DOI] [PubMed] [Google Scholar]
- 35.Baptista Neto JA, Gaylarde C, Beech I, Bastos AC, da Silva Quaresma V, de Carvalho DG 2019. Microplastics and attached microorganisms in sediments of the Vitória bay estuarine system in SE Brazil. Ocean and Coastal Management. 169:247–253. 10.1016/j.ocecoaman.2018.12.030 [DOI] [Google Scholar]
- 36.Alves VEN, Figueiredo GM 2019. Microplastic in the sediments of a highly eutrophic tropical estuary. Marine Pollution Bulletin 146: 326–335. 10.1016/j.marpolbul.2019.06.042 [DOI] [PubMed] [Google Scholar]
- 37.Araujo CF, Nolasco MM, Ribeiro AMP, Ribeiro-Claro PJA 2018. Identification of microplastics using Raman spectroscopy: Latest developments and future prospects. Water Research 142: 426–440. 10.1016/j.watres.2018.05.060 [DOI] [PubMed] [Google Scholar]
- 38.Ivleva NP, Wiesheu AC, Niessner R 2017. Microplastic in aquatic ecosystems. Angewandte Chemie International Edition 56:1720–1739. 10.1002/anie.201606957 [DOI] [PubMed] [Google Scholar]
- 39.Silva AB, Bastos AS, Justino CIL, da Costa JP, Duarte AC, Rocha-Santos TAP 2018. Microplastics in the environment: Challenges in analytical chemistry - A review. Analytica Chimica Acta 1017:1–19. [DOI] [PubMed] [Google Scholar]
- 40.Anger PM, von der Esch E, Baumann T, Elsner M, Niessner R, Ivleva NP 2018. Raman microspectroscopy as a tool for microplastic particle analysis. TrAC, Trends in Analytical Chemistry 109: 214–226. 10.1016/j.trac.2018.10.010 [DOI] [Google Scholar]
- 41.Löder MGJ, Imhof HK, Ladehoff M, Löschel LA, Lorenz C, Mintenig S, Piehl S, Primpke S, Schrank I, Laforsch C, Gerdts G 2017. Enzymatic Purification of Microplastics in Environmental Samples. Environmental Science and Technology 51:14283–14292. 10.1021/acs.est.7b03055 [DOI] [PubMed] [Google Scholar]
- 42.Sobhani Z, Al Amin M, Naidu R, Megharaj M, Fang C 2019. Identification and visualisation of microplastics by Raman mapping. Analytica Chimica Acta 1077:191–199. 10.1016/j.aca.2019.05.021 [DOI] [PubMed] [Google Scholar]
- 43.Oßmann BE, Sarau G, Holtmannspötter H, Pischetsrieder M, Christiansen SH, Dicke W 2018. Small-sized microplastics and pigmented particles in bottled mineral water. Water Research 141:307–316. 10.1016/j.watres.2018.05.027 [DOI] [PubMed] [Google Scholar]
- 44.Schymanski D, Goldbeck C, Humpf H-U, Fürst P 2018. Analysis of microplastics in water by micro-Raman spectroscopy: Release of plastic particles from different packaging into mineral water. Water Research 129:154–162. 10.1016/j.watres.2017.11.011 [DOI] [PubMed] [Google Scholar]
- 45.Sobhani Z, Zhang X, Gibson C, Naidu R, Megharaj M, Fang C 2020. Identification and visualisation of microplastics/nanoplastics by Raman imaging (i): Down to 100 nm. Water Research 174:115658–115658. [DOI] [PubMed] [Google Scholar]
- 46.Xu J-L, Thomas KV, Luo Z, Gowen AA 2019. FTIR and Raman imaging for microplastics analysis: State of the art, challenges and prospects. TrAC, Trends in Analytical Chemistry 119:115629. 10.1016/j.trac.2019.115629 [DOI] [Google Scholar]
- 47.Schwaferts C, Schwaferts P, von der Esch E, Elsner M, Ivleva NP 2021. Which particles to select, and if yes, how many?: Subsampling methods for Raman microspectroscopic analysis of very small microplastic. Analytical and Bioanalytical Chemistry 413:3625–3641. 10.1007/s00216-021-03326-3 [DOI] [PMC free article] [PubMed] [Google Scholar]
- 48.Thaysen C, Munno K, Hermabessiere L, Rochman CM. 2020. Towards Raman automation for microplastics: developing strategies for particle adhesion and filter subsampling. Applied Spectroscopy 74: 976–988. 10.1177/0003702820922900 [DOI] [PubMed] [Google Scholar]
- 49.Brandt J, Fischer F, Kanaki E, Enders K, Labrenz M, Fischer D. 2021. Assessment of subsampling strategies in microspectroscopy of environmental microplastic samples. Frontiers: Environmental Sciences 8:579676. 10.3389/fenvs.2020.579676 [DOI] [Google Scholar]
- 50.De Frond H AM O’Brien, CM Rochman. 2023. Representative subsampling methods for the chemical identification of microplastic particles in environmental samples. Chemosphere. 310:136772. 10.1016/j.chemosphere.2022.136772 [DOI] [PubMed] [Google Scholar]
- 51.Thaysen C, Munno K, Hermabessiere L, Rochman CM 2020. Towards Raman automation for microplastics: developing strategies for particle adhesion and filter subsampling. Applied Spectroscopy. 74:976–988. 10.1177/0003702820922900 [DOI] [PubMed] [Google Scholar]
- 52.Cashman MA, Langknecht T, El Khatib D, Burgess RM, Boving TB, Robinson S, Ho KT 2022. Quantification of microplastics in sediments from Narragansett Bay, Rhode Island USA using a novel isolation and extraction method. Marine Pollution Bulletin 174:113254–113254. 10.1016/j.marpolbul.2021.113254 [DOI] [PMC free article] [PubMed] [Google Scholar]
- 53.Cowger W, Steinmetz Z, Gray A, Munno K, Lynch J, Hapich H, Primpke S, De Frond H, Rochman C, Herodotou O 2021. microplastic spectral classification needs an open source community: open specy to the rescue. Analytical Chemistry 93:7543–7548. 10.1021/acs.analchem.1c00123 [DOI] [PubMed] [Google Scholar]
- 54.Munno K, De Frond H, O’Donnell B, Rochman CM 2020. Increasing the accessibility for characterizing microplastics: introducing new application-based and spectral libraries of plastic particles (SLoPP and SLoPP-E). Analytical Chemistry 92: 2443–2451. 10.1021/acs.analchem.9b03626 [DOI] [PubMed] [Google Scholar]
- 55.Park J-K, Lee S, Park A, Baek S-J 2020. Adaptive Hit-Quality Index for Raman spectrum identification. Analytical Chemistry 92:10291–10299. 10.1021/acs.analchem.0c00209 [DOI] [PubMed] [Google Scholar]
- 56.Wagner J, Robberson W, Allen H. 2022. Analytical precision assessment for microplastic analyses. Chemosphere 304:135295. 10.1016/j.chemosphere.2022.135295 [DOI] [PubMed] [Google Scholar]
- 57.Toutenburg H, Hollander M, Wolfe DA 2015. Nonparametric Statistical Methods. John Wiley & Sons, New York. pp 526–526. [Google Scholar]
- 58.Phuong NN, Fauvelle V, Grenz C, Ourgaud M, Schmidt N, Strady E, Sempéré R 2021. Highlights from a review of microplastics in marine sediments. The Science of the Total Environment 777:146225. 10.1016/j.scitotenv.2021.146225 [DOI] [Google Scholar]
- 59.Shahul Hamid F, Bhatti Mehran S, Anuar N, Anuar N, Mohan P, Periathamby A 2018. Worldwide distribution and abundance of microplastic: How dire is the situation? Waste Management Research 36:873–897. [DOI] [PubMed] [Google Scholar]
- 60.Yang L, Zhang Y, Kang S, Wang Z, Wu C 2021. Microplastics in freshwater sediment: A review on methods, occurrence, and sources. Science of the Total Environment.754: 141948–141948. 10.1016/j.scitotenv.2020.141948 [DOI] [PubMed] [Google Scholar]
- 61.Haave M, Lorenz C, Primpke S, Gerdts G 2019. Different stories told by small and large microplastics in sediment - first report of microplastic concentrations in an urban recipient in Norway. Marine Pollution Bulletin 141:501–513. 10.1016/j.marpolbul.2019.02.015 [DOI] [PubMed] [Google Scholar]
- 62.Tsering T, Sillanpää M, Sillanpää M, Viitala M, Reinikainen S-P 2021. Microplastics pollution in the Brahmaputra River and the Indus River of the Indian Himalaya. Science of the Total Environment. 789:147968–147968. 10.1016/j.scitotenv.2021.147968 [DOI] [PubMed] [Google Scholar]
- 63.He B, Goonetilleke A, Ayoko GA, Rintoul L 2020. Abundance, distribution patterns, and identification of microplastics in Brisbane River sediments, Australia. Science of the Total Environment. 700:134467–134467. 10.1016/j.scitotenv.2019.134467 [DOI] [PubMed] [Google Scholar]
- 64.Chinfak N, Sompongchaiyakul P, Charoenpong C, Shi H, Yeemin T, Zhang J 2021. Abundance, composition, and fate of microplastics in water, sediment, and shellfish in the Tapi-Phumduang River system and Bandon Bay, Thailand. Science of the Total Environment. 781:146700–146700. 10.1016/j.scitotenv.2021.146700 [DOI] [PubMed] [Google Scholar]
- 65.Qiu Z 2013. Comparative assessment of stormwater and nonpoint source pollution best management practices in suburban watershed management. Water 5:280–291. 10.3390/w5010280 [DOI] [Google Scholar]
- 66.Vermeiren P, Lercari D, Muñoz CC, Ikejima K, Celentano E, Jorge-Romero G, Defeo O 2021. Sediment grain size determines microplastic exposure landscapes for sandy beach macroinfauna. Environmental Pollution 286:117308–117308. 10.1016/j.envpol.2021.117308 [DOI] [PubMed] [Google Scholar]
- 67.Corcoran PL, de Haan Ward J, Arturo IA, Belontz SL, Moore T, Hill-Svehla CM, Robertson K, Wood K, Jazvac K 2020. A comprehensive investigation of industrial plastic pellets on beaches across the Laurentian Great Lakes and the factors governing their distribution. Science of the Total Environment 747:141227–141227. 10.1016/j.scitotenv.2020.141227 [DOI] [PubMed] [Google Scholar]
- 68.Samandra S, Singh J, Plaisted K, Mescall OJ, Symons B, Xie S, Ellis AV, Clarke BO 2023. Quantifying environmental emissions of microplastics from urban rivers in Melbourne, Australia. Marine Pollution Bulletin. 189. 114709. 10.1016/j.marpolbul.2023.114709 [DOI] [PubMed] [Google Scholar]
- 69.Amelia TSM, Khalik WMAWM, Ong MC, Shao YT, Pan H-J, Bhubalan K 2021. Marine microplastics as vectors of major ocean pollutants and its hazards to the marine ecosystem and humans. Progress in Earth and Planetary Science 8:1–26. 10.1186/s40645-020-00405-4 [DOI] [Google Scholar]
- 70.San Francisco Estuary Institute. 2019. Understanding microplastic levels, pathways, and transport in the San Francisco Bay region. SFEI-ASC Publication; #950 https://www.sfei.org/sites/default/files/biblio_files/Microplastic%20Levels%20in%20SF%20Bay%20-%20Final%20Report.pdf [Google Scholar]
- 71.Amy L, Peter H, Jeremy M-H 2017. Microplastics in fisheries and aquaculture: Status of knowledge on their occurrence and implications for aquatic organisms and food safety. FAO Fisheries and Aquaculture Technical Paper; 615. [Google Scholar]
- 72.Besseling E, Quik JTK, Sun M, Koelmans AA 2017. Fate of nano- and microplastic in freshwater systems: A modeling study. Environmental Pollution 220: 540–548. 10.1016/j.envpol.2016.10.001 [DOI] [PubMed] [Google Scholar]
- 73.Gray AD, Weinstein JE, 2017. Size- and shape-dependent effects of microplastic particles on adult daggerblade grass shrimp (Palaemonetes pugio). Environmental Toxicology and Chemistry 36:3074–3080. 10.1002/etc.3881 [DOI] [PubMed] [Google Scholar]
- 74.Monteiro RCP, Ivar do Sul JA, Costa MF 2018. Plastic pollution in islands of the Atlantic Ocean. Environmental Pollution 238:103–110. 10.1016/j.envpol.2018.01.096 [DOI] [PubMed] [Google Scholar]
- 75.Yuan W, Liu X, Wang W, Di M, Wang J 2019. Microplastic abundance, distribution and composition in water, sediments, and wild fish from Poyang Lake, China. Ecotoxicology and Environmental Safety 170:180–187. 10.1016/j.ecoenv.2018.11.126 [DOI] [PubMed] [Google Scholar]
- 76.Kotar S, McNeish R, Murphy-Hagan C, Renick V, Lee C-FT, Steele C, Lusher A, Moore C, Minor E, Schroeder J, Helm P, Rickabaugh K, DeFrond H, Gesulga K, Lao W, Munno K, Thornton Hampton LM, Weisberg SB, Wong CS, Amarpuri G, Andrews RC, Barnett SM, Christiansen S, Cowger W, Crampond K, Du F, Gray AB, Hankett J, Ho K, Jaeger J, Lilley C, Mai L, Mina O, Lee E, Primpke S, Singh S, Skovly J, Slifko T, Sukumaran S, van Bavel B, Van Brocklin J, Vollnhals F, Wu C, Rochman CM. 2022. Quantitative assessment of visual microscopy as a tool for microplastic research: Recommendations for improving methods and reporting. Chemosphere 308:136449. 10.1016/j.chemosphere.2022.136449 [DOI] [PMC free article] [PubMed] [Google Scholar]
- 77.Lusher A, Bråte ILN, Munno K, Hurley R, Welden N 2020. Is it or isn’t it: the importance of visual classification in microplastic characterization. Applied Spectroscopy 74:1139–1153. 10.1364/AS.74.001139 [DOI] [PubMed] [Google Scholar]
- 78.Ren X, Sun Y, Wang Z, Barceló D, Wang Q, Zhang Z, Zhang Y 2020. Abundance and characteristics of microplastic in sewage sludge: A case study of Yangling, Shaanxi province, China. Case Studies in Chemical and Environmental Engineering 2:100050. 10.1016/j.cscee.2020.100050 [DOI] [Google Scholar]
- 79.Di M, Wang J 2018. Microplastics in surface waters and sediments of the Three Gorges Reservoir, China. Science of the Total Environment 616–617:1620–1627. 10.1016/j.scitotenv.2017.10.150 [DOI] [PubMed] [Google Scholar]
- 80.Wu N, Zhang Y, Zhang X, Zhao Z, He J, Li W, Ma Y, Niu Z 2019. Occurrence and distribution of microplastics in the surface water and sediment of two typical estuaries in Bohai Bay, China. Environmental Science: Processes & Impacts 21:1143–1152. 10.1039/C9EM00148D [DOI] [PubMed] [Google Scholar]
Associated Data
This section collects any data citations, data availability statements, or supplementary materials included in this article.


