

Background:
Intrahepatic cholangiocarcinoma (iCCA) is an aggressive malignancy with multiple etiologies and is largely refractory to current treatment strategies. Myeloid leukemia factor 1 (MLF1) is associated with human cancer progression. Nevertheless, the function of MLF1 in iCCA remains unknown.
Methods:
We performed expression analyses of MLF1 in human iCCA. In vitro and in vivo experiments were conducted to investigate the role of MLF1 in iCCA progression. The upstream regulatory mechanism of MLF1 upregulation in iCCA was deciphered by luciferase and DNA methylation analyses. MLF1 was significantly upregulated in clinical iCCA tissue specimens and human iCCA cell lines.
Results:
MLF1 was positively correlated with KRT19 and MUC1 expression and epithelial-mesenchymal transition (EMT) gene set enrichment score in clinical iCCA. High MLF1 expression was independently associated with worse prognoses in iCCA patients after curative resection. In addition, experimental knockdown of MLF1 attenuated, while overexpression of MLF1 promoted the proliferation, invasiveness, and growth of iCCA cells in vitro and in vivo. Mechanically, MLF1 comodulated EGFR/AKT and Wnt/β-catenin signalings through regulating EGFR, AKT, WNT3, and p-GSK3β expression. Promoter CpG sites’ hypermethylation-induced downregulation of miR-29c-3p contributed to MLF1 upregulation in iCCA patients. The upregulation of DNA methyltransferase (DNMT)1, 3A, and 3B downregulated miR-29c-3p by dictating promoter DNA methylation pattern. MiR-29c-3p showed therapeutic potential by targeting MLF1 in iCCA.
Conclusions:
Our results demonstrated that hypermethylation-mediated miR-29c-3p downregulation contributes to MLF1 upregulation in iCCA, which resulted in tumor cells’ proliferation and metastasis through comodulating EGFR/AKT and Wnt/β-catenin signalings.

INTRODUCTION
Intrahepatic cholangiocarcinoma (iCCA) is a highly aggressive malignancy with an extremely poor outcome.1–3 The incidence and mortality of iCCA are increasing worldwide in recent years.4 Most iCCA patients are typically detected at an advanced stage when the currently available systemic therapies have limited effectiveness since there is a lack of tumor-specific biomarkers for early detection of iCCA.3,5
Myeloid leukemia factor 1 (MLF1) was originally discovered as an NPM-MLF1 chimeric protein produced by the t(3;5)(q25.1;q34) chromosomal translocation in hematologic malignancies.6 MLF1 was aberrantly expressed in myelodysplastic syndrome, lung adenocarcinoma, thyroid carcinoma, and neuroblastoma.7–10 It can promote tumor cell growth and proliferation, inhibit apoptosis, and correlate with malignant progression by interacting with many adaptor molecules.11,12 Nevertheless, the expression pattern and biological role of MLF1 in iCCA remain unknown.
Aberrant DNA methylation and microRNA dysregulation are involved in the oncogenesis of human tumors including liver cancer.3,5,13–16 Several tumor-suppressor microRNAs, such as miR-342-3p,17 miR-212-3p,18 and miR-424-5p,3,15 were significantly downregulated in clinical liver cancer specimens and showed antitumor effects by modulating its target oncogene expression. Noteworthy, Tiemin et al18 and Tang et al3 first revealed that promoter CpG sites’ hypermethylation-induced miR-212-3p and miR-424-5p downregulation contributed to oncogene MUC13 and COL12A1 upregulation in clinical iCCA, respectively. However, the mechanism of miR-342-3p downregulation in liver cancer is still elusive. The molecular mechanism of microRNAs dysregulation in iCCA development and progression remains to be elucidated.
EGFR/AKT or Wnt/β-catenin signaling pathway plays pivotal roles in iCCA cell growth and metastasis.5,15,18 However, it is still unclear whether there is an interplay between EGFR/AKT and Wnt/β-catenin signaling pathways in iCCA. Therefore, we performed this study to investigate the expression profile, clinical relevance, biological function, and epigenetic regulatory mechanism of MLF1 in iCCA.
METHODS
Public omics data sets and bioinformatics
Transcriptomic data sets, The Cancer Genome Atlas-cholangiocarcinoma (TCGA-CHOL),19 E-MTAB-6389,20 GSE26566,21 GSE76297,22 GSE32879,23 GSE14520,24 OEP001105,25 and OEP000321,26 involving gene expression profile of 565 iCCAs, 474 HCCs, 7 combined HCCs, 5 focal nodular hyperplasias, and 203 adjacent nontumor liver samples from TCGA, ArrayExpress, Gene Expression Omnibus (GEO), and the National Omics Data Encyclopedia were reanalyzed as described.3
Single-sample gene set enrichment analysis and reanalysis of DNA methylation data sets GSE15629927 and TCGA-CHOL19 were performed as described.3 Somatic mutation data sets of TCGA-CHOL19 and OEP00110525 were obtained to investigate the impact of somatically mutated genes on MLF1 expression in clinical iCCA.
Patients and clinical specimens
Ten pairs of iCCA tissue specimens from primary iCCA patients without receiving neoadjuvant treatment after curative therapy were prospectively collected as described.3 Due to the difficulties in obtaining normal intrahepatic biliary cells from the surgical resection specimens of iCCA patients with underlining liver diseases, paired adjacent nontumor liver tissues were collected from the site that was the farthest away from the tumor (usually >2 cm away from the tumor border), and hematoxylin and eosin staining was performed to confirm that there were no tumor cells in the adjacent nontumor liver tissues. After snap-frozen in liquid nitrogen, the obtained each fresh specimens was then used for protein and RNA extraction or stored at −80°C for subsequent experiments, as described.3,13 An external cohort LVC1202 (SUPERBIOTEK, Shanghai, China), involving 60 treatment-naïve iCCA patients without receiving neoadjuvant treatment before primary surgery, was used for survival analysis. The protocol (5826/20) for the experimental use of clinical samples was approved by the Institutional Ethics Committee of the First Affiliated Hospital of Zhejiang University. Written consent was obtained from each patient and all research was conducted in accordance with both the Declarations of Helsinki and Istanbul.
Cell lines, stable cell line establishment, and transient transfection
Human iCCA cell lines (RBE, HuCCT1, HCCC9810, and CCLP1), normal human intrahepatic biliary cell (HIBEpiC) line, and HEK-293T cell line were obtained and cultured as described.3 All cell lines had been regularly tested for mycoplasma contamination as described.3,13
MLF1 plasmid (GOSL0249633), lenti-shMLF1-RNAi (GIEL0269851), and the corresponding control vectors or RNAi negative control (NC) were constructed by Gene Chem (Shanghai, China). Lentiviral vectors were transfected into HuCCT1, CCLP1, and HCCC9810 cells with a multiplicity of infection = 80 following the instructions for the user. After sorting for Cherry by FACS (MoFloAstrios EQ, Beckman), the cells were further selected with 2.5 μg/mL puromycin (Sigma-Aldrich Corp., St. Louis, MO) for 3–4 weeks. The selected single-cell colony with MLF1 knockdown or overexpression was then used for the downstream experiments.
The mimic and inhibitor of microRNAs (miR-29a-3p, -29b-3p, and miR-29c-3p) and the corresponding NCs (miR-NC) were purchased from RIBOBIO Co. Ltd. (Guangzhou, China). Transient transfection with the mimic or inhibitor of miR-29 family members was performed using a riboFECT CP Transfection Kit (C10511-05 RiboBio Co. Ltd, Guangzhou, China) following the manufacturer’s instructions. The detailed information on sequence-based reagents is presented in Supplemental Table S1, http://links.lww.com/HC9/A392.
Protein extraction and immunoblotting
Soluble protein extraction from clinical tissue specimens or human cell lines and immunoblotting were performed as described.3,13 Nuclear proteins in iCCA cells were extracted using the Nuclear and Cytoplasmic Protein Extraction Kit (P0028, Beyotime, Shanghai, China) following the manufacturer’s instructions. The sample (20–40 μg proteins) was resolved on SDS-PAGE (8%–10% polyacrylamide) and then blotted to polyvinylidene difluoride membranes. After blocking, the membranes were incubated first with anti-MLF1 (1:500, Santa Cruz, sc-514294), anti–DNA methyltransferase (DNMT)1 (1:500, Santa Cruz, sc-271729), anti-DNMT3A (1:1000, Santa Cruz, sc-365769), anti-DNMT3B (1:1000, Santa Cruz, sc-376043), anti-AKT (1:1000, CST, #4691), anti-phospho-AKT(Ser473, 1:1000, CST, #4060), anti-β-catenin (1:1000, CST, #8480), anti-phospho-β-catenin (Ser675, 1:1000, CST, #4176), anti-E-cadherin (1:1000, CST, #3195), anti-N-cadherin (1:1000, CST, #13116), anti-vimentin (1:1000, Abcam, ab92547), anti-LRP6 (1:1000, CST, #3395), anti-phospho-LRP6 (Ser1490, 1:1000, CST, #2568), anti-Bcl2 (1:1000, Abcam, ab32124), anti-Bcl-XL (1:1000, Abcam, ab32370), anti-EGFR (1:3000, Abcam, ab52894), anti-phospho-EGFR (Y1068, 1:3000, Abcam, ab40815), anti-phospho-EGFR (S1046 + S1047, 1:500000, Abcam, ab76300), anti-WNT3 (1:500, Santa Cruz, sc-74537), anti-Cleaved Caspase-3 (Asp175, 1:1000, CST, #9664), or anti-CK19 (1:5000, Abcam, ab52625) as described13 and then incubated with Goat Anti-Rabbit IgG H&L (1:5000, Abcam, ab205718) or m-IgGκ BP-HRP (1:3000, Santa Cruz, sc-516102 ) accordingly.
RNA isolation and real-time PCR
Isolation of total RNA from human tissue specimens or cell lines and real-time PCR (RT-PCR) were performed as described.3,13 The primer sequences of MLF1, DNMT1, DNMT3A, DNMT3B, DVL1, CSNK1A1, AXIN1/2, FZD1, and β-actin were summarized in Supplemental Table S1, http://links.lww.com/HC9/A392, which were obtained from GeneChem (Shanghai, China) or SunYa Biotechnology (Hangzhou, China).
MicroRNAs extraction from human tissue specimens or cell lines was performed as described.3 The cDNA template was produced with TaqMan MicroRNA Reverse Transcription Kit (4366596, Applied Biosystems). U6 snRNA was used as the endogenous control, and TaqMan miRNA probes (miR-29a-3p, -29a-5p, -29b-3p, -29b-1-5p, -29b-2-5p, -29c-3p, and miR-29c-5p) were purchased from Applied Biosystems (USA). A final 10 μL mixture containing TaqMan® Universal Master Mix II (No UNG, Applied Biosystems, 4440040), RT-PCR Grade Water (Invitrogen, AM9935), and cDNA template was amplified using ABI QuantStudio-5 Real-Time PCR System (Applied Biosystems, Thermo Fisher Scientific). Reaction conditions are given as follows: 95°C for 10 min, followed by 40 cycles of denaturation at 95°C for 15 sec and annealing at 60°C for 60 sec. The relative miRNA expression was determined using the ΔΔCT method.
Hematoxylin and eosin staining and immunohistochemistry
Hematoxylin and eosin or immunohistochemical staining was performed as described.2,3,13 Paraffin-embedded tissue section (3 μm thickness) was first incubated with anti-MLF1(1: 50, Santa Cruz, sc-514294), anti-Ki67 (1:300, Abcam, ab16667), or anti-CK19 (1:400, Abcam, ab52625) overnight at 4°C and then incubated with biotinylated secondary antibody before visualization using DAB substrate (Abcam, ab64238).
Immunofluorescence
Immunofluorescence was performed as described.3 After blocking with 1% bovine serum albumin, 22.52 mg/mL glycine in PBS plus 0.1% Tween 20, iCCA cells were incubated with anti-MLF1 (1: 50, Santa Cruz, sc-514294) overnight at 4°C, washed 3 times with PBS, and then incubated with m-IgGκ BP-CFL 488 (1:50, Sant Cruz, c-516176) for 1 hour in the dark, respectively. After incubation with 0.1 μg/mL DAPI and 3 times washes with PBS in the dark, cells on a coverslip were mounted and microphotographed as described.3
Cell viability assay
A total of 1 × 10³ iCCA cells (per well) were implanted into 96-well plates and incubated for 24/48/72 hours, respectively. After incubation with fresh complete medium plus CCK-8 (1:10) at 37°C in a 5% CO2 atmosphere for 1 hour, the absorbance at 450 nm was detected as described.3,13
Cell colony–forming assay
A total of 1 × 10³ iCCA cells were seeded into 6-cm dishes and incubated for 2 weeks, and then, the cell colony was stained and counted as described.3
Wound-healing assay
iCCA cells (5 × 10⁵ per well) were seeded in 6-well plates and allowed to grow to monolayers. The cell layers were scratched with a 200-μL sterile pipette tip, washed 3 times with PBS, and microphotographed at 0 and 24 hours under a light microscope (LEICA DMi1, Germany).
Cell migration and invasion assays
For the transwell migration assay, 1 × 10⁴ iCCA cells were seeded into the upper chamber in serum-free media and incubated at 37°C in a 5% CO2 atmosphere for 24 hours, after which migration toward normal complete media was determined. For the invasion assays, the transwell inserts (24-well inserts with 8-μm pore size, Corning Inc.) were precoated with extracellular matrix gel (BD Biosciences, Bedford, MA). Then, 1 × 10⁴ iCCA cells resuspended in a medium plus 0.1% FBS were seeded into the upper chambers, and the lower chambers were supplied with normal complete media. Then, the cells on the upper surface of the membrane were removed after incubation at 37°C in a 5% CO2 atmosphere for 48 hours, and cells migrating through the membrane were fixed in 4% paraformaldehyde and stained with 0.05% crystal violet solution. Finally, the cells migrating to the lower sides of the filters were counted under a light microscope (LEICA DMi1, Germany).
Dual-luciferase report assays
The antisense and sense fragments of the human MLF1 3′UTR (including either the wild type or the mutated miR-29c-3p binding sites) were separately synthesized by GeneChem (Shanghai, China). The respective sense and corresponding antisense strands were hybridized and cloned into the GV272-Firefly-Luciferase as described.3 A total of 2 × 10⁴ HEK-293T cells (per well) were seeded in a 96-well plate and cotransfected with either the GV272 vector (Control), GV272-MLF1-3′UTR (wild-type, GOSE0296953), or the GV272-MLF1-Mut-3′UTR (GOSE0296954), and the miR-29c-3p mimic (RIBOBO, miR10000681-1-5) and CV045-TK promoter-Renilla-Luciferase plasmid (GeneChem, GCPE0299350) as described.3
MiR-29c promoter locus was identified following the methods reported by Annalisa Marsico, et al,28 and the fragments of approximately 500 bp upstream of the putative transcriptional start site of miR-29c were cloned into GV238 vector (5-prime to firefly luciferase gene) at the KpnI and XhoI sites as described.3 HEK-293T cells (2 × 10⁴ per well) were cotransfected with either GV238-miR-29c plasmids (GeneChem, GOSE0288502) or GV238 empty vector and CV045-TK-promoter-Renilla-Luciferase as described.3
A total of 1 × 10⁴ iCCA cells (per well) with MLF1 knockdown or overexpression were cotransfected with TOPFlash plasmid (Beyotime, D2501) plus CV045-TK-promoter-Renilla-Luciferase to assess the impact of MLF1 on Wnt/β-catenin pathway activities. After incubation at 37°C in 5% CO2 for 48 hours, the luciferase activity of cell lysate was detected as described.3
Chromatin immunoprecipitation and sequencing (ChIP-seq)
See details in Supplemental Materials, http://links.lww.com/HC9/A393.
Genomic DNA isolation and targeted bisulfite sequencing
See details in Supplemental Materials, http://links.lww.com/HC9/A393, and Supplemental Table S2, http://links.lww.com/HC9/A394.
TUNEL staining
See details in Supplemental Materials, http://links.lww.com/HC9/A393.
Experimental animal model
See details in Supplemental Materials, http://links.lww.com/HC9/A393. The care of animal and licensing guidelines under which the study was performed and report these in accordance with the ARRIVE.
Statistical analysis
Statistical analyses were performed with R v.4.1.0 (R Foundation for Statistical Computing, Vienna, Austria) or with SPSS v.22.0 (IBM Corp., Armonk, NY). Comparison of 2 groups was performed with a 2-tailed Student t test or Wilcoxon test, and comparison of multiple groups was performed using 1-way ANOVA. The linear correlation between the 2 variables was assessed by the Pearson correlation analysis. χ2-test or Fisher exact test was performed to assess the association of MLF1 expression with clinicopathological features. Survival analysis was performed with the Kaplan-Meier method, and the statistical difference was determined by a log-rank test. The Cox proportional hazard regression model was used for multivariate survival analysis. The “surv_cutpoint ()” function in the R package survminer (https://cran.r-project.org/web/packages/survminer/index.html) was used to determine the optimal cutoff point of MLF1 mRNA/protein level corresponding to the survival of iCCA patients.
RESULTS
MLF1 overexpression in clinical iCCA samples
Both paired and unpaired-sample analyses of multiple public RNA-seq data sets showed that MLF1 mRNA expression was significantly upregulated in clinical iCCA relative to the adjacent nontumor liver tissues (Figure 1A, B), which was further confirmed by immunoblotting and RT-PCR in 10 pairs of clinical iCCA tissue specimens, respectively (Figure 1C). Moreover, MLF1 was significantly upregulated in the indicated human iCCA cells (HuCCT1, CCLP1, HCCC9810, and RBE) compared with normal intrahepatic bile duct cell (HIBEpiC) line (Figure 1D).
FIGURE 1.

MLF1 is upregulated in clinical iCCA tissue samples and human iCCA cell lines. (A) Box plot showing MLF1 mRNA expression levels in clinical iCCA and nontumor liver tissue samples from TCGA-CHOL, GEO (GSE26566, GSE76297, and GSE32879), and E-MTAB-6389 databases. ns, p ≥ 0.05, **p < 0.01, and ****p < 0.0001 using a 2-tailed unpaired Student t test. Extrahepatic cholangiocarcinoma or gallbladder carcinoma samples (n = 4) were excluded from TCGA-CHOL. (B) Box plots showing MLF1 mRNA levels in iCCA and the paired nontumor samples from TCGA or E-MTAB-6389 iCCA data sets, respectively. *p < 0.05 and ****p < 0.0001 using a 2-tailed paired Student t test. (C, D) The expression patterns of MLF1 in 10 pairs of clinical iCCA tissue samples, human iCCA cells, and normal human intrahepatic biliary cell (HIBEpiC) lines were determined by immunoblotting and RT-PCR, respectively. The bar plot to show the relative expression level of MLF1 protein/mRNA in each group. Experiments were in triplicates. *p < 0.05, **p < 0.01, and ***p < 0.001 using 2-tailed paired (C) or unpaired (D) Student t test accordingly. (E) Representative images of immunofluorescence staining for MLF1 and DAPI in the indicated iCCA cells and HIBEpiC cells. Original magnification: ×100; scale bar = 10 μm. Experiments were in triplicates. (F) Representative image of H&E and MLF1 staining in 60 pairs of clinical iCCA samples. Boxplot to show MLF1 protein expression levels by immunochemistry staining in 60 pairs of clinical iCCA samples. ****p < 0.0001 using a 2-tailed paired Student t test. Abbreviations: CHC, combined hepatocellular-cholangiocarcinoma; CHOL, cholangiocarcinoma; FNH, focal nodular hyperplasia; GEO, Gene Expression Omnibus; H&E, hematoxylin and eosin; iCCA, intrahepatic cholangiocarcinoma; MLF1, myeloid leukemia factor 1; N, paired nontumor tissue; RT-PCR, real-time PCR; T, tumor tissue; TCGA, The Cancer Genome Atlas.
Immunofluorescence and immunochemistry staining showed that MLF1 protein was expressed in the cell membrane, cytoplasm, and nucleus of iCCA cells (Figure 1E, F). In addition, MLF1 was positively correlated with conventional iCCA biomarker keratin 19 (KRT19) and mucin 1 (MUC1) expression in 4 independent iCCA data sets (Figure 2A, B).5,29
FIGURE 2.

MLF1 is a novel promising biomarker for predicting prognosis of iCCA patients. (A and B) Scatter plot showing the relationship between MLF1 and KRT19 or MUC1 expression in 4 independent iCCA data sets. p-value is based on the Pearson correlation test. (C and D) Boxplots of MLF1 expression levels in adjacent nontumor and tumor specimens stratified by TNM stage (stage I to stage IV) or lymph node involvement in the LVC1202 and TCGA data sets. ns, p ≥ 0.05. *p < 0.05, **p < 0.01, and ***p < 0.001 based on Bonferroni post-tests. (E) Overall survival curves stratified by MLF1 mRNA levels in iCCA (OEP001105 and TCGA cohorts). p is based on a log-rank test. Extrahepatic cholangiocarcinoma or gallbladder carcinoma samples (n = 4) were excluded from TCGA-CHOL in our analysis. (F) Overall survival and recurrence probability curves stratified by the expression level of MLF1 protein in iCCA patients (n = 60) in the LVC1202 cohort. p is based on a log-rank test. (G) Forest plot to show multivariate overall/recurrence-free survival analysis results from Cox regression model. Abbreviations: iCCA, intrahepatic cholangiocarcinoma; MUC1, mucin1; KRT19, keratin 19; TCGA, The Cancer Genome Atlas; CHOL, cholangiocarcinoma.
MLF1 overexpression correlated with poor outcomes in iCCA patients
Stratification of MLF1 expression profile by TNM stage or lymph node involvement showed that MLF1 was increased in patients with advanced iCCA or lymph node metastasis (Supplemental Table S3, http://links.lww.com/HC9/A395 & Figure 2C, D). iCCA patients from OEP001105 or TCGA cohort were divided into 2 groups according to the optimal cutoff point of 5.517 or 10.04 (log2 expression) for MLF1 mRNA levels, and Kaplan-Meier survival curves showed that iCCA patients with MLF1-high expression had worse overall survival in OEP001105 (median OS, 19.1 (11.6–NA) months versus 56.8 (34.2–NA) months, Figure 2E) and TCGA (median OS, 26.5 (22.9–NA) months versus 50.1 (43.6–NA) months, Figure 2E) cohorts.
Furthermore, iCCA patients with high MLF1 protein expression had significantly shorter overall survival (median OS, 14.2 (11.2–19.1) months versus 34.4 (28.3–39.7) months; p < 0.0001, log-rank test; Figure 2F, Supplemental Table S4, http://links.lww.com/HC9/A396) and higher recurrence risk (p= 0.01; Figure 2F, Supplemental Table S5, http://links.lww.com/HC9/A397) than patients with MLF1-low expression. The multivariate analysis determined that MLF1 protein high expression was an independent risk factor for poor overall survival in iCCA patients (Figure 2G).
MLF1-inducing proliferation and growth of iCCA cells in vitro and in vivo
We silenced or overexpressed MLF1 expression in HuCCT1, CCLP1, HCCC9810, or RBE cell lines, respectively (Supplemental Figure S1A, B, http://links.lww.com/HC9/A398). In cell viability assays, MLF1 knockdown weakened HuCCT1, CCLP1, and HCCC9810 cells’ proliferation, whereas exogenous overexpression of MLF1 promoted the proliferation of HuCCT1, CCLP1, and RBE cells (Figure 3A). In colony-forming assays, MLF1 knockdown suppressed iCCA cells growth by attenuating colony-forming ability, while MLF1 overexpression showed opposite effects (Figure 3B). In subcutaneous xenograft models, MLF1 knockdown significantly inhibited tumor growth and proliferation, while MLF1 overexpression had opposite effects (Figure 3C–E). In AKT/YAP-driven iCCA model by hydrodynamic tail vein injection, CRISPR-cas9-mediated MLF1 knockout delayed liver carcinogenesis (Figure 3F).
FIGURE 3.
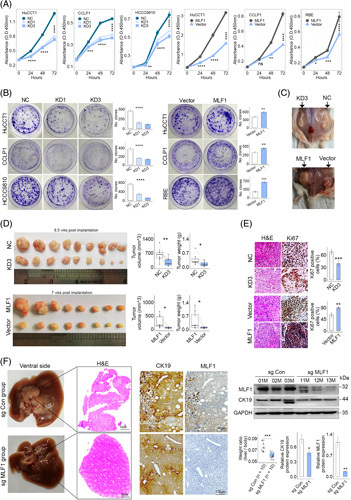
MLF1 promotes iCCA progression. (A and B) The role of MLF1 knockdown (KD) or overexpression in iCCA cell proliferation was assessed by CCK8 assays, respectively. (B) Representative image of colony-forming assays and the colony numbers in the indicated groups. (C) Representative gross image of subcutaneous xenograft tumor with or without MLF1 knockdown or overexpression. (D) Xenograft tumor volumes and weights were analyzed in the indicated groups (n = 8–9 in each group). The subcutaneous tumors were harvested at 8.5 or 7 weeks after implantation of CCLP1 cells with/without MLF1 knockdown or overexpression, respectively. (E) Representative images of H&E and Ki67 staining of xenograft tumor tissue slides (n = 5). Original magnification: ×20. (F) Representative images of H&E, CK19, and MLF1 staining of AKT/Yap/sg Con and AKT/Yap/sg MLF1 mouse livers at 8.7 weeks after hydrodynamic injection (n = 10 in each group), respectively. Tumor burdens were evaluated in the 2 groups. Cytokeratin19 (CK19) and MLF1 expression in mouse liver tissues were assessed by immunostaining and immunoblotting, respectively. *p < 0.05, **p < 0.01, ***p < 0.001, and ****p < 0.0001 using 2-tailed unpaired Student t test. All experiments were triplicated. Abbreviations: iCCA, intrahepatic cholangiocarcinoma; NC, negative control representing iCCA cells transfected with transgene-free lentivirus.
MLF1 promoting migration, invasion, and metastasis of iCCA cells in vitro and in vivo
In wound-healing assays, the extent of iCCA cells migration was markedly decreased or increased in the MLF1 knockdown or overexpression group, respectively (Figure 4A, Supplemental Figure S2A, http://links.lww.com/HC9/A399). In transwell assays, the number of migration and invasion cells was markedly lower or higher in the MLF1 knockdown or overexpression group, respectively (Figure 4B, Supplemental Figure S2B, http://links.lww.com/HC9/A399). In the xenograft metastasis model, the number of metastases on the surface of the lung and liver was higher in the MLF1 overexpression group (Figure 4C–E). Meanwhile, tumor cell proliferation in metastases was markedly increased in the MLF1 overexpression group (Figure 4C, D). Immunoblotting showed that MLF1 knockdown increased E-cadherin expression while decreasing the remaining epithelial-mesenchymal transition (EMT) marker expression in HuCCT1 or CCLP1 cells (Figure 4F), and MLF1 overexpression had an opposite effect (Supplemental Figure S2C, http://links.lww.com/HC9/A399). In addition, like EMT marker Vimentin and COL12A1,3 MLF1 was significantly positively correlated with EMT gene set enrichment score in multiple iCCA data sets (Figure 4G).
FIGURE 4.

MLF1 promotes iCCA cell migration and invasion, as well as epithelial-mesenchymal transition. (A and B) Wound-healing and invasion assays were performed in the indicated cell lines, respectively. Original magnification: ×10. (C and D) Gross images of mouse lung (at 15 wk) and mouse liver (at 12 wk) after injection of CCLP1 cells with or without MLF1 overexpression into the tail vein or spleen of the nude mouse (n = 8), respectively. The surface number of lung and liver metastasis lesions was counted in the 2 groups (n = 8). H&E and Ki67 staining of mouse lung and liver with metastasis. Original magnification ×20. (E) Representative images of in situ tumor–bearing mouse livers at 16.2 weeks after implantation of subcutaneous xenograft tumor with or without MLF1 overexpression. The number of metastasis lesions in the surface of liver was measured in the 2 groups. (F) EMT-associated proteins in the whole cell lysate of iCCA cells with MLF1 knockdown were evaluated by immunoblotting. The bar plot to show the relative expression level of EMT-associated proteins in the 2 groups. (G) Scatter plot to show the relationship between MLF1 and EMT gene set enrichment score in 4 iCCA transcriptomic data sets. p-value is based on the Pearson correlation test. Experiments were in triplicates. *p < 0.05, **p < 0.01, and ***p < 0.001 using 2-tailed unpaired Student t test. Abbreviations: iCCA, intrahepatic cholangiocarcinoma; EMT, epithelial-mesenchymal transition; NC, negative control representing iCCA cells transfected with transgene-free lentivirus; TCGA, The Cancer Genome Atlas.
MLF1 comodulating EGFR/AKT and Wnt/β-catenin signalings in iCCA cells
Consider that MMP2 and MMP9 are downstream effectors of Wnt/β-catenin and EGFR/AKT pathway in liver cancer.18,30,31 Moreover, MLF1 loss markedly delayed liver carcinogenesis driven by AKT/YAP (Figure 3F). Thus, we hypothesized that a coregulatory network of MLF1, EGFR AKT, and β-catenin crosstalk is involved in iCCA development and progression. Immunoblotting showed that EGFR, AKT, p-AKT, β-catenin, and p-β-catenin were decreased or increased in iCCA cells with MLF1 knockdown or overexpression, respectively (Figure 5A, Supplemental Figure S2D, http://links.lww.com/HC9/A399), whereas MLF1 knockdown or overexpression had less effect on p-EGFR (Supplemental Figure S2D, http://links.lww.com/HC9/A399), indicating that MLF1 plays a key role in modulating EGFR/AKT and β-catenin signalings. In addition, like MLF1, EGFR, p-EGFR, AKT, p-AKT, β-catenin, and p-β-catenin protein expression were increased in clinical iCCA compared with the paired nontumor liver tissues (Figure 5B).
FIGURE 5.

MLF1 comodulates EGFR/AKT and Wnt/β-catenin signaling activities in iCCA cells. (A) AKT, phospho-AKT, β-catenin, phospho-β-catenin, and EGFR in the whole cell lysate of iCCA cells with or without MLF1 knockdown (KD) were assessed by immunoblotting. (B) MLF1, EGFR, phospho-EGFR, AKT, phospho-AKT, β-catenin, and phospho-β-catenin in the lysate of clinical iCCA and the paired nontumor liver tissue samples were assessed by immunoblotting. (C) MLF1 and β-catenin in nuclear lysate of iCCA cells with MLF1 knockdown or overexpression were assessed by immunoblotting. Wnt/β-catenin pathway activities in HuCCT1 cells with MLF1 knockdown and CCLP1 cells with MLF1 overexpression were tested by TOPFlash report assay. *p < 0.05 and ***p < 0.001 using a 2-tailed unpaired Student t test. (D) GSK3β, phospho-GSK3β, CASP3, and Wnt3 in whole cell lysate of iCCA cells with or without MLF1 knockdown or overexpression were assessed by immunoblotting. (E) FZD1, LRP6, AXIN1/2, and CSNK1A1 in iCCA cells with or without MLF1 knockdown or overexpression were determined by RT-PCR. *p < 0.05 and ***p < 0.001 using a 2-tailed unpaired Student t test. LRP6 and phospho-LRP6 in the whole cell lysate of iCCA cells with or without MLF1 knockdown or overexpression were assessed by immunoblotting. Experiments were in triplicates. Abbreviations: CCA, intrahepatic cholangiocarcinoma; NC, negative control representing iCCA cells transfected with transgene-free lentivirus; RT-PCR, real-time PCR.
Nuclear localization of β-catenin was decreased in iCCA cells with MLF1 knockdown while increasing in iCCA cells with MLF1 overexpression (Figure 5C). TOPFlash report assay showed that Wnt/β-catenin signaling activities were markedly decreased or increased in iCCA cells with MLF1 knockdown or overexpression, respectively (Figure 5C), indicating that MLF1 modulates Wnt/β-catenin signaling in iCCA cells.
MLF1 modulating β-catenin signaling through activating canonical Wnt signaling cascade
Given that the classical Wnt/β-catenin pathway is activated by either the Wnt ligand or glycogen synthase kinase 3β (GSK3β), we, therefore, investigated whether MLF1 affects GSK3β or Wnt3 expression in iCCA cells. Like the changes in β-catenin, Wnt3 and p-GSK3β expressions were decreased in HCCC9810 cells with MLF1 knockdown while increasing in CCLP1 cells with MLF1 overexpression (Figure 5D), indicating that MLF1 modulating β-catenin signaling activity was associated with Wnt3/GSK3β.
As β-catenin is a central effector of the canonical Wnt signaling cascade in liver development, health, and disease,32 thus, we further assessed the impact of MLF1 on Wnt signaling cascade–associated genes expression in iCCA cells. Immunoblotting and RT-PCR showed that MLF1 overexpression decreased CSNK1A1 (CK1a) while increasing frizzled class receptor 1 (FZD1), Axin1/2, and LDL receptor–related protein 6 (LRP6) phosphorylation expression in iCCA cell with MLF1 overexpression; whereas MLF1 knockdown showed opposite effects (Figure 5E), which indicates that MLF1 modulates β-catenin signaling through activating canonical Wnt signaling cascade in human iCCA cells.
MLF1 associated with apoptosis evasion in iCCA cells
MLF1 can alleviate apoptosis in lung adenocarcinoma cells.8 Immunoblotting showed that MLF1 knockdown increased apoptotic protein Cleaved Caspase-3 (CASP3) while decreasing antiapoptotic protein BCL2 and BCL-XL expressions in iCCA cells, and MLF1 overexpression showed opposite effects (Figures 5D, 6A). In addition, TUNEL staining in xenograft tumors was performed to confirm MLF1-mediated apoptosis events in iCCA cells, showing that the incidence of apoptosis in xenograft tumors was significantly increased in MLF1 knockdown group (Figure 6B).
FIGURE 6.

MLF1 induces apoptosis evasion and epithelial-mesenchymal transition (EMT) in iCCA cells through EGFR/AKT and Wnt/β-catenin signalings. (A) BCL-XL and BCL2 in the whole cell lysate of iCCA cells with or without MLF1 knockdown or overexpression were assessed by immunoblotting. (B) Representative images of immunofluorescence staining for TNUEL in MLF1 knockdown xenograft tumor specimens (n = 5). The bar plot shows the average percentage of TUNEL positive cells from 15 fields of xenograft tumors. Original magnification: ×20. **p < 0.01 using a 2-tailed unpaired Student t test. (C) The distribution of reads counts nearing transcription start site (TSS) binding to MLF1 in HuCCT1 cell by ChIP-seq. Peak annotations including functional genomic location (D) and KEGG (E) analysis of reads binding to MLF1 in HuCCT1 cell by ChIP-seq. Experiments were in triplicates. Abbreviations: iCCA, intrahepatic cholangiocarcinoma; NC, negative control representing iCCA cells transfected with transgene-free lentivirus.
MLF1-binding regions in the genome of iCCA cells
MLF1 protein can bind DNA and affect the expression of a number of genes and so may function as a transcription factor in the nucleus according to structure-based prediction by AlphaFold (https://alphafold.ebi.ac.uk/entry/P58340). To investigate whether MLF1 can regulate EGFR and AKT expression at transcriptional levels, ChIP-seq was performed in HuCCT1 cells. MLF1-binding regions were determined in the genome of HuCCT1 cells (Figure 6C and Supplemental Tables S6, S7, http://links.lww.com/HC9/A400). Of those, 14.17% were within a ±2 kb promoter regions (Figure 6D). Motif enrichment analysis of MLF1-binding sites identified their binding preference in genomes (Supplemental Table S7, http://links.lww.com/HC9/A400). MLF1-binding DNA motifs were well matched with the binding motifs of transcription factor RUNX3, TCF7, Nkx2-2, and so on (Supplemental Table S8, http://links.lww.com/HC9/A400). Moreover, PI3K-AKT signaling (EGFR/AKT signaling) was one of the key pathways in which MLF1-binding regions enriched (Figure 6E and Supplemental Table S9, http://links.lww.com/HC9/A400). These results suggest that MLF1 can regulate its targeting gene expression and modulate EGFR/AKT signaling at the transcriptional level.
The impact of the somatically mutated gene IDH1, FGFR2, BAP1, ARID1A, KRAS, TP53, and CDKN2A on MLF1 expression in clinical iCCA
Previous omics studies have revealed the genetic alteration profile of iCCA, and there is rich heterogeneity in the mutational distribution and mutation signature in iCCA patients from different centers.19,25 To study the relationship between MLF1 and genetic alterations in iCCA, we first stratified MLF1 expression by IDH1, FGFR2, BAP1, ARID1A, KRAS, TP53, or CDKN2A copy number alterations. In the TCGA data set, IDH1, FGFR2, or TP53 copy number gain decreased MLF1 expression, while BAP1, ARID1A, KRAS, or CDKN2A copy number gain had no significant effect on MLF1 expression in iCCA (Supplemental Figure S3A, http://links.lww.com/HC9/A401). In the OEP001105 dataset, IDH1, FGFR2, BAP1, ARID1A, KRAS, TP53, or CDKN2A copy number alterations did not significantly affect MLF1 expression (Supplemental Figure S3B, http://links.lww.com/HC9/A401).
We further analyzed the association of MLF1 with simple nucleotide variation/fusion in iCCA. In the TCGA data set, MLF1 expression did not significantly differ between wide-type and mutation groups (Supplemental Figure S3C, http://links.lww.com/HC9/A401). In the OEP001105 dataset, KRAS mutation increased, while IDH1 or BAP1 mutation decreased MLF1 expression, and FGFR2, ARID1A, TP53, or CDKN2A mutation had no significant impact on MLF1 expression (Supplemental Figure S3D, http://links.lww.com/HC9/A401). These results suggest that there are geographically different patterns in the impact of IDH1, BAP1, KRAS, FGFR2, or TP53 mutations on MLF1 expression in iCCA.
MLF1 promoter methylation pattern in clinical iCCA
MLF1 copy number alteration did not significantly affect its expression in clinical iCCA (Supplemental Figure S3A, B, http://links.lww.com/HC9/A401). To further determine whether promoter hypomethylation/demethylation induces MLF1 upregulation in iCCA, we deciphered the methylation pattern of MLF1 promoter by reanalyses of 2 DNA methylation data sets (Supplemental Figure S4A, http://links.lww.com/HC9/A402), showing that MLF1 promoter was not demethylated in iCCA relative to the paired nontumor liver tissue samples (Figure 7A, Supplemental Figure S4B, C, http://links.lww.com/HC9/A402), indicating that MLF1 upregulation is not attributed to its promoter methylation pattern in clinical iCCA samples.
FIGURE 7.

MiR-29c-3p has antitumor potentials by directly targeting MLF1 in iCCA. (A) The methylation pattern of MLF1 promoter region in iCCA and nontumor samples from TCGA and GSE156299 data sets. (B) The expression pattern of miR-29c-3p and miR-29c-5p in 10 pairs of iCCA samples. Associations between miR-29 family members and MLF1 mRNA in 10 pairs of iCCA samples were determined by the Pearson correlation test. (C) MLF1 in HuCCT1 and CCLP1 cells transfected with miR-29c-3p or anti-miR-29c-3p was assessed by immunoblotting and RT-PCR, respectively. (D) Genomic location of MIR29C and the putative binding site of miR-29c-3p in wild-type MLF1 3’UTR aligned with vertical lines. The mutated bases are presented in red. (E) Luciferase report activity in HEK-293T cells when cotransfected with MLF1 3’UTR report and miR-29c-3p mimic relative to the control. (F) The indicated proteins in whole cell lysates of HuCCT1 and CCLP1 cells after transfected with miR-29c-3p or anti-miR-29c-3p were assessed by immunoblotting, respectively. (G and H) MiR-29c-3p agonist (AgoMiR, a modified mimic of miR-29c-3p) inhibited the growth of already developed subcutaneous xenograft tumors. 25 nmol AgomiR was administrated by tail vein injection at day 65 after implantation. Tumor volume and weight were analyzed in the 2 groups (n = 5 mice in each group). Representative images of H&E and MLF1 staining of xenograft tumors (n = 3) in the 2 groups. (I and J) Schematic of MiR-29c-3p agonist administration and representative images of gross Yap/AKT-driven mouse livers at 13 weeks after hydrodynamic injection. Tumor burdens of Yap/AKT mice at 13 weeks after hydrodynamic injection were analyzed in the different groups (n = 5 in each group). Representative images of H&E, CK19, and MLF1 staining of mouse liver in the different groups (n = 5 images in each group). ns, p ≥ 0.05. *p < 0.05, **p < 0.01, ***p < 0.001, and ****p < 0.0001 using 2-tailed unpaired Student t test, except for comparison in TCGA samples (A) and boxplots (B) with 2-tailed paired Student t test. Experiments were in triplicates. Abbreviations: iCCA, intrahepatic cholangiocarcinoma; RT-PCR, real-time PCR; TCGA, The Cancer Genome Atlas.
MLF1 directly binding to miR-29c-3p in human iCCA cells
TargetScanHuman database v. 7.2 prediction showed that 3 candidate microRNAs (miR-29c-3p, -29b-3p, and miR-29a-3p) can bind to MLF1 3′UTR (Supplemental Figure S5A, http://links.lww.com/HC9/A403). We then investigated the expression pattern of miR-29 family members in clinical iCCA samples, showing that miR-29c-3p and miR-29c-5p were significantly downregulated and negatively correlated with MLF1 mRNA expression in iCCA samples (Figure 7B), while the remaining microRNAs (miR-29a-3p, -29a-5p, -29b-3p, -29b-1-5p, and miR-29b-2-5p) were similar between iCCA and the paired nontumor samples (Supplemental Figure S5B, http://links.lww.com/HC9/A403). These findings were further confirmed by reanalyses of iCCA samples from TCGA (Supplemental Figure S5C, http://links.lww.com/HC9/A403). Moreover, miR-29c-3p overexpression suppressed MLF1 expression, whereas miR-29c-3p inhibition had an opposite effect in iCCA cells (Figure 7C). Nevertheless, no such changes were observed in both HuCCT1 and CCLP1 cells when overexpressing miR-29a-3p and miR-29b-3p except for miR-29b-3p in CCLP1 cells (Supplemental Figure S6, http://links.lww.com/HC9/A404).
The luciferase activity was significantly decreased or increased in HEK-293T cells cotransfected with miR-29c-3p plus wild-type MLF1 3’UTR or mutated 3′UTR of MLF1, respectively (Figure 7D, E). Immunoblotting showed that miR-29c-3p overexpression suppressed MLF1, AKT, p-AKT, β-catenin, and p-β-catenin in HuCCT1 and CCLP1 cells, whereas miR-29c-3p inhibition had opposite effects (Figure 7F). These results indicate that miR-29c-3p can result in translational inhibition or degradation of MLF1 and modulate AKT and β-catenin signaling activities by targeting MLF1 mRNA in human iCCA cells.
The therapeutic potential of miR-29c-3p in iCCA
To assess the therapeutic value of miR-29c-3p, tumor-bearing mice were administrated with miR-29c-3p agonist (a modified mimic of miR-29c-3p). In the xenograft model, tumors were significantly regressed in the miR-29c-3p treatment group compared with the control (Figure 7G). MLF1 expression was significantly lower in the miR-29c-3p group than in the control (Figure 7H). In AKT/YAP-driven iCCA model, tumor burden was significantly decreased in the miR-29c-3p treatment group (Figure 7I). Immunohistochemical staining showed that MLF1 expression was downregulated in the miR-29c-3p treatment group (Figure 7J).
Promoter hypermethylation–mediated miR-29c-3p downregulation in clinical iCCA
Consider that promoter CpG sites’ hypermethylation silenced miR-212-3p18 and miR-424-5p3 in clinical iCCA. To unravel the mechanism responsible for miR-29c-3p downregulation in iCCA cells, we identified a putative promoter sequence of miR-29c as described.3,28 The luciferase activities were significantly higher in HEK-293T cells transfected with promoter-containing plasmid than in promoter-less plasmid (Figure 8A), showing that the putative promoter sequence had transcription activity. Targeted bisulfite sequencing showed that CpG sites’ methylation degree of the miR-29c promoter was significantly higher in iCCA tissues than the corresponding paired nontumor samples (Figure 8B). Moreover, the promoter methylation degree of the miR-29c promoter was inversely correlated with miR-29c-3p expression in clinical iCCA samples (Figure 8C). These results indicate that promoter CpG sites’ hypermethylation is associated with miR-29c-3p downregulation in iCCA samples.
FIGURE 8.

Upregulation of DNMT1, 3A, and 3B dictated promoter CpG sites’ hypermethylation inversely correlated with miR-29c-3p expression in clinical iCCA. (A) Luciferase activity in HuCCT1 cells after cotransfected with the putative promoter of miR-29c or promoter-less vector (Control), respectively. **p < 0.01 using a 2-tailed unpaired Student t test. (B) CpG sites’ methylation pattern of the miR-29c promoter region in 10 pairs of iCCA tissue samples. The dot represents the methylation level of each CpG site in each group. ****p < 0.0001 using a 2-tailed paired Student t test. (C) The relationship between miR-29c-3p and the promoter methylation degree of miR-29c in 10 pairs of iCCA samples was determined by the Pearson correlation test. (D) The expression patterns of DNMT1, 3A, and 3B in 10 pairs of iCCA samples were evaluated by immunoblotting and RT-PCR, respectively. Up represents that DNMTs’ expression level in the tumor is higher than that in the paired nontumor sample in each patient. (E) CpG sites’ methylation degree of miR-29c and the expression levels of miR-29c-3p in HuCCT1 and CCLP1 cells after being treated with 10/20 μmol/mL decitabine for 48 hours were determined by targeted bisulfite sequencing and RT-PCR, respectively. ns, p ≥ 0.05, ***p < 0.001, and ****p < 0.0001 using a 2-tailed unpaired Student t test. (F) Decitabine inhibited the growth of already developed subcutaneous xenograft tumors. 2 mg/kg decitabine was administrated by tail vein or i.p. injection at day 53 to day 58 into NSG mice (n = 5 in each group). Tumor weights in the different groups were analyzed. MLF1 and miR-29c-3p in xenograft tumors from the indicated groups were assessed by immunoblotting or RT-PCR, respectively. *p < 0.05, **p < 0.01, and ****p < 0.0001 using 2-tailed unpaired Student t test. Experiments were triplicated. Abbreviations: P, paired nontumor tissue; RT-PCR, real-time PCR; T, tumor tissue.
Upregulation of DNMT1, 3A, and 3B dictated miR-29c promoter hypermethylation in iCCA cells
Accumulating evidence shows that aberrant hypermethylation plays a vital role in liver cancer initiation and progression.3,5,16,18,33 Nevertheless, the expression patterns of DNMTs writers are not well elaborated in iCCA. Consistent with the findings from TCGA and E-MTAB-6389 data sets (Supplemental Figure S7A, B, http://links.lww.com/HC9/A405), immunoblotting and RT-PCR showed that DNMT1, 3A, and 3B were upregulated in more than 60% iCCA samples (Figure 8D). MiR-29c-3p and miR-29c-5p were negatively associated with DNMT1, 3A, and 3B expression in TCGA samples (Supplemental Figure S7C, http://links.lww.com/HC9/A405). Moreover, the methylation degree of the miR-29c promoter was decreased in HuCCT1 and CCLP1 cells after decitabine treatment; meanwhile, miR-29c-3p was markedly increased (Figure 8E). In addition, we treated the tumor-bearing mice with DNMTs inhibitor decitabine, showing that xenograft tumor burden was decreased in decitabine treatment group compared to the control (Figure 8F). MLF1 expression in xenograft tumors was decreased in decitabine groups relative to the controls, whereas miR-29c-3p had an opposite change (Figure 8F).
DISCUSSION
MLF1 is aberrantly expressed in human malignancies, including hematologic cancers, lung adenocarcinoma, and neuroblastoma, and its upregulation is correlated with tumor progression.7,8,10 Consistent with the previous findings, the present study demonstrated that MLF1 is upregulated in iCCA relative to nontumor liver tissues. High MLF1 expression was associated with worse prognoses in iCCA patients and positively correlated with the KRT19 and MUC1 expression and EMT program in clinical iCCA samples. Moreover, our gain- and loss-of-function experiments demonstrated that MLF1 upregulation promotes iCCA cells’ proliferation, motility, invasiveness, and apoptosis evasion in vitro and in vivo. Thus, MFL1 is a promising biomarker for iCCA diagnosis and prognosis prediction.
EGFR/AKT and Wnt/β-catenin signaling pathways are involved in metastasis, proliferation, and EMT program in various cancers including iCCA.5,15,16,18 However, the underlying mechanism for the interaction between EGFR/AKT and Wnt/β-catenin signaling pathways remains unknown in iCCA. In the present study, we first revealed that MLF1 could be acted as a transcriptional factor comodulating EGFR/AKT and Wnt/β-catenin pathway activities. Therefore, MLF1 is a signaling nexus for EGFR/AKT and Wnt/β-catenin pathways in iCCA progression. Wnt/β-catenin signaling can interact with YAP1/Hippo signaling through the interaction of β-catenin and YAP1 in iCCA.15,34 Accordingly, in our study, MLF1 knockout markedly attenuated YAP1/AKT1-driven iCCA possibly through inhibiting the signaling interaction of AKT1, β-catenin, and YAP1. Thus, MLF1 is a potential therapy target of iCCA.
Growing evidence shows that epigenetic dysregulation is involved in liver cancer development through regulating cancer-associated gene expression.3,5,13,16,18,33,35 Unlike the previous evidence that MLF1 promoter was aberrantly hypermethylated in mantle cell lymphoma,36 we demonstrated that MLF1 promoter had a similar methylation pattern in iCCA samples compared with adjacent nontumor samples. MicroRNA dysregulation plays a pivotal role in human diseases, particularly in cancer development.3,15,17,18,37,38 In the present study, we first found that miR-29c-3p is an upstream regulator of MLF1 in iCCA. MiR-29c-3p is downregulated in several cancers and has tumor-suppressor functions in liver cancer.39,40 In line with the previous findings, we showed that miR-29c-3p was significantly downregulated in iCCA and had antitumor functions through targeting MLF1.
Promoter CpG sites’ hypermethylation contributed to tumor-suppressor miR-212-3p and miR-424-5p downregulation in iCCA cells.3,18 However, the upstream regulatory mechanism of miR-29c-3p downregulation in human cancer remains unknown. In our study, we first demonstrated that aberrant CpG sites’ hypermethylation of miR-29c promoter induced miR-29c-3p downregulation in iCCA patients. Furthermore, DNMT1, 3A, and 3B were upregulated in iCCA tissues, which contributed to the aberrant DNA methylation of the miR-29c promoter and induced miR-29c-3p downregulation in iCCA.
While our study first elaborated on the pivotal role of MLF1 in iCCA development and progression, there are also several limitations in this work. First, the association of MLF1 with advanced tumor stage and lymph node involvement needs further validation using high-quality iCCA cohorts with large sample sizes. Second, the detailed mechanism of MLF1-mediated EGFR/AKT and Wnt/β-catenin signaling interaction requires further elucidation. Third, because the majority of iCCA patients had underlying liver diseases and it is difficult to get normal intrahepatic biliary cells from the surgical specimens of iCCA patients, we did not examine the baseline expression profile of MLF1, DNMTs, or miR-29 family members or the methylation degree of the miR-29c promoter in normal liver tissue or normal hepatocytes from participants without underlying liver disease. Finally, the treatment effect and safety of decitabine or miR-29c-3p mimic to inverse MLF1 expression in iCCA patients need to be tested by future well-designed clinical trials.
CONCLUSIONS
MLF1 is overexpressed in iCCA by promoter CpG sites’ hypermethylation-induced downregulation of miR-29c-3p, which drives iCCA development and progression through comodulating EGFR/AKT and Wnt/β-catenin signaling activities. MiR-29c-3p has therapeutic potential in iCCA by targeting MLF1 mRNA. Our research elaborated on the key role of MLF1 in iCCA progression and indicated that MLF1 is a druggable target for epigenetic therapy of iCCA. Therefore, it is rational for the use of miR-29c-3p mimic or potential inhibitor-targeting MLF1 to manage iCCA metastasis or postoperative recurrence. This hypothesis needs to be tested in future translational studies enrolling iCCA patients with curative therapy.
Supplementary Material
DATA AVAILABILITY STATEMENT
ChIP-seq data have been deposited in The National Omics Data Encyclopedia (NODE) (Project ID: OEP003577, https://www.biosino.org/node/project/detail/OEP003577). All data are available in the main text or online Supplemental Materials, http://links.lww.com/HC9/A393.
AUTHOR CONTRIBUTIONS
Zengwei Tang: designed the research, performed experiments and data analyses, and drafted the manuscript. Yuan Yang: participated in data analysis and interpretation. Wen Chen: participated in animal experiments. Tingbo Liang supervised the study. All authors read and approved the final manuscript.
ACKNOWLEDGMENTS
The authors thank Dr. Zhangfu Yang (Fudan University, China) for kindly providing HuCCT1 and HCCC9810 cell lines, Dr. Xiaode Feng (Zhejiang University) for kindly providing CCLP1 and HIBEpiC cell lines, Dr. Wen Chen (Zhejiang University) for providing pT3-EF1α-HA-myrAKT (AKT), pT3-EF1α-YapS127A (YAP), and pCMV-SB11 plasmids and technical support in the construction of hydrodynamic tumor model, Jianfeng Wang, Xiaochao Shen, and Minghua Sun for participating in clinical samples collection and the epigenetic research team working at Novogene Corporation (Beijing, China), and Yunbios (Shanghai, China) for the help on ChIP-seq and targeted bisulfite sequencing data analyses, respectively.
FUNDING INFORMATION
This study was supported by the National Key Research and Development Program of China (No. 2019YFC1316000) and the National Natural Science Foundation of China (No. 82188102).
CONFLICTS OF INTEREST
The authors have no conflicts to report.
Footnotes
Abbreviations: AKT1, AKT serine/threonine kinase 1; BCL, B-cell lymphoma; CASP3, Caspase-3; CHC, combined HCC; ChIP-seq, Chromatin immunoprecipitation DNA-sequencing; CpG, cytosine-phosphate-guanine; CTNNB1, catenin beta 1; CK19, cytokeratin19; CSNK1A1, casein kinase 1 alpha 1; DNMT, DNA methyltransferase; EGFR, EGF receptor; DVL1, dishevelled segment polarity protein 1; EMT, epithelial-mesenchymal transition; FNH, focal nodular hyperplasia; FZD1, frizzled class receptor 1; GEO, Gene Expression Omnibus; GSK3β, glycogen synthase kinase 3β; H&E, hematoxylin and eosin; HIBEpiC, human intrahepatic biliary cell; iCCA, intrahepatic cholangiocarcinoma; KTR19, keratin 19; LRP6, LDL receptor–related protein 6; MLF1, myeloid leukemia factor 1; MMP, matrix metallopeptidases; MUC1, mucin 1; NC, negative control; RT-PCR, real-time PCR; TCGA, The Cancer Genome Atlas; VIM, vimentin; WNT3, Wnt family member 3.
The protocol (1616/22) for animal experiments was approved by the Institutional Animal Care & Use Committee of the First Affiliated Hospital, Zhejiang University School of Medicine. Written informed consents were obtained from each patient enrolled in this study. All research referenced in the present study was performed in accordance with both the Declarations of Helsinki and Istanbul.
The publication of this manuscript was approved by all authors.
Supplemental Digital Content is available for this article. Direct URL citations are provided in the HTML and PDF versions of this article on the journal's website, www.hepcommjournal.com.
Contributor Information
Zengwei Tang, Email: 11918300@zju.edu.cn.
Yuan Yang, Email: wtyangy@163.com.
Wen Chen, Email: chenwen@zju.edu.cn.
Tingbo Liang, Email: liangtingbo@zju.edu.cn.
REFERENCES
- 1.Bridgewater J, Galle PR, Khan SA, Llovet JM, Park JW, Patel T, et al. Guidelines for the diagnosis and management of intrahepatic cholangiocarcinoma. J Hepatol. 2014;60:1268–89. [DOI] [PubMed] [Google Scholar]
- 2.Tang Z, Yang Y, Zhang J, Fu W, Lin Y, Su G, et al. Quantitative proteomic analysis and evaluation of the potential prognostic biomarkers in cholangiocarcinoma. J Cancer. 2019;10:3985–99. [DOI] [PMC free article] [PubMed] [Google Scholar]
- 3.Tang Z, Yang Y, Zhang Q, Liang T. Epigenetic dysregulation-mediated COL12A1 upregulation predicts worse outcome in intrahepatic cholangiocarcinoma patients. Clin Epigenetics. 2023;15:13. [DOI] [PMC free article] [PubMed] [Google Scholar]
- 4.Sirica AE, Gores GJ, Groopman JD, Selaru FM, Strazzabosco M, Wei Wang X, et al. Intrahepatic cholangiocarcinoma: continuing challenges and translational advances. Hepatology. 2019;69:1803–15. [DOI] [PMC free article] [PubMed] [Google Scholar]
- 5.Banales JM, Marin JJG, Lamarca A, Rodrigues PM, Khan SA, Roberts LR, et al. Cholangiocarcinoma 2020: the next horizon in mechanisms and management. Nat Rev Gastroenterol Hepatol. 2020;17:557–88. [DOI] [PMC free article] [PubMed] [Google Scholar]
- 6.Yoneda-Kato N, Look AT, Kirstein MN, Valentine MB, Raimondi SC, Cohen KJ, et al. The t(3;5)(q25.1;q34) of myelodysplastic syndrome and acute myeloid leukemia produces a novel fusion gene, NPM-MLF1. Oncogene. 1996;12:265–75. [PubMed] [Google Scholar]
- 7.Matsumoto N, Yoneda-Kato N, Iguchi T, Kishimoto Y, Kyo T, Sawada H, et al. Elevated MLF1 expression correlates with malignant progression from myelodysplastic syndrome. Leukemia. 2000;14:1757–65. [DOI] [PubMed] [Google Scholar]
- 8.Li X, Min S, Wang H, Shen Y, Li W, Chen Y, et al. MLF1 protein is a potential therapy target for lung adenocarcinoma. Int J Clin Exp Pathol. 2018;11:3533–41. [PMC free article] [PubMed] [Google Scholar]
- 9.Wang X, Zhang Q, Cai Z, Dai Y, Mou L. Identification of novel diagnostic biomarkers for thyroid carcinoma. Oncotarget. 2017;8:111551–66. [DOI] [PMC free article] [PubMed] [Google Scholar]
- 10.McDaniel LD, Conkrite KL, Chang X, Capasso M, Vaksman Z, Oldridge DA, et al. Common variants upstream of MLF1 at 3q25 and within CPZ at 4p16 associated with neuroblastoma. PLoS Genet. 2017;13:e1006787. [DOI] [PMC free article] [PubMed] [Google Scholar]
- 11.Sun Y, Fu A, Xu W, Chao JR, Moshiach S, Morris SW. Myeloid leukemia factor 1 interfered with Bcl-XL to promote apoptosis and its function was regulated by 14-3-3. J Physiol Biochem. 2015;71:807–21. [DOI] [PubMed] [Google Scholar]
- 12.Huang D, Liu C, Sun X, Sun X, Qu Y, Tang Y, et al. CRL4(DCAF8) and USP11 oppositely regulate the stability of myeloid leukemia factors (MLFs). Biochem Biophys Res Commun. 2020;529:127–32. [DOI] [PubMed] [Google Scholar]
- 13.Tang Z, Yang Y, Chen W, Li E, Liang T. Demethylation at enhancer upregulates MCM2 and NUP37 expression predicting poor survival in hepatocellular carcinoma patients. J Transl Med. 2022;20:49. [DOI] [PMC free article] [PubMed] [Google Scholar]
- 14.Low JT, Chandramohan V, Bowie ML, Brown MC, Waitkus MS, Briley A, et al. Epigenetic STING silencing is developmentally conserved in gliomas and can be rescued by methyltransferase inhibition. Cancer Cell. 2022;40:439–40. [DOI] [PubMed] [Google Scholar]
- 15.Chen Q, Wang H, Li Z, Li F, Liang L, Zou Y, et al. Circular RNA ACTN4 promotes intrahepatic cholangiocarcinoma progression by recruiting YBX1 to initiate FZD7 transcription. J Hepatol. 2022;76:135–47. [DOI] [PubMed] [Google Scholar]
- 16.Wang Q, Liang N, Yang T, Li Y, Li J, Huang Q, et al. DNMT1-mediated methylation of BEX1 regulates stemness and tumorigenicity in liver cancer. J Hepatol. 2021;75:1142–53. [DOI] [PubMed] [Google Scholar]
- 17.Komoll RM, Hu Q, Olarewaju O, von Dohlen L, Yuan Q, Xie Y, et al. MicroRNA-342-3p is a potent tumour suppressor in hepatocellular carcinoma. J Hepatol. 2021;74:122–34. [DOI] [PubMed] [Google Scholar]
- 18.Tiemin P, Fanzheng M, Peng X, Jihua H, Ruipeng S, Yaliang L, et al. MUC13 promotes intrahepatic cholangiocarcinoma progression via EGFR/PI3K/AKT pathways. J Hepatol. 2020;72:761–73. [DOI] [PubMed] [Google Scholar]
- 19.Farshidfar F, Zheng S, Gingras MC, Newton Y, Shih J, Robertson AG, et al. Integrative genomic analysis of cholangiocarcinoma identifies distinct IDH-mutant molecular profiles. Cell Rep. 2017;18:2780–94. [DOI] [PMC free article] [PubMed] [Google Scholar]
- 20.Job S, Rapoud D, Dos Santos A, Gonzalez P, Desterke C, Pascal G, et al. Identification of four immune subtypes characterized by distinct composition and functions of tumor microenvironment in intrahepatic cholangiocarcinoma. Hepatology. 2020;72:965–81. [DOI] [PMC free article] [PubMed] [Google Scholar]
- 21.Andersen JB, Spee B, Blechacz BR, Avital I, Komuta M, Barbour A, et al. Genomic and genetic characterization of cholangiocarcinoma identifies therapeutic targets for tyrosine kinase inhibitors. Gastroenterology. 2012;142:1021–31 e15. [DOI] [PMC free article] [PubMed] [Google Scholar]
- 22.Chaisaingmongkol J, Budhu A, Dang H, Rabibhadana S, Pupacdi B, Kwon SM, et al. Common molecular subtypes among Asian hepatocellular carcinoma and cholangiocarcinoma. Cancer Cell. 2017;32:57–70 e3. [DOI] [PMC free article] [PubMed] [Google Scholar]
- 23.Oishi N, Kumar MR, Roessler S, Ji J, Forgues M, Budhu A, et al. Transcriptomic profiling reveals hepatic stem-like gene signatures and interplay of miR-200c and epithelial-mesenchymal transition in intrahepatic cholangiocarcinoma. Hepatology. 2012;56:1792–803. [DOI] [PMC free article] [PubMed] [Google Scholar]
- 24.Roessler S, Long EL, Budhu A, Chen Y, Zhao X, Ji J, et al. Integrative genomic identification of genes on 8p associated with hepatocellular carcinoma progression and patient survival. Gastroenterology. 2012;142:957–66 e12. [DOI] [PMC free article] [PubMed] [Google Scholar]
- 25.Dong L, Lu D, Chen R, Lin Y, Zhu H, Zhang Z, et al. Proteogenomic characterization identifies clinically relevant subgroups of intrahepatic cholangiocarcinoma. Cancer Cell. 2022;40:70–87 e15. [DOI] [PubMed] [Google Scholar]
- 26.Gao Q, Zhu H, Dong L, Shi W, Chen R, Song Z, et al. Integrated proteogenomic characterization of HBV-related hepatocellular carcinoma. Cell. 2019;179:561–77 e22. [DOI] [PubMed] [Google Scholar]
- 27.Goeppert B, Stichel D, Toth R, Fritzsche S, Loeffler MA, Schlitter AM, et al. Integrative analysis reveals early and distinct genetic and epigenetic changes in intraductal papillary and tubulopapillary cholangiocarcinogenesis. Gut. 2022;71:391–401. [DOI] [PMC free article] [PubMed] [Google Scholar]
- 28.Marsico A, Huska MR, Lasserre J, Hu H, Vucicevic D, Musahl A, et al. PROmiRNA: a new miRNA promoter recognition method uncovers the complex regulation of intronic miRNAs. Genome Biol. 2013;14:R84. [DOI] [PMC free article] [PubMed] [Google Scholar]
- 29.Tang Z, Yang Y, Wang X, Meng W, Li X. Meta-analysis of the diagnostic value of Wisteria floribunda agglutinin-sialylated mucin1 and the prognostic role of mucin1 in human cholangiocarcinoma. BMJ Open. 2019;9:e021693. [DOI] [PMC free article] [PubMed] [Google Scholar]
- 30.Hsieh CH, Cheng LH, Hsu HH, Ho TJ, Tu CC, Lin YM, et al. Apicidin-resistant HA22T hepatocellular carcinoma cells strongly activated the Wnt/beta-catenin signaling pathway and MMP-2 expression via the IGF-IR/PI3K/Akt signaling pathway enhancing cell metastatic effect. Biosci Biotechnol Biochem. 2013;77:2397–404. [DOI] [PubMed] [Google Scholar]
- 31.Dongre A, Weinberg RA. New insights into the mechanisms of epithelial-mesenchymal transition and implications for cancer. Nat Rev Mol Cell Biol. 2019;20:69–84. [DOI] [PubMed] [Google Scholar]
- 32.Perugorria MJ, Olaizola P, Labiano I, Esparza-Baquer A, Marzioni M, Marin JJG, et al. Wnt-beta-catenin signalling in liver development, health and disease. Nat Rev Gastroenterol Hepatol. 2019;16:121–36. [DOI] [PubMed] [Google Scholar]
- 33.Chen D, Wu H, Feng X, Chen Y, Lv Z, Kota VG, et al. DNA methylation of cannabinoid receptor interacting protein 1 promotes pathogenesis of intrahepatic cholangiocarcinoma through suppressing Parkin-dependent pyruvate kinase M2 ubiquitination. Hepatology. 2021;73:1816–35. [DOI] [PubMed] [Google Scholar]
- 34.Estaras C, Benner C, Jones KA. SMADs and YAP compete to control elongation of beta-catenin: LEF-1-recruited RNAPII during hESC differentiation. Mol Cell. 2015;58:780–93. [DOI] [PMC free article] [PubMed] [Google Scholar]
- 35.Guerra MT, Florentino RM, Franca A, Lima Filho AC, Dos Santos ML, Fonseca RC, et al. Expression of the type 3 InsP3 receptor is a final common event in the development of hepatocellular carcinoma. Gut. 2019;68:1676–87. [DOI] [PMC free article] [PubMed] [Google Scholar]
- 36.Leshchenko VV, Kuo PY, Shaknovich R, Yang DT, Gellen T, Petrich A, et al. Genomewide DNA methylation analysis reveals novel targets for drug development in mantle cell lymphoma. Blood. 2010;116:1025–34. [DOI] [PMC free article] [PubMed] [Google Scholar]
- 37.Rupaimoole R, Slack FJ. MicroRNA therapeutics: towards a new era for the management of cancer and other diseases. Nat Rev Drug Discov. 2017;16:203–22. [DOI] [PubMed] [Google Scholar]
- 38.Zhang T, Hu J, Wang X, Zhao X, Li Z, Niu J, et al. MicroRNA-378 promotes hepatic inflammation and fibrosis via modulation of the NF-kappaB-TNFalpha pathway. J Hepatol. 2019;70:87–96. [DOI] [PMC free article] [PubMed] [Google Scholar]
- 39.Wu H, Zhang W, Wu Z, Liu Y, Shi Y, Gong J, et al. miR-29c-3p regulates DNMT3B and LATS1 methylation to inhibit tumor progression in hepatocellular carcinoma. Cell Death Dis. 2019;10:48. [DOI] [PMC free article] [PubMed] [Google Scholar]
- 40.Hozaka Y, Seki N, Tanaka T, Asai S, Moriya S, Idichi T, et al. Molecular pathogenesis and regulation of the miR-29-3p-Family: involvement of ITGA6 and ITGB1 in intra-hepatic cholangiocarcinoma. Cancers (Basel). 2021;13:2804. [DOI] [PMC free article] [PubMed] [Google Scholar]
Associated Data
This section collects any data citations, data availability statements, or supplementary materials included in this article.