

Abstract
Background
The relationship between erectile dysfunction (ED) and physical activity has been established in several previous studies, but there is little information on the specific forms of activity that affect ED.
Aim
The objective of this study was to evaluate the relationship of 4 exercise categories and 2 activity intensities with ED in US men.
Methods
We used data sets from the National Health and Nutrition Examination Survey, 2001-2004. We used odds ratios (ORs) and multivariate logistic regression models to investigate the relationship between physical activity and ED. We also conducted subgroup analyses by age and controlled for potential confounder variables using propensity score matching analyses.
Outcomes
The primary outcome was ED as assessed through self-reporting.
Results
An overall 4094 adult men were included in the study. Adjusted multivariate regression models indicated that men who participated in monthly muscle-strengthening activities (OR = 0.75, P = .031), leisure activities (OR = 0.76, P = .024), or vigorous activities (OR = 0.64, P = .001) had a lower risk of ED. The subgroup analysis showed that among those ≥40 years old, muscle-strengthening activity (OR = 0.67, P = .005), leisure activity (OR = 0.72, P = .006), and vigorous activity (OR = 0.50, P < .001) were negatively associated with ED. After adjustment of propensity score matching, leisure activity and vigorous activity were also associated with a lower risk of ED, and muscle-strengthening activity was not significantly associated with ED.
Clinical Implications
Our findings could provide guidance to clinicians in helping patients with ED develop exercise programs.
Strengths and Limitations
We explored the relationship of 4 types and 2 intensities of exercise with ED, using a large sample size and sampling weights to produce representative data. However, this is only a cross-sectional study.
Conclusion
Active monthly participation in leisure and vigorous activity is associated with the maintenance of erectile function, while the relevance of muscle-strengthening activities needs further study.
Keywords: erectile dysfunction, physical activity, NHANES, men’s health
Introduction
Erectile dysfunction (ED), the inability of men to obtain or maintain an erection during sexual intercourse, is a common condition that is more prevalent in people aged >40 years.1,2 An earlier study found that men aged 40 to 59 years had a 14.8% prevalence of ED and men aged 60 to 69 years had a 43.8% prevalence, both substantially greater than the 5.1% prevalence seen in men aged <40 years.3 ED not only leads to a decrease in the quality of sexual life, but also imposes a huge economic burden on society. In addition to being influenced by age, ED may be closely related to education and income level and may be influenced by a history of hypertension, diabetes, hypercholesterolemia, and prostate disease.4-6 Some common bad habits, such as smoking and drinking, may also increase the risk of developing ED.7,8
According to the physical activity (phA) guidelines,9 participation in phA is essential to keep healthy. An adult should perform ≥150 minutes of aerobic and muscle-strengthening activity per week. Growing evidence10-14 suggests a possible correlation between phA and ED. Janiszewski et al found that if a man kept his waistline <102 cm and did the recommended moderate-intensity phA, he may have had a lower risk of developing ED.11 Stratified by age among men 40 to 75 years old, phA was an independent influence on ED.15 Among adult men aged <40 years, increased phA has been similarly shown to be related to better sexual function.16 According to a study, sedentary time and ED have a statistically significant positive exposure-response relationship.17 However, it has also been shown that increased work-related phA increases the risk of developing ED.18 Therefore, it is crucial to examine the effects of different types of phA on the risk of ED.
What exactly is the relationship between ED and different types and intensities of phA? The aim of our study was to analyze the effect of various types of phA, as well as different intensities of phA, on the risk of developing ED by collecting data from the National Health and Nutrition Examination Survey (NHANES) from 2001 to 2004. These types of phA were as follows: transportation, family, muscle strengthening, leisure, vigorous, and moderate.
Methods
Data source
NHANES is a population-based survey conducted by the National Center for Health Statistics of the Centers for Disease Control and Prevention. The single survey period is 2 years, and participants receive demographic and nutritional information, physical examinations, laboratory tests, and questionnaires to generate representative samples for in-depth research. Data for this study were obtained from 2 cross-sectional surveys of the NHANES: 2001-2002 and 2003-2004. We did not require a second review because all data used for analysis were publicly available on the official NHANES website. All NHANES participants completed an informed consent form and passed an ethical review as required by local policy.
Study variables
Erectile dysfunction
According to the Massachusetts Male Aging Study,19 all adult men were asked the following through a questionnaire on erectile function: “How would you describe your ability to obtain and maintain an erection sufficient for satisfactory sexual intercourse?” The answers included “always or almost always able,” “usually able,” “sometimes able,” and “never able.” According to the results of previous studies,12,20 men who responded “sometimes able” or “never able” to maintain erectile function in our study were classified as having ED, while participants who responded “nearly always able” or “usually able” were classified as not having ED.
Physical activity
According to the survey results, the types of phA can be classified as transportation, family, muscle strengthening, and leisure. Transportation activities mainly included walking and biking, and family activities mainly included tasks around home/yard. Participants were divided into 2 categories according to whether they participated in activities every month: do and never. The US phA guidelines9 recommend that adults participate in >150 minutes of phA per week according to the criteria, which classify transportation and family activity time into 2 types: achieved and not achieved. For those who answered never biking or walking for transportation or never participating in family activities in the previous question, we defined them as exercising <150 minutes per week, even if they did not report a specific time for this activity. Muscle-strengthening activities, such as weight lifting, push-ups, and sit-ups, were divided into those done monthly and never. Leisure activities were surveyed with a separate questionnaire containing 48 leisure activities (eg, aerobics, basketball, soccer). Engaging in any of the leisure activities for >10 minutes in the last 30 days is defined as participation. Activities that resulted in significant sweating or a large increase in respiration or heart rate were defined as vigorous, and activities with slight sweating or a slight to moderate increase in respiration or heart rate were defined as moderate. These 2 intensities were classified according to ≥10 and <10 minutes. If a person does this exercise for <10 minutes per month, then one is defined as not doing it, and only if it is ≥10 minutes is it defined as meaningful.
Covariates
Other variables that may influence the relationship between phA and ED, according to available experience and previous studies, include age, race, education level, marital status, economic situation, body mass index (BMI), smoking, alcohol intake, high blood pressure, high cholesterol, diabetes, and a history of prostate disease. Age was converted into 4 categorical variables. According to the NHANES, race was divided into 5 categories. Education level was divided into less than high school, high school, and more than high school. Marital status was classified as married or with a partner, live alone, or unknown. Economic situation was reflected mainly by the poverty-income ratio, classified as <1.5, 1.5 to 3.5, and >3.5.21 BMI was classified as <20, 20 to <25, 25 to <30, and ≥30.20 A person was regarded as a nonsmoker if one had never smoked >100 cigarettes in a lifetime. A person was deemed a current smoker if one had smoked >100 cigarettes and smoke daily or sometimes; the remaining participants were former smokers.22 Alcohol intake was divided into 3 categories: no alcohol consumption (<1 lifetime drink), light alcohol consumption (1 or 2 drinks/d), and heavy alcohol consumption (≥3 drinks/d). The participants underwent multiple blood pressure measurements. A mean of multiple measurements ≥140/90 mm Hg, a previous diagnosis of hypertension, or the prescription of hypertension-lowering medication was considered hypertensive. A total serum cholesterol level ≥240 mg/dL, a previous diagnosis of high cholesterol, or the prescription of cholesterol-lowering medication was considered hypercholesterolemic. Participants classified as diabetic were those with a previous diagnosis of diabetes or fasting blood glucose level >126 mg/dL. Participants who had been diagnosed with prostate disease were considered to have a history of prostate disease.20
Statistical analysis
To assess differences in data conforming to a normal distribution, we first evaluated continuous variables using t tests and categorical variables using Pearson chi-square and Fisher exact tests. Then we analyzed descriptive statistics, with categorical variables reported as percentage (95% CI) and continuous variables as mean ± SE. Mobile examination center (MEC) weights were used to obtain prevalence estimates that were representative of the US population. Because we combined the data from the 2 cross-sectional studies, we used the original MEC weights × 0.5 as final weights.21 By building logistic regression models, we investigated the relationship between phA and ED. The univariate logistic regression model (unadjusted model) and the multivariate logistic regression model (models 1 and 2) were included. Model 1 was adjusted for age, poverty-income ratio, and BMI, and model 2 was adjusted for race, education, marital status, smoking, alcohol intake, history of hypertension, high cholesterol, diabetes, and prostate disease on the basis of model 1. Subgroup analyses were conducted primarily among those ≥40 and <40 years of age.
Propensity score matching (PSM) was used to adjust 4 potential confounder variables—age, BMI, history of hyperglycemia, and high cholesterol—which were matched 1:1 with SPSS (version 27; IBM), and the matching tolerance was set at 0.02. All analyses were performed in SPSS and Stata (version 15; StataCorp). Two-tailed P < .05 was considered statistically different.
Results
Demographic information
If a participant lacked data on erectile function or did not participate in any type or intensity of exercise, he was excluded (Figure 1). All 4094 adult men aged ≥20 years were finally included in the study: 1195 patients with ED and 2899 controls without ED. Among those with ED, the percentage is higher for those >65 years old (P < .001). Non-Hispanic White men had the greatest ED prevalence (P < .001). Additionally, participants with ED had a lower poverty-income ratio, a lower educational level, and a higher BMI. People with ED tend to be more likely to have a history of hypertension, hypercholesterolemia, diabetes, and prostate disease (all P < .001; Table 1).
Figure 1.
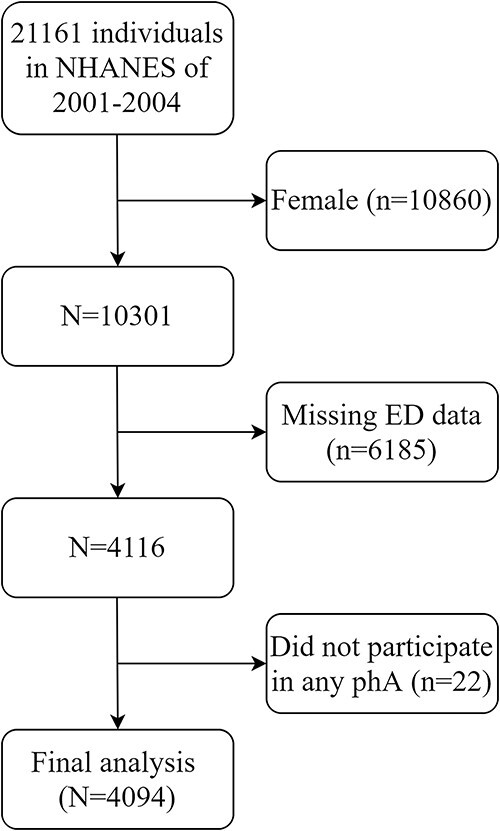
Participant selection.
Table 1.
Basic characteristics of participants.a
| History of erectile dysfunction | ||||
|---|---|---|---|---|
| Characteristic | All (n = 4094) | No (n = 2899) | Yes (n = 1195) | P value b |
| Age, y, weighted mean ± SE | 45.09 ± 0.26 | 41.15 ± 0.26 | 61.46 ± 0.56 | <.001 |
| Age, y | <.001 | |||
| 20-34 | 29.5 (27.9-31.3) | 34.9 (32.9-37.0) | 7.2 (5.5-9.4) | |
| 35-49 | 33.7 (31.8-35.6) | 38.9 (36.8-41.1) | 12.0 (9.5-15.1) | |
| 50-64 | 22.6 (21.1-24.3) | 20.3 (18.6-22.1) | 32.4 (29.0-36.2) | |
| ≥65 | 14.1 (13.2-15.2) | 5.9 (5.2-6.7) | 48.3 (44.7-51.9) | |
| Race | <.001 | |||
| Non-Hispanic White | 74.7 (73.3-76.0) | 74.1 (72.5-75.7) | 77.0 (74.2-79.6) | |
| Non-Hispanic Black | 10.1 (9.3-10.9) | 10.4 (9.6-11.3) | 8.7 (7.4-10.2) | |
| Mexican American | 7.8 (7.2-8.5) | 8.0 (7.3-8.8) | 6.9 (5.8-8.3) | |
| Other race | 3.1 (2.5-3.8) | 3.3 (2.6-4.2) | 2.4 (1.4-3.9) | |
| Other Hispanic | 4.3 (3.6-5.2) | 4.2 (3.4-5.2) | 5.0 (3.5-7.1) | |
| Poverty-income ratio | <.001 | |||
| <1.5 | 18.6 (17.4-19.9) | 17.8 (16.4-19.3) | 21.9 (19.3-24.7) | |
| 1.5-3.5 | 31.2 (29.5-32.9) | 29.9 (27.9-31.9) | 36.6 (33.2-40.1) | |
| >3.5 | 45.2 (43.4-47.1) | 47.4 (45.2-49.6) | 36.3 (32.8-40.1) | |
| Missing | 5.0 (4.3-5.8) | 4.9 (4.1-5.9) | 5.2 (3.9-6.8) | |
| Education | <.001 | |||
| <High school | 17.0 (15.8-18.3) | 14.1 (12.9-15.4) | 29.2 (26.2-32.2) | |
| High school | 27.0 (25.3-28.7) | 28.0 (26.0-29.9) | 23.0 (20.1-26.3) | |
| >High school | 55.9 (54.1-57.8) | 57.9 (55.8-60.0) | 47.8 (44.2-51.5) | |
| Marital status | <.001 | |||
| Married or living with partner | 69.3 (67.6-71.0) | 67.7 (65.6-69.6) | 76.1 (73.0-78.9) | |
| Living alone | 30.6 (28.9-32.3) | 32.2 (30.3-34.2) | 23.9 (21.1-27.0) | |
| Missing | 0.1 (0.0-0.4) | 0.1 (0.0-0.5) | 0 | |
| Smoking status | <.001 | |||
| Nonsmoker | 42.7 (40.9-44.6) | 45.6 (43.4-47.7) | 30.8 (27.5-34.3) | |
| Former smoker | 29.1 (27.4-30.8) | 24.7 (22.9-26.7) | 47.1 (43.5-50.7) | |
| Current smoker | 28.2 (26.5-29.9) | 29.7 (27.7-31.7) | 22.0 (19.1-25.3) | |
| Alcohol intake | <.001 | |||
| Nondrinker | 7.0 (6.1-8.0) | 7.0 (6.0-8.2) | 6.8 (5.3-8.8) | |
| Light drinker | 35.2 (33.4-37.0) | 35.2 (33.1-37.3) | 35.4 (32.0-38.9) | |
| Heavy drinker | 46.9 (45.0-48.7) | 48.9 (46.8-51.1) | 38.2 (34.7-41.9) | |
| Missing | 11.0 (9.9-12.1) | 8.9 (7.7-10.2) | 19.6 (17.0-22.4) | |
| Body mass index | <.001 | |||
| <20 | 3.4 (2.8-4.1) | 3.5 (2.8-4.3) | 2.8 (1.9-4.2) | |
| 20 to <25 | 26.1 (24.5-27.8) | 27.3 (25.5-29.3) | 21.0 (18.2-24.0) | |
| 25 to <30 | 40.5 (38.6-42.3) | 40.8 (38.7-42.9) | 39.1 (35.6-42.7) | |
| ≥30 | 28.6 (27.0-30.4) | 27.5 (25.6-29.5) | 33.4 (29.9-37.0) | |
| Missing | 1.4 (1.1-1.9) | 0.9 (0.6-1.3) | 3.7 (2.8-5.0) | |
| Hypertension | <.001 | |||
| Yes | 35.1 (33.3-36.9) | 29.0 (27.1-31.0) | 60.4 (56.7-63.9) | |
| No | 64.8 (63.0-66.5) | 70.9 (68.9-72.8) | 39.3 (35.7-43.0) | |
| High cholesterol | <.001 | |||
| Yes | 37.1 (35.3-38.9) | 33.3 (31.3-35.4) | 52.8 (49.1-56.4) | |
| No | 61.6 (59.8-63.4) | 65.3 (63.2-67.3) | 46.4 (42.8-50.1) | |
| Missing | 1.3 (1.0-1.8) | 1.4 (1.0-2.0) | 0.8 (0.5-1.4) | |
| Diabetes | <.001 | |||
| Yes | 7.2 (6.3-8.1) | 4.1 (3.4-5.0) | 19.7 (16.9-22.9) | |
| No | 88.4 (87.2-89.5) | 92.6 (91.4-93.7) | 71.1 (67.6-74.3) | |
| Missing | 4.4 (3.7-5.3) | 3.3 (2.5-4.2) | 9.2 (7.3-11.6) | |
| History of prostate disease | <.001 | |||
| Yes | 10.7 (9.7-11.8) | 6.5 (5.5-7.6) | 28.0 (25.0-31.1) | |
| No | 89.2 (88.1-90.2) | 93.4 (92.2-94.3) | 71.8 (68.7-74.8) | |
| Missing | 0.1 (0.1-0.4) | 0.1 (0.0-0.5) | 0.2 (0.1-0.5) | |
Data are presented as weighted percentage (95% CI) unless noted otherwise.
bAll comparisons: P < .05.
Physical activity
PhA was classified with or without ED, and details are presented in Table 2. When compared with those without ED, those with ED walked or biked less, did less housework, did fewer muscle-strengthening activities, and did fewer leisure activities (all P < .001). For vigorous and moderate activity, patients with ED also did less (all P < .001).
Table 2.
Distribution of physical activity in participants with and without erectile dysfunction.a
| History of erectile dysfunction | ||||
|---|---|---|---|---|
| Physical activity | All | No | Yes | P value b |
| Walked or bicycled | <.001 | |||
| Any | 24.6 (23.0-26.2) | 26.2 (24.4-28.2) | 17.8 (15.3-20.7) | |
| None | 74.2 (72.5-75.8) | 73.2 (71.2-75.1) | 78.3 (75.2-81.1) | |
| Missing | 1.2 (0.9-1.6) | 0.5 (0.3-0.9) | 3.8 (2.7-5.4) | |
| Time of walked or bicycled | <.001 | |||
| Achieved recommendation (per week) | 6.7 (5.9-7.6) | 6.9 (6.0-8.0) | 5.8 (4.4-7.7) | |
| Not achieved recommendation (per week) | 92.1 (91.1-93.0) | 92.5 (91.4-93.5) | 90.2 (87.9-92.1) | |
| Missing | 1.2 (0.9-1.6) | 0.6 (0.3-0.9) | 4.0 (2.8-5.5) | |
| Tasks around home/yard | <.001 | |||
| Any | 70.7 (69.1-72.3) | 72.4 (70.5-74.2) | 63.7 (60.3-67.0) | |
| None | 28.2 (26.6-29.8) | 27.1 (25.3-29.0) | 32.6 (29.4-35.9) | |
| Missing | 1.1 (0.8-1.5) | 0.5 (0.3-0.8) | 3.7 (2.6-5.3) | |
| Time of tasks around home/yard | <.001 | |||
| Achieved recommendation (per week) | 24.4 (22.8-26.1) | 24.5 (22.6-26.4) | 24.3 (21.2-27.6) | |
| Not achieved recommendation (per week) | 74.4 (72.6-76.0) | 75.0 (73.0-76.9) | 71.7 (68.2-74.9) | |
| Missing | 1.2 (0.9-1.6) | 0.5 (0.3-0.8) | 4.1 (2.9-5.7) | |
| Muscle-strengthening activities | <.001 | |||
| Any | 31.8 (11.9-33.6) | 34.9 (32.9-37.0) | 18.9 (16.1-22.0) | |
| None | 66.6 (64.8-68.4) | 64.3 (62.2-66.3) | 76.3 (72.9-79.3) | |
| Missing | 1.6 (1.2-2.1) | 0.8 (0.5-1.3) | 4.9 (3.6-6.7) | |
| Leisure activity | <.001 | |||
| Any | 68.1 (66.4-69.8) | 71.1 (69.2-73.0) | 55.6 (52.0-59.2) | |
| None | 31.9 (30.2-33.6) | 28.9 (27.0-30.8) | 44.4 (40.8-48.0) | |
| Vigorous activity | <.001 | |||
| Any | 39.5 (37.6-41.4) | 44.4 (42.2-46.6) | 19.1 (16.3-22.2) | |
| None | 58.1 (56.2-60.0) | 54.3 (52.2-56.5) | 73.6 (70.2-76.7) | |
| Missing | 2.5 (2.0-3.1) | 1.3 (0.9-1.9) | 7.4 (5.7-9.4) | |
| Moderate activity | <.001 | |||
| Any | 56.0 (54.1-57.8) | 57.9 (55.8-60.0) | 47.8 (44.2-51.5) | |
| None | 42.5 (40.7-57.8) | 41.3 (39.2-43.4) | 47.5 (43.9-51.2) | |
| Missing | 1.5 (1.1-2.0) | 0.7 (0.4-1.3) | 4.6 (3.3-6.5) | |
Data are presented as weighted percentage (95% CI) unless noted otherwise.
bAll comparisons: P < .05.
Correlation analysis
As shown in the unadjusted model (Table 3), ED was significantly associated with the following activities: transportation (OR = 0.64, P < .001), household (OR = 0.73, P = .001), muscle strengthening (OR = 0.46, P < .001), leisure (OR = 0.51, P < .001), vigorous (OR = 0.31, P < .001), and moderate (OR = 0.71, P < .001).
Table 3.
Association between physical activity and erectile dysfunction in NHANES, 2001-2004.a
| Unadjusted model | Model 1 b | Model 2 c | ||||
|---|---|---|---|---|---|---|
| Physical activity | OR (95% CI) | P value | OR (95% CI) | P value | OR (95% CI) | P value |
| Walked or bicycled | <.001 | .012 | .070 | |||
| Any | 0.64 (0.51-0.78) | 0.73 (0.57-0.93) | 0.79 (0.61-1.02) | |||
| None | 1 [Reference] | 1 [Reference] | 1 [Reference] | |||
| Time of walked or bicycled | .390 | .509 | .720 | |||
| Achieved recommendation (per week) | 0.86 (0.62-1.21) | 0.87 (0.59-1.30) | 0.93 (0.62-1.39) | |||
| Tasks around home/yard | .001 | .021 | .153 | |||
| Any | 0.73 (0.61-0.87) | 0.76 (0.61-0.96) | 0.84 (0.66-1.07) | |||
| None | 1 [Reference] | 1 [Reference] | 1 [Reference] | |||
| Time of tasks around home/yard | .723 | .060 | .196 | |||
| Achieved recommendation (per week) | 1.04 (0.85-1.27) | 0.79 (0.61-1.01) | 0.84 (0.64-1.09) | |||
| Muscle-strengthening activities | <.001 | .002 | .031 | |||
| Any | 0.46 (0.37-0.56) | 0.67 (0.52-0.87) | 0.75 (0.57-0.97) | |||
| None | 1 [Reference] | 1 [Reference] | 1 [Reference] | |||
| Leisure activity | <.001 | .001 | .024 | |||
| Any | 0.51 (0.43-0.60) | 0.68 (0.55-0.85) | 0.76 (0.60-0.97) | |||
| None | 1 [Reference] | 1 [Reference] | 1 [Reference] | |||
| Vigorous activity | <.001 | <.001 | .001 | |||
| Any | 0.31 (0.26-0.39) | 0.58 (0.45-0.74) | 0.64 (0.49-0.83) | |||
| None | 1 [Reference] | 1 [Reference] | 1 [Reference] | |||
| Moderate activity | <.001 | .028 | .143 | |||
| Any | 0.71 (0.60-0.85) | 0.78 (0.63-0.97) | 0.84 (0.67-1.06) | |||
| None | 1 [Reference] | 1 [Reference] | 1 [Reference] | |||
Abbreviations: BMI, body mass index; NHANES, National Health and Nutrition Examination Survey; OR, odds ratio.
aBold indicates P < .05.
bModel 1: adjusted for age, poverty-income ratio, and BMI.
cModel 2: adjusted for age, race, education level, marital status, poverty-income ratio, BMI, alcohol intake, smoking, hypertension, diabetes, high cholesterol, and history of prostate disease.
Adjusting for age, poverty-income ratio, and BMI, model 1 shows that ED is significantly associated with the following activities: transportation (OR = 0.73, P = .012), household (OR = 0.76, P = .021), muscle strengthening (OR = 0.67, P = .002), leisure (OR = 0.68, P = .001), vigorous (OR = 0.58, P < .001), and moderate (OR = 0.78, P = .028) (Table 3).
After adjusting for all covariates, model 2 showed that participants who did muscle-strengthening activities had a 25% (OR = 0.75, P = .031) lower risk of ED than those who did not and that those who did leisure activities had a 24% (OR = 0.76, P = .024) lower risk of ED than those who did not. The risk of ED was 36% (OR = 0.64, P = .001) lower for participants doing vigorous activities than for those who did not (Table 3).
Subgroup analysis
In subgroup analyses according to age ≥40 and <40 years, after adjusting for multiple covariates, muscle-strengthening (OR = 0.67, P = .005), leisure (OR = 0.72, P = .006), and vigorous (OR = 0.50, P < .001) activities were negatively related to ED in those aged ≥40 years. Those aged <40 years, however, showed no statistically significant changes (Table 4).
Table 4.
Subgroup analysis according to age.a
| Vigorous activity | Muscle-strengthening activities | Leisure activity | ||||
|---|---|---|---|---|---|---|
| Age, y | OR (95% CI) | P value | OR (95% CI) | P value | OR (95% CI) | P value |
| 20-39 | 0.65 (0.34-1.24) | .195 | 0.76 (0.37-1.54) | .441 | 0.72 (0.40-1.28) | .264 |
| ≥40 | 0.50 (0.38-0.66) | <.001 | 0.67 (0.51-0.89) | .005 | 0.72 (0.57-0.91) | .006 |
Abbreviations: BMI, body mass index; OR, odds ratio.
Adjusted for age, race, education level, marital status, poverty-income ratio, BMI, alcohol intake, smoking, hypertension, diabetes, high cholesterol, and history of prostate disease. Bold indicates P < .05.
PSM analysis
After PSM adjustment, 1558 participants were included to assess the relationship between phA and ED. Table S1 shows the basic information about all participants. The distribution of phA among participants with and without ED after adjustment of PSM is shown in Table S2. All 1558 participants were analyzed in the 3 models, which revealed a 27% reduction (OR = 0.73, P = .029) in ED risk in model 2 for those who participated in leisure activities monthly and a 42% reduction for those who participated in vigorous exercise per month (OR = 0.58, P = .001), after adjustment for all variables. However, the correlation between muscle-strengthening activity and ED was not statistically significant (P = .056; Table S3).
Discussion
In our study population, we observed that ED was more prevalent in people who did less phA. Using univariate regression analysis, we found that walking or cycling, family activities, muscle-strengthening activities, leisure activities, and vigorous and moderate activities were significantly associated with ED. After fully adjusting for multiple covariates, those who did have a lower risk of ED, as compared with those who did not, performed leisure activities monthly. When compared with individuals who did not participate in muscle-strengthening exercises for each month, those who did participate for longer periods had a lower chance of getting ED. When compared with <10 minutes of vigorous phA per month, >10 minutes reduced the risk of developing ED. The subgroup analysis found that these correlations remained significant in those ≥40 years old. To further reduce bias due to case selection and clinical confounders, we performed PSM analysis, and the results suggested that leisure activity and vigorous activity may be protective factors for ED; however, the correlation between muscle-strengthening activities and ED did not show statistically significant differences.
In the questionnaire from NHANES, leisure activities included 48 types of phA. Our results are in line with research23 that linked leisure activity involvement on a monthly basis to a decreased risk of developing ED. However, no clear conclusions were drawn in our study regarding which leisure activities, and of what duration, were more beneficial in reducing ED risk, possibly due to limited questionnaire information, and this is worth exploring in the future. Muscle-strengthening activities are linked to a lower risk of cardiovascular disease, diabetes, and cancer mortality, and they also lower the risk of and mortality from major noncommunicable illnesses.24,25 Yet, until now, there are fewer studies on the effect of muscle-strengthening activity on ED. Although the PSM analysis revealed no significant difference and additional prospective studies may be required to investigate, our investigation demonstrated that >10 minutes of muscular exercise per month was related to a 25% reduction in the risk of ED.
According to the US exercise guidelines,9 vigorous activity is defined as 6 to 8 metabolic equivalents (METs) of activity. METs refer to the oxygen demand for various activities and are often used to describe an individual’s aerobic capacity or cardiorespiratory fitness and to produce exercise guidelines. One MET is equivalent to the amount of oxygen consumed by the body while sitting still, which is approximately 3.5 mL of O2/kg/min.26 Our study shows that those who engage in ≥10 minutes of vigorous activity per month have a lower risk of ED as compared with those who engage in <10 minutes. However, excessive strenuous exercise can also be detrimental to the health of people who already have cardiovascular disease.27 PhA may improve the quality of arterial ED by reducing endothelial cell apoptosis.28 In a randomized controlled trial, phA and PDE5 inhibitors were shown to be more effective than PDE5 inhibitors alone in the treatment of ED.29 Each additional hour of sedentary behavior is associated with a 16% increase in the probability of elevated serum prostate-specific antigen concentrations, suggesting a potential risk to men’s health from this behavior.30 In the future, it will be particularly important to develop a rational exercise program for the population with ED.
There are several restrictions in our study. First, the NHANES database does not provide specific durations for some types of phA. Second, this was a cross-sectional study, and further prospective studies are needed to confirm our findings. Finally, ED was assessed with a self-report questionnaire, and although previous studies have confirmed its validity, the extent of ED has not yet been assessed. Erectile function assessment was not performed with the current International Index of Erectile Function–5, which may have increased sample selection bias. Our study identified a correlation between leisure/vigorous activity and ED, and the reliability of our findings was confirmed by PSM analysis.
Conclusion
The preservation of adequate erectile function is correlated with leisure and vigorous activities, and this link persisted significantly in those beyond the age of 40 years. This suggests that a future focus of men’s health promotion may be to develop individualized exercise programs to reduce the burden of ED for people with severe physical conditions. In the future, more prospective longitudinal studies will be required to ascertain the strength of the relationship between phA and ED.
Supplementary Material
Acknowledgments
We did not need to do a second review as all data utilized for the analysis are available on the official NHANES website and all NHANES participants completed informed consent forms and passed ethical review as required by policy.
Contributor Information
Hang Zhou, Department of Urology, Tianjin Medical University General Hospital, Tianjin, 300052, China.
Mingming Xu, Department of Urology, Tianjin Medical University General Hospital, Tianjin, 300052, China.
Zhunan Xu, Department of Urology, Tianjin Medical University General Hospital, Tianjin, 300052, China.
Muwei Li, Department of Urology, Tianjin Medical University General Hospital, Tianjin, 300052, China.
Congzhe Ren, Department of Urology, Tianjin Medical University General Hospital, Tianjin, 300052, China.
Xiangyu Chen, Department of Urology, Tianjin Medical University General Hospital, Tianjin, 300052, China.
Xiaoqiang Liu, Department of Urology, Tianjin Medical University General Hospital, Tianjin, 300052, China.
Author contributions
Conception and design: H.Z., M.X. Acquisition of data: H.Z., M.X., X.C. Analysis and interpretation of data: Z.X., M.L., C.R. Drafting the article: H.Z. Revising it for intellectual content: X.L. Final approval of the completed article: all authors.
Funding
This work was supported by the National Natural Science Foundation of China (No. 82171594).
Conflicts of interest: None declared.
Data availability
All data applied in this study can be searched on the NHANES website (https://wwwn.cdc.gov/nchs/nhanes/Default.aspx), and more detailed analysis data can be obtained by contacting the corresponding author.
References
- 1. Burnett AL, Nehra A, Breau RH, et al. Erectile dysfunction: AUA guideline. J Urol. 2018;200(3):633–641. 10.1016/j.juro.2018.05.004. [DOI] [PubMed] [Google Scholar]
- 2. Shamloul R, Ghanem H. Erectile dysfunction. Lancet. 2013;381(9861):153–165. 10.1016/s0140-6736(12)60520-0. [DOI] [PubMed] [Google Scholar]
- 3. Selvin E, Burnett AL, Platz EA. Prevalence and risk factors for erectile dysfunction in the US. Am J Med. 2007;120(2):151–157. 10.1016/j.amjmed.2006.06.010. [DOI] [PubMed] [Google Scholar]
- 4. Akkus E, Kadioglu A, Esen A, et al. Prevalence and correlates of erectile dysfunction in Turkey: a population-based study. Eur Urol. 2002;41(3):298–304. 10.1016/s0302-2838(02)00027-1. [DOI] [PubMed] [Google Scholar]
- 5. Maalmi H, Herder C, Bönhof GJ, et al. Differences in the prevalence of erectile dysfunction between novel subgroups of recent-onset diabetes. Diabetologia. 2022;65(3):552–562. 10.1007/s00125-021-05607-z. [DOI] [PMC free article] [PubMed] [Google Scholar]
- 6. Fung MM, Bettencourt R, Barrett-Connor E. Heart disease risk factors predict erectile dysfunction 25 years later: the Rancho Bernardo Study. J Am Coll Cardiol. 2004;43(8):1405–1411. 10.1016/j.jacc.2003.11.041. [DOI] [PubMed] [Google Scholar]
- 7. Kupelian V, Link CL, McKinlay JB. Association between smoking, passive smoking, and erectile dysfunction: results from the Boston Area Community Health (BACH) survey. Eur Urol. 2007;52(2):416–422. 10.1016/j.eururo.2007.03.015. [DOI] [PMC free article] [PubMed] [Google Scholar]
- 8. Evren C, Can S, Evren B, Saatcioglu O, Cakmak D. Lifetime posttraumatic stress disorder in Turkish alcohol-dependent inpatients: relationship with depression, anxiety and erectile dysfunction. Psychiatry Clin Neurosci. 2006;60(1):77–84. 10.1111/j.1440-1819.2006.01463.x. [DOI] [PubMed] [Google Scholar]
- 9. Piercy KL, Troiano RP, Ballard RM, et al. The physical activity guidelines for Americans. JAMA. 2018;320(19):2020–2028. 10.1001/jama.2018.14854. [DOI] [PMC free article] [PubMed] [Google Scholar]
- 10. Bacon CG, Mittleman MA, Kawachi I, Giovannucci E, Glasser DB, Rimm EB. Sexual function in men older than 50 years of age: results from the health professionals follow-up study. Ann Intern Med. 2003;139(3):161–168. 10.7326/0003-4819-139-3-200308050-00005. [DOI] [PubMed] [Google Scholar]
- 11. Janiszewski PM, Janssen I, Ross R. Abdominal obesity and physical inactivity are associated with erectile dysfunction independent of body mass index. J Sex Med. 2009;6(7):1990–1998. 10.1111/j.1743-6109.2009.01302.x. [DOI] [PubMed] [Google Scholar]
- 12. Loprinzi PD, Edwards M. Association between objectively measured physical activity and erectile dysfunction among a nationally representative sample of American men. J Sex Med. 2015;12(9):1862–1864. 10.1111/jsm.12977. [DOI] [PubMed] [Google Scholar]
- 13. Minami H, Furukawa S, Sakai T, et al. Physical activity and prevalence of erectile dysfunction in Japanese patients with type 2 diabetes mellitus: the Dogo Study. J Diabetes Investig. 2018;9(1):193–198. 10.1111/jdi.12660. [DOI] [PMC free article] [PubMed] [Google Scholar]
- 14. Kratzik CW, Lackner JE, Märk I, et al. How much physical activity is needed to maintain erectile function? Results of the Androx Vienna Municipality Study. Eur Urol. 2009;55(2):509–517. 10.1016/j.eururo.2008.02.020. [DOI] [PubMed] [Google Scholar]
- 15. Agostini LC, Netto JM, Miranda MV Jr, Figueiredo AA. Erectile dysfunction association with physical activity level and physical fitness in men aged 40-75 years. Int J Impot Res. 2011;23(3):115–121. 10.1038/ijir.2011.15. [DOI] [PubMed] [Google Scholar]
- 16. Hsiao W, Shrewsberry AB, Moses KA, et al. Exercise is associated with better erectile function in men under 40 as evaluated by the International Index of Erectile Function. J Sex Med. 2012;9(2):524–530. 10.1111/j.1743-6109.2011.02560.x. [DOI] [PubMed] [Google Scholar]
- 17. Furukawa S, Sakai T, Niiya T, et al. Self-reported sitting time and prevalence of erectile dysfunction in Japanese patients with type 2 diabetes mellitus: the Dogo Study. J Diabetes Complicat. 2017;31(1):53–57. 10.1016/j.jdiacomp.2016.10.011. [DOI] [PubMed] [Google Scholar]
- 18. Cho BL, Kim YS, Choi YS, et al. Prevalence and risk factors for erectile dysfunction in primary care: results of a Korean study. Int J Impot Res. 2003;15(5):323–328. 10.1038/sj.ijir.3901022. [DOI] [PubMed] [Google Scholar]
- 19. O, Donnell AB, Araujo AB, Goldstein I, McKinlay JB. The validity of a single-question self-report of erectile dysfunction: results from the Massachusetts Male Aging Study. J Gen Intern Med. 2005;20(6):515–519. 10.1111/j.1525-1497.2005.0076.x. [DOI] [PMC free article] [PubMed] [Google Scholar]
- 20. Wang W, Xiang LY, Ma YC, et al. The association between heavy metal exposure and erectile dysfunction in the United States. Asian J Androl. 2023;25(2):271–276. 10.4103/aja202237. [DOI] [PMC free article] [PubMed] [Google Scholar]
- 21. Almohamad M, Krall Kaye E, Mofleh D, Spartano NL. The association of sedentary behaviour and physical activity with periodontal disease in NHANES 2011-2012. J Clin Periodontol. 2022;49(8):758–767. 10.1111/jcpe.13669. [DOI] [PubMed] [Google Scholar]
- 22. Tomar SL, Asma S. Smoking-attributable periodontitis in the United States: findings from NHANES III. J Periodontol. 2000;71(5):743–751. 10.1902/jop.2000.71.5.743. [DOI] [PubMed] [Google Scholar]
- 23. Boyle P, Robertson C, Mazzetta C, et al. The association between lower urinary tract symptoms and erectile dysfunction in four centres: the UrEpik study. BJU Int. 2003;92(7):719–725. 10.1046/j.1464-410x.2003.04459.x. [DOI] [PubMed] [Google Scholar]
- 24. Giovannucci EL, Rezende LFM, Lee DH. Muscle-strengthening activities and risk of cardiovascular disease, type 2 diabetes, cancer and mortality: a review of prospective cohort studies. J Intern Med. 2021;290(4):789–805. 10.1111/joim.13344. [DOI] [PubMed] [Google Scholar]
- 25. Momma H, Kawakami R, Honda T, Sawada SS. Muscle-strengthening activities are associated with lower risk and mortality in major non-communicable diseases: a systematic review and meta-analysis of cohort studies. Br J Sports Med. 2022;56(13):755–763. 10.1136/bjsports-2021-105061. [DOI] [PMC free article] [PubMed] [Google Scholar]
- 26. Franklin BA, Brinks J, Berra K, Lavie CJ, Gordon NF, Sperling LS. Using metabolic equivalents in clinical practice. Am J Cardiol. 2018;121(3):382–387. 10.1016/j.amjcard.2017.10.033. [DOI] [PubMed] [Google Scholar]
- 27. El Masri I, Kayali SM, Blount C, Kirolos I, Khouzam JP, Kabra R. Is exercise helpful or harmful in dealing with specific arrhythmia. Curr Probl Cardiol. 2021;46(3):100740. 10.1016/j.cpcardiol.2020.100740. [DOI] [PubMed] [Google Scholar]
- 28. La Vignera S, Condorelli R, Vicari E, D'Agata R, Calogero A. Aerobic physical activity improves endothelial function in the middle-aged patients with erectile dysfunction. Aging Male. 2011;14(4):265–272. 10.3109/13685538.2010.544344. [DOI] [PubMed] [Google Scholar]
- 29. Maio G, Saraeb S, Marchiori A. Physical activity and PDE5 inhibitors in the treatment of erectile dysfunction: results of a randomized controlled study. J Sex Med. 2010;7(6):2201–2208. 10.1111/j.1743-6109.2010.01783.x. [DOI] [PubMed] [Google Scholar]
- 30. Loprinzi PD, Kohli M. Effect of physical activity and sedentary behavior on serum prostate-specific antigen concentrations: results from the National Health and Nutrition Examination Survey (NHANES), 2003-2006. Mayo Clin Proc. 2013;88(1):11–21. 10.1016/j.mayocp.2012.10.012. [DOI] [PubMed] [Google Scholar]
Associated Data
This section collects any data citations, data availability statements, or supplementary materials included in this article.
Supplementary Materials
Data Availability Statement
All data applied in this study can be searched on the NHANES website (https://wwwn.cdc.gov/nchs/nhanes/Default.aspx), and more detailed analysis data can be obtained by contacting the corresponding author.