

Abstract
Plant cell walls contain the hemicellulose xyloglucan, whose fine structure may vary depending on cell type, tissue, and/or plant species. Most but not all of the glycosyltransferases involved in the biosynthesis of xyloglucan sidechains have been identified. Here, we report the identification of several functional glycosyltransferases from blueberry ( Vaccinium corymbosum bluecrop). Among those transferases is a hitherto elusive Xyloglucan:Beta‐xylosylTransferase (XBT). Heterologous expression of VcXBT in the Arabidopsis thaliana double mutant mur3 xlt2, where xyloglucan consists only of an unsubstituted xylosylated glucan core structure, results in the production of the xylopyranose‐containing “U” sidechain as characterized by mass spectrometry, glycosidic linkage, and NMR analysis. The introduction of the additional xylopyranosyl residue rescues the dwarfed phenotype of the untransformed Arabidopsis mur3 xlt2 mutant to wild‐type height. Structural protein analysis using Alphafold of this and other related xyloglucan glycosyltransferase family 47 proteins not only identifies potential domains that might influence the regioselectivity of these enzymes but also gives hints to specific amino acids that might determine the donor‐substrate specificity of these glycosyltransferases.
Keywords: beta‐xylopyranosyltransferase, blueberry GT47, glycosyltransferase, hemicellulose, xyloglucan
1. INTRODUCTION
One of the major hemicelluloses found in the primary plant cell wall is xyloglucan (XyG) (Pauly & Keegstra, 2016). This polysaccharide has been found not only in land plants including nonvascular plants such as liverworts and mosses (Peña et al., 2008) but also their ancestors, the charophycean green algae (Mikkelsen et al., 2021). The function of XyG in plant growth and development is still under debate (Cosgrove, 2022; Park & Cosgrove, 2015; Talbott & Ray, 1992; Thompson, 2005) as mutant plants lacking XyG do not exhibit obvious growth phenotypes (Cavalier et al., 2008; Kim et al., 2020).
The abundance and fine structure of XyG can vary not only among different plant species but also among different plant tissues (Dardelle et al., 2015; Lampugnani et al., 2013; Liu et al., 2015; Schultink et al., 2014). The core structure of XyG consists of a backbone of β‐1,4 glucan that is substituted at O‐6 with α‐xylosyl residues that are often further decorated with other sugar and/or acetyl residues. More than 20 different XyG sidechains have been discovered so far (Pauly et al., 2013; Scheller & Ulvskov, 2010; Schultink et al., 2014), and a one‐letter code was established for their description (Fry et al., 1993). Based on this code, G refers to an unsubstituted glucosyl backbone residue, while X represents a xylosylated glucosyl residue, that is, α‐d‐Xylp‐(1‐>6)‐β‐d‐Glc. Such a XyG core structure can be further extended on the xylosyl unit at O‐2 with galactosyl, arabinofuranosyl, arabinopyranosyl, galacturonsyl, or xylosyl residues resulting in L, S, D, Y, and U sidechains, respectively (Hilz et al., 2007; Hsieh & Harris, 2009; Jia et al., 2005; Peña et al., 2008, 2012).
Many glycosyltransferases (GTs) involved in XyG synthesis have been identified that belong to various carbohydrate‐active enzymes (CaZy) families (Coutinho et al., 2003; Pauly & Keegstra, 2016). Substitution on the xylosyl residues of the XyG core structure is mediated by members of the GT47 family including MUR3 and XLT2 (Figure 1). MUR3 represents a XyG:galactosyltransferase, which adds a β‐galactosyl residue at the O‐2 position to a xylosyl‐core residue resulting in the sidechain L (Madson et al., 2003; Wang et al., 2020). MUR3 transfers the galactosyl moiety to the third xylosyl residue on the XyG chain leading to an XXLG oligosaccharide motive in XyG. In contrast, XLT2 adds the galactosyl residue to the second xylosyl residue leading to a XLXG motive, demonstrating that these GTs exhibit regioselectivity (Jensen et al., 2012). GT47 family members can also transfer galacturonic acid (XUT1), arabinofuranosyl (XST), or arabinopyranosyl moieties (XDT) to the core xylosyl residue (Peña et al., 2012; Schultink et al., 2013; Zhu et al., 2018).
FIGURE 1.

Illustration of the xyloglucan oligosaccharides XLLG and XXUG and the corresponding glycosyltransferases. For the one‐letter code, see Fry et al. (1993). XyG sidechain galactosyltransferases XLT2 and MUR3 transfer the galactosyl residues to the second and third xylosyl units, respectively, resulting in XLLG. XBT, identified and characterized in this study, represents a xylopyranosyltransferase resulting in XUXG. Blue dots: d‐glucose (Glcp), orange stars: d‐xylose (Xylp), yellow dots: d‐galactose (Galp).
A unique XyG sidechain encompassing a terminal β‐xylopyranosyl residue on the XyG core structure, that is, β‐d‐Xylp‐(1‐>2)‐α‐d‐Xylp (U sidechain), has been identified in leaf tissue of the Argan tree (Ray et al., 2004) and bilberries (Hilz et al., 2007). Here, we describe the identification of a responsible XyG:β‐xylopyranosyltransferase among GT47 transferases identified in blueberry (Vaccinium corymbosum). Because the letter U had already been used for a GT47 XyG:galacturonsyltransferase (XUT; Peña et al., 2012), we named this enzyme XyG:Beta‐xylosylTransferase (XBT; Figure 1).
2. METHODS
2.1. Plant material and growth
Arabidopsis seeds (Arabidopsis thaliana ecotype Columbia [Col‐0]; double mutant mur3.1 xlt2 [Jensen et al., 2012]; complemented Arabidopsis lines) were surface sterilized, stratified, and germinated on soil or half‐strength Murashige and Skoog (MS) agar plates. Nicotiana benthamiana seeds were surface sterilized and plants grown on soil at 20/19°C under 12‐/12‐h light/dark cycle with 40%/75% humidity.
2.2. Phylogenetic analysis and sequences
A Blastp search (Altschul et al., 1990; Camacho et al., 2009) using the Genome Database of Vaccinium (GDV; V. corymbosum cv. Draper v1.0 genome peptides; Colle et al., 2019) was performed using the AtXLT2 (gene locus: At5g62220) protein sequence to identify homologous sequences from blueberry (V. corymbosum). A cut‐off was set at e value smaller than 1 * 10−40. Phylogenetic trees were created using the “One Click” Mode in Phylogeny.fr (Dereeper et al., 2008; Lemoine et al., 2019) using MUSCLE for multiple sequence alignment (Edgar, 2004). Protein sequences were obtained from NCBI, TAIR, and GDV.
The V. corymbosum protein sequences used in the study have been deposited in Genebank with the following accession numbers: OQ851743 (VcMUR3), OQ851744 (VcXLT2_1), OQ851745 (VcXLT2_2), OQ851746 (VcXBT_1/VcXBT), OQ851747 (VcXBT_2), OQ851748 (VcXBT_3), and OQ851749 (VcXBT_4).
2.3. Genetic complementation
The Arabidopsis complementation approach was carried out as described (Jensen et al., 2012; Zhu et al., 2018). Blueberry gDNA was extracted from berries of V. corymbosum ‘Bluecrop’ (Farm Vinnemann in Olfen, Germany) using a CTAB‐based extraction. Coding sequences of various GT47 gene candidate genes were amplified (Table S1) and introduced into the pORE‐E4 vector (Coutu et al., 2007) using TA cloning (VcXBT, VcMUR3, VcXLT2_1, VcXBT2, and VcXBT 3) or restriction cloning (VcXLT2_2, VcXBT 4). Confirmed plasmids were transformed into Agrobacterium tumefaciens GV3101 and subsequently integrated into the Arabidopsis mur3.1 xlt2 double mutants via floral dip (Clough & Bent, 1998). The transgenic plants were selected on half‐strength MS agar plates containing selective antibiotic kanamycin (50 μg/ml). Germinated seedlings were transferred to soil for continuous growth. Homozygous T3 transformants were grown in a Phytotron under 16/8 h light/dark cycles at 21°C with 70% humidity and their phenotypic growth habit determined.
2.4. Analysis of XyG
Alcohol‐insoluble residue (AIR) was prepared from leaf tissue or etiolated hypocotyls of Col‐0, Atmur3.1 xlt2, and generated Arabidopsis complementation lines by grinding dried plant material followed by an extraction with 70% (v/v) aqueous ethanol and twice with chloroform:methanol (1:1) (Schultink et al., 2013). The AIR material was then subjected to a xyloglucanase (XEG) digestion (Jensen et al., 2012; Pauly et al., 1999). The resulting solubilized XyG oligosaccharides were desalted by solid‐phase extraction using Supelclean™ ENVI‐Carb™ SPE Tubes (Supelco, 57109‐U) (Schultink et al., 2013; Zhu et al., 2018) and analyzed by MALDI‐TOF mass spectrometry and High‐performance anion‐exchange chromatography (HPAEC) equipped with a pulsed amperometric detector (PAD; IC Amperometric Detector, Metrohm) as described (Schultink et al., 2013). XyG oligosaccharides were separated using the following gradient: flow .4 ml/min, 100 mM NaOH to 100 mM NaOH/80 mM sodiumacetate in 22 min followed by a return to 100 mM NaOH within 4 min and a 6 min 100 mM NaOH wash. The XyG oligosaccharide mixture was also subjected to acid hydrolysis followed by monosaccharide compositional analysis by HPAEC as described (Jensen et al., 2012).
2.5. Mass spectrometry
A MALDI‐TOF mass spectrometer (Bruker Daltonik, Rapiflex) was used in positive linear mode with an accelerating voltage of 20,000 V to obtain the mass profiles of released XyG oligosaccharides.
2.6. Purification of XyG oligosaccharide XUXG/XXUG
The XyG oligosaccharide XUXG/XXUG (m/z 1217) was isolated from leaf material of 3‐week‐old mur3.1 xlt2 + VcXBT transgenic plants. AIR material was digested with XEG and the released oligosaccharides reduced in 1 M ammonium hydroxide containing 10 mg/ml sodium borohydride (Schultink et al., 2013). The reaction was neutralized with acetic acid and desalted as described above. The reduced oligosaccharides were separated by hydrophilic chromatography (Vydac 238TP 5 μl column) on an HPLC system (Knaur, Azura P6.1 C and AS 6.1 L) using an evaporative light scattering detector (SEDEX‐LC LT‐ELSD, Sedere). Samples were subjected to the following gradient conditions: flow: .5 ml/ml; 6% aqueous MeOH to 6.88% MeOH in 40 min, 6.88% MeOH to 50% MeOH in 10 min, 50% MeOH to 6% MeOH in 5 min, followed by a 6% MeOH wash for 15 min. The oven temperature of the ELSD detector was 41°C utilizing N2 pressure of 3.1 to 3.3 bar. The content of collected fractions was monitored by MALDI‐TOF mass spectrometry, pooled, and freeze‐dried.
2.7. Glycosyl linkage analysis
Glycosidic linkage analysis of XyG oligosaccharides was performed by derivatizing the sample to their partially methylated alditol acetates followed by gas‐chromatography electron impact quadrupole mass spectrometry (GC–MS) as described (Liu et al., 2015; Schultink et al., 2013). The GC–MS system consisted of an Agilent 7890B GC System equipped with a 5977A MSD and an SP‐2380 Fused Silica Capillary Column (30 m × .25 mm i.d. × 20 μm film thickness; Supelco).
2.8. NMR analysis
Reduced oligosaccharides were dissolved in D2O (99.9%), freeze‐dried, and dissolved again in .4 ml of D2O (99.97%) containing .05% of 3‐(trimethylsilyl)‐propionic‐2,2,3,3‐d 4 acid sodium salt. The 1H NMR spectra were recorded on a Bruker Avance III 600 MHz NMR spectrometer at 298 K. All chemical shifts were referenced relative to 3‐(trimethylsilyl)‐propionic‐2,2,3,3‐d 4 acid (.00 ppm for 1H). The NMR data processing and analysis were performed using MestreLab's MestReNova software.
2.9. Subcellular localization
The subcellular localization was carried out as described (Jensen et al., 2012). The coding sequence of VcXBT was subcloned into vector pMDC83 (Curtis & Grossniklaus, 2003) containing an N‐terminal GFP tag. A rat sialyltransferase fused to red fluorescence protein (RnST‐RFP) was used as a Golgi marker. These plasmids were transformed into A. tumefaciens GV3101. Cultures containing the GFP‐protein fusions and the RFP Golgi marker were used for (co)infiltration of N. benthamiana leaves (Sparkes et al., 2006).
2.10. Protein structural analyses
Available protein models were obtained from the Alphafold2 database (Jumper et al., 2021). The following PDB IDs were used: AtMUR3 Q7XJ98, AtXLT2 F4K6F1, and AtXUT1 Q9SH31. For unavailable models, prediction of protein structures was performed using ColabFold (Mirdita et al., 2022). Tomato protein sequences (SlMUR3, SlXLT2, SlXST1, and SlXST2) were obtained from Schultink et al. (2013). Nasturtium protein sequences (TmMUR3 and TmXLT2) were obtained from Jensen et al. (2012). Rice protein sequences (OsMUR3 and OsXLT2) were obtained from Liu et al. (2015). Physcomitrella patens sequence (PpXDT) was obtained from Zhu et al. (2018). Exostosin domains in query proteins were identified using the Conserved Domain Database (Lu et al., 2020). Protein similarity was calculated using the Ident and Sim webtool (https://www.bioinformatics.org/sms2/ident_sim.html). Chimera and ChimeraX software were used to perform the superposition of predicted structures and obtain the structure images (Pettersen et al., 2004, 2021). Chimera structural protein alignments were created from structure superposition with a 5 Å residue–residue distance cut‐off, allowing for circular permutations and three iterations at most. Protein multiple alignments were analyzed with Jalview 2 (Waterhouse et al., 2009).
3. RESULTS
3.1. Identification of GT47 family members in blueberry ( V. corymbosum )
The β‐xylose containing XyG sidechain U has been identified in the fruits of bilberries (Vaccinium myrtillus L.), a member of the Ericaceae (Hilz et al., 2007). However, genomic sequence information is only available from another member of the Ericaceae, blueberry (V. corymbosum). To confirm the presence of the unusual U sidechain in XyG of blueberry, various tissues of a blueberry plant were collected and subjected to XyG oligosaccharide mass profiling (OLIMP) (Günl et al., 2011). In this procedure XyG oligosaccharides are released from cell wall material by treatment with a XyG‐specific endoglucanase and subjected to mass spectrometric analysis by MALDI‐TOF (Figure 2). Indeed, numerous XyG oligosaccharides could be identified that contained one or two additional pentoses on the regular XyG oligosaccharides found, for example, in Arabidopsis (Lerouxel et al., 2002). The nature of the additional pentose moieties cannot be deduced by mass spectrometry, and may represent α‐arabinofuranosyl or α‐arabinopyranosyl residues found in XyG of Solanaceous plants and mosses, respectively, but there is a possibility that they might include β‐xylosyl units. Interestingly, no such pentosylation beyond the XyG core structure was found in blueberry root tissue, highlighting again that the fine structure of XyG is tissue specific.
FIGURE 2.

XyG oligosaccharide mass profiling of different blueberry tissues. Suggested XyG oligosaccharide structures of selected ion signals are labeled according to the one‐letter code. Pen, pentose.
Blueberry may thus contain a XyG:β‐xylosyltransferase. It is expected that such an enzyme belongs to GT47 as such an enzyme has the same acceptor substrate and forms the same glycosidic linkage on the same position as the well‐characterized GT47 galactosyltransferases MUR3 and/or XLT2. Hence, the amino acid sequence of the Arabidopsis XyG‐related GT47 family member AtXLT2 was used as a bait to identify related GT candidates in the GDV (Figure S1). A large number of similar GT47 protein sequences were identified in the blueberry genome. Many of the blueberry proteins in the phylogenetic tree occur in clusters of four, reflecting the tetraploid nature of the sequenced blueberry, that is, they likely correspond to the four allele variants from the same gene. Nevertheless, a number of blueberry proteins are phylogenetically close to functionally characterized XLT2 XyG:galactosyltransferases (AtXLT2, TmXLT2, and OsXLT2) highlighted as an XLT2 clade; others are phylogenetically close to functionally characterized MUR3 XyG:galactosyltransferases (OsMUR3, SlMUR3, EgMUR3, AtMUR3, and TmMUR3) highlighted as a MUR3 clade (Figure S1). In between these two clades are blueberry homologs of many hitherto uncharacterized Arabidopsis GT47s, for example, GT12 and GT15, and the characterized XUT galacturonosyltransferase. In addition, there is a large cluster consisting only of blueberry GT47 sequences whose closest functionally characterized GT is XST1, a XyG:arabinofuranosyltransferase from tomato (Figure S1). Because arabinose and xylose are both pentoses, there is a possibility that this unique Vaccinium GT47 clade harbors the elusive XyG:β‐xylosyltransferase.
The expression levels of blueberry genes including GT47 genes have been determined in different plant tissues (Colle et al., 2019; Figure S2). Focusing on GT47s highly expressed in fruit tissue, we selected a few GT47 candidates for functional testing including one putative VcMUR3, two VcXLT2s (1 and 2), and four putative VcXBTs (1 to 4) present in the unique blueberry GT47 clade. Based on the known sequences in GDV, forward and reverse primers were designed, and the corresponding seven coding sequences were cloned from a genomic DNA preparation of blueberry fruits of V. corymbosum bluecrop cultivar resulting in a phylogenetic tree including the cloned blueberry bluecrop cultivar GT47 proteins and other functionally characterized GT47s (Figures 3 and S1).
FIGURE 3.

Phylogeny of XyG‐related GT47 proteins. Black font: protein sequences from known, functionally described GT47 XyG glycosyltransferases from various species. Purple font: blueberry proteins with similarity to the GT47 XyG glycosyltransferases proteins cloned from Vaccinium corymbosum bluecrop cultivar. The XLT2 and MUR3 clades are indicated in yellow and blue, respectively. The comprehensive phylogenetic tree is shown in Figure S1. The scale bar indicates the number of substitutions per site, branch lengths are directly related to the amount of genetic change between shown genes. At, Arabidopsis thaliana ; Os, Oryza sativa (rice); Tm, Tropaeolum majus (nasturtium); Sl, Solanum lycopersicum (tomato); Eg, Eucalyptus grandis (Eucalyptus).
3.2. Functional complementation in Arabidopsis
The impact of the selected blueberry GT47 enzymes on XyG structure was assessed by individual heterologous expression in the Arabidopsis double mutant mur3 xlt2, whose walls contain only the XyG core structure without additional substituents such as galactosyl moieties (Jensen et al., 2012). The XyG structure derived from the various complemented Arabidopsis plants was analyzed by OLIMP (Figures 4 and S3). The OLIMP profile of the untransformed Arabidopsis mur3.1 xlt2 double mutant walls show the occurrence of a single XyG oligosaccharide with a m/z 1085 Da indicative of the XyG oligosaccharide XXXG, thus representing the XyG core structure without any substituents. This OLIMP profile was retained when four of the blueberry genes were constitutively expressed in Arabidopsis mur3.1 xlt2 (Figure S3), suggesting that when expressed in Arabidopsis, these genes may not be involved in XyG biosynthesis. However, other possibilities of nonfunctionality include the absence, instability, and/or mislocalization of these expressed proteins.
FIGURE 4.

XyG oligosaccharide mass profiling (OLIMP) of blueberry GT47 complemented Arabidopsis lines. XyG oligosaccharide profiles derived from leaf tissue of Arabidopsis Col‐0, untransformed mur3 xlt2 mutant, and transgenic lines expressing VcXBT, VcXLT2_1, and VcMUR3 in the mur3 xlt2 genetic background. Suggested oligosaccharide structures of selected ions are indicated by the one‐letter code.
In contrast, expression of VcMUR3 and VcXLT2_1 in mur3 xlt2 resulted in a XyG that contained an oligosaccharide of m/z 1247, likely representing a galactosylated XyG oligosaccharide (Figure 4). To ascertain the nature of this substituent, the enzyme‐solubilized XyG oligosaccharide mixtures derived from the Arabidopsis wall materials were also subjected to high‐performance anion‐exchange chromatography with pulsed amperometric detection (HPAEC‐PAD) and their elution profile compared with that of a standard XyG oligosaccharide mixture (XXXG, XXLG, XLXG, and XLLG; Figure 5). Based on the retention times, expression of VcMUR3 lead not only to the occurrence of XXLG but also its fucosylated form XXFG, whose ion signal was also observed by OLIMP (Figure 4). Taken together, this provides strong evidence that VcMUR3 indeed represents a functional homolog of XyG:galactosyltransferase MUR3. In contrast, expression of VcXLT2_1 yielded a XyG‐containing XLXG and no fucosylated XyG oligosaccharides demonstrating that this enzyme exhibits XyG:galactosyltransferase XLT2 activity when expressed in Arabidopsis. Other observed peaks in mur3 xlt2 transformed with VcXLT2_1 or VCMUR3 (retention time of 23.3 and 25 min; Figure 5) could not be assigned to any XyG oligosaccharide.
FIGURE 5.

XyG oligosaccharide separation by HPAEC‐PAD. Standard XyG oligosaccharides, XyG oligosaccharides derived from leaf tissue of Col0, mur3 xlt2, and transgenic lines expressing VcXLT2_1 and VcMUR3 in mur3 xlt2 genetic background. Peaks were assigned according to Schultink et al. (2013) and Hsieh and Harris (2012) as well as based on mass spectrometry.
When one of the putative VcXBT genes was expressed in the mur3 xlt2 mutant and its wall analyzed by OLIMP, a new XyG oligosaccharide appeared with m/z 1217 representing XXXG with an additional pentose (Figure 5). When this oligosaccharide mixture was subjected to HPAEC several peaks became apparent, whose content was determined by mass spectrometry (Figure S4). The first peak at a retention time of XXXG contained an oligosaccharide with a mass of m/z 1085 confirming the presence of XXXG. The second peak also contained oligosaccharides with a m/z 1085. However, due to a different retention time than XXXG this oligosaccharide must be a structural isomer such as XXGG + 1 pentose. The third peak contained at least two oligosaccharides, one with a m/z 1085 representing another XXGG + 1 pentose, and one with m/z 1217 representing XXXG + 1 pentose. The fourth peak contained only oligosaccharide(s) with m/z 1217, thus representing another XXXG + 1 pentose. Hence, expression of VcXBT lead to the occurrence of several unusual pentosylated XyG oligosaccharides. All HPAEC fractions containing XyG oligosaccharide were pooled and subjected to a monosaccharide compositional analysis (Figure S4). The dominant monosaccharides were glucose and xylose with only trace amounts of arabinose and galactose (Figure S4). To further confirm the nature of this additional pentose, the enzymatically derived XyG oligosaccharide mixture from mur3 xlt2 plant expressing the VcXBT gene was subjected to hydrophilic chromatography (Figure S5). This type of chromatography avoids solvents such as salts that might interfere with additional analyses. One of the peaks with a retention time of around 27 min was collected and indeed contained carbohydrate(s) with a m/z 1217 indicative of XXXG + 1 pentose. The content of this fraction was subjected to glycosidic linkage analysis (Table 1 and Figure S6). In addition to the expected sugar moieties of 4‐Glcp, 6‐Glcp, and 4,6‐Glcp, representing a partially substituted glucan backbone, only T‐Xylp and 2‐Xylp representing sidechains were present. Particularly, the 2‐Xylp demonstrates that this XyG xylosyl sidechain had an additional substituent on its O‐2 position. This substituent is also xylose (T‐Xylp), because neither T‐Araf nor T‐Arap or any other pentosyl unit were observed in the sample.
TABLE 1.
Glycosidic linkage analysis of XyG oligosaccharide fraction with m/z 1217 from leaf walls of mur3 xlt2 expressing VcXBT (Figures S5 and S6).
| Sugar moiety | Abundance (%) |
|---|---|
| T‐Arap | Not detected |
| T‐Araf | Not detected |
| T‐Xylp | 9.5 |
| T‐Manp/T‐Glcp | 1.5 |
| 2‐Xylp | 9.4 |
| 6‐Glcp | 13.8 |
| 4‐Glcp | 4.0 |
| 4,6‐Glcp | 32.4 |
Abbreviations: 2‐Xylp, 2‐linked xylopyranose; 4,6‐Glcp, 4,6‐linked glucopyranose; 4‐Glcp, 4‐linked glucopyranose; 6‐Glcp, 6‐linked glucopyranose; T‐Araf, terminal arabinofuranose; T‐Arap, terminal arabinopyranose; T‐Xylp, terminal xylopyranose.
The collected fraction was also subjected to 1H NMR (Figure 6). The spectrum is consistent with the presence of XyG oligosaccharide alditols, as numerous anomeric signals are observed in the chemical shift region of previously characterized XyG oligosaccharides (Tuomivaara et al., 2015; York et al., 1993). There are several H‐1 signals belonging to α‐sugars in the region of δ 4.94–5.18 (J 1,2 3.2–3.6 Hz) and β‐sugars (δ 4.50–4.66 [J 1,2 7.8 Hz]). Based on the integral ratios of these signals, it is evident that this fraction contains a mixture of XyG oligosaccharides. Due to the same mass, these are apparent isomers likely representing XyG alditols with a single xylosyl substituent on different position of the three core xylosylated sidechains. Consistent with this hypothesis is the integral ratio of 1:2 of the H‐1 signal of a substituted α‐Xylp (δ 5.155 [J 1,2 3.6 Hz]) to unsubstituted, terminal α‐Xylp (δ 4.961–δ 4.949 [J 1,2 3.2–3.6 Hz]). Concerning the β‐sugars, the H‐1 signal δ 4.578 (J 1,2 7.8 Hz) was assigned to β‐Xylp consistent with published data concerning this sugar (Hilz et al., 2007; Ray et al., 2004). The other signals can be attributed to β‐Glcp units of the oligosaccharide backbone (δ 4.646 [J 1,2 7.9 Hz]; δ 4.551 [J 1,2 7.8 Hz]; δ 4.546 [J 1,2 7.2 Hz]). Taken together the mass spectrometrical data, monosaccharide compositional analysis, glycosidic linkage, and NMR data of this XyG oligosaccharide fraction are consistent with a XyG oligosaccharide containing a β‐Xylp‐(1‐>2)‐α‐Xylp sidechain—the “U” sidechain (Pauly & Keegstra, 2016). Based on the NMR analysis, this fraction contains a mixture of two isomers of such as XUXG and XXUG.
FIGURE 6.
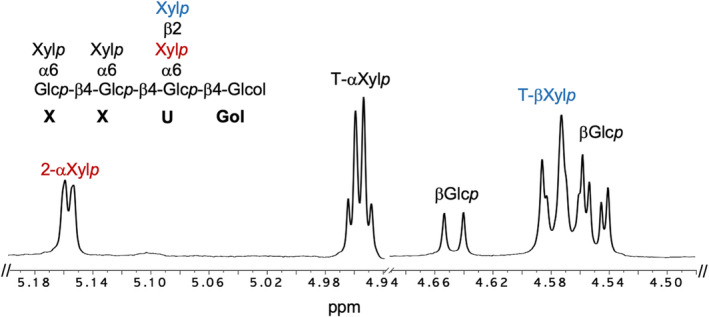
Anomeric region of the 1H NMR spectrum of the XyG oligosaccharide fraction (Figure S5A) obtained from leaf walls of mur3 xlt2 expressing VcXBT. The residues corresponding to each group of anomeric proton resonances are indicated at the top of the figure. The spectral region δ 4.67–4.92 containing the strong HDO signal has been deleted for clarity. The location of each of these residues in specific sidechains (X or U) is indicated. Xylp, xylopyranose; Glcp, glucopyranose; Gol, glucitol.
3.3. Growth phenotypes of mur3 xlt2 expressing functional blueberry GT47 genes
The structure of XyG has been shown to affect vegetative growth. The Arabidopsis double mutant mur3 xlt2 with XyG containing exclusively XXXG units exhibits dwarfism (Schultink et al., 2013; Liu et al., 2015; Zhu et al., 2018; Figure 7). When VcMUR3, VcXLT2_1, or VcXBT were expressed in mur3 xlt2 using a constitutive promotor, vegetative (stem) growth was restored to nearly normal heights in most of the transgenic lines (Figure 7).
FIGURE 7.

Plant height of complemented mur3 xlt2 plants expressing blueberry GT47s. (a) Height of inflorescence stems of 8‐week‐old Arabidopsis plants (Col‐0, n = 6; mur3 xlt2, n = 7; mur3 xlt2 + VcXBT, n = 25; mur3 xlt2 + VcMUR3, n = 16; mur3 xlt2 + VcXLT2, n = 14). Different letters indicate statistical differences (p < .05) based on an ANOVA analysis and subsequent Tukey's test. Error bars indicate standard deviation. (b) Representative pictures from the genotypes shown in (a). Scale indicates 10 cm.
3.4. VcXBT is localized to the Golgi apparatus
XyG biosynthesis occurs in the Golgi apparatus (Pauly & Keegstra, 2016) as all the known required biosynthetic enzymes have been shown to be localized there (Jensen et al., 2012). The cellular localization of VcXBT was tested by expressing a C‐terminal GFP‐tagged VcXBT transiently in tobacco leaves (Figure S7). Under the confocal microscope, a punctate pattern is visible. Comparison with a coexpressed RFP‐tagged Golgi marker (rat sialosyltransferase) indicated cellular colocalization demonstrating that VcXBT is indeed present in the Golgi apparatus.
3.5. Structural comparison of GT47 proteins
The enzymes involved in substituting the XyG core structure belong to the GT47 family. GT47 enzymes are characterized by the presence of an exostosin domain named after their similarity to the human exostosin‐1 (EXT1) GT required for the biosynthesis of heparan sulfate (Lind et al., 1998). The structure of the exostosin transferase domains from EXT1 and related EXT enzymes have been resolved (Leisico et al., 2022). These enzymes adopt a GT‐B fold characterized by a β/α/β sandwich structure where two Rossmann‐like domains of parallel β‐sheets flanked by α‐helices are connected by an interdomain cleft containing the active site (reviewed in Li et al., 2023). It is thus likely that the GT47 proteins from plants exhibit a similar fold structure, even though no enzyme‐substrate complexes have been experimentally characterized despite the abundant genetic and biochemical data available. The best known XyG GT47 enzymes are MUR3 and XLT2 with several homologs functionally characterized in different plant species (Jensen et al., 2012; Liu et al., 2015; Lopes et al., 2010; Madson et al., 2003; Schultink et al., 2013). In order to compare VcMUR3 and VcXLT2 to previously characterized XyG galactosyltransferases, predicted structures for these two blueberry proteins were obtained using Alphafold. Models for Arabidopsis and tomato are available in the Alphafold database, but not for the blueberry, nasturtium, or rice homologs, which we generated. As observed when comparing the amino acid sequences (Figure 3), VcMUR3 and VcXLT2 exhibit high structural similarity to other characterized MUR3 and XLT2 homologs, respectively (Figure 8 and Table S2). Although the overall sequence similarity is limited to around 55%, there is a high structural conservation between MUR3 and XLT2 exostosin domains from all of these species, expanding on what has been previously reported in the case of Arabidopsis and tomato proteins (Julian & Zabotina, 2022). Root‐mean‐square deviation (RMSD) is a measure of the average distance between the positions of the corresponding atoms in the two structures, taking into account both the magnitude and the direction of the differences. It is commonly used to quantify the similarity between two protein structures with the lower RMSD value indicating higher structural similarity in terms of overall shape and orientation. XyG galactosyltransferases show a high overall structural conservation as indicated by a low RMSD between their atomic coordinates (Table S2). Both sequence and structural conservations are particularly high among MUR3 members with values around 90% protein similarity and extremely low RMSD values (.3–.4 Å). In the case of XLT2 proteins, there seems to be less conservation with values ranging 65% to 80% sequence similarity and .7–1.4 Å RMSD. When comparing MUR3 and XLT2 proteins, the predicted structures align for the most part of the exostosin domain, and most of the structural divergence is localized in discrete regions present in the periphery of the GT‐B interdomain cleft (regions I to VI; Figure 8). The predicted Alphafold structure of the VcXBT GT47 enzyme shows a high similarity to these XyG galactosyltransferases, particularly regarding the exostosin domain. Similar to what has been observed in the case of the amino acid sequence (Figure 3) the VcXBT structure is closer to XLT2 than to MUR3 as demonstrated by smaller RMSD values (Table S3). While the average distance when comparing the structures of VcXBT1 and AtXLT2 is 1.02 Å, the RMSD values are below 1 when considering only 325 out of 337 structurally similar Cα atoms (RMSD pruned atom pairs). In a similar comparison with AtMUR3, the RMSD values increase to 1.77 and 1.27 Å, respectively (Table S3). This close structural relationship between VcXBT and XLT2 becomes more evident when observing the VcXBT structure in the MUR3‐XLT2 divergent regions (Figure 8b). In all six regions, MUR3‐ or XLT2‐specific structural patterns are observed. While MUR3 members show an almost identical overlapping architecture, XLT2s and VcXBT are more variable, presenting extra helices such as in regions I and VI or alternative loop structures (regions II–V). Overall, the VcXBT structure clearly aligns closer to XLT2 than to MUR3 models.
FIGURE 8.

Structural comparison of XyG GT47 glycosyltransferases. (a) Superimposed models of characterized MUR3 (blue) and XLT2 (yellow) exostosin domains from diverse plant species (AtMUR3, VcMUR3, OsMUR3, TmMUR3, AtXLT2, VcXLT2, OsXLT2, and TmXLT2). Red circles highlight six regions with high divergence among MUR3 and XLT2 structures. The residues of AtXLT2 included in those six regions were colored in red for reference. (b) Detailed overview of the six regions shown in (a). The predicted structure for VcXBT (pink) was superimposed to MUR3 (blue) and XLT2 (yellow) exostosin domains from diverse plant species. (c) Detailed overview of the structure of superimposed models of AtMUR3, VcMUR3, OsMUR3, TmMUR3, AtXLT2, VcXLT2, OsXLT2, TmXLT2, SlXST1, SlXST2, VcXBT1, AtXUT1, and PpXDT XyG glycosyltransferases. Regions VII and VIII together with two other selected residues forming a possible substrate binding pocket are highlighted in green. Residues corresponding to AtXLT2 are indicated for reference. (d) Sequence details of the two regions shown in (c) for all XyG transferases considered. The bold residues indicate GT‐specific patterns.
A close inspection of the MUR3‐XLT2 structure‐based sequence alignment identified multiple residues showing MUR3‐ and XLT2‐specific patterns (Figure S8). In total, 37 residues are differentially conserved between MUR3 and XLT2 exostosin domains. Twelve of them are located in the six previously identified structurally divergent regions (regions I–VI). For example, a serin residue in conserved among MUR3 proteins in region V, where residues AtMUR3S380, VcMUR3S361, TmMUR3S395, SlMUR3S386, and OsMUR3S373 align almost perfectly (Figures 8b and S8). In the corresponding structures of XLT2 proteins, an alternative architecture is predicted instead, where an aspartic acid residue—AtXLT2D339, VcXLT2D314, TmXLT2D335, and OsXLT2D301—is conserved in terms of structure and sequence. There are also 25 residues showing MUR3‐ and XLT2‐specific patterns in regions with a high degree of structural conservation indicated by low RMSD values. For example, a glutamine residue is found in AtMUR3Q427, VcMUR3Q408, TmMUR3Q442, and OsMUR3Q402 in the highly structurally conserved C‐terminal region of the exostosin domain (Figure S8). The corresponding residue in the overlapping XLT2 structures is an arginine instead—AtXLT2R396, VcXLT2R363, TmXLT2R382, and OsXLT2R348.
In order to explore the existence of candidate residues involved in the transfer of specific UDP‐sugar substrates to XyG oligosaccharide acceptors, we extended these structural comparisons to other GT47 GTs. Superimposition of XyG:GT47 Alphafold models shows a highly conserved structure of the exostosin domain despite the different UDP‐donor‐substrate specificity in these proteins, that is, MUR3 and XLT2—UDP‐Galp; XSTs—UDP‐Araf; XDT—UDP‐Arap; XBT—UDP‐Xylp; XUT1—UDP‐GalAp (Figure S9A,C and Table S4). Again, the highest structural divergence was concentrated in the same regions described in the XLT2‐MUR3 comparison (Figure S9A). Following the same rationale as in the MUR3‐XLT2 comparison, we searched for conserved residues showing specific patterns including the two characterized XST. A detailed inspection of the structural alignment revealed 18 residues showing substrate‐characteristic patterns (Figure S9C). Twelve of these were located in structurally conserved regions and six more had higher RMSD values indicative of a nonperfect match. We next mapped these residues to the multiple superimposition structure. Eight residues stood out in this analysis, as they are located in close proximity in the core of the exostosin domain, precisely in the GT‐B interdomain cleft where the active site is usually found in human EXTs (Figures 8c and S9B). Six of these residues were grouped in two discrete regions, that is, VII and VIII, and the sequence details are shown as an example in Figure 8d. These residues could show patterns consistent with the diverse substrate requirements of the XyG GT47 enzymes. For example, NQF … MLVVES (MUR3) might be responsible for transferring a galactosyl residue, whereas DMY … RLSVEK (XST) for an arabinofuranosyl residue.
4. DISCUSSION
4.1. Identification and functional characterization of a XBT from blueberry
The xylosyl residue of XyG is often substituted at the O‐2 position with a variety of glycosyl residues including hexose or pentose moieties, both in their pyranosyl or furanosyl form (Pauly & Keegstra, 2016). The availability of the blueberry genome (Colle et al., 2019) allowed us to identify a Golgi localized XBT. Expression of the VcXBT gene in the Arabidopsis double mutant mur3 xlt2 resulted in the synthesis of the XyG U sidechain as evidenced by detailed XyG analysis via OLIMP (Figure 4), HPAEC‐PAD (Figure S4), glycosidic linkage analysis (Table 1), and 1H NMR (Figure 6).
The expression of VcMUR3 or other MUR3 orthologs does not only lead to XyG galactosylation but also additional fucosylation and O‐acetylation of the galactose residue (Figures 4 and 5; Liu et al., 2015). This does not occur when VcXBT is expressed in Arabidopsis suggesting that either the third position of the XyG core structure is not further xylosylated or more likely the Arabidopsis XyG:fucosyltransferase (Vanzin et al., 2002) and XyG:O‐acetyltransferases AtAXY4/AtAXY4L (Gille & Pauly, 2012) do not recognize the U sidechain as an acceptor substrate.
4.2. XyG sidechains impact plant growth
The Arabidopsis mutant mur3 contains a point mutation in the AtMUR3 gene that renders it inactive (Madson et al., 2003). As a result, XyG in this mutant does not contain the XXLG oligosaccharide but retains the galactosylated XLXG motif. Mur3 mutant plants show normal plant growth behavior except for minor effects in trichome morphology (Madson et al., 2003). However, the Arabidopsis mur3 xlt2 double mutant, whose XyG are not galactosylated and only contain the XyG core structure display a dwarfed plant phenotype (Kong et al., 2015; Figure 7). It has been previously shown that structurally aberrant XyG structures such as the unsubstituted XyG core structure impacts the endomembrane morphology likely through XyG self‐aggregation (Kong et al., 2015). In contrast, a complete lack of XyG does not affect plant growth (Cavalier et al., 2008; Kim et al., 2020; Kong et al., 2015). Nevertheless, the observed mur3 xlt2 double mutant growth defect can be rescued by complementation with various XyG GT47 including the expression of various MUR3 and XLT2 genes from a variety of species including rice (OsXLT2; Liu et al., 2015), the moss Physcomitrella (PpXLT2), tomato (SlXLT2; Schultink et al., 2013), and as shown here blueberry (VcXLT2; Figure 7). In addition, arabinofuranosylation through expression of SlXST (Schultink et al., 2013), arabinopyranosylation through expression of PpXDT (Zhu et al., 2018), and xylosylation restore the growth phenotype of the double mutant mur3 xlt2 (Figure 7). This indicates that XyG galactosylation can be functionally replaced by other sugar substituents—which type of substituent does not seem to matter at least under the plant growth conditions used here.
4.3. Insights into XyG:GT47 regioselectivity
It has been shown that MUR3 adds a galactosyl residue specifically only to the third core xylosyl residue of the XyG oligosaccharide resulting in XXLG, whereas XLT2 adds the residue to the second xylosyl residue generating XLXG (Figure 1). Protein structural analyses show that despite a 55% sequence similarity, MUR3 and XLT2 proteins show a remarkably high degree of structural similarity for the most part of the transferase domain. The structural differences are concentrated in discrete regions near the cleft between the two Rossmann‐like domains. Some of these residues might thus be determinants for the different regiospecificity of XLT2 and MUR3 XyG:galactosyltransferases. The VcXBT XyG:xylosyltransferase protein exhibits a higher degree of both structural and sequence similarity to XLT2 proteins. However, when VcXBT is expressed in the Arabidopsis mur3 xlt2 mutant multiple XyG oligosaccharide isomers are observed that contain additional pentosyl units. XBT could potentially transfer other pentoses, such as arabinopyranoses or arabinofuranoses and thus act as an XST (Schultink et al., 2013) or XDT (Zhu et al., 2018). However, based on our results, a more likely scenario is that XBT is able to add the xylopyranose to different positions on XyG core structure resulting not only in the XUXG oligosaccharide but also XXUG, as both have a m/z 1217 (Figures S4 and S5 and Table 1). Although the position of these additional xylosyl residues remain to be determined, it seems clear that XBT is more promiscuous than the regioselective MUR3/XLT2. There is a high structural conservation among XyG:GT47 proteins despite the variability of UDP‐sugar donor substrates they can utilize and the XyG structure they produce. Our structural comparison identified several residues, which could represent determinants of the wide diversity of substrate specificities found among XyG GT47 enzymes. Some of these residues seem to be located in the interdomain cleft, the region where the active site is present in most GT‐B fold proteins in general and exostosin‐containing enzymes in particular. Based on this observation, we speculate that these residues might be involved in the binding of specific donor substrates and/or transfer to specific positions in the core XyG structure. Unfortunately, except for MUR3 and XLT2, the dataset is quite limited, and hence, the identification of additional functionally characterized enzymes together with the structural determination of the corresponding enzyme‐substrate complexes will be required to establish or dismiss such sequence determinants and decipher the XyG:GT47 substrate specificity code.
AUTHOR CONTRIBUTIONS
All authors contributed to the study conception and design. Ronja Immelmann, Vicente Ramírez, and Markus Pauly equally contributed to the article regarding original draft preparation. Niklas Gawenda, Ronja Immelmann, and Vicente Ramírez carried out the described experiments. All authors commented on previous versions of the manuscript. All authors read and approved the final manuscript.
CONFLICT OF INTEREST STATEMENT
The authors declare that they have no known competing financial interests or personal relationships that could have appeared to influence the work reported in this paper.
PEER REVIEW
The peer review history for this article is available in the Supporting Information for this article.
Supporting information
Figure S1. Phylogeny of XyG‐related GT47 proteins. Protein sequences from known XyG galactosyltransferases (AtMUR3, OsMUR3, TmMUR3, SlMUR3, EgMUR3, AtXLT2, OsXLT2 and TmXLT2), galacturonosyltransferase (AtXUT) and other Arabidopsis glycosyltransferases. The XLT2 and MUR3 clades are indicated in yellow and blue color, respectively. Blueberry proteins with similarity to XyG GT47 glycosyltransferases proteins obtained from a BlastP search against Genome Database for Vaccinium (GDV; VaccDscaff‐Genes) and additionally cloned candidate gene from blueberry ( Vaccinium corymbosum bluecrop cultivar). The naming of the GDV blueberry proteins was kept consistent with the results of the BastP search. The scale bar indicates the number of substitutions per site, branch lengths are directly related to the amount of genetic change between genes. At – Arabidopsis thaliana , Os – Oryza sativa (rice), Tm ‐ Tropaeolum majus (nasturtium), Sl – Solanum lycopersicum (tomato), Eg ‐ Eucalyptus grandis (Eucalyptus).
Figure S2. Expression heatmap of blueberry GT47 glycosyltransferase candidates in different tissues based on “ V. corymbosum cv. Draper Expression in Tissue during Fruit Development, FPKM” from GDV; FPKM = fragments per kilobase of transcript per million fragments mapped) using heatmapper.ca. The order of the genes in the heatmap corresponds to the order presented in the phylogenetic tree in Figure S1. The Row Z‐Score is an expression level scaling method that helps enhance clusters of genes with similar trends in expression between samples. Z‐scores are computed on a gene‐by‐gene (row‐by‐row) basis by subtracting the mean and then dividing by the standard deviation. Dots represent genes whose sequence was used to design primers (Table S1) for cloning the corresponding genes from berries of the V. corymbosum bluecrop.
Figure S3. Supporting Information.
Figure S4. XyG oligosaccharide analysis A. XyG oligosaccharide separation by HPAEC‐PAD. XyG oligosaccharides derived from etiolated hypocotyls of mur3 xlt2 expressing VcXBT. B. XyG oligosaccharide mass profiling (OLIMP) of collected peak fractions indicated by lines in (A). C. Monosaccharide composition analysis of XyG oligosaccharides in fractions from (A).
Figure S5. XyG oligosaccharide enrichment A. Hydrophilic chromatography of enzymatically released XyG oligosaccharides of leaf tissue of Arabidopsis mur3 xlt2 expressing VcXBT. A fraction corresponding to min 25,5‐28 (see bar) was collected for further analysis. B. Mass spectrometrical analysis of the content of the fraction collected in (A).
Figure S6. Gas chromatogram of partially methylated acetylated alditols of a XyG oligosaccharide fraction derived from leaf walls of mur3 xlt2 expressing VcXBT (Figure S5A). The presence or absence of a derivative was assessed by mass spectrometrical analysis of its fragments compared to standards. The abundance of non‐carbohydrate peaks is 29,5%. T‐Arap: terminal arabinopyranose, T‐Araf: terminal arabinofuranose, T‐Xylp: terminal xylopyranose, T‐Manp: terminal mannopyranose, T‐Glcp: terminal glucopyranose, 2‐Xylp: 2‐linked xylopyranose, 6‐Glcp: 6‐linked glucopyranose, 4‐Glcp: 4‐linked glucopyranose, 4,6‐Glcp: 4,6‐linked glucopyranose.
Figure S7. Subcellular localization of VcXBT in Nicotiana benthamiana epidermal cells by confocal laser scanning microscopy. GFP signal from the VcXBT‐GFP protein is shown in green. The RFP signal from the Golgi marker RnST‐RFP used as a control is shown in magenta. White bar corresponds to 20 μm.
Figure S8. Structural and sequence comparison of XyG galactosyltransferases. Structure‐based sequence alignment of MUR3 and XLT2 exostosin domains. Dashed lines indicate missing residues in the alignment. Residues are colored according to their conservation among all sequences. The consensus sequence and the corresponding histogram are shown at the bottom of the alignment as a measure of sequence conservation. RMSD is shown as grey histogram bar heights above the sequences as a measure of the structural conservation. Red boxes frame six regions with high RMSD values. Asterisks indicate residues showing MUR3‐ and XLT2‐specific sequence patterns in positions structurally conserved (black) or divergent (red).
Figure S9. Structural comparison of GT47 XyG glycosyltransferases. A. Superimposed predicted structures of AtMUR3, VcMUR3, OsMUR3, TmMUR3, AtXLT2, VcXLT2, OsXLT2, TmXLT2, SlXST1, SlXST2, VcXBT1, AtXUT1 and PpXDT exostosin domains colored by RMSD. Dark blue for low RMSD, white for medium RMSD, and red for high RMSD. B. Superimposed predicted structures colored in white. Highlighted in green are regions VII and VIII together with selected residues showing GT‐specific patters in close proximity. A detail of this structural superimposition is shown in Figure 8C. C. Structure‐based sequence alignment of the structures shown in A and B. Dashed lines indicate missing residues in the alignment. Residues are colored according to their conservation among all sequences. The regions/residues shown in B are highlighted in green. The consensus sequence and the corresponding conservation histogram is shown at the bottom of the alignment. RMSD are shown above the sequences as grey histogram bar heights representing the spatial variation among residues. Red boxes frame three regions showing different sequence patterns associated to differential XyG glycosyl transferase specificity. Asterisks indicate residues showing MUR3‐, XLT2 and XST‐specific sequence patterns in positions structurally conserved (black) or divergent (red).
Table S1. Primer sequences used in the study. Capitalized (non bold print) are gene specific sequences. Introduced sites for restriction enzymes (RE) are marked in capitalized and bold print. BPs from end of DNA required for complete digestion are written in lower case.
Table S2. Pairwise comparison between MUR3 and XLT2 XyG galactosyltransferases. Root‐mean‐square deviation (RMSD) score representing the spatial variation among all Cα atom pairs in angstroms (Å) and protein sequence similarity (%) are shown. RMSD values gives the average distance between the superimposed atoms of two models. The smaller the value, the more similar the two predicted structures.
Table S3. Sequence and structural pairwise comparison of VcXBT1 with MUR3 and XLT2. Root‐mean‐square deviation (RMSD) score representing the spatial variation among all Cα atom pairs in angstroms (Å). The RMSD value calculated after iterating a set of conserved pairs of Cα atoms is also represented as “RMSD (pruned atom pairs).” The number of Cα atoms (n) corresponding to each RMSD value is also shown. The structural alignment score using the ChimeraX software for each pairwise superposition is indicated in the last column. The higher the value, the better two structures superimpose.
Table S4. Structural alignment values for the superposition of AtXLT2 and AtMUR3, VcMUR3, OsMUR3, TmMUR3, AtXLT2, VcXLT2, OsXLT2, TmXLT2, SlXST1, SlXST2, VcXBT1, AtXUT1 and PpXDT exostosin domains. n: number of atoms; Å: angstroms. The RMSD value calculated after iterating a set of conserved pairs of Cα atoms is also represented as “RMSD (pruned atom pairs).” The number of Cα atoms (n) corresponding to each RMSD value is also shown. The structural alignment score using the ChimeraX software for each pairwise superposition is indicated in the last column. The higher the value, the better the two structures superimpose.
Data S1. Peer review.
ACKNOWLEDGMENTS
We would like to thank Katharina Grosche for excellent technical assistance. Thanks to the CeMSA@HHU (Center for Molecular and Structural Analytics @ Heinrich Heine University) for recording the NMR‐spectroscopic data. We would like to acknowledge the Center for Advanced Imaging (CAi) at Heinrich Heine University Düsseldorf for providing access to the Olympus FV3000 Confocal Laserscanning (DFG‐INST 1358/44‐1 FUGB) and especially Dr. Sebastian Hänsch for support during image acquisition. Ronja Immelmann was partially funded by the Deutsche Forschungsgemeinschaft (DFG, German Research Foundation)—Project ID 458090666/CRC1535/1. Additional funding was provided by DFG (German Research Foundation) under Germany's Excellence Strategy—EXC 2048/1—Project ID 390686111 to Markus Pauly. Open Access funding enabled and organized by Projekt DEAL.
Immelmann, R. , Gawenda, N. , Ramírez, V. , & Pauly, M. (2023). Identification of a xyloglucan beta‐xylopyranosyltransferase from Vaccinium corymbosum . Plant Direct, 7(7), e514. 10.1002/pld3.514
DATA AVAILABILITY STATEMENT
The data that support the findings of this study are available on request from the corresponding author, M.P.
REFERENCES
- Altschul, S. F. , Gish, W. , Miller, W. , Myers, E. W. , & Lipman, D. J. (1990). Basic local alignment search tool. Journal of Molecular Biology, 215(3), 403–410. 10.1016/S0022-2836(05)80360-2 [DOI] [PubMed] [Google Scholar]
- Camacho, C. , Coulouris, G. , Avagyan, V. , Ma, N. , Papadopoulos, J. , Bealer, K. , & Madden, T. L. (2009). BLAST+: Architecture and applications. BMC Bioinformatics, 10, 421. 10.1186/1471-2105-10-421 [DOI] [PMC free article] [PubMed] [Google Scholar]
- Cavalier, D. M. , Lerouxel, O. , Neumetzler, L. , Yamauchi, K. , Reinecke, A. , Freshour, G. , Zabotina, O. A. , Hahn, M. G. , Burgert, I. , Pauly, M. , Raikhel, N. V. , & Keegstra, K. (2008). Disrupting two Arabidopsis thaliana xylosyltransferase genes results in plants deficient in xyloglucan, a major primary cell wall component. The Plant Cell, 20(6), 1519–1537. 10.1105/tpc.108.059873 [DOI] [PMC free article] [PubMed] [Google Scholar]
- Clough, S. J. , & Bent, A. F. (1998). Floral dip: A simplified method for Agrobacterium‐mediated transformation of Arabidopsis thaliana . The Plant Journal for Cell and Molecular Biology, 16(6), 735–743. 10.1046/j.1365-313x.1998.00343.x [DOI] [PubMed] [Google Scholar]
- Colle, M. , Leisner, C. P. , Wai, C. M. , Ou, S. , Bird, K. A. , Wang, J. , Wisecaver, J. H. , Yocca, A. E. , Alger, E. I. , Tang, H. , Xiong, Z. , Callow, P. , Ben‐Zvi, G. , Brodt, A. , Baruch, K. , Swale, T. , Shiue, L. , Song, G. , Childs, K. L. , … Edger, P. P. (2019). Haplotype‐phased genome and evolution of phytonutrient pathways of tetraploid blueberry. Gigascience, 8(3), giz012. 10.1093/gigascience/giz012 [DOI] [PMC free article] [PubMed] [Google Scholar]
- Cosgrove, D. J. (2022). Building an extensible cell wall. Plant Physiology, 189(3), 1246–1277. 10.1093/plphys/kiac184 [DOI] [PMC free article] [PubMed] [Google Scholar]
- Coutinho, P. M. , Deleury, E. , Davies, G. J. , & Henrissat, B. (2003). An evolving hierarchical family classification for glycosyltransferases. Journal of Molecular Biology, 328(2), 307–317. 10.1016/S0022-2836(03)00307-3 [DOI] [PubMed] [Google Scholar]
- Coutu, C. , Brandle, J. , Brown, D. , Brown, K. , Miki, B. , Simmonds, J. , & Hegedus, D. D. (2007). pORE: A modular binary vector series suited for both monocot and dicot plant transformation. Transgenic Research, 16(6), 771–781. 10.1007/s11248-007-9066-2 [DOI] [PubMed] [Google Scholar]
- Curtis, M. D. , & Grossniklaus, U. (2003). A gateway cloning vector set for high‐throughput functional analysis of genes in planta. Plant Physiology, 133(2), 462–469. 10.1104/pp.103.027979 [DOI] [PMC free article] [PubMed] [Google Scholar]
- Dardelle, F. , Le Mauff, F. , Lehner, A. , Loutelier‐Bourhis, C. , Bardor, M. , Rihouey, C. , Causse, M. , Lerouge, P. , Driouich, A. , & Mollet, J.‐C. (2015). Pollen tube cell walls of wild and domesticated tomatoes contain arabinosylated and fucosylated xyloglucan. Annals of Botany, 115(1), 55–66. 10.1093/aob/mcu218 [DOI] [PMC free article] [PubMed] [Google Scholar]
- Dereeper, A. , Guignon, V. , Blanc, G. , Audic, S. , Buffet, S. , Chevenet, F. , Dufayard, J.‐F. , Guindon, S. , Lefort, V. , Lescot, M. , Claverie, J.‐M. , & Gascuel, O. (2008). Phylogeny.fr: Robust phylogenetic analysis for the non‐specialist. Nucleic Acids Research, 36(suppl_2), W465–W469. 10.1093/nar/gkn180 [DOI] [PMC free article] [PubMed] [Google Scholar]
- Edgar, R. C. (2004). MUSCLE: Multiple sequence alignment with high accuracy and high throughput. Nucleic Acids Research, 32(5), 1792–1797. 10.1093/nar/gkh340 [DOI] [PMC free article] [PubMed] [Google Scholar]
- Fry, S. C. , Aldington, S. , Hetherington, P. R. , & Aitken, J. (1993). Oligosaccharides as signals and substrates in the plant cell wall. Plant Physiology, 103(1), 1–5. 10.1104/pp.103.1.1 [DOI] [PMC free article] [PubMed] [Google Scholar]
- Gille, S. , & Pauly, M. (2012). O‐acetylation of plant cell wall polysaccharides. Frontiers in Plant Science, 3, 12. 10.3389/fpls.2012.00012 [DOI] [PMC free article] [PubMed] [Google Scholar]
- Günl, M. , Kraemer, F. , & Pauly, M. (2011). Oligosaccharide mass profiling (OLIMP) of cell wall polysaccharides by MALDI‐TOF/MS. Methods in Molecular Biology, 715, 43–54. 10.1007/978-1-61779-008-9_3 [DOI] [PubMed] [Google Scholar]
- Hilz, H. , de Jong, L. E. , Kabel, M. A. , Verhoef, R. , Schols, H. A. , & Voragen, A. G. J. (2007). Bilberry xyloglucan—Novel building blocks containing β‐xylose within a complex structure. Carbohydrate Research, 342(2), 170–181. 10.1016/j.carres.2006.12.005 [DOI] [PubMed] [Google Scholar]
- Hsieh, Y. S. Y. , & Harris, P. J. (2009). Xyloglucans of monocotyledons have diverse structures. Molecular Plant, 2(5), 943–965. 10.1093/mp/ssp061 [DOI] [PubMed] [Google Scholar]
- Hsieh, Y. S. , & Harris, P. J. (2012). Structures of xyloglucans in primary cell walls of gymnosperms, monilophytes (ferns sensu lato) and lycophytes. Phytochemistry, 79, 87–101. 10.1016/j.phytochem.2012.03.008 [DOI] [PubMed] [Google Scholar]
- Jensen, J. K. , Schultink, A. , Keegstra, K. , Wilkerson, C. G. , & Pauly, M. (2012). RNA‐Seq analysis of developing nasturtium seeds (Tropaeolum majus): Identification and characterization of an additional galactosyltransferase involved in xyloglucan biosynthesis. Molecular Plant, 5(5), 984–992. 10.1093/mp/sss032 [DOI] [PMC free article] [PubMed] [Google Scholar]
- Jia, Z. , Cash, M. , Darvill, A. G. , & York, W. S. (2005). NMR characterization of endogenously O‐acetylated oligosaccharides isolated from tomato (Lycopersicon esculentum) xyloglucan. Carbohydrate Research, 340(11), 1818–1825. 10.1016/j.carres.2005.04.015 [DOI] [PubMed] [Google Scholar]
- Julian, J. D. , & Zabotina, O. A. (2022). Xyloglucan biosynthesis: From genes to proteins and their functions. Frontiers in Plant Science, 13, 920494. 10.3389/fpls.2022.920494 [DOI] [PMC free article] [PubMed] [Google Scholar]
- Jumper, J. , Evans, R. , Pritzel, A. , Green, T. , Figurnov, M. , Ronneberger, O. , Tunyasuvunakool, K. , Bates, R. , Žídek, A. , Potapenko, A. , Bridgland, A. , Meyer, C. , Kohl, S. A. A. , Ballard, A. J. , Cowie, A. , Romera‐Paredes, B. , Nikolov, S. , Jain, R. , Adler, J. , … Hassabis, D. (2021). Highly accurate protein structure prediction with AlphaFold. Nature, 596(7873), 583–589. 10.1038/s41586-021-03819-2 [DOI] [PMC free article] [PubMed] [Google Scholar]
- Kim, S.‐J. , Chandrasekar, B. , Rea, A. C. , Danhof, L. , Zemelis‐Durfee, S. , Thrower, N. , Shepard, Z. S. , Pauly, M. , Brandizzi, F. , & Keegstra, K. (2020). The synthesis of xyloglucan, an abundant plant cell wall polysaccharide, requires CSLC function. Proceedings of the National Academy of Sciences of the United States of America, 117(33), 20316–20324. 10.1073/pnas.2007245117 [DOI] [PMC free article] [PubMed] [Google Scholar]
- Kong, Y. , Peña, M. J. , Renna, L. , Avci, U. , Pattathil, S. , Tuomivaara, S. T. , Li, X. , Reiter, W. D. , Brandizzi, F. , Hahn, M. G. , Darvill, A. G. , York, W. S. , & O'Neill, M. A. (2015). Galactose‐depleted xyloglucan is dysfunctional and leads to dwarfism in Arabidopsis. Plant Physiology, 167(4), 1296–1306. 10.1104/pp.114.255943 [DOI] [PMC free article] [PubMed] [Google Scholar]
- Lampugnani, E. R. , Moller, I. E. , Cassin, A. , Jones, D. F. , Koh, P. L. , Ratnayake, S. , Beahan, C. T. , Wilson, S. M. , Bacic, A. , & Newbigin, E. (2013). In vitro grown pollen tubes of Nicotiana alata actively synthesise a fucosylated xyloglucan. PLoS ONE, 8(10), e77140. 10.1371/journal.pone.0077140 [DOI] [PMC free article] [PubMed] [Google Scholar]
- Leisico, F. , Omeiri, J. , Le Narvor, C. , Beaudouin, J. , Hons, M. , Fenel, D. , Schoehn, G. , Couté, Y. , Bonnaffé, D. , Sadir, R. , Lortat‐Jacob, H. , & Wild, R. (2022). Structure of the human heparan sulfate polymerase complex EXT1‐EXT2. Nature Communications, 13(1), 7110. 10.1038/s41467-022-34882-6 [DOI] [PMC free article] [PubMed] [Google Scholar]
- Lemoine, F. , Correia, D. , Lefort, V. , Doppelt‐Azeroual, O. , Mareuil, F. , Cohen‐Boulakia, S. , & Gascuel, O. (2019). NGPhylogeny.fr: New generation phylogenetic services for non‐specialists. Nucleic Acids Research, 47(W1), W260–W265. 10.1093/nar/gkz303 [DOI] [PMC free article] [PubMed] [Google Scholar]
- Lerouxel, O. , Choo, T. S. , Séveno, M. , Usadel, B. , Faye, L. , Lerouge, P. , & Pauly, M. (2002). Rapid structural phenotyping of plant cell wall mutants by enzymatic oligosaccharide fingerprinting. Plant Physiology, 130(4), 1754–1763. 10.1104/pp.011965 [DOI] [PMC free article] [PubMed] [Google Scholar]
- Li, H. , Chapla, D. , Amos, R. A. , Ramiah, A. , Moremen, K. W. , & Li, H. (2023). Structural basis for heparan sulfate co‐polymerase action by the EXT1‐2 complex. Nature Chemical Biology, 19(5), 565–574. [DOI] [PMC free article] [PubMed] [Google Scholar]
- Lind, T. , Tufaro, F. , McCormick, C. , Lindahl, U. , & Lidholt, K. (1998). The putative tumor suppressors EXT1 and EXT2 are glycosyltransferases required for the biosynthesis of heparan sulfate. The Journal of Biological Chemistry, 273(41), 26265–26268. 10.1074/jbc.273.41.26265 [DOI] [PubMed] [Google Scholar]
- Liu, L. , Paulitz, J. , & Pauly, M. (2015). The presence of fucogalactoxyloglucan and its synthesis in rice indicates conserved functional importance in plants. Plant Physiology, 168(2), 549–560. 10.1104/pp.15.00441 [DOI] [PMC free article] [PubMed] [Google Scholar]
- Lopes, F. J. F. , Pauly, M. , Brommonshenkel, S. H. , Lau, E. Y. , Diola, V. , Passos, J. L. , & Loureiro, M. E. (2010). The EgMUR3 xyloglucan galactosyltransferase from Eucalyptus grandis complements the mur3 cell wall phenotype in Arabidopsis thaliana . Tree Genetics & Genomes, 6(5), 745–756. 10.1007/s11295-010-0288-8 [DOI] [Google Scholar]
- Lu, S. , Wang, J. , Chitsaz, F. , Derbyshire, M. K. , Geer, R. C. , Gonzales, N. R. , Gwadz, M. , Hurwitz, D. I. , Marchler, G. H. , Song, J. S. , Thanki, N. , Yamashita, R. A. , Yang, M. , Zhang, D. , Zheng, C. , Lanczycki, C. J. , & Marchler‐Bauer, A. (2020). CDD/SPARCLE: The conserved domain database in 2020. Nucleic Acids Research, 48(D1), D265–D268. 10.1093/nar/gkz991 [DOI] [PMC free article] [PubMed] [Google Scholar]
- Madson, M. , Dunand, C. , Li, X. , Verma, R. , Vanzin, G. F. , Caplan, J. , Shoue, D. A. , Carpita, N. C. , & Reiter, W.‐D. (2003). The MUR3 gene of Arabidopsis encodes a xyloglucan galactosyltransferase that is evolutionarily related to animal exostosins. The Plant Cell, 15(7), 1662–1670. 10.1105/tpc.009837 [DOI] [PMC free article] [PubMed] [Google Scholar]
- Mikkelsen, M. D. , Harholt, J. , Westereng, B. , Domozych, D. , Fry, S. C. , Johansen, I. E. , Fangel, J. U. , Łężyk, M. , Feng, T. , Nancke, L. , Mikkelsen, J. D. , Willats, W. G. T. , & Ulvskov, P. (2021). Ancient origin of fucosylated xyloglucan in charophycean green algae. Communications Biology, 4(1), 754. 10.1038/s42003-021-02277-w [DOI] [PMC free article] [PubMed] [Google Scholar]
- Mirdita, M. , Schütze, K. , Moriwaki, Y. , Heo, L. , Ovchinnikov, S. , & Steinegger, M. (2022). ColabFold: Making protein folding accessible to all. Nature Methods, 19(6), 679–682. 10.1038/s41592-022-01488-1 [DOI] [PMC free article] [PubMed] [Google Scholar]
- Park, Y. B. , & Cosgrove, D. J. (2015). Xyloglucan and its interactions with other components of the growing cell wall. Plant & Cell Physiology, 56(2), 180–194. 10.1093/pcp/pcu204 [DOI] [PubMed] [Google Scholar]
- Pauly, M. , & Keegstra, K. (2016). Biosynthesis of the plant cell wall matrix polysaccharide xyloglucan. Annual Review of Plant Biology, 67, 235–259. 10.1146/annurev-arplant-043015-112222 [DOI] [PubMed] [Google Scholar]
- Pauly, M. , Andersen, L. N. , Kauppinen, S. , Kofod, L. V. , York, W. S. , Albersheim, P. , & Darvill, A. (1999). A xyloglucan‐specific endo‐β‐1,4‐glucanase from Aspergillus aculeatus: Expression cloning in yeast, purification and characterization of the recombinant enzyme. Glycobiology, 9(1), 93–100. 10.1093/glycob/9.1.93 [DOI] [PubMed] [Google Scholar]
- Pauly, M. , Gille, S. , Liu, L. , Mansoori, N. , de Souza, A. , Schultink, A. , & Xiong, G. (2013). Hemicellulose biosynthesis. Planta, 238(4), 627–642. 10.1007/s00425-013-1921-1 [DOI] [PubMed] [Google Scholar]
- Pettersen, E. F. , Goddard, T. D. , Huang, C. C. , Couch, G. S. , Greenblatt, D. M. , Meng, E. C. , & Ferrin, T. E. (2004). UCSF Chimera—A visualization system for exploratory research and analysis. Journal of Computational Chemistry, 25(13), 1605–1612. 10.1002/jcc.20084 [DOI] [PubMed] [Google Scholar]
- Pettersen, E. F. , Goddard, T. D. , Huang, C. C. , Meng, E. C. , Couch, G. S. , Croll, T. I. , Morris, J. H. , & Ferrin, T. E. (2021). UCSF ChimeraX: Structure visualization for researchers, educators, and developers. Protein Science: A Publication of the Protein Society, 30(1), 70–82. 10.1002/pro.3943 [DOI] [PMC free article] [PubMed] [Google Scholar]
- Peña, M. J. , Darvill, A. G. , Eberhard, S. , York, W. S. , & O'Neill, M. A. (2008). Moss and liverwort xyloglucans contain galacturonic acid and are structurally distinct from the xyloglucans synthesized by hornworts and vascular plants. Glycobiology, 18(11), 891–904. 10.1093/glycob/cwn078 [DOI] [PubMed] [Google Scholar]
- Peña, M. J. , Kong, Y. , York, W. S. , & O'Neill, M. A. (2012). A galacturonic acid‐containing xyloglucan is involved in Arabidopsis root hair tip growth. The Plant Cell, 24(11), 4511–4524. 10.1105/tpc.112.103390 [DOI] [PMC free article] [PubMed] [Google Scholar]
- Ray, B. , Loutelier‐Bourhis, C. , Lange, C. , Condamine, E. , Driouich, A. , & Lerouge, P. (2004). Structural investigation of hemicellulosic polysaccharides from Argania spinosa: Characterisation of a novel xyloglucan motif. Carbohydrate Research, 339(2), 201–208. 10.1016/j.carres.2003.10.011 [DOI] [PubMed] [Google Scholar]
- Scheller, H. V. , & Ulvskov, P. (2010). Hemicelluloses. Annual Review of Plant Biology, 61, 263–289. 10.1146/annurev-arplant-042809-112315 [DOI] [PubMed] [Google Scholar]
- Schultink, A. , Cheng, K. , Park, Y. B. , Cosgrove, D. J. , & Pauly, M. (2013). The identification of two arabinosyltransferases from tomato reveals functional equivalency of xyloglucan side chain substituents. Plant Physiology, 163(1), 86–94. 10.1104/pp.113.221788 [DOI] [PMC free article] [PubMed] [Google Scholar]
- Schultink, A. , Liu, L. , Zhu, L. , & Pauly, M. (2014). Structural diversity and function of xyloglucan sidechain substituents. Plants (Basel, Switzerland), 3(4), 526–542. 10.3390/plants3040526 [DOI] [PMC free article] [PubMed] [Google Scholar]
- Sparkes, I. A. , Runions, J. , Kearns, A. , & Hawes, C. (2006). Rapid, transient expression of fluorescent fusion proteins in tobacco plants and generation of stably transformed plants. Nature Protocols, 1(4), 2019–2025. 10.1038/nprot.2006.286 [DOI] [PubMed] [Google Scholar]
- Talbott, L. D. , & Ray, P. M. (1992). Molecular size and separability features of pea cell wall polysaccharides implications for models of primary wall structure. Plant Physiology, 98(1), 357–368. 10.1104/pp.98.1.357 [DOI] [PMC free article] [PubMed] [Google Scholar]
- Thompson, D. S. (2005). How do cell walls regulate plant growth? Journal of Experimental Botany, 56(419), 2275–2285. 10.1093/jxb/eri247 [DOI] [PubMed] [Google Scholar]
- Tuomivaara, S. T. , Yaoi, K. , O'Neill, M. A. , & York, W. S. (2015). Generation and structural validation of a library of diverse xyloglucan‐derived oligosaccharides, including an update on xyloglucan nomenclature. Carbohydrate Research, 402, 56–66. 10.1016/j.carres.2014.06.031 [DOI] [PubMed] [Google Scholar]
- Vanzin, G. F. , Madson, M. , Carpita, N. C. , Raikhel, N. V. , Keegstra, K. , & Reiter, W. D. (2002). The mur2 mutant of Arabidopsis thaliana lacks fucosylated xyloglucan because of a lesion in fucosyltransferase AtFUT1. Proceedings of the National Academy of Sciences of the United States of America, 99(5), 3340–3345. 10.1073/pnas.052450699 [DOI] [PMC free article] [PubMed] [Google Scholar]
- Wang, M. , Xu, Z. , Guo, S. , Zhou, G. , ONeill, M. , & Kong, Y. (2020). Identification of two functional xyloglucan galactosyltransferase homologs BrMUR3 and BoMUR3 in brassicaceous vegetables. PeerJ, 8, e9095. 10.7717/peerj.9095 [DOI] [PMC free article] [PubMed] [Google Scholar]
- Waterhouse, A. M. , Procter, J. B. , Martin, D. M. A. , Clamp, M. , & Barton, G. J. (2009). Jalview Version 2—A multiple sequence alignment editor and analysis workbench. Bioinformatics, 25(9), 1189–1191. 10.1093/bioinformatics/btp033 [DOI] [PMC free article] [PubMed] [Google Scholar]
- York, W. S. , Harvey, L. K. , Guillen, R. , Alberhseim, P. , & Darvill, A. G. (1993). Structural analysis of tamarind seed xyloglucan oligosaccharides using β‐galactosidase digestion and spectroscopic methods. Carbohydrate Research, 248, 285–301. 10.1016/0008-6215(93)84135-S [DOI] [PubMed] [Google Scholar]
- Zhu, L. , Dama, M. , & Pauly, M. (2018). Identification of an arabinopyranosyltransferase from Physcomitrella patens involved in the synthesis of the hemicellulose xyloglucan. Plant Direct, 2(3), e00046. 10.1002/pld3.46 [DOI] [PMC free article] [PubMed] [Google Scholar]
Associated Data
This section collects any data citations, data availability statements, or supplementary materials included in this article.
Supplementary Materials
Figure S1. Phylogeny of XyG‐related GT47 proteins. Protein sequences from known XyG galactosyltransferases (AtMUR3, OsMUR3, TmMUR3, SlMUR3, EgMUR3, AtXLT2, OsXLT2 and TmXLT2), galacturonosyltransferase (AtXUT) and other Arabidopsis glycosyltransferases. The XLT2 and MUR3 clades are indicated in yellow and blue color, respectively. Blueberry proteins with similarity to XyG GT47 glycosyltransferases proteins obtained from a BlastP search against Genome Database for Vaccinium (GDV; VaccDscaff‐Genes) and additionally cloned candidate gene from blueberry ( Vaccinium corymbosum bluecrop cultivar). The naming of the GDV blueberry proteins was kept consistent with the results of the BastP search. The scale bar indicates the number of substitutions per site, branch lengths are directly related to the amount of genetic change between genes. At – Arabidopsis thaliana , Os – Oryza sativa (rice), Tm ‐ Tropaeolum majus (nasturtium), Sl – Solanum lycopersicum (tomato), Eg ‐ Eucalyptus grandis (Eucalyptus).
Figure S2. Expression heatmap of blueberry GT47 glycosyltransferase candidates in different tissues based on “ V. corymbosum cv. Draper Expression in Tissue during Fruit Development, FPKM” from GDV; FPKM = fragments per kilobase of transcript per million fragments mapped) using heatmapper.ca. The order of the genes in the heatmap corresponds to the order presented in the phylogenetic tree in Figure S1. The Row Z‐Score is an expression level scaling method that helps enhance clusters of genes with similar trends in expression between samples. Z‐scores are computed on a gene‐by‐gene (row‐by‐row) basis by subtracting the mean and then dividing by the standard deviation. Dots represent genes whose sequence was used to design primers (Table S1) for cloning the corresponding genes from berries of the V. corymbosum bluecrop.
Figure S3. Supporting Information.
Figure S4. XyG oligosaccharide analysis A. XyG oligosaccharide separation by HPAEC‐PAD. XyG oligosaccharides derived from etiolated hypocotyls of mur3 xlt2 expressing VcXBT. B. XyG oligosaccharide mass profiling (OLIMP) of collected peak fractions indicated by lines in (A). C. Monosaccharide composition analysis of XyG oligosaccharides in fractions from (A).
Figure S5. XyG oligosaccharide enrichment A. Hydrophilic chromatography of enzymatically released XyG oligosaccharides of leaf tissue of Arabidopsis mur3 xlt2 expressing VcXBT. A fraction corresponding to min 25,5‐28 (see bar) was collected for further analysis. B. Mass spectrometrical analysis of the content of the fraction collected in (A).
Figure S6. Gas chromatogram of partially methylated acetylated alditols of a XyG oligosaccharide fraction derived from leaf walls of mur3 xlt2 expressing VcXBT (Figure S5A). The presence or absence of a derivative was assessed by mass spectrometrical analysis of its fragments compared to standards. The abundance of non‐carbohydrate peaks is 29,5%. T‐Arap: terminal arabinopyranose, T‐Araf: terminal arabinofuranose, T‐Xylp: terminal xylopyranose, T‐Manp: terminal mannopyranose, T‐Glcp: terminal glucopyranose, 2‐Xylp: 2‐linked xylopyranose, 6‐Glcp: 6‐linked glucopyranose, 4‐Glcp: 4‐linked glucopyranose, 4,6‐Glcp: 4,6‐linked glucopyranose.
Figure S7. Subcellular localization of VcXBT in Nicotiana benthamiana epidermal cells by confocal laser scanning microscopy. GFP signal from the VcXBT‐GFP protein is shown in green. The RFP signal from the Golgi marker RnST‐RFP used as a control is shown in magenta. White bar corresponds to 20 μm.
Figure S8. Structural and sequence comparison of XyG galactosyltransferases. Structure‐based sequence alignment of MUR3 and XLT2 exostosin domains. Dashed lines indicate missing residues in the alignment. Residues are colored according to their conservation among all sequences. The consensus sequence and the corresponding histogram are shown at the bottom of the alignment as a measure of sequence conservation. RMSD is shown as grey histogram bar heights above the sequences as a measure of the structural conservation. Red boxes frame six regions with high RMSD values. Asterisks indicate residues showing MUR3‐ and XLT2‐specific sequence patterns in positions structurally conserved (black) or divergent (red).
Figure S9. Structural comparison of GT47 XyG glycosyltransferases. A. Superimposed predicted structures of AtMUR3, VcMUR3, OsMUR3, TmMUR3, AtXLT2, VcXLT2, OsXLT2, TmXLT2, SlXST1, SlXST2, VcXBT1, AtXUT1 and PpXDT exostosin domains colored by RMSD. Dark blue for low RMSD, white for medium RMSD, and red for high RMSD. B. Superimposed predicted structures colored in white. Highlighted in green are regions VII and VIII together with selected residues showing GT‐specific patters in close proximity. A detail of this structural superimposition is shown in Figure 8C. C. Structure‐based sequence alignment of the structures shown in A and B. Dashed lines indicate missing residues in the alignment. Residues are colored according to their conservation among all sequences. The regions/residues shown in B are highlighted in green. The consensus sequence and the corresponding conservation histogram is shown at the bottom of the alignment. RMSD are shown above the sequences as grey histogram bar heights representing the spatial variation among residues. Red boxes frame three regions showing different sequence patterns associated to differential XyG glycosyl transferase specificity. Asterisks indicate residues showing MUR3‐, XLT2 and XST‐specific sequence patterns in positions structurally conserved (black) or divergent (red).
Table S1. Primer sequences used in the study. Capitalized (non bold print) are gene specific sequences. Introduced sites for restriction enzymes (RE) are marked in capitalized and bold print. BPs from end of DNA required for complete digestion are written in lower case.
Table S2. Pairwise comparison between MUR3 and XLT2 XyG galactosyltransferases. Root‐mean‐square deviation (RMSD) score representing the spatial variation among all Cα atom pairs in angstroms (Å) and protein sequence similarity (%) are shown. RMSD values gives the average distance between the superimposed atoms of two models. The smaller the value, the more similar the two predicted structures.
Table S3. Sequence and structural pairwise comparison of VcXBT1 with MUR3 and XLT2. Root‐mean‐square deviation (RMSD) score representing the spatial variation among all Cα atom pairs in angstroms (Å). The RMSD value calculated after iterating a set of conserved pairs of Cα atoms is also represented as “RMSD (pruned atom pairs).” The number of Cα atoms (n) corresponding to each RMSD value is also shown. The structural alignment score using the ChimeraX software for each pairwise superposition is indicated in the last column. The higher the value, the better two structures superimpose.
Table S4. Structural alignment values for the superposition of AtXLT2 and AtMUR3, VcMUR3, OsMUR3, TmMUR3, AtXLT2, VcXLT2, OsXLT2, TmXLT2, SlXST1, SlXST2, VcXBT1, AtXUT1 and PpXDT exostosin domains. n: number of atoms; Å: angstroms. The RMSD value calculated after iterating a set of conserved pairs of Cα atoms is also represented as “RMSD (pruned atom pairs).” The number of Cα atoms (n) corresponding to each RMSD value is also shown. The structural alignment score using the ChimeraX software for each pairwise superposition is indicated in the last column. The higher the value, the better the two structures superimpose.
Data S1. Peer review.
Data Availability Statement
The data that support the findings of this study are available on request from the corresponding author, M.P.