

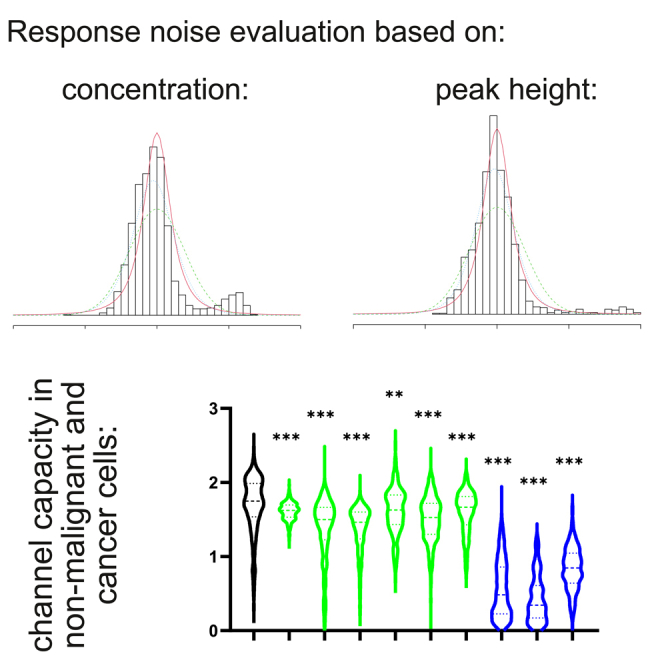
Summary
Intracellular signaling orchestrates an organism’s development and functioning and underlies various pathologies, such as cancer, when aberrant. A universal cell signaling characteristic is channel capacity — the measure of how much information a given transmitting system can reliably transduce. Here, we describe improved approaches to quantify GPCR signaling channel capacity in single cells, averaged across cell population. We assess the channel capacity based on distribution of residuals by the cellular response amplitude. We further develop means to handle irregularly responding cancer cells using the integral values of their response to different agonist concentrations. These approaches enabled us to analyze, for the first time, channel capacity in single cancer cells. A universal feature emerging for different cancer cell types is a decreased channel capacity of their GPCR signaling. These findings provide experimental validation to the hypothesis that cancer is an information disease, bearing importance for basic cancer biology and anticancer drug discovery.
Subject areas: Cancer, Cell biology
Graphical abstract
Highlights
-
•
An approach for a single-cell channel capacity evaluation with improved accuracy
-
•
Channel capacity drops in malignant cells, exposing cancer as informational disease
-
•
Responses to the same GPCR across different cancers are highly diverse or irregular
-
•
Candidate genes involved in Ca2+ response shape are reported
Cancer; Cell biology
Introduction
Intracellular signal transduction is the means of a cell, living as one of billions of cellular constituents of an organism, to coordinate its activities with the rest of the body through proper interpretation and response to extracellular chemical signals. Despite decades of research on intracellular signaling, some fundamental principles of this cellular activity and the demands a cell imposes on it are still not fully understood. These principles of signal transduction lie in the domain of information theory — a mathematical concept developed by Shannon to describe properties of information and its transmission through channels.1,2,3 Information theory has been applied to intracellular signal transduction, and important conclusions relating to noise suppression and channel capacity of intracellular signaling have been reached.4,5,6,7
Channel capacity is one of the central concepts of information theory. In simple words, channel capacity is the property of the information transmitting system, characterizing the maximal amount of information it can reliably transmit. The higher the channel capacity, the more information it can transmit. Channel capacity is measured in bits. Channel capacity of one bit describes a channel capable to transmit a simple “yes-or-no” input, channel capacity of two bits resolves 4 values, and so on. Channel capacity, being the central characteristic of an information-transmitting system, serves as a parameter integrating the properties of a signaling pathway. Initially, channel capacity was calculated based on the analysis of cell populations.5,7,8,9 Confounded by the now well-established paradigm that different cells have different sensitivities to the stimulus, these earlier studies underestimated the individual cell’s channel capacity, suggesting that cells can only transmit a mere yes-or-no response. Subsequent investigations, including our own, established single cell-based assays that uncovered the fundamental heterogeneity among cells in that they respond with different strengths to the same concentration of the stimulus, yet maintain a universally high channel capacity as the basic cell signaling characteristic.4,10,11,12,13
To assess the channel capacity in a G protein-coupled receptor (GPCR) signaling system, we focused on the muscarinic acetylcholine (Ach) receptor M3R in HEK293 cells.4 M3R activates heterotrimeric G proteins of the Gq family. GTP-loaded Gαq subunit in turn activates phospholipase Cβ (PLCβ), which cleaves phosphatidylinositol 4,5-bisphosphate (PIP2) into diacylglycerol and inositol 1,4,5-trisphosphate (IP3), the latter being responsible for the opening of calcium stores in the endoplasmic reticulum and the rise in intracellular [Ca2+].14 We used the dye Fura-2 a.m. to monitor intracellular [Ca2+] in individual live cells in a setup permitting multiple pulses of the activator (Ach) at different concentrations. In this setup, a field containing 10–35 cells is microscopically captured, and intracellular [Ca2+] is monitored by dual-wavelength fluorescence recording.
A number of implications of the use of information theory language to understand cellular signaling have been recognized.15,16 One of them is that certain disease states, including cancer, can be viewed as ‘information diseases’, whereas the cell, on transformation from the healthy to the diseased state, changes dramatically the information processing characteristics of a particular signaling network (or of several such pathways).15,16 Oncogenicity of GPCR signaling has been demonstrated in many examples, and GPCRs and their pathways are well-recognized as targets for anti-cancer drugs and drug discovery.17,18 M3R has been implicated in lung, skin, breast, and other cancers.19,20,21 Despite these understandings, no application of the information theory to dissect oncogenic cellular signaling has yet been performed, in part because of the technical difficulty of applying the channel capacity assessment setup based on responses of individual cells within a population to cancer cells, for which the concept of cell heterogeneity lies at the very center of their cancer cell biology.22
In the current work, we perform, for the first time, channel capacity analysis of cancer cell lines of different origins. We find that the Ach-GPCR-Ca2+ signaling system is strongly aberrated in many cancer cell lines. To cope with the signaling heterogeneity in cancer cells, we developed novel approaches to calculate the channel capacity in cancer cells. With these approaches, we find that the channel capacity of the GPCR signaling is indeed strongly decreased in many cancer lines. We end up providing clues onto the defective signaling buildup in the cancer lines, identifying candidate components responsible for the deficient signaling capacity.
Results and discussion
Heterogeneous cell responses to repeated GPCR stimulations across cancer cell types
As described in our previous work,4 a key element in the correct estimation of the individual cell’s channel capacity is to obtain a statistically robust evaluation of the conditional cell response probability, Pi(r∣c) — where r stands for the response and c for a given ligand concentration via repeated cell stimulation by the same input signal i. This evaluation is achieved by fitting a distribution, for which we initially used the distribution of response residuals to a given concentration of the agonist across the entire tested population of the stimulated cells. Stimulation of HEK293 cells by 100 nM-10 μM Ach produces single transients in the intracellular calcium concentration, with the height of these transients generally being higher with higher Ach concentrations (Figure 1A). As each cell in this experiment was stimulated seven times with the same [Ach], the average response height and its residuals for each cell at each of the five distinct agonist concentrations can be calculated. Plotting the response residuals of these Ca2+ transients against the respective average values using the data on Ca2+ responses of 362 individual HEK293 cells across the Ach concentrations tested,4 we observed that the spread of the residuals depended on average response levels, where intermediate average responses typically demonstrate much broader error than both low or high ones (Figure 1B). Leading to potential errors in subsequent population-wide channel capacity calculations obtained by averaging the channel capacity values of individual cells, this non-linearity originates from the heterogeneity in different cells’ responses to a given agonist concentration. As Figures 1C and S1 illustrate, this approach is less problematic for high agonist concentrations (10μM Ach) that induce strong responses in the majority of cells (corresponding to the highly packed area at the right of Figure 1B). However, it becomes troublesome for lower concentrations (Figure S1A), where some cells respond strongly while others – weakly, which ultimately results in admixture of the two distributions of residuals, as evident on the corresponding panels of Figure 1C and also as ‘wings’ of the residuals distribution in Figure 1B.
Figure 1.

Distribution of residuals in Ca2+ responses in individual cells is more homogeneous if grouping is performed based on the response level rather than agonist concentration
(A) A representative trace of the responses of an individual HEK293 cell to repeated acetylcholine (Ach) stimulations. Gray shows the repeats of the same concentrations; red lines mark the moments of agonist injection.
(B) Distribution of the response residuals by the average response height. Each of the 362 × 7 × 5 dots represents the residual value plotted against the average value for each of the 362 cells tested 7 times at 5 different Ach concentrations.
(C) Pooled distributions of the residuals obtained for a particular concentration at high (10 μM) and lower (500 and 250 nM) concentrations demonstrate significant asymmetries at the lower concentrations.
When turning from HEK293 to cancer cells to estimate their signaling channel capacity, the problem aggravates. Some of the cancer lines, such as SNU398, HEP3B, HUH7 (all representing hepatocellular carcinoma), and LS174T (colorectal cancer) contain a large proportion of cells capable of providing robust calcium responses to repeated Ach stimulations (Figures 2A and S1B–S1E), but show increasingly divergent patterns of signal residuals distribution when analyzing the Ca2+ peak heights (Figures 2B–2E) – a cell-intrinsic feature complicating channel capacity estimation using the standard algorithm. At the same time, these cancer cells are among those that ‘behave well’ in response to repeated stimulation. In contrast, cells from several other cancer lines presented us with what can be interpreted as “aberrant”, yet clearly concentration-dependent responses in the chosen concentration range (Figures 3A and S1F–S1J). These included such cell lines as HepG2 (hepatocellular carcinoma), HeLa (cervical cancer), A549 (lung cancer), and 143B (osteosarcoma). Clearly, the standard algorithm4 cannot be applied to such cells at all.
Figure 2.

A subset of cancer cells demonstrates pseudo-regular responses to acetylcholine stimulation
(A) Representative examples of Ca2+ traces of “regular responders” – cancer cell lines which, similarly to HEK293 cells, have a significant number of cells with a correlation between the peak onset and agonist exposure.
(B–E) Residual distribution dependence of the average response height for regularly responding cancer cell lines is extremely variable and cell line-dependent. Shown are cancer cells of the hepatocellular carcinoma SNU398 (B), HEP3B (C), and HUH7 (D) cell lines, and the colorectal cancer cell line LS174T (E).
Figure 3.

A subset of cancer cells demonstrates irregular responses to acetylcholine stimulation independently of their specific pattern of muscarinic or nicotinic receptor expression
(A) Representative examples of Ca2+ traces of “irregular responders” – cancer cell lines showing some responses to Ach that do not correlate with the onset of agonist addition.
(B) Clustering of the cell lines used in the study, quantified by proportion of individual cells behaving as regular, irregular, or no-responders.
(C–D) Expression levels of muscarinic M3 receptor (C) or other Ach receptor (D) genes across the cell lines. No correlation between the response type and receptor expression pattern can be seen. LS174T cells are not included in the analysis as they are not part of the CCLE database.
Another level of cellular heterogeneity can be appreciated when we analyze, across the cell lines mentioned above and some additional cell lines (SKNBE2C, SHSY5Y (both neuroblastoma), H1650 (lung cancer), and U2OS (osteosarcoma)), the distribution of regularly responding (as exemplified by the traces in Figure 2A), irregularly responding (as exemplified by the traces in Figure 3A), and non-responding cells (Figure 3B). This analysis shows that across the cell lines, varying proportions of cells respond properly, irregularly, or not at all. For example, >80% of the SNU398, HEP3B, and HUH7 cells respond to repeated Ach stimulations in the regular manner as exemplified in Figure 2A, the rest falling about equally into the non-responding and aberrantly responding cell populations (Figure 3B). In contrast, ca. 20% of HeLa cells provide irregular responses (as can be seen from quantification presented in Figure 3A), the rest being not responsive at all. LS174T cells split roughly equally into the regularly responding cells (as in Figure 2A) and aberrantly responding ones. U2OS cell population consists of ca. 80% irregularly responding cells and ca. 20% non-responding cells, and so on (Figure 3B).
We wondered if this clustering of cancer cell lines may be reflected by differences in the expression pattern of the Ach receptor. Taking advantage of CCLE RNA-seq-based expression levels data,23 we found that these cell lines, except for HepG2, express detectable to high levels of the M3R GPCR, regardless of their regular, irregular, or nonresponsive status (Figure 3C). We suppose that in HepG2 cells, M5R that is expressed in these cells and also signals through the Gαq-PLCβ-Ca2+ pathway24 mediates the Ach responses. We further compared expression patterns of the whole family of muscarinic24 and nicotinic Ach receptors (some of which can also mediate Ca2+ responses)25 across the cell lines (Figure 3D). Despite some differences among the lines, the receptor expression pattern cannot account for the observed differences within the response-type clusters of Figure 3B. For example, the highest expression of M3R can be observed in some representatives of regular responders (such as HUH7) and no-responders (such as SHSY5Y). These data suggest that the response regularity or irregularity, rather than being defined by the initiator receptors, depends instead on the composition of the signal transduction and Ca2+ mobilization machinery in a given cell line. Although the latter is addressed in more detail in the last chapter of this section, we here wish to stress that regardless of the response pattern, all the cells studied reveal clear dose-response correlation in their calcium signaling as stimulated by Ach (Figure S1).
We conclude that cancer cell lines are highly heterogeneous in their GPCR responses and cannot be treated with the channel capacity calculation algorithm we have previously developed for the non-cancerous cells.4 We thus next aimed at developing novel algorithms to assess the channel capacity in cancer cells, one applicable to regular responders, and the other – to irregular ones.
Improved algorithm employs peak height-based analysis of channel capacity
The novel algorithm that we developed aims at overcoming the confounding effect arising from the relationship between the average responses and the spread of the residuals (Figure 1B and 2B-E). As the heterogeneity in the cells’ responses comes from the fact that the dynamic range of individual cells — the ‘window’ of agonist concentrations to which cells differentially respond — is shifted left or right of the population average,4 we wondered if the very response level of individual cells could be used as the basis to assess the distribution and residuals, independently of the actual agonist concentration used. We thus first split our HEK293 dataset into deciles and used the resulting pools of peak heights to evaluate the distribution of the residuals associated with the corresponding interval of peak heights. The results are presented in Figure 4А. The distributions of the residuals presented in Figure 4A are built for deciles of peak height pools and are chosen to correspond to concentration-based distributions on Figure 1C with similar average response peak height. As can be seen, this new approach, which will be called “peak height-based” or “peak-based” further on, is efficient in reducing the admixture of heterogeneous populations of peaks; the resulting distributions are more homogeneous and can be fitted more reliably.
Figure 4.

New algorithm for channel capacity estimation based on response probability calculation from peaks with similar heights provides more robust results
(A) Distributions of the residuals obtained for similar response magnitudes as on the Figure 1C, but using pooling by deciles of average peak heights, are considerably more homogeneous, and provide more robust fits.
(B and C) Violin plots showing the shapes and medians of channel capacity distributions obtained at different degrees of interpolation for the concentration-based approach (B) and the peak-based one (C).
(D and E) One of the cell clusters identified in Figure S2 drives the gradual increase of the channel capacity estimate on more interpolation steps in the concentration-based approach (D) but not in the peak-based approach (E).
(F) Channel capacity distributions calculated on the splitting of residuals into different numbers of quantiles show that these parameters have limited influence on the outcome when the peak-based approach is used.
We next analyzed how the peak-based approach operates at different steps of channel capacity calculation. As described in our previous work, when faced with the need to restrict the measurements to a limited set of agonist concentrations (seven in our case), interpolation of the results to intermediate concentrations is a valid approach to calculating more realistic channel capacity values. To interpolate, parameters of the scaled student distribution estimating Pi(r∣c) for concentrations that are not experimentally tested are evaluated by assuming their linearity between the two given experimental concentrations.4 We calculated the distributions of the channel capacity values at different numbers of interpolated concentrations, from none to 9, using the original concentration-based (Figure 4B) and the new peak-based approaches (Figure 4C). The graphs reveal that the estimated channel capacity has a strong trend to grow on increasing the number of interpolated concentrations when using the concentration-based approach (Figure 4B), whereas the peak-based approach is free from this effect (Figure 4C). This difference is unsurprising since, on admixture of 2 or more peak height distributions, the narrower dominant distribution will enforce its properties on the responses otherwise more broadly distributed, resulting in overestimation of the channel capacity — the effect that is further aggravated by the interpolation.
The shape of the channel capacity distributions in Figure 4B may indicate that the increase in the mean/median capacity value is mainly driven by a certain subpopulation within the analyzed cells. To explore this phenomenon further, we normalized all response values of individual cells to those at 10 μM Ach and represented the values as a heatmap, identifying cell clusters with similar response patterns (Figure S2A). Plotting the mean channel capacity values from cells of these clusters confirmed that the increase in channel capacity estimation achieved by increasing interpolations arises from cluster 2, representing cells that respond only to the highest tested concentration of Ach (Figures 4D and S2A). This finding highlights the shortcomings of the concentration-based distribution evaluation algorithm, since the lower variability of the high responses of clusters 1 and 3 is projected onto the non-responsive portions of the cluster 2 peaks. This projection results in interpolation of a large number of narrowly distributed signals in the cluster 2 cells, between a single strongest response and the weak ones, resulting in an overestimation of the channel capacity. In contrast, the peak height-based approach does not permit projection of a narrow distribution on intermediate concentrations, and thus reports very uniform values regardless of the potency of the agonist for the individual cells (Figure 4E).
In addition, we tested how the number of quantiles (which was 10, deciles, in the data presented so far) chosen to split the dataset might influence the channel capacity calculation in the peak-based approach. One can speculate that reducing the number of quantiles might increase the number of representative points in the distribution fit. In contrast, increasing the number of quantiles will reduce the reliability of the distribution fit because of smaller datasets, yet it will bring the peak heights in the fitted distribution closer to the actual experimental distribution. We tested the algorithm by splitting the dataset into 5, 7, 10, and 15 quantiles and identified high robustness of the resultant channel capacity values with regard to the number of quantiles used (Figure 4F). We noticed that using lower numbers (5 (Figure 4F) or lower (not shown)) produced a certain degree of distortion of the channel capacity distribution, most likely because of the onset of mixing of distributions of different peak heights, as it occurs in case of the concentration-based calculation. We therefore settled down on deciles as the optimal number of quantiles to split the dataset into.
With this new peak height-based approach, we approached the cancer cell lines producing regular Ca2+ peaks in response to repeated Ach stimulations (SNU398, HEP3B, HUH7, and the regular responder subpopulation of LS174T, see Figure 2A). Despite this certain level of regularity, the relationship between the average responses and the spread of the residuals observed in these cancer cells is often even more complex than that of the non-cancerous HEK293 cells (Figures 2B–2E). These cancer lines also presented a very diverse set of response patterns (Figures S2B–S2E). We applied the new peak height-based algorithm to calculate the channel capacity in these cancer cells, comparing it with the original concentration-based algorithm.4 As Figure 5 demonstrates, the peak height-based calculation is invariably more robust and less prone to channel capacity overestimation on interpolation. The resulting channel capacity values for these cancer cells range from 1.2 bits (the regular responder subpopulation of LS174T cells) to 1.6 bits (HUH7 cells). An interesting observation emerges from comparing these values with the population-wide EC50 values. As Figure S1 illustrates, neither the channel capacity itself nor its distribution appear to correlate with the response potency as measured cell population-wide.
Figure 5.

Improved approach for channel capacity estimation is universally applicable to a broad variety of regular response patterns
(A–D) Violin plots of channel capacity distributions obtained at different interpolation coefficients by the concentration-based or peak height-based approaches for SNU398 (A), HEP3B (B), HUH7 (C), and LS174T (D) cell lines.
Evaluation of channel capacity in “irregular responders” using the integral value of their response within a single pulse of stimulation
For the cell lines presenting mostly irregular responses – SKNBE2C, HT1650, U2OS, SHSY5Y, and additionally HeLa (which, despite aligning with “poor responders” cluster, still contain a significant number of irregular traces to perform such evaluation, Figure 3B) – it was impossible to use the same definition of the response, as these cells do not present defined calcium peaks correlating with the Ach stimulations (Figure 3A). However, the cells still produced some kind of calcium response, the height of which positively correlated with the increase in Ach concentrations, as can be seen on the concentration curves and average response heatmaps (Figures S1F–S1J and S3А–S3Е). Therefore, despite the response irregularity, these cancer cells still appear competent to transmit some level of information about the agonist and its concentration.
To evaluate the channel capacity of such corrupt cells, we applied another approach to estimate their response output that takes the complete integral value under the curve on its fragment until the next stimulation (Figure 3A) as a measure of the response to a given stimulation. The resultant channel capacity calculations for these cancer cells with irregular responses were found to be around 0.6, from 0.53 (SHSY5Y cells) to 0.79 (U2OS) (Figure 6A). Such channel capacity values distributed between 0 and 1 indicate that these cancer cells ‘fluctuate’ between the complete incapacity to discriminate between the absence and presence of Ach and the “yes/no” type of response to the agonist.
Figure 6.

Channel capacity drops in cancer cells, specifically those with irregular response linked to alterations in the expression of Ca2+ homeostasis genes
(A) Violin plots of channel capacity distributions for “irregular responder” lines and HeLa cells obtained using the integral value of the Ca2+ response for each stimulation as a measure of the response. The values were estimated using a peak height-based approach with 1 interpolated concentration and 10 quantiles.
(B) Expression levels of the genes involved in Ca2+ homeostasis that are statistically up- or down-regulated in cluster 1 of “regular” responders as compared to others. All the genes but one (CACNA2D3) are upregulated in the cell lines, responding in a “regular” manner.
(C and D) Systematic comparison of channel capacity in the non-malignant breast epithelium-derived MCF10A cells and breast cancer cells with (D) either regular or irregular response patterns reveals that signaling information transduction in the cancer cells is significantly compromised as compared to their healthy ancestors.
Differential response profiles of cancer cell lines point toward a key role of calcium homeostasis regulation in reliable signal transduction
We again utilized the CCLE RNA-seq-based expression levels data,23 this time to gain first insights into the potential mechanisms distinguishing cancer cells with a good channel capacity from those with the severely disrupted ability to reliably transmit information through the GPCR signaling system. Using the dataset, we searched for genes with statistically significant differences in expression among cancer cells in different clusters, as shown in Figure 3B. Among around 800 such genes that would need further scrutiny, we identified 10 responsible for Ca2+ homeostasis. These genes attracted our special attention as likely candidates to contribute critically to the observed differences in the responses of the cells (Figures 6B and Table 1). Of special note is that most of these genes are upregulated in the “regular” responders and are associated with increase and control of intracellular Ca2+ in various intracellular storage compartments, which makes them likely mediators of the tighter regulation of Ca2+ levels we observe in these cells. Detailed elucidation of the exact mode of action of these proteins in regulation of the channel capacity is a task for further detailed research. However, based on the exact magnitude of differences observed, we might highlight TPCN2, MCOLN1, and LETM1 as the molecular determinants with the highest probability of input into the Ca2+ response regulation. Given that these proteins localize to endosomes/lysosomes (TPCN2 and MCOLN1) and mitochondria (LETM1), our findings open a venue toward a deeper understanding of the role of these cellular compartments in the GPCR-Ca2+ signal transduction, beyond the conventional plasma membrane/ER paradigm.
Table 1.
Genes regulating Ca2+ homeostasis statistically significantly over- or under-expressed in cell lines with regular response to stimulation
| Gene symbol | Description (upon NCBI/UniProt gene summary) | Expression status |
|---|---|---|
| CACNA2D3 | Calcium Voltage-Gated Channel Auxiliary Subunit Alpha2/delta. A member of the alpha-2/delta subunit family, a protein in the voltage-dependent calcium channel complex (consists of alpha-1, alpha-2/delta, beta, and gamma subunits). Mediates the influx of calcium ions into the cell upon membrane polarization.26. | Downregulated |
| CHERP | Calcium Homeostasis Endoplasmic Reticulum Protein, enables transmembrane transporter binding activity. Involved in positive regulation of calcineurin-NFAT signaling cascade and of sequestered calcium ion into cytosol. Acts upstream of or within cellular calcium ion homeostasis.27. | Upregulated |
| LETM1 | Leucine Zipper And EF-Hand Containing Transmembrane Protein 1. Mitochondrial proton/calcium antiporter that mediates proton-dependent calcium efflux from mitochondrion. Maintains the mitochondrial tubular shapes and is required for normal mitochondrial morphology.28,29. | Upregulated |
| MCOLN1 | Mucolipin TRP Cation Channel 1. Member of the transient receptor potential (TRP) cation channel gene family. Permeable to Ca2+, Fe2+, Na+, K+, and H+, and is modulated by changes in Ca2+ concentration. The membrane channel is localized in lysosomes.30,31,32. | Upregulated |
| SEC61A1 | SEC61 Translocon Subunit Alpha 1. Mediates transport of signal peptide-containing precursor polypeptides. Controls the passive efflux of calcium ions from the ER lumen to the cytosol through SEC61 channel, contributing to the maintenance of cellular calcium homeostasis.33. | Upregulated |
| SLC25A23 | Solute Carrier Family 25 Member 23. Predicted to enable ATP transmembrane transporter activity. Involved in calcium import into the mitochondrion; positive regulation of mitochondrial calcium ion concentration; and regulation of cellular hyperosmotic salinity response.34. | Upregulated |
| STRIT1 | Small Transmembrane Regulator Of Ion Transport 1. Enhances the activity of ATP2A1/SERCA1 ATPase in sarcoplasmic reticulum by displacing ATP2A1/SERCA1 inhibitory peptides sarcolipin, phospholamban and myoregulin (predicted from homology to DWORF). | Upregulated |
| TMEM109 | Transmembrane Protein 109. Predicted to form voltage-gated calcium and potassium channels.35. | Upregulated |
| TPCN2 | Two Pore Segment Channel 2. Intracellular endolysosomal channel initially characterized as a non-selective Ca2+-permeable channel activated by NAADP, it is also a highly-selective Na+ channel activated directly by PI(3,5)P2.36,37. | Upregulated |
| TRPC7 | Transient Receptor Potential Cation Channel Subfamily C Member 7. Predicted to enable inositol-1,4,5-trisphosphate binding activity and store-operated calcium channel activity; involved in metal ion transport; regulation of cytosolic calcium ion concentration.38. | Upregulated |
Channel capacity drops from non-malignant breast epithelial to breast cancer cells
In the previous sections, we applied our new algorithms for channel capacity calculation to cell lines derived from cancers of different tissues. Comparing these diverse cancer cell lines with the non-cancerous HEK293 cells, we find a uniform drop in the channel capacity of the cancer cell lines. We next attempted to assess more formally whether and how the channel capacity is modified on transition from a healthy cell to a cancerous cell of the same tissue. For this purpose, we employed the MCF10A line derived from non-malignant fibrocystic breast tissue and a panel of breast cancer (BC) cell lines (Figure 6C). These BC cell lines revealed diverse Ach response patterns, with some lines dominated by regular responders (BT20, HCC38, HCC1395, MCF7, MDA-MB-468, SUM159), and others (HCC1806, MDA-MB-231, MDA-MB-453) – by the irregular ones (Figure 6D). Importantly, all the BC lines demonstrated the channel capacity values statistically significantly below those of MCF10A cells (Figure 6C). As expected, the median channel capacity of the BC lines with irregular response patterns was less than 1.
Overall, the novel approaches we developed permitted us to estimate, for the first time, the channel capacity of cancer cell populations based on measurements of individual cell responses. We found that this channel capacity is universally reduced across cancer lines in the analyzed GPCR signaling system, and drops below 1 in about half of the cancer cell lines analyzed, following the theoretical predictions that highlight cancer as a potential ‘information disease’.15,16 We believe these findings will have important consequences for the understanding of the etiology of cancer and for the development of novel ways to develop therapies for it.16 In addition, this approach opens a venue for evaluation of the channel capacity in any living cell assay system where repeated signal transduction events at different inputs can be measured, such as agonist-GPCR-cAMP systems, FRET-based GPCR biosensors, etc.
Limitations of the study
Further investigations comparing healthy and cancerous cells from other tissues are desired to confirm the universality of the main conclusion of our study. Similar analyses of other GPCR signaling systems and signaling cascades initiated by non-GPCR receptors will also be interesting.
STAR★methods
Key resources table
| REAGENT or RESOURCE | SOURCE | IDENTIFIER |
|---|---|---|
| Chemicals, peptides, and recombinant proteins | ||
| Acetylcholine | Sigma-Aldrich | A6625 |
| Fura2-AM | BIOTIUM | #50034 |
| HBSS | Gibco | 14185 |
| Experimental models: Cell lines | ||
| HEK293 | ATCC | CRL-1573; RRID:CVCL_0045 |
| SNU398 | Michelangelo Foti, University of Geneva | N/A; RRID:CVCL_0077 |
| Hep3B | Michelangelo Foti, University of Geneva | N/A |
| HUH7 | Michelangelo Foti, University of Geneva | N/A; RRID:CVCL_0336 |
| LS174T | Patrycja Nowak-Sliwinska, University of Geneva | N/A; RRID:CVCL_1384 |
| SKNBE2C | Karim Abid, University Hospital of Lausanne | N/A; RRID:CVCL_0529 |
| SHSY5Y | Valerie Dutoit, University of Geneva | N/A; RRID:CVCL_0019 |
| H1650 | Roberto Coppari, University of Geneva | N/A; RRID:CVCL_1483 |
| U2OS | Charna Dibner, University of Geneva | N/A; RRID:CVCL_0042 |
| MCF10A | Patrick Meraldi, University of Geneva | N/A; RRID:CVCL_0598 |
| BT20 | ATCC | HTB-19; RRID:CVCL_0178 |
| HCC38 | Cathrin Brisken, EPFL | N/A; RRID:CVCL_1267 |
| HCC1395 | ATCC | CRL-2324; RRID:CVCL_1249 |
| MCF7 | ATCC | HTB-22; RRID:CVCL_0031 |
| MDA-MB-468 | ATCC | HTB-132; RRID:CVCL_0419 |
| SUM159 | Gabriela Dontu, King’s College London | N/A; RRID:CVCL_5423 |
| HCC1806 | Cathrin Brisken, EPFL | N/A; RRID:CVCL_1258 |
| MDA-MB-231 | ATCC | HTB-26; RRID:CVCL_0062 |
| MDA-MB-453 | ATCC | HTB-131; RRID:CVCL_0418 |
| Software and algorithms | ||
| Prism | GraphPad | 9.1.0 |
| MATLAB | MathWorks | R2018a |
| R | R Foundation | 4.2.2 |
| Other | ||
| μ-Slide I Luer | Ibidi | 80176 |
Resource availability
Lead contact
For additional information and other requests, please use the following lead contact: Vladimir Katanaev, vladimir.katanaev@unige.ch.
Materials availability
The current study did not generate any new reagents.
Data and code availability
Data: All data reported in this paper can be requested from the lead contact.
Code: The new code used to analyze traces of irregularly responding cells is provided in the current manuscript as Methods S1 and S2 files.
Other items: Any additional information required to reanalyze the data reported in this paper is available from the lead contact upon request.
Experimental model and study participant details
The cell culture media including MEM, DMEM, RPMI1640 were generally supplemented with 10% FCS and 1% penicillin-streptomycin (Gibco). Cells were maintained in incubator with 95% relative humidity and 5% CO2 at 37°C, regular split performed once per week at 70%–80% confluency. To keep the consistence of experimental data and minimize the influence resulted by different cell culture conditions, the cells were seeded 24 h before measurements and the culture medium was changed to DMEM with 10% FCS and 1% penicillin-streptomycin. Specifications regarding the culture medium and supplements of presented cell lines are as follows: HEK293, HUH7, U2-OS, SH-SY5Y, HELA, HEPG2, A549, 143B, BT20, HCC38, HCC1395, MCF-7, MDA-MB-468, SUM159, MDA-MB-231 and MDA-MB-453 cell lines were sub-cultured in DMEM medium (Gibco, Cat#10566016); LS174 and HEP3B cell lines were sub-cultured in MEM medium (Gibco, Cat#12492013); SNU-398, SKNBE2C, HT1650, HCC1395 and HCC1806 cell lines were cultured in RPMI-1640 medium (Gibco, Cat#11875093); MCF10A cells were sub-cultured in DMEM F12 medium (Gibco, Cat#10565018) supplemented with 7.5 μg/mL human insulin (Sigma-Aldrich, Cat#11061-68-0), 35 μg Pituitary Extract bovine (Sigma-Aldrich, production number P1476), 0.35 μg/mL Hydrocortisone (Sigma-Aldrich, production number H4001) and 5 ng/mL recombinant human epidermal growth factor.
Method details
Cells were washed with PBS for once and trypsinized, 2.5 × 10⁵ cells were seeded into channel slides (ibidi GmbH, Cat Nr: 80176, Germany) in a volume of 100 μL 16 h before calcium imaging experiment. Cells were loaded with 5μM Fura2-AM (BIOTIUM, Canada, Cat #50034) in HBSS (Gibco) supplemented with 10 mM HEPES pH 7.4 (Thermo Fisher Scientific) for 30 min. The channel slides were mounted on Axio cell observer (Zeiss, Germany) and ratiometric calcium imaging was performed using Visitron systems (Visitron System GmbH, Germany) set of equipment including CoolLED pE-340, fast acquisition camera (PCO Edge 4.2 M, Germany), FLUAR ×20/0.75 air objective. The captured images were analyzed with VisiVision software (Visitron System GmbH, Germany). Series of perfusions were performed using microfluidic system with OB1 MK3+ microfluidic flow controller and MUX distribution valve (ELVEFLOW, France), cells were bathed in HBSS pH 7.4 and perfused 5 times with 7 different concentrations of acetylcholine (Sigma-Aldrich, USA), 100 nM, 250 nM, 500 nM, 750 nM, 1.5 μM, 3 μM and 10 μM. The exposure duration of acetylcholine was set at 10 s according to acetylcholine-calcium response kinetics to stimulate a maximized calcium increase, followed by an interval of 120s for washout with HBSS solution.
Quantification and statistical analysis
The peak heights were extracted from raw traces using in-house developed MATLAB script as described.4 For extraction of the area under curve in segments of the traces of the irregular responder cells, this approach was modified as follows (see attached script): after background removal using MATLAB msbackadj function, smaller fluctuations of the background were additionally taken into account by approximating it with linear interpolation at the minimums of the curves at the times of ligand addition. All traces were manually checked and background-corrected in case of aberrations of this approach. Subsequently, built-in trapz function was used to evaluate the area under curve of the corresponding segments of the curve. The integral data was exported in the same format as described4 for the peak data and analyzed in R using either published4 or newly developed script with the parameters indicated in the respective figures (see attached script). The modifications of the script included the use of quantile function to compute the limits of the pools of residuals to be used in computation of the probability of the response and changes in the probability assignment function to use the peak height for choice of the residuals distribution to use.
All the datasets were analyzed in R using either published4 or newly developed script with the parameters indicated in the respective figures. Visualization was performed using either built-in tools or ggplots package,39 or using GraphPad Prism 9. The gene expression datasets were downloaded from the CCLE via an available online interface.40
Acknowledgments
We thank Michelangelo Foti, Patrycja Nowak-Sliwinska, Karim Abid, Valerie Dutoit, Roberto Coppari, Charna Dibner, Patrick Meraldi, Cathrin Brisken, and Gabriela Dontu for providing cell lines. The work was funded by the Swiss Cancer Research Foundation, grant number KFS-4379-02-2018 to V.L.K.
Author contributions
Conceptualization, Supervision, and Funding Acquisition: V.L.K.; Methodology, Software, Formal Analysis, and Data Curation: A.K.; Investigation: A.K. and X.Z.; Writing – Original Draft: A.K., X.Z., and V.L.K.; Writing – Review and Editing: A.K., X.Z., and V.L.K.; Project Administration: A.K. and V.L.K.
Declaration of interests
The authors declare no competing interests.
Published: July 3, 2023
Footnotes
Supplemental information can be found online at https://doi.org/10.1016/j.isci.2023.107270.
Contributor Information
Alexey Koval, Email: Alexey.Koval@unige.ch.
Vladimir L. Katanaev, Email: Vladimir.Katanaev@unige.ch.
Supplemental information
The MATLAB script is written to extract the area under the curve values for irregularly responding cells.
The R script used to evaluate channel capacity by evaluating the residual distribution for peaks with similar heights.
References
- 1.Shannon C.E. A Mathematical Theory of Communication. Bell System Technical Journal. 1948;27:379–423. [Google Scholar]
- 2.Shannon C.E. A Mathematical Theory of Communication. Bell System Technical Journal. 1948;27:623–656. [Google Scholar]
- 3.Cover T.M., Thomas J.A. 2nd Edition. John Wiley & Sons, Inc; 2006. Elements of Information Theory. [Google Scholar]
- 4.Keshelava A., Solis G.P., Hersch M., Koval A., Kryuchkov M., Bergmann S., Katanaev V.L. High capacity in G protein-coupled receptor signaling. Nat. Commun. 2018;9:876. doi: 10.1038/s41467-018-02868-y. [DOI] [PMC free article] [PubMed] [Google Scholar]
- 5.Cheong R., Rhee A., Wang C.J., Nemenman I., Levchenko A. Information transduction capacity of noisy biochemical signaling networks. Science. 2011;334:354–358. doi: 10.1126/science.1204553. [DOI] [PMC free article] [PubMed] [Google Scholar]
- 6.Lestas I., Vinnicombe G., Paulsson J. Fundamental limits on the suppression of molecular fluctuations. Nature. 2010;467:174–178. doi: 10.1038/nature09333. [DOI] [PMC free article] [PubMed] [Google Scholar]
- 7.Selimkhanov J., Taylor B., Yao J., Pilko A., Albeck J., Hoffmann A., Tsimring L., Wollman R. Systems biology. Accurate information transmission through dynamic biochemical signaling networks. Science. 2014;346:1370–1373. doi: 10.1126/science.1254933. [DOI] [PMC free article] [PubMed] [Google Scholar]
- 8.Uda S., Saito T.H., Kudo T., Kokaji T., Tsuchiya T., Kubota H., Komori Y., Ozaki Y.i., Kuroda S. Robustness and compensation of information transmission of signaling pathways. Science. 2013;341:558–561. doi: 10.1126/science.1234511. [DOI] [PubMed] [Google Scholar]
- 9.Voliotis M., Perrett R.M., McWilliams C., McArdle C.A., Bowsher C.G. Information transfer by leaky, heterogeneous, protein kinase signaling systems. Proc. Natl. Acad. Sci. USA. 2014;111:E326–E333. doi: 10.1073/pnas.1314446111. [DOI] [PMC free article] [PubMed] [Google Scholar]
- 10.Zhang Q., Gupta S., Schipper D.L., Kowalczyk G.J., Mancini A.E., Faeder J.R., Lee R.E.C. NF-κB dynamics discriminate between TNF doses in single cells. Cell Syst. 2017;5:638–645.e5. doi: 10.1016/j.cels.2017.10.011. [DOI] [PMC free article] [PubMed] [Google Scholar]
- 11.Gross S.M., Dane M.A., Bucher E., Heiser L.M. Individual cells can resolve variations in stimulus intensity along the IGF-PI3K-AKT signaling axis. Cell Syst. 2019;9:580–588.e4. doi: 10.1016/j.cels.2019.11.005. [DOI] [PMC free article] [PubMed] [Google Scholar]
- 12.Wada T., Hironaka K.-i., Wataya M., Fujii M., Eto M., Uda S., Hoshino D., Kunida K., Inoue H., Kubota H., et al. Single-cell information analysis reveals that skeletal muscles incorporate cell-to-cell variability as information not noise. Cell Rep. 2020;32:108051. doi: 10.1016/j.celrep.2020.108051. [DOI] [PubMed] [Google Scholar]
- 13.Topolewski P., Zakrzewska K.E., Walczak J., Nienałtowski K., Müller-Newen G., Singh A., Komorowski M. Phenotypic variability, not noise, accounts for most of the cell-to-cell heterogeneity in IFN-γ and oncostatin M signaling responses. Sci. Signal. 2022;15:eabd9303. doi: 10.1126/scisignal.abd9303. [DOI] [PubMed] [Google Scholar]
- 14.Kadamur G., Ross E.M. Mammalian phospholipase C. Annu. Rev. Physiol. 2013;75:127–154. doi: 10.1146/annurev-physiol-030212-183750. [DOI] [PubMed] [Google Scholar]
- 15.Levchenko A., Nemenman I. Cellular noise and information transmission. Curr. Opin. Biotechnol. 2014;28:156–164. doi: 10.1016/j.copbio.2014.05.002. [DOI] [PMC free article] [PubMed] [Google Scholar]
- 16.Zielińska K.A., Katanaev V.L. Information theory: new look at oncogenic signaling pathways. Trends Cell Biol. 2019;29:862–875. doi: 10.1016/j.tcb.2019.08.005. [DOI] [PubMed] [Google Scholar]
- 17.Dorsam R.T., Gutkind J.S. G-protein-coupled receptors and cancer. Nat. Rev. Cancer. 2007;7:79–94. doi: 10.1038/nrc2069. [DOI] [PubMed] [Google Scholar]
- 18.Liu Y., An S., Ward R., Yang Y., Guo X.X., Li W., Xu T.R. G protein-coupled receptors as promising cancer targets. Cancer Lett. 2016;376:226–239. doi: 10.1016/j.canlet.2016.03.031. [DOI] [PubMed] [Google Scholar]
- 19.Spindel E.R. Muscarinic receptor agonists and antagonists: effects on cancer. Handb. Exp. Pharmacol. 2012:451–468. doi: 10.1007/978-3-642-23274-9_19. [DOI] [PMC free article] [PubMed] [Google Scholar]
- 20.Kruse A.C., Li J., Hu J., Kobilka B.K., Wess J. Novel insights into M3 muscarinic acetylcholine receptor physiology and structure. J. Mol. Neurosci. 2014;53:316–323. doi: 10.1007/s12031-013-0127-0. [DOI] [PMC free article] [PubMed] [Google Scholar]
- 21.Sales M.E. Muscarinic receptors as targets for metronomic therapy in breast cancer. Curr. Pharmaceut. Des. 2016;22:2170–2177. doi: 10.2174/1381612822666160229115317. [DOI] [PubMed] [Google Scholar]
- 22.Marusyk A., Janiszewska M., Polyak K. Intratumor heterogeneity: the rosetta stone of therapy resistance. Cancer Cell. 2020;37:471–484. doi: 10.1016/j.ccell.2020.03.007. [DOI] [PMC free article] [PubMed] [Google Scholar]
- 23.Nusinow D.P., Szpyt J., Ghandi M., Rose C.M., McDonald E.R., 3rd, Kalocsay M., Jané-Valbuena J., Gelfand E., Schweppe D.K., Jedrychowski M., et al. Quantitative proteomics of the cancer cell line encyclopedia. Cell. 2020;180:387–402.e16. doi: 10.1016/j.cell.2019.12.023. [DOI] [PMC free article] [PubMed] [Google Scholar]
- 24.Caulfield M.P., Birdsall N.J. International union of pharmacology. XVII. Classification of muscarinic acetylcholine receptors. Pharmacol. Rev. 1998;50:279–290. [PubMed] [Google Scholar]
- 25.Fucile S. Ca2+ permeability of nicotinic acetylcholine receptors. Cell Calcium. 2004;35:1–8. doi: 10.1016/j.ceca.2003.08.006. [DOI] [PubMed] [Google Scholar]
- 26.Santistevan N.J., Nelson J.C., Ortiz E.A., Miller A.H., Kenj Halabi D., Sippl Z.A., Granato M., Grinblat Y. cacna2d3, a voltage-gated calcium channel subunit, functions in vertebrate habituation learning and the startle sensitivity threshold. PLoS One. 2022;17:e0270903. doi: 10.1371/journal.pone.0270903. [DOI] [PMC free article] [PubMed] [Google Scholar]
- 27.Lin-Moshier Y., Sebastian P.J., Higgins L., Sampson N.D., Hewitt J.E., Marchant J.S. Re-evaluation of the role of calcium homeostasis endoplasmic reticulum protein (CHERP) in cellular calcium signaling. J. Biol. Chem. 2013;288:355–367. doi: 10.1074/jbc.M112.405761. [DOI] [PMC free article] [PubMed] [Google Scholar]
- 28.Jiang D., Zhao L., Clapham D.E. Genome-wide RNAi screen identifies Letm1 as a mitochondrial Ca2+/H+ antiporter. Science. 2009;326:144–147. doi: 10.1126/science.1175145. [DOI] [PMC free article] [PubMed] [Google Scholar]
- 29.Tamai S., Iida H., Yokota S., Sayano T., Kiguchiya S., Ishihara N., Hayashi J.I., Mihara K., Oka T. Characterization of the mitochondrial protein LETM1, which maintains the mitochondrial tubular shapes and interacts with the AAA-ATPase BCS1L. J. Cell Sci. 2008;121:2588–2600. doi: 10.1242/jcs.026625. [DOI] [PubMed] [Google Scholar]
- 30.Dong X.P., Cheng X., Mills E., Delling M., Wang F., Kurz T., Xu H. The type IV mucolipidosis-associated protein TRPML1 is an endolysosomal iron release channel. Nature. 2008;455:992–996. doi: 10.1038/nature07311. [DOI] [PMC free article] [PubMed] [Google Scholar]
- 31.Wang W., Gao Q., Yang M., Zhang X., Yu L., Lawas M., Li X., Bryant-Genevier M., Southall N.T., Marugan J., et al. Up-regulation of lysosomal TRPML1 channels is essential for lysosomal adaptation to nutrient starvation. Proc. Natl. Acad. Sci. USA. 2015;112:E1373–E1381. doi: 10.1073/pnas.1419669112. [DOI] [PMC free article] [PubMed] [Google Scholar]
- 32.Li R.J., Xu J., Fu C., Zhang J., Zheng Y.G., Jia H., Liu J.O. Regulation of mTORC1 by lysosomal calcium and calmodulin. Elife. 2016;5:e19360. doi: 10.7554/eLife.19360. [DOI] [PMC free article] [PubMed] [Google Scholar]
- 33.Schubert D., Klein M.C., Hassdenteufel S., Caballero-Oteyza A., Yang L., Proietti M., Bulashevska A., Kemming J., Kühn J., Winzer S., et al. Plasma cell deficiency in human subjects with heterozygous mutations in Sec61 translocon alpha 1 subunit (SEC61A1) J. Allergy Clin. Immunol. 2018;141:1427–1438. doi: 10.1016/j.jaci.2017.06.042. [DOI] [PMC free article] [PubMed] [Google Scholar]
- 34.Hoffman N.E., Chandramoorthy H.C., Shanmughapriya S., Zhang X.Q., Vallem S., Doonan P.J., Malliankaraman K., Guo S., Rajan S., Elrod J.W., et al. SLC25A23 augments mitochondrial Ca2⁺ uptake, interacts with MCU, and induces oxidative stress-mediated cell death. Mol. Biol. Cell. 2014;25:936–947. doi: 10.1091/mbc.E13-08-0502. [DOI] [PMC free article] [PubMed] [Google Scholar]
- 35.Venturi E., Mio K., Nishi M., Ogura T., Moriya T., Pitt S.J., Okuda K., Kakizawa S., Sitsapesan R., Sato C., Takeshima H. Mitsugumin 23 forms a massive bowl-shaped assembly and cation-conducting channel. Biochemistry. 2011;50:2623–2632. doi: 10.1021/bi1019447. [DOI] [PMC free article] [PubMed] [Google Scholar]
- 36.Gerndt S., Chen C.C., Chao Y.K., Yuan Y., Burgstaller S., Scotto Rosato A., Krogsaeter E., Urban N., Jacob K., Nguyen O.N.P., et al. Agonist-mediated switching of ion selectivity in TPC2 differentially promotes lysosomal function. Elife. 2020;9:e54712. doi: 10.7554/eLife.54712. [DOI] [PMC free article] [PubMed] [Google Scholar]
- 37.Zhang X., Chen W., Li P., Calvo R., Southall N., Hu X., Bryant-Genevier M., Feng X., Geng Q., Gao C., et al. Agonist-specific voltage-dependent gating of lysosomal two-pore Na(+) channels. Elife. 2019;8:e51423. doi: 10.7554/eLife.51423. [DOI] [PMC free article] [PubMed] [Google Scholar]
- 38.Shi J., Mori E., Mori Y., Mori M., Li J., Ito Y., Inoue R. Multiple regulation by calcium of murine homologues of transient receptor potential proteins TRPC6 and TRPC7 expressed in HEK293 cells. J. Physiol. 2004;561:415–432. doi: 10.1113/jphysiol.2004.075051. [DOI] [PMC free article] [PubMed] [Google Scholar]
- 39.Warnes G.R., Bolker B., Bonebakker L., Gentleman R., Huber W., Liaw A., Lumley T., Maechler M., Magnusson A., Moeller S. gplots: Various R programming tools for plotting data. R package version. 2009;2:1. [Google Scholar]
- 40.Barretina J., Caponigro G., Stransky N., Venkatesan K., Margolin A.A., Kim S., Wilson C.J., Lehár J., Kryukov G.V., Sonkin D., et al. The Cancer Cell Line Encyclopedia enables predictive modelling of anticancer drug sensitivity. Nature. 2012;483:603–607. doi: 10.1038/nature11003. [DOI] [PMC free article] [PubMed] [Google Scholar]
Associated Data
This section collects any data citations, data availability statements, or supplementary materials included in this article.
Supplementary Materials
The MATLAB script is written to extract the area under the curve values for irregularly responding cells.
The R script used to evaluate channel capacity by evaluating the residual distribution for peaks with similar heights.
Data Availability Statement
Data: All data reported in this paper can be requested from the lead contact.
Code: The new code used to analyze traces of irregularly responding cells is provided in the current manuscript as Methods S1 and S2 files.
Other items: Any additional information required to reanalyze the data reported in this paper is available from the lead contact upon request.