

Summary
The differentiation of human pluripotent stem cells into the SOX17+ definitive endoderm (DE) germ layer is important for generating tissues for regenerative medicine. Multiple developmental and stem cell studies have demonstrated that Activin/Nodal signaling is the primary driver of definitive endoderm formation. Here, we uncover that the FGF2-FGFR-ERK1/2 signaling contributes to mesendoderm and SOX17+ DE formation. Without ERK1/2 signaling, the Activin/Nodal signaling is insufficient to drive mesendoderm and DE formation. Besides FGF2-FGFR-mediated signaling, IGF1R signaling possibly contributes to the ERK1/2 signaling for DE formation. We identified a temporal relationship between Activin/Nodal-SMAD2 and FGF2-FGFR-ERK1/2 signaling in which Activin/Nodal-SMAD2 participates in the initiation of mesendoderm and DE specification that is followed by increasing activity of FGF2-FGFR-ERK1/2 to facilitate and permit the successful generation of SOX17+ DE. Overall, besides the role of Activin/Nodal signaling for DE formation, our findings shed light on the contribution of ERK1/2 signaling for mesendoderm and DE formation.
Subject areas: Biological sciences, Molecular biology, Developmental biology, Embryology
Graphical abstract
Highlights
-
•
FGF2 potentiates mesendoderm and DE formation through FGFR2 and ERK1/2 signaling
-
•
ERK1/2 signaling is involved in cell cycle process
-
•
IGF1R- but not IR-mediated ERK1/2 signaling also contributes to DE formation
-
•
Increased pSMAD2 on inhibition of FGFR2-ERK1/2 signaling fails to direct DE formation
Biological sciences; Molecular biology; Developmental biology; Embryology
Introduction
Human embryonic stem cells (hESCs) and human induced pluripotent stem cells (hiPSCs), collectively known as human pluripotent stem cells (hPSCs), have the potential to be differentiated into nearly all cell types of the body. Therefore, the differentiation of hPSCs provides an exceptional opportunity to understand early human embryonic development and a potential to generate cells, tissues, or organs for replacement therapy. The definitive endoderm (DE) germ layer, which gives rise to key organs such as the pancreas and liver, is one tissue that has attracted a lot of attention to date.
Research in the past decade has placed Activin/Nodal signaling as the main cardinal driver of DE formation from hPSCs.1,2,3 A high level of Activin/Nodal signaling, typically initiated by 100 ng/mL Activin A in vitro, is sufficient to drive DE formation. Additional factors such as WNT or BMP signaling have also been established to boost the efficiency of DE formation from hPSCs.1,4 Beyond growth factor-mediated Activin/Nodal, WNT and BMP signaling, intracellular downstream PI3K/AKT5,6 and MAPK7,8 signaling pathways have also been implicated in DE formation. These additional signaling pathways are typically deemed to be supplementary as compared to the primary Activin/Nodal signaling.
Here, we used common small molecule inhibitors to refine the mechanisms by which PI3K inhibition maximizes Activin A-induced DE formation. Importantly, we found FGF2-FGFR-mediated ERK1/2 signaling to further potentiate mesendoderm and DE formation in the presence of Activin A, WNT signaling activation and PI3K inhibition. RNA sequencing (RNA-Seq) analyses on day 3 of differentiation revealed that FGFR or ERK2 inhibition is sufficient to abrogate DE formation, even in the presence of a high dose of Activin A, indicating that ERK1/2 signaling contributes to DE formation. Subsequent interrogation of the insulin receptor (IR)- and insulin-like growth factor 1 receptor (IGF1R)-mediated ERK1/2 signaling with well-established small molecule inhibitors suggested that IGF1R but not IR possibly contributed to the ERK1/2 signaling for DE formation. Despite a compensatory increase in pSMAD2 (Activin/Nodal signaling) on FGFR or ERK2 inhibition, this was insufficient to increase SOX17 expression, indicating a previously underappreciated ERK1/2 signaling that contributes to DE formation. Overall, we demonstrate temporal dynamics led by Activin/Nodal-SMAD2 signaling participating in the initiation of mesendoderm specification that is followed by the FGF2-FGFR-ERK1/2 signaling that leads to successful generation of SOX17+ DE cells. Therefore, besides the Activin/Nodal signaling that drives DE formation, we highlight the contribution of ERK1/2 signaling for the formation of this germ layer.
Results
Titration of PI3K inhibitors to maximize Activin A-induced DE formation
The suppression of phosphoinositide 3-kinase (PI3K)/AKT signaling is known to be important for Activin A-induced DE formation.5 LY294002, a reversible PI3K inhibitor, is typically used. Wortmannin, an irreversible PI3K inhibitor, has also been used to generate DE,9 albeit infrequently. Therefore, we first set out to compare the efficiency of these two commonly used PI3K inhibitors on Activin and CHIR99021-induced DE formation.4 Western blot analyses revealed that pAKT levels are already low or undetectable in the presence of 100 ng/mL (high) Activin and 3 μM CHIR99021 (formation of DE) as compared to undifferentiated hPSCs (Figure S1A). Of interest, 10–20 μM LY294002 or 1–5 μM wortmannin elicited maximal SOX17 endoderm marker protein expression whereas higher doses appeared to be detrimental for cell survival and SOX17+ DE formation (Figures S1A and S1B). Both PI3K inhibitors effectively suppressed OCT4 but not SOX2 pluripotency factor (Figure S1A).
Next, we turned to transcriptional analyses. Both LY294002 and wortmannin effectively suppressed OCT4 pluripotency transcript but not SOX2 or NANOG, suggesting that the effects of PI3K inhibition are mainly directed at OCT4 which functions upstream in maintaining pluripotency (Figure S1C). Further analyses on mesendoderm markers EOMES and MIXL1, and DE marker SOX17 revealed slightly higher gene expression levels achieved by 10–20 μM LY294002 as compared to 1–5 μM wortmannin (Figure S1C). Based on these results, we chose to use 10 μM LY294002 to complement Activin and CHIR99021 in the subsequent experiments for DE formation.
FGF2-FGFR signaling further potentiates DE derivation with PI3K inhibition
PI3K inhibition resulted in higher levels of SOX17 protein expression when supplemented to Activin and CHIR99021 treatment (Figure S1A). To determine whether exogenous FGF treatment would have further positive effects on DE differentiation, we added 10–30 ng/mL FGF2 to the basal condition (100 ng/mL Activin, 3 μM CHIR99021 and 10 μM LY294002; abbreviated as ACLY). Exogenous FGF2 treatment resulted in a further increase in pluripotency factor NANOG,10 mesendoderm markers EOMES and MIXL1, and DE marker SOX17 transcript (Figure 1A), indicating that additional FGF signaling can potentiate DE differentiation by day 3. Western blot analyses confirmed that exogenous FGF2 increased ERK1/2 phosphorylation (pERK1/2) but not pAKT, and importantly, SOX17 protein expression (Figure 1B). These data indicated that FGF signaling additionally drives DE formation in the presence of Activin/Nodal and WNT signaling, and PI3K/AKT pathway inhibition (ACLY).
Figure 1.

FGF2-FGFR signaling is involved in DE formation
(A) Expression of pluripotency markers OCT4, SOX2, NANOG, mesendoderm markers EOMES, MIXL1 and DE markers CXCR4 and SOX17 on FGF2 supplementation at 10, 20 or 30 ng/mL (F10 – 30) in hPSCs differentiated into D3 DE using 100 ng/mL Activin A (A100), 3 μM CHIR99021 (C3) and 10 μM LY294002 (LY10). Gene expression is normalized to ACLY control. N=3 independent experiments were performed.
(B) Western blot assessment of proteins involved in D3 DE differentiation on FGF2 supplementation (F10 – 30). N=5 independent experiments were performed.
(C) Expression of FGF receptors (FGFR1, FGFR3, FGFR4, FGFR2, FGFR2IIIb, and FGFR2IIIc) across three days of DE differentiation. Gene expression is normalized to undifferentiated hPSCs (UD).
(D) Western blot assessment of FGFR2 protein expression across three days of DE differentiation. N=3 independent experiments were performed.
(E) Expression of FGF receptors (FGFR1, FGFR3, FGFR4, FGFR2, FGFR2IIIb, and FGFR2IIIc) on 30 ng/mL FGF2 (F30) or 10 μM SU5402 (SU) supplementation in hPSCs differentiated into D3 DE. Gene expression is normalized to UD. N=3 independent experiments were performed. All error bars in Figure 1 indicate standard error of mean of biological replicates. One-way ANOVA and Dunnett’s post-hoc tests were used for statistical analyses. Asterisk (∗) indicates p < 0.05 against each control group respectively. H9 hESCs were used for all experiments in Figure 1. “See also Figure S1.”
To identify the receptor through which exogenous FGF2 supplementation acts on, we evaluated the transcript expression of FGFR1, FGFR2, FGFR3 and FGFR4 during DE differentiation. Amongst the four FGF receptors, FGFR2 transcript and its isoform FGFR2IIIc exhibited the highest upregulation by day 3 of DE differentiation (Figure 1C). Western blot analyses further confirmed that FGFR2 protein peaked in expression by day 3 of DE differentiation (Figure 1D), coinciding with the peak protein expression of pERK1/2 and SOX17 on day 3 (Figure 1B). Furthermore, the inhibition of FGFR activity with SU5402 (SU) in ACLY condition resulted in a compensatory increase in FGFR2, FGFR2IIIb and FGFR2IIIc but not FGFR1, FGFR3 or FGFR4 transcripts (Figure 1E), confirming the importance of FGFR2-mediated signaling in DE formation.
FGF drives DE formation through FGFR and ERK1/2 signaling
To confirm that FGFR-mediated signaling is indeed important for SOX17+ DE formation, we performed western blot analyses on ACLY ±30 ng/mL FGF2 (ACLYF30) ± 10 μM SU5402 (ACLYSU). Strikingly, the inhibition of FGFR activity with the well-established 10 μM SU5402 (SU) resulted in a strong reduction of SOX17 transcript and protein expression (Figures 2A and 2D–2G) even in the presence of Activin at 100 ng/mL, indicating that the FGFR-mediated signaling is important for DE formation.
Figure 2.

FGF drives DE formation through FGFR and ERK1/2 signaling
Western blot assessment of proteins involved in D3 DE differentiation on (A) F30 or F30SU supplementation or (B) ERK inhibitor (ERKi) supplementation (10–20 μM). N=3 independent experiments were performed.
(C) Morphology of cells at the end of D3 DE differentiation. Scale bar: 100 μm.
(D) Immunostaining for SOX17 DE protein (green) in hPSCs differentiated into D3 DE with AC, ACLY, ACLYF30, ACLYF30SU or ACLYF30ERKi. DAPI (blue) stains for nuclei. Scale bar: 100 μm.
(E) The percentage of SOX17+ DE cells (green) in hPSCs differentiated into D3 DE with AC, ACLY, ACLYF30, ACLYF30SU or ACLYF30ERKi. Cell count from at least three images was tabulated for each treatment condition. Asterisk (∗) indicates p < 0.05 against ACLY. N=3 independent experiments were performed.
(F) Expression of mesendoderm markers EOMES, MIXL1 and DE marker SOX17 on F30, F30SU or F30ERK inhibitor supplementation in hPSCs differentiated into D3 DE. Gene expression is normalized to UD. N=3 independent experiments were performed.
(G) Flow cytometry assessment of cells co-expressing EOMES and SOX17 on day 3 under AC, ACLY, ACLYF30, ACLYSU or ACLYERKi differentiation condition. One-way ANOVA and Dunnett’s post-hoc tests were used for statistical analyses. All error bars indicate standard error of mean of biological replicates. Asterisk (∗) indicates p < 0.05 against F30. H9 hESCs were used for all experiments in Figure 2. “See also Figures S2 and S3.”.
Next, we wanted to pinpoint the final molecular effector (instead of the intermediate MEK1/2) within the FGF signaling pathway directly responsible for regulating SOX17 protein expression. A closer look at the total ERK1/2 levels consistently reflected an increased expression in DE cells as compared to undifferentiated cells (Figures 1B and 2A). This led us to hypothesize the importance of ERK1/2 in DE formation. To this end, we cloned several shRNAs targeting ERK1/2 (Refer to Table S6). Despite repeated efforts, we only managed to knock down ERK2 protein marginally, and this led to a decrease in SOX17 protein expression (Figure S2A). We then turned to the use of ERK1/2 chemical inhibitors and found a chemical inhibitor TCS ERK 11e to be able to specifically inhibit the expression of total ERK2 (identified as VTX-11e in11). Increasing amounts of this ERK2 inhibitor (10–20 μM) resulted in a compensatory increase in pERK1/212 which incidentally had no impact on SOX17 protein expression (Figure 2B). This increase in pERK1/2 expression on treatment with the ATP-competitive TCS ERK 11e has been reported to be an effect of feedback activation and hence does not correlate with ERK pathway output.13 Therefore, the inhibition of ERK2 seems to completely abolish SOX17 protein expression (Figure 2B), indicating that the loss of ERK2 is directly responsible for the lack of SOX17 protein expression, even in the presence of a high dose of Activin which is the classical main driver of DE formation.
Consequently, we sought to compare the effects of FGFR activity inhibitor SU5402 versus ERK2 inhibitor TCS ERK 11e on day 3 DE formation. Brightfield images demonstrated detrimental effects of SU5402 (ACLYF30SU) and TCS ERK 11e (ACLYF30ERKi) on the morphology of the differentiating cells (Figures 2C and S2B). Subsequent immunostaining and quantitative analyses demonstrated that SU5402 drastically decreased the yield of SOX17+ DE cells to ∼30% whereas TCS ERK 11e was more potent in abolishing SOX17+ DE cells to ∼10% (Figures 2D and 2E). The SOX17+ DE cells were further assessed via co-staining with EPCAM via flow cytometry and FOXA2 via IHC (Figures S2C and S2D). The importance of FGFR and ERK1/2 signaling for SOX17 protein expression was similarly replicated and confirmed in two other independent control hiPSC lines i70b and iAGb (Figures S2E and S2F).
QPCR and flow cytometry analyses indicated that both SU5042 and TCS ERK 11e abolished the transcript expression of mesendoderm markers EOMES and MIXL1, and DE marker SOX17 (Figures 2F and 2G). Consistently, we observed a dosage-dependent increase in EOMES transcript expression when the cells were treated with increasing concentrations of FGF2 (Figures 1A and S3A). The knockdown of FGFR2 using siRNA resulted in a downregulation of EOMES transcript expression (Figure S3B). We then compared EOMES protein expression on days 1 and 3 on SU5402 or TCS ERK 11e treatment, and observed a lower expression of EOMES when FGFR or ERK1/2 signaling was inhibited (Figure S3C). As day 1 marks the stage for mesendoderm formation, our finding is consistent with previous study that FGFR-ERK1/2 signaling is involved in regulating the expression of EOMES which plays a key role in specifying mesendoderm formation.14 Together, we demonstrated that the FGFR-ERK1/2 signaling participates in mesendoderm formation on day 1 and continues to play an important role to permit DE formation by day 3.
Genome-wide RNA-Seq analyses reveal that FGFR and ERK2 inhibitors potently perturb cell cycle and cell fate specification even in the presence of DE-inducing conditions
Activin/Nodal signaling is classically the main driver of DE formation.15 To confirm that FGFR-ERK1/2 signaling contributes to DE formation and to address the global effects of FGFR and/or ERK1/2 inhibition on ACLY-induced DE formation, we performed genome-wide RNA-Seq analyses (Table S1). Global gene expression heatmap (Figure S4) and principal component analysis (PCA) confirmed that the replicates for each tested condition clustered tightly (Figure 3A), indicating technical and biological reproducibility. As expected, ACLY (100 ng/mL Activin + 3 μM CHIR99021 + 10 μM LY294002) and ACLYF30 (ACLY + 30 ng/mL FGF2) samples clustered close to each other but were non-overlapping, indicating transcriptional similarity between the two groups. Conversely, ACLYSU (ACLY + 10 μM SU5402) and ACLYERKi (ACLY + 10 μM TCS ERK 11e) samples clustered away from each other, from undifferentiated hPSCs (UD), ACLY and ACLYF30 samples, indicating that the inhibition of FGFR or ERK1/2 had a huge impact on redirecting DE cell fate despite the presence of DE-coercing Activin/Nodal signaling (Figure 3A).
Figure 3.

Genome-wide RNA-Seq analyses reveal that FGFR and ERK2 inhibitors potently perturb cell cycle and cell fate specification even in the presence of DE-inducing conditions
(A) Principal component analysis (PCA) of the various cell populations at the end of differentiation.
(B) Volcano plots of differentially expressed gene comparison between cell populations – ACLY against undifferentiated cells (UD), ACLYF30 against ACLY, ACLYSU against ACLY and ACLYERKi against ACLY. Fold change >1.5; p < 0.05; q < 0.05.
(C) Heatmap of the gene expression of representative pluripotency and definitive endoderm markers across undifferentiated cells (UD), ACLY-, ACLYF30-, ACLYSU- and ACLYERKi-treated cells.
(D) Expression of pluripotency markers OCT4, SOX2, and NANOG on F30, SU or ERK inhibitor supplementation in hPSCs differentiated into D3 DE. Gene expression is normalized to UD. N=3 independent experiments were performed.
(E) Heatmap of the gene expression of representative mesoderm and neuroectoderm markers across undifferentiated cells (UD), ACLY-, ACLYF30-, ACLYSU- and ACLYERKi-treated cells. Colors in the heatmap illustrate gene expression in units of standard deviation from the mean across samples (red: upregulation; blue: downregulation).
(F) Expression of mesoderm markers HAND1, FOXF1 and neuroectoderm marker PAX6 on SU supplementation in hPSCs differentiated into D3 DE. Gene expression is normalized to UD. N=3 independent experiments were performed.
(G) Gene ontology (GO) biological process analysis of the genes that are downregulated in ACLYERKi-against ACLY-treated DE cells.
(H) Expression of G1/S phase gene CCND1 and M phase gene RAD51 on ERK inhibitor supplementation in hPSCs differentiated into D3 DE. Gene expression is normalized to UD. N=3 independent experiments were performed. One-way ANOVA and Dunnett’s post-hoc tests were used for statistical analyses in Figure 3D; Unpaired t-test, two-tailed, was used in Figures 3F and 3H. All error bars indicate standard error of mean of biological replicates. Asterisk (∗) indicates p < 0.05 against ACLY. H9 hESCs were used for all experiments in Figure 3. “See also Figures S4 and S5.”.
A comparison between ACLY-induced DE (ACLY) and undifferentiated hPSCs (UD) using volcano plot first revealed 1893 protein coding transcripts (as determined by ENSEMBL) to be upregulated and 2010 transcripts to be downregulated (fold change (FC) > 1.5; p < 0.05; q < 0.05) (Figure 3B). Reassuringly, DE genes CXCR4, SOX17 and FOXA2 were upregulated 2.2, 4.3 and 5.2-fold respectively whereas pluripotency genes OCT4, SOX2 and NANOG were downregulated 5.7, 1.6 and 19.7-fold respectively (Figure 3C and Table S2). Gene ontology (GO) biological process (BP) analyses simply reflected an increase in genes involved in organismal system development and organ morphogenesis (Figure S5A) whereas molecular function analyses reflected an increase in DNA and transcription factor binding activity (Figure S5B).
Next, our comparison between ACLYF30 and ACLY revealed only 52 transcripts to be upregulated and 44 transcripts to be downregulated (FC > 1.5; p < 0.05; q < 0.05) (Figure 3B and Table S3). Amongst the 52 transcripts additionally upregulated by FGF2 in the background of ACLY, we found MFAP4, ASNS, VWF, NBL1, EOMES, TNFRSF11B, CYP26A1, FZD5 and SLC7A5 transcripts to be upregulated 4.5, 2.2, 1.9, 1.8, 1.8, 1.7, 1.6, 1.6 and 1.5-fold respectively (Table S3). We have previously found MFAP4, VWF, NBL1, EOMES, TNFRSF11B, CYP26A1, FZD5 and SLC7A5 transcripts to be upregulated by Activin + BMP4 + FGF2 + LY294002 as compared to undifferentiated hESCs.14 MFAP4, ASNS, VWF, EOMES and CYP26A1 transcripts have also been previously reported by us to be upregulated by Activin and BMP4-induced DE as compared to Activin A alone.1 Of note, EOMES is already a well-established DE determinant gene.14 Another DE marker MIXL1 was also differentially upregulated 1.5-fold (p < 0.05; q = 0.87) in ACLYF30 as compared to ACLY condition. The recurring DE-related genes MFAP4, VWF and CYP26A1 could play yet-to-be-explored novel roles in DE formation (out of scope in the current study).
Our subsequent comparison between ACLYSU and ACLY revealed 1137 transcripts to be upregulated and 682 transcripts to be downregulated (FC > 1.5; p < 0.05; q < 0.05) (Figure 3B and Table S4). Indeed, SU5402 treatment in ACLY condition elicited a 2.4-fold increase in FGFR2 transcript (Table S4), corroborating our prior observations (Figure 1E). Amongst the 682 downregulated transcripts, we found pluripotency gene OCT4 to be consistently downregulated, suggesting that ACLYSU is more effective than ACLY in driving differentiation (Figures 3C and 3D). Triage of the gene list revealed DE genes MIXL1, EOMES, CXCR4, SOX17, and FOXA2 (Figure 3C) and the presence of some mesoderm genes such as T, TBX6 and MESP1, and neuroectoderm genes such as SOX1, GBX2, and SIP1/ZEB2 (Figure 3E). Reciprocally, when we evaluated the upregulated gene list, we found an upregulation of mesodermal genes HAND1 and FOXF1, and ectodermal gene PAX6 transcripts (Figure 3F), but no clear trend pertaining to any specific tissue or organ. GO biological process analyses only revealed a general upregulation of multicellular organismal developmental processes (Figure S5C). Nonetheless, our observation that FGFR inhibition with SU5402 totally abrogated DE marker gene expression in the presence of optimal and favorable DE-inducing ACLY conditions (Figure 3B) indicated that FGFR-mediated signaling contributes to DE formation.
To elucidate this mechanism further, we evaluated the effects of ACLYERKi as compared to ACLY. We found that the inhibition of ERK2 in ACLY conditions resulted in an upregulation of 1394 transcripts and a downregulation of 1144 transcripts (FC > 1.5; p < 0.05; q < 0.05) (Figure 3B and Table S5). We continued to observe a downregulation of DE genes MIXL1, EOMES, CXCR4, SOX17 and FOXA2, corroborating our ACLYSU dataset (Figure 3C, Tables S4 and S5). GO biological process analyses indicated that multicellular organismal developmental processes were upregulated (Figure S5D), just as observed for ACLYSU (Figure S5C). More interestingly, GO BP analyses indicated that cell cycle processes were generally downregulated (Figure 3G). Given that the cell cycle state has been strongly linked to DE cell fate determination where SMAD2/3 is involved in the early G1 phase,16 our data now implicate ERK1/2 signaling in cell cycle processes as well. QPCR validation then confirmed that the G1/S phase gene CCND1 and M phase gene RAD51 were consistently downregulated in ACLYERKi versus ACLY samples (Figure 3H). The fact that this was not evident in the ACLYSU versus ACLY GO BP analyses reflect specific mechanistic involvement of ERK1/2 in DE cell fate determination.
Taken together, our RNA-Seq data demonstrate that the cells induced by ACLYSU or ACLYERKi are no longer pluripotent (Figure 3C). FGFR and/or ERK2 inhibitors have strongly disturbed cell fate specification, totally overriding the DE-inducing conditions elicited by a high dose of Activin, optimal Wnt signaling and the inhibition of PI3K/AKT signaling.
Insulin-like growth factor 1 receptor (IGF1R) but not insulin receptor (IR)-mediated ERK1/2 signaling possibly contributes to DE formation
Following our observations that FGFR activity inhibitor exhibited less drastic effects than ERK2 inhibition on DE formation, we hypothesized that there are other receptors that could be contributing to the downstream ERK1/2 signaling for DE differentiation. One attractive candidate is the IR and/or insulin-like growth factor 1 receptor (IGF1R) signaling pathway that signals through the MAPK pathway to regulate cellular differentiation.17
Timecourse analyses during DE differentiation reflected that IR-B and IGF1R transcripts increased by day 3 of differentiation as per DE genes CXCR4 and SOX17 (Figure 4A). However, western blot analyses indicated that IGF1R but not IR protein increased in expression by day 3, similar to the trend of SOX17 (Figure 4B) and FGFR2 protein (Figures 1C and 1D). The upregulation of pERK1/2 along with DE differentiation (Figure 4B) corresponded with the increase in IGF1R expression, suggesting its activation played a role in DE formation.
Figure 4.

IGF1R but not IR-mediated ERK1/2 signaling also contributes to DE formation
(A) Expression of IR-A, IR-B, IGF1R, mesendoderm markers EOMES, MIXL1 and DE markers CXCR4 and SOX17 across three days of DE differentiation. Gene expression is normalized to UD. Asterisk (∗) indicates p < 0.05 against UD. Western blot assessment of IR, IGF1R, pERK1/2, total ERK1/2, SOX17 and ACTIN protein expression (B) across three days of DE differentiation, (C) on IR and IGF1R inhibitor OSI-906 supplementation at 0.5, 1.0 or 1.5 μM, or (D) on IR-specific inhibitor S961 supplementation at 200, 400 or 600 μM.
(E) Expression of mesendoderm markers EOMES, MIXL1 and DE markers CXCR4 and SOX17 on IGF1R inhibitor PPP supplementation at 0.5, 1 or 1.5 μM in hPSCs differentiated into D3 DE. Gene expression is normalized to ACLY control. At least N=3 independent experiments were performed for Figures 4B–4E. One-way ANOVA and Dunnett’s post-hoc tests were used for statistical analyses in Figures 4A and 4E. All error bars indicate standard error of mean of biological replicates. Asterisk (∗) indicates p < 0.05 against ACLY. H9 hESCs were used for all experiments in Figure 4. “See also Figure S6.”.
IGF1R and IR share multiple intracellular partners (e.g., IRS1) and several signaling pathways including PI3K/AKT and MAPK signaling. IGF1R and IR form homodimers and/or complex with each other to activate downstream signaling. To first elucidate if IR and/or IGF1R (homodimers and heterodimers) contribute to DE formation, we used an established small molecule inhibitor OSI-906 at a high concentration (0.5, 1 and 1.5 μM) to selectively inhibit downstream signaling of both receptors.18 Western blot analyses indicated that SOX17 protein expression is downregulated but not abolished, suggesting a partial involvement of either of these receptors in DE formation (Figure 4C). We observed a dose-responsive upregulation of IGF1R protein on inhibition by OSI-906 (Figure 4C), prompting us to further investigate the role of IGF1R signaling in DE formation.
To delineate whether IR or IGF1R is contributing to ERK1/2 signaling for DE formation, we then used selective inhibitors S96119 or picropodophyllin (PPP)20 to inhibit IR or IGF1R activity respectively. Similar to the dual inhibition of IR and IGF1R with OSI-906, the antagonism of IR signaling with S961 also resulted in an increase in IGF1R protein expression (Figure 4D), again suggesting the importance of IGF1R in DE formation. However, there was no decrease in SOX17 protein expression with the inhibition of IR signaling. On the contrary, SOX17 expression was upregulated with S961 treatment which correlated with the increase in IGF1R expression (Figure 4D). Last but not least, the antagonism of IGF1R activity with PPP resulted in a significant downregulation of SOX17 gene expression (Figure 4E). We tried using shRNAs but the knock down of IGF1R was challenging and the protein expression of IGF1R was only mildly affected (Figure S6A). The addition of IGF1 or IGF1 with FGF2 did not further increase IGF1R expression, pERK1/2 signaling and DE formation (Figures S6B–S6D). Collectively, our data implicate the involvement of IGF1R- but not IR-signaling that complements FGFR signaling in directing DE cell fate.
Compensatory upregulation of SMAD2 phosphorylation on inhibition of FGFR-ERK1/2 signaling pathway fails to direct SOX17+ DE formation
Both the inhibition of FGFR with SU5402, and ERK2 with TCS ERK 11e led to the abrogation of SOX17 DE protein despite a high dose of Activin at 100 ng/mL added to the differentiation media. We performed timecourse evaluation of FGF-ERK and Activin/Nodal signaling to test their importance in DE differentiation. Inhibition of ERK2 signaling with TCS ERK 11e prevented the expression of mesendoderm (EOMES and MIXL1) and DE (SOX17 and FOXA2) markers at all treatment time-points (D0-D3, D1-D3 and D2-D3) (Figure 5A). In a similar manner, the inhibition of Activin/Nodal signaling with a potent Activin type I receptor inhibitor SB43154214,21 also demonstrated a significant downregulation of mesendoderm and DE markers (Figure 5B). These observations suggest a synergistic relationship between ERK and Activin/Nodal signaling in driving mesendoderm and DE formation. A gradual increase in pERK1/2 activity has been observed during the course of DE differentiation (Figure 4B). To understand the temporal expression of signaling pathways in DE formation, we assessed the expression of Activin/Nodal-mediated SMAD2 phosphorylation (hereafter referred to as pSMAD2), the main driver of DE formation.15,22
Figure 5.

Compensatory upregulation of pSMAD2 on inhibition of FGFR-ERK1/2 signaling pathway fails to direct SOX17+ DE formation
Expression of mesendoderm markers EOMES, MIXL1 and DE markers CXCR4, SOX17 and FOXA2 across three days of DE differentiation with (A) ERK inhibitor (ERKi) or with (B) Activin/Nodal signaling inhibitor SB431542 (SB) for a treatment duration of D0-D3 (D0), D1-D3 (D1) and D2-D3 (D2). Gene expression is normalized to ACLY control on D3. Asterisk (∗) indicates p < 0.05 against control. Western blot assessment of pSMAD2, tSMAD2/3, pERK1/2, total ERK1/2, SOX17 and ACTIN protein expression (C) across three days of DE differentiation, (D) on SU or ERK inhibitor supplementation at 1, 5 or 10 μM, or (E) on FGF2 (F10 – 30 ng/mL), 10 μM ERKi or 10 μM SU supplementation.
(F) Time-point assessment of protein expression comparing day 1 and day 3 of DE differentiation on SU or EKR inhibitor supplementation at 10 μM. At least N=3 independent experiments were performed for Figures 5A–5D. H9 hESCs were used for all experiments in Figure 5.
We first harvested differentiating cells at four time points (D0, D1, D2 and D3) to assess pSMAD2 protein expression. pSMAD2 expression peaks on day 1 and decreases with time (Figure 5C), confirming that pSMAD2 is involved in the initiation of DE differentiation. However, SOX17 protein is only beginning to be expressed when the expression of FGFR2 and pERK1/2 protein is increased from day 2–3 (Figures 1D, 4B, and 5C).
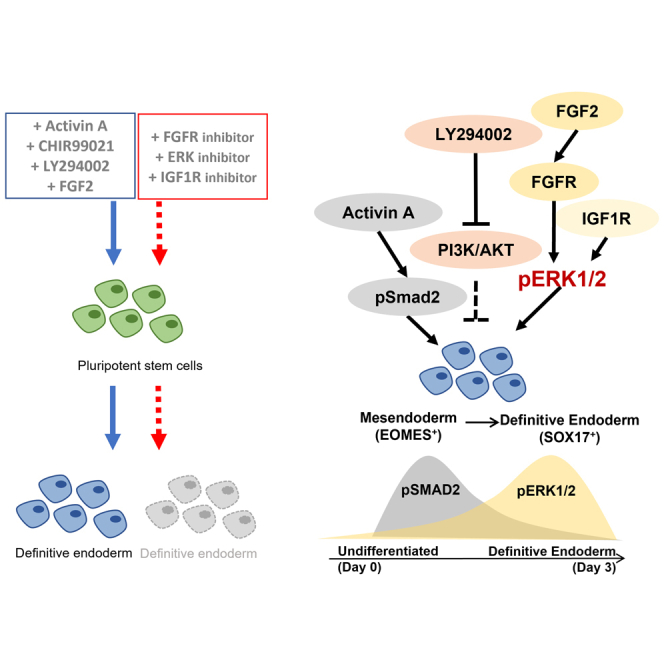
Of interest, our western blot analyses revealed that an increasing dose of FGFR inhibitor SU5402 or ERK2 inhibitor TCS ERK 11e led to a dose-dependent increase in pSMAD2 protein levels indicative of an active Activin/Nodal signaling (Figure 5D). Despite this increase, SOX17 protein was not upregulated (Figure 5D), indicating that this compensatory increase in pSMAD2 signaling is insufficient to drive SOX17+ DE formation and that the lack of FGFR-ERK1/2 signaling accounts for the failure to generate SOX17+ DE cells. In fact, the addition of exogenous FGF2 to ACLY DE differentiation conditions led to slightly lower pSMAD2 protein levels (Figure 5E). Additional assessments on the time dependency of FGF2-FGFR-ERK1/2 signaling inhibition comparing day 1 and day 3 demonstrated the deficiency of mesendoderm formation which then perturbed DE formation (Figure 5F). Similarly, pSMAD2 expression was higher on day 1 and lower on day 3 (Figure 5F). We demonstrated that both Activin/Nodal and ERK2 signaling are required for the expression of mesendoderm and DE markers (Figure 5A). Coupled with the observation that pSMAD2 peaks on day 1 (Figure 5C) as compared to pERK1/2 on day 3 (Figures 4B and 5C) of differentiation, this could suggest a temporal transition of Activin/Nodal (high to low) and FGF-FGFR-ERK1/2 (low to high) activity in initiating mesendoderm and driving DE formation (Figure 6).
Figure 6.

Schematic diagram of the signaling pathways involved in DE formation
Activin/Nodal signaling through pSMAD2 participates in the mesendoderm formation. The inhibition of PI3K maximizes Activin A-induced DE formation. FGFR-ERK signaling is involved in specifying mesendoderm formation through regulating EOMES expression. IGF1R and FGF2-FGFR converge at pERK1/2 signaling to drive the formation of SOX17+ DE past initiation.
Discussion
Here, we performed a series of mechanistic studies to demonstrate a role for FGF2-FGFR-ERK1/2 signaling that contributes to SOX17+ DE formation from hPSCs. ERK signaling has been well-established in its role in antagonizing pluripotency in hESCs and its expression is kept low to permit self-renewal.23,24 The switch toward differentiation is accompanied by an upregulation of ERK signaling,6,25,26 which is consistent with our observation, but the detailed mechanism is yet to be elucidated. Undoubtedly, Activin/Nodal signaling has been well established to be a primary driver of DE formation.27,28 However, our data indicate that the activation of Activin/Nodal signaling with a high dose of Activin at 100 ng/mL is insufficient to successfully drive SOX17+ DE formation when either FGFR or ERK1/2 is inhibited with well-established small molecule inhibitors. This reflects the contribution of FGF2-FGFR-ERK1/2 signaling to DE formation.
Although FGF signaling has been studied extensively in vertebrate development29 and there are hints of its involvement in DE formation,7,23,30 the absolute importance of FGF2-FGFR-ERK1/2 signaling and its mechanistic relationship with Activin/Nodal-pSMAD2 signaling in DE differentiation is unclear, especially in the human system. We unraveled a specific temporal involvement of Activin/Nodal-pSMAD2 in mesendoderm initiation followed by FGF2-FGFR-ERK1/2 in subsequent SOX17+ DE formation. Our data is consistent with the report by Kaitsuka et al. (2017) demonstrating the induction of Sox17 by ERK signaling in mouse ESCs.31 In fact, we have demonstrated that FGF2-FGFR-ERK1/2 signaling participates in mesendoderm formation via the regulation of EOMES expression (Figure S3), consistent with data reported by Zhang et al.8 Furthermore, this is likely the first study to specifically evaluate ERK1/2 signaling (last effector molecule of the MAPK signaling pathway) as several other studies have typically evaluated MAPK signaling via the intermediate MEK1/2 molecule.7,23
PI3K/AKT and ERK1/2 signaling are two major pathways downstream of receptors such as FGFR, IGF1R and IR. The high levels of ERK1/2 and low levels of AKT during DE differentiation imply a specific involvement of the ERK1/2 signaling arm in this differentiation process. Our series of experiments involving the IR and IGF1R also reveal a possible role played by the IGF1R in contributing to the ERK1/2 signaling for SOX17+ DE formation. In agreement with the absence of pAKT signaling during DE differentiation, our PI3K inhibition studies also demonstrate further potentiation of SOX17+ DE formation strengthened by the concurrent downregulation of master regulator OCT4 pluripotency gene.
Through our RNA-Seq analyses and comparisons with previously published datasets on DE differentiation, we now identify MFAP4, VWF and CYP26A1 genes that could possibly play yet-to-be-explored novel roles in DE formation. Further, we also identify ERK1/2 signaling to be involved in cell cycle process during DE differentiation, specifically regulating the expression of G1/S phase gene CCND1 and M phase gene RAD51. Because the cell cycle state of stem cells can affect their differentiation, with hPSCs in early G1 phase differentiating into DE,16 we propose that ERK1/2 may also be involved in the cell cycle regulation of DE formation. These findings will require further effort that is currently out of the scope of this work.
The compensatory increase in pSMAD2 that is insufficient to increase or rescue SOX17 protein expression when either FGFR or ERK2 was inhibited is indeed puzzling. We do not yet understand why this is the case given that pSMAD2/3 is known to bind onto the promoter of the SOX17 gene to regulate its expression.3 This possibly suggests a temporal role for Activin/Nodal-pSMAD2 to initiate DE specification that can be followed through by ERK1/2 signaling for SOX17+ expression. This is supported by the interesting observation that there is lowered expression of pSMAD2 in the presence of increased FGF2, demonstrating a possible counter-regulation between FGF2 and SMAD2 signaling that has yet to be reported.
In conclusion, we describe specific mechanistic events that give rise to proper SOX17+ DE formation from hPSCs. Beyond the prevailing role of Activin/Nodal signaling in DE specification, we also unveil an underappreciated importance of ERK1/2 signaling that contributes to DE formation. Therefore, we propose a two-step signaling event that successfully drives DE differentiation from hPSCs (Figure 6).
Limitations of the study
Besides controlling the fundamental processes such as proliferation and cellular survival, FGF-ERK signaling also plays a part in both the maintenance of pluripotency and initiation of differentiation in hPSCs.32 As a result, the fine-tuning of FGF-ERK signaling activities is essential to determine the state of pluripotency status. Attempts to knockdown ERK2 in hPSCs were not successful as perturbations to ERK expression led to differentiation, posing a key limitation to this study. To circumvent the absence of genetic intervention, this study made use of small molecule inhibitors in which the potential off-target effect is not entirely omitted. Because this is a limitation for this study, highly specific and well-characterized small molecules were used to evaluate the role of ERK signaling in mesendoderm and DE differentiation.
STAR★Methods
Key resources table
| REAGENT or RESOURCE | SOURCE | IDENTIFIER |
|---|---|---|
| Antibodies | ||
| Mouse monoclonal anti-β-ACTIN | Sigma | Cat#A5441; RRID: AB_476744 |
| Rabbit monoclonal anti-phospho-AKT (Ser473) (193H12) | Cell Signaling | Cat#4058; RRID: AB_331168 |
| Rabbit polyclonal anti-AKT | Cell Signaling | Cat#9262; RRID: AB_329827 |
| Rabbit polyclonal anti-EOMES | Abcam | Cat# AB23345; RRID: AB_778267 |
| Rabbit polyclonal anti-phospho-ERK1/2 | Cell Signaling | Cat#9102; RRID: AB_330744 |
| Rabbit monoclonal anti- ERK1/2 (Thr202/Tyr204) | Cell Signaling | Cat#4370; RRID: AB_2315112 |
| Mouse monoclonal anti-FGFR2 (Clone #98707) | R&D Systems | Cat#MAB665; RRID: AB_358619 |
| Rabbit monoclonal anti-FOXA2 | Abcam | Cat#AB108422; RRID: AB_11157157 |
| Rabbit polyclonal anti-IGF1Rβ (C-20) | Santa Cruz Biotechnology | Cat#sc-713; RRID: AB_671792 |
| Rabbit polyclonal anti-insulin Rβ (C-19) (IR-β) | Santa Cruz Biotechnology | Cat#sc-711; RRID: AB_631835 |
| Mouse monoclonal anti-OCT3/4 | Santa Cruz Biotechnology | Cat#sc-5279; RRID: AB_628051 |
| Rabbit polyclonal anti-phospho-SMAD2 (Ser465/467) | MERCK | Cat# AB3849; RRID: AB_11213091 |
| Rabbit polyclonal anti-SMAD2/3 (FL-425) | Santa Cruz Biotechnology | Cat# sc-8332; RRID: AB_2193192 |
| Goat polyclonal anti-SOX17 | R&D Systems | Cat#AF1924; RRID: AB_2195646 |
| Rabbit polyclonal anti-SOX2 | Abcam | Cat# ab97959; RRID: AB_2341193 |
| Mouse monoclonal anti-EPCAM (PE-conjugated) | Biolegend | Cat#324206; RRID: AB_756080 |
| Chemicals, peptides, and recombinant proteins | ||
| Y-27632 | STEMCELL Technologies | Cat#72302 |
| Activin A | R&D Systems | Cat#338-AC-50 |
| CHIR99021 | Tocris | Cat#4423 |
| LY294002 | LC Laboratories | Cat#L-7962 |
| bFGF/FGF2 | Miltenyi Biotec | Cat#130-093-843 |
| SU5402 | Santa Cruz Biotechnology | Cat#sc-204308 |
| TCS ERK 11e | Tocris | Cat#4465 |
| S961 | Pheonix Biotech | Cat#051-86 |
| OSI-906 | Selleckchem | Cat#S1091 |
| Picropodophyllotoxin (PPP) | Abcam | Cat#Ab144623 |
| SB431542 | Abcam | Cat#AB120163 |
| Critical commercial assays | ||
| NEXTflex™ Rapid Directional RNA-SEQ Kit, v2 | PerkinElmer | Cat#NOVA-5198 |
| MN NucleoSpin RNA extraction Kit | Macherey-Nagel | Cat#740955 |
| iTaqUniversal SYBR Green Supermix | Bio-Rad | Cat#1725124 |
| Deposited data | ||
| RNA-Seq data | This paper | GSE110806 |
| Experimental models: Cell lines | ||
| H9 hESCs (WA09) | WiCell | Cat#WA09 |
| iAGb (hPSC line) | Generated in-house | N/A |
| i70b (hPSC line) | Generated in-house | N/A |
| Oligonucleotides | ||
| Silencer™ Select Pre-Designed siRNA (siFGFR2) siRNA ID: s5173 | ThermoFisher Scientific | N/A |
| Silencer™ Select Negative Control No. 2 (siScrambled) | ThermoFisher Scientific | 4390846 |
| shIGF1R-1 | Genetic Perturbation Platform, Broad Institute | TRCN0000000425 |
| shIGF1R-2 | Genetic Perturbation Platform, Broad Institute | TRCN0000039675 |
| shERK1-1 | Genetic Perturbation Platform, Broad Institute | TRCN0000006150 |
| shERK1-2 | Genetic Perturbation Platform, Broad Institute | TRCN0000219701 |
| shERK2-1 | Genetic Perturbation Platform, Broad Institute | TRCN0000010040 |
| shERK2-2 | Genetic Perturbation Platform, Broad Institute | TRCN0000342295 |
| qPCR Primer sequences please see Table S8 | This paper | N/A |
| Software and algorithms | ||
| FlowJo™ version 10.6.0 | Tree Star | https://www.flowjo.com |
| GraphPad Prism version 9 | GraphPad | https://www.graphpad.com/scientificsoftware/prism/ |
| Bio-Rad CFX Maestro version 2.3 | Bio-Rad | https://www.bio-rad.com/ |
| Olympus Fluoview version 3.1 | Olympus | https://www.olympus-global.com/ |
| R version 4.1 | The R Foundation | https://www.r-project.org |
Resource availability
Lead contact
Further information and requests for resources and reagents should be directed to and will be fulfilled by the lead contact, Adrian Kee Keong Teo (ateo@imcb.a-star.edu.sg).
Materials availability
This study did not generate any unique new reagent. All reagents used in this study are commercially available.
Experimental model and study participant details
H9 hESC line (WA09) was purchased from WiCell. Human iPSC lines iAGb and i70b were reprogrammed from skin fibroblasts obtained from a healthy individual (AG16102, Coriell Institute) and a healthy volunteer (#70) respectively using episomal reprogramming vectors. All hPSC lines were tested routinely to be mycoplasma negative and were cultured in DMEM/F-12 supplemented with GlutaMax™, 20% KnockOut™ serum replacement (KOSR), MEM non-essential amino acids (ThermoFisher Scientific), and 10 ng/ml basic fibroblast growth factor (bFGF)/FGF2 (Miltenyi Biotec). hPSCs were cultured on irradiated CF-1 mouse embryonic fibroblasts (Globalstem, USA) or feeder-free condition using TeSR™-E8™ and mTeSR™1 feeder-free maintenance medium (STEMCELL Technologies) with daily media changes.
Method details
Differentiation
To set up for differentiation, hPSCs were treated with Collagenase IV (ThermoFisher Scientific) and Dispase (STEMCELL Technologies) at 1:1 ratio for 5 min. The cells were then manually dissociated into small clumps and passed through 70 μm strainers to deplete feeders. For feeder-free culture, cells were dissociated with ReLeSR™ (STEMCELL Technologies) according to the manufacturer’s protocol. Cell culture plates were pre-coated with 0.1% gelatin in water for at least 15 min, followed by coating with DMEM supplemented with 10% Fetal Bovine Serum (Hyclone) for at least 48 h. Plates were washed thoroughly with DPBS before cell seeding. The hPSCs were seeded onto pre-coated plates and cultured in hPSC media and mTeSR™1 feeder-free maintenance medium (STEMCELL Technologies) at 1:1 ratio for 2 days before initiation of DE (designated D-2). On D0, media was replaced with RPMI supplemented with 2% B-27 (no vitamin A), MEM non-essential amino acids, 1% GlutaMax™ and 0.1% β-mercaptoethanol (ThermoFisher Scientific) with the appropriate growth factors and small molecules for differentiation for 3 days, from day 0 to day 3 (D0 – D3). The growth factors and small molecules used were Activin A (R&D Systems), CHIR99021 (Tocris), LY294002 (LC Laboratories), bFGF/FGF2 (Miltenyi Biotec), SU5402 (Santa Cruz Biotechnology), TCS ERK 11e (Tocris), OSI-906, S961 (Pheonix Biotech), picropodophyllotoxin (PPP; Abcam) and SB431542 (Tocris). The growth factors and small molecules were added as a cocktail to the medium accordingly (e.g. ACLY: Activin A, CHIR99021 and LY294002) (Figure S7). The cells were harvested at the appropriate days for analyses.
Constructs
shRNA oligo sequences targeting IGF1R and ERK1/2 were obtained from Genetic Perturbation Platform (BroadInstitute). Refer to Table S6 for shRNA IDs. The shRNAs were subcloned into pLKO.1 vector for amplification. Plasmids were then extracted using PurelinkTM HiPure Plasmid Filter Maxiprep kit (ThermoFisher Scientific).
Transfection
Transfection was performed using Lipofectamine RNAiMAX transfection reagent to transiently knock down FGFR2 expression in hPSCs. Briefly, hPSCs were trypsinized into single cells and plated onto pre-coated plates (refer to Materials and Methods – cell culture section) and cultured overnight in mTeSR™1 medium supplemented with 10 μM ROCK inhibitor (Y-27632, STEMCELL Technologies). Transfection of siFGFR2 (Silencer™ Select Pre-Designed siRNA siRNA ID: s5173 (siFGFR2), ThermoFisher) and siSCRAMBLED (Silencer™ Select Negative Control No. 2, ThermoFisher) were carried out following the manufacturer’s protocol. Cells were subjected to ACLY differentiation 24 h post-transfection.
To create stable shRNA hPSC lines, shRNAs were transfected using Lipofectamine 2000 transfection reagent to knock down ERK2 and IGF1R. hPSCs were trypsinized into single cells and plated onto pre-coated plates one day prior to transfection. Transfection was carried out following manufacturer’s protocol and cells were selected using G418 (InvivoGen) before being subjected to differentiation.
Western blot
Cells were washed three times with DPBS and lysed in Mammalian protein extraction reagent (M-PER™, ThermoFisher Scientific) in the presence of protease inhibitor (cOmplete™, Roche), phosphatase inhibitor cocktail II and III (Sigma). Protein quantification was performed using Pierce™ BCA protein assay kit (ThermoFisher Scientific) before electrophoresis with Mini-protean tetra cell system and then transferred onto PVDF (Biorad). Protein blots were first blocked with 5% milk in TBST for 1 h before incubating with the respective antibodies (refer to Table S7 for details). Chemiluminescence signals were detected with Super Signal™ West Dura Extended Duration Substrate (ThermoFisher Scientific).
Flow cytometry
Cells were treated with 0.25% Trypsin and diluted with 10% KOSR before passing through 40 μm cell strainer. Single cells were then washed three times with DPBS and fixed with 4% paraformaldehyde on ice for 20 min. The cells were blocked on ice for 30 min with 10% KOSR in DPBS with or without 0.1% Triton-X for intracellular or surface marker staining respectively. For surface marker staining, the cells were incubated with EPCAM-PE (Biolegend, 1:100) for 30 min and proceeded with blocking with 10% KOSR in DPBS supplemented with 0.1% Triton-X for another 30 min. The cells were then co-stained with SOX17 (R&D Systems, 1:100) before secondary antibody staining with Alexa Fluor® 488 Donkey anti-goat IgG (ThermoFisher Scientific, 1:500) for 1 h at 4°C for each condition. For co-staining of SOX17 (R&D System, 1:100) and EOMES (Abcam, 1:100), cells were incubated with primary antibodies on ice for 1 h before secondary antibody staining. For controls, cells were stained with Mouse IgG PE, Mouse IgG2a APC (BD Pharmingen) and Alexa Fluor® 488 (ThermoFisher Scientific). Cells were washed three times and diluted with DPBS for flow cytometry (LSR II, BD Biosciences). Flow cytometry data was analyzed using FlowJo_V10. Primary antibodies used are listed in Table S7.
RNA extraction, RT and QPCR
For every experiment, cells were cultured in triplicates for each condition and total RNA extraction was performed using MN NucleoSpin RNA Kit (Macherey-Nagel). Experiments were then independently repeated. RNA was quantified and reverse transcribed to cDNA using High-capacity cDNA reverse transcription kit (Applied Biosystem) to a final concentration of 2.5 ng/μl. Quantitative real-time PCR (QPCR) was performed using CFX384 with iTaqUniver SYBR Green Supermix (Biorad). QPCR assays were performed in duplicate for each sample, the quantification of each gene expression was normalized to ACTIN, calculated by 2−ddCt method. p < 0.05 (∗) indicates statistical significance by ANOVA and Dunnett’s post-hoc tests. All error bars indicate standard error of mean of biological triplicates. Primers used are listed in Table S8.
Immunohistochemistry (IHC)
In preparation for IHC, cells were seeded on 12-well plates for differentiation. On D3, cells were washed three times with DPBS, fixed for 20 min at room temperature with 4% paraformaldehyde (WAKO) and then blocked for 30 min with 5% donkey serum (Merck) in DPBS with 0.1% Triton-X. For staining, cells were incubated with SOX17 antibody (R&D Systems) at 1:100 overnight at 4°C. At the end of primary antibody incubation, cells were washed three times with DPBS, and incubated with Alexa Fluor® 488 Donkey anti-goat IgG (ThermoFisher Scientific; 1:500) for 1 h at 4°C. Cells were washed three times, stained for DAPI (Sigma) and mounted onto slides for visualization using Zeiss Axiovert 200 M system (Zeiss) or Olympus Fluoview1000 confocal microscope (Olympus). Cell count from 6 to 10 images was tabulated for each treatment condition across biological duplicate experiments to derive the percentage of DE.
RNA-seq
To prepare RNA-Seq library, poly-A mRNA was enriched from total RNA with oligo dT beads (Thermo Fisher Scientific). Approximately 100 ng of poly-A mRNA was used to construct multiplexed strand-specific RNA-seq libraries following manufacturer manual (NEXTflex™ Rapid Directional RNA-SEQ Kit, dUTP-Based, v2). Individual library quality was assessed and quantified with Agilent 2100 Bioanalyzer and Qubit 2.0 fluorometer respectively before pooling for sequencing using a HiSeq 2000 (1x101 bp read). Prior to cluster formation, pooled libraries were quantified using the KAPA quantification kit (KAPA Biosystems).
For differential expression analysis, adapter sequences and low-quality bases in Fastq read sequences were removed using Trimmomatic (v.0.33) (parameters: LEADING:3 TRAILING:3 SLIDINGWINDOW:4:15 MINLEN:36). The sequences were then aligned to human genome (HG19) with Tophat2 (v.2.0.14) (parameters:--nocoverage-search—library-type=fr-firststrand) and annotated with Ensembl gene IDs. Python package based htseq-count of HTSeq3 (v.0.6.1p1) (parameters:default union-counting modem –stranded=reverse) was used to generate feature read counts from BAM files. The read count matrix output from HTSeq was used to perform Differential Expression analysis. EdgeR4 package (available in R (v.3.1.3)) in both ‘Classic’ and ‘Generalized linear model (glm)’ modes was used to contrast treated conditions with control. p values, FDR (False Discovery Rate) adjusted p values (q values) and fold changes were calculated following procedures described in edgeR documentation. FDR cutoff at 0.05 was used to determine significant differentially expressed genes. The selected genes annotated with Ensembl IDs were mapped with gene symbols for identification. RNA-Seq data can be accessed in GEO under accession number: GSE110806.
Quantification and statistical analysis
Statistical tests are performed using GraphPad Prism (version 9). Data are presented as mean ± SEM. Differences were analyzed by the Student’s t test and one-way ANOVA as indicated in the figure legends. Asterisk (∗) indicates p < 0.05 against each control group respectively. At least N = 3 independent experiments were performed. The exact N number for each experiment is presented in the figure legend of respective figures. Due to the heterogeneity of differentiating hPSCs, we set up two to three individual wells in parallel for each independent experiment to account for variability in differentiation efficiency in each experiment. These data points were included in the figures.
Acknowledgments
We thank members of the Teo laboratory for the critical reading of this manuscript. H.H.L. is supported by the Institute of Molecular and Cell Biology (IMCB) Scientific Staff Development Award (SSDA). N.S.A. is supported by the NUS Research Scholarship. L.S.W.L. is supported by the A∗STAR Graduate Academy (AGA), A∗STAR. A.K.K.T. is supported by the Institute of Molecular and Cell Biology (IMCB), A∗STAR, FY2019 SingHealth Duke-NUS Surgery Academic Clinical Programme Research Support Program Grant, Precision Medicine and Personalised Therapeutics Joint Research Grant 2019, the 2nd A∗STAR-AMED Joint Grant Call 192B9002, HLTRP/2022/NUS-IMCB-02, Paris-NUS 2021-06-R/UP-NUS (ANR-18-IDEX-0001), OFIRG21jun-0097, CSASI21jun-0006, MTCIRG21-0071 and SDDC/FY2021/EX/93-A147, FY 2022 Interstellar Initiative Beyond grant, H22G0a0005 and I22D1AG053.
Author contributions
Conceptualization: A.K.K.T.; Methodology: H.H.L. and A.K.K.T.; Validation: H.H.L., N.S.A., L.S.W.L., J.W.C., V.G.K., S.H., and A.K.K.T.; Formal Analysis: H.H.L., V.G.K., S.H., and A.K.K.T.; Investigation: H.H.L., N.S.A., L.S.W.L., J.W.C., V.G.K., S.H., and A.K.K.T.; Resources: S.H. and A.K.K.T.; Writing – Original Draft: A.K.K.T.; Writing – Review and Editing: H.H.L., N.S.A., L.S.W.L., J.W.C., E.I., V.G.K., S.H., and A.K.K.T.; Visualization: H.H.L., E.I., V.G.K., and A.K.K.T.; Supervision: A.K.K.T.; Project Administration: A.K.K.T.; Funding Acquisition: S.H. and A.K.K.T.
Declaration of interests
A.K.K.T. is a co-founder of BetaLife Pte Ltd. The other authors declare that the research was conducted in the absence of any commercial or financial relationships that could be construed as a potential conflict of interest.
Published: July 3, 2023
Footnotes
Supplemental information can be found online at https://doi.org/10.1016/j.isci.2023.107265.
Supplemental information
Data and code availability
RNA-Seq data can be accessed in GEO under the accession number: GSE110806.
This paper does not report original code.
Any additional information required to reanalyze the data reported in this paper is available from the lead contact upon request.
References
- 1.Teo A.K.K., Ali Y., Wong K.Y., Chipperfield H., Sadasivam A., Poobalan Y., Tan E.K., Wang S.T., Abraham S., Tsuneyoshi N., et al. Activin and BMP4 synergistically promote formation of definitive endoderm in human embryonic stem cells. Stem Cell. 2012;30:631–642. doi: 10.1002/stem.1022. [DOI] [PubMed] [Google Scholar]
- 2.D'Amour K.A., Agulnick A.D., Eliazer S., Kelly O.G., Kroon E., Baetge E.E. Efficient differentiation of human embryonic stem cells to definitive endoderm. Nat. Biotechnol. 2005;23:1534–1541. doi: 10.1038/nbt1163. [DOI] [PubMed] [Google Scholar]
- 3.Brown S., Teo A., Pauklin S., Hannan N., Cho C.H.H., Lim B., Vardy L., Dunn N.R., Trotter M., Pedersen R., Vallier L. Activin/Nodal signaling controls divergent transcriptional networks in human embryonic stem cells and in endoderm progenitors. Stem Cell. 2011;29:1176–1185. doi: 10.1002/stem.666. [DOI] [PubMed] [Google Scholar]
- 4.Teo A.K.K., Valdez I.A., Dirice E., Kulkarni R.N. Comparable generation of activin-induced definitive endoderm via additive Wnt or BMP signaling in absence of serum. Stem Cell Rep. 2014;3:5–14. doi: 10.1016/j.stemcr.2014.05.007. [DOI] [PMC free article] [PubMed] [Google Scholar]
- 5.McLean A.B., D'Amour K.A., Jones K.L., Krishnamoorthy M., Kulik M.J., Reynolds D.M., Sheppard A.M., Liu H., Xu Y., Baetge E.E., Dalton S. Activin a efficiently specifies definitive endoderm from human embryonic stem cells only when phosphatidylinositol 3-kinase signaling is suppressed. Stem Cell. 2007;25:29–38. doi: 10.1634/stemcells.2006-0219. [DOI] [PubMed] [Google Scholar]
- 6.Yu J.S.L., Ramasamy T.S., Murphy N., Holt M.K., Czapiewski R., Wei S.K., Cui W. PI3K/mTORC2 regulates TGF-beta/Activin signalling by modulating Smad2/3 activity via linker phosphorylation. Nat. Commun. 2015;6:7212. doi: 10.1038/ncomms8212. [DOI] [PMC free article] [PubMed] [Google Scholar]
- 7.Sui L., Mfopou J.K., Geens M., Sermon K., Bouwens L. FGF signaling via MAPK is required early and improves Activin A-induced definitive endoderm formation from human embryonic stem cells. Biochem. Biophys. Res. Commun. 2012;426:380–385. doi: 10.1016/j.bbrc.2012.08.098. [DOI] [PubMed] [Google Scholar]
- 8.Loh K.M., Ang L.T., Zhang J., Kumar V., Ang J., Auyeong J.Q., Lee K.L., Choo S.H., Lim C.Y.Y., Nichane M., et al. Efficient endoderm induction from human pluripotent stem cells by logically directing signals controlling lineage bifurcations. Cell Stem Cell. 2014;14:237–252. doi: 10.1016/j.stem.2013.12.007. [DOI] [PMC free article] [PubMed] [Google Scholar]
- 9.Zhang D., Jiang W., Liu M., Sui X., Yin X., Chen S., Shi Y., Deng H. Highly efficient differentiation of human ES cells and iPS cells into mature pancreatic insulin-producing cells. Cell Res. 2009;19:429–438. doi: 10.1038/cr.2009.28. [DOI] [PubMed] [Google Scholar]
- 10.Yu P., Pan G., Yu J., Thomson J.A. FGF2 sustains NANOG and switches the outcome of BMP4-induced human embryonic stem cell differentiation. Cell Stem Cell. 2011;8:326–334. doi: 10.1016/j.stem.2011.01.001. [DOI] [PMC free article] [PubMed] [Google Scholar]
- 11.Aronov A.M., Tang Q., Martinez-Botella G., Bemis G.W., Cao J., Chen G., Ewing N.P., Ford P.J., Germann U.A., Green J., et al. Structure-guided design of potent and selective pyrimidylpyrrole inhibitors of extracellular signal-regulated kinase (ERK) using conformational control. J. Med. Chem. 2009;52:6362–6368. doi: 10.1021/jm900630q. [DOI] [PubMed] [Google Scholar]
- 12.Morris E.J., Jha S., Restaino C.R., Dayananth P., Zhu H., Cooper A., Carr D., Deng Y., Jin W., Black S., et al. Discovery of a novel ERK inhibitor with activity in models of acquired resistance to BRAF and MEK inhibitors. Cancer Discov. 2013;3:742–750. doi: 10.1158/2159-8290.CD-13-0070. [DOI] [PubMed] [Google Scholar]
- 13.Pratilas C.A., Solit D.B. Targeting the mitogen-activated protein kinase pathway: physiological feedback and drug response. Clin. Cancer Res. 2010;16:3329–3334. doi: 10.1158/1078-0432.CCR-09-3064. [DOI] [PMC free article] [PubMed] [Google Scholar]
- 14.Teo A.K.K., Arnold S.J., Trotter M.W.B., Brown S., Ang L.T., Chng Z., Robertson E.J., Dunn N.R., Vallier L. Pluripotency factors regulate definitive endoderm specification through eomesodermin. Genes Dev. 2011;25:238–250. doi: 10.1101/gad.607311. [DOI] [PMC free article] [PubMed] [Google Scholar]
- 15.Tremblay K.D., Hoodless P.A., Bikoff E.K., Robertson E.J. Formation of the definitive endoderm in mouse is a Smad2-dependent process. Development. 2000;127:3079–3090. doi: 10.1242/dev.127.14.3079. [DOI] [PubMed] [Google Scholar]
- 16.Pauklin S., Vallier L. The cell-cycle state of stem cells determines cell fate propensity. Cell. 2013;155:135–147. doi: 10.1016/j.cell.2013.08.031. [DOI] [PMC free article] [PubMed] [Google Scholar]
- 17.Taniguchi C.M., Emanuelli B., Kahn C.R. Critical nodes in signalling pathways: insights into insulin action. Nat. Rev. Mol. Cell Biol. 2006;7:85–96. doi: 10.1038/nrm1837. [DOI] [PubMed] [Google Scholar]
- 18.Mulvihill M.J., Cooke A., Rosenfeld-Franklin M., Buck E., Foreman K., Landfair D., O'Connor M., Pirritt C., Sun Y., Yao Y., et al. Discovery of OSI-906: a selective and orally efficacious dual inhibitor of the IGF-1 receptor and insulin receptor. Future Med. Chem. 2009;1:1153–1171. doi: 10.4155/fmc.09.89. [DOI] [PubMed] [Google Scholar]
- 19.Schäffer L., Brand C.L., Hansen B.F., Ribel U., Shaw A.C., Slaaby R., Sturis J. A novel high-affinity peptide antagonist to the insulin receptor. Biochem. Biophys. Res. Commun. 2008;376:380–383. doi: 10.1016/j.bbrc.2008.08.151. [DOI] [PubMed] [Google Scholar]
- 20.Girnita A., Girnita L., del Prete F., Bartolazzi A., Larsson O., Axelson M. Cyclolignans as inhibitors of the insulin-like growth factor-1 receptor and malignant cell growth. Cancer Res. 2004;64:236–242. doi: 10.1158/0008-5472.can-03-2522. [DOI] [PubMed] [Google Scholar]
- 21.Inman G.J., Nicolás F.J., Callahan J.F., Harling J.D., Gaster L.M., Reith A.D., Laping N.J., Hill C.S. SB-431542 is a potent and specific inhibitor of transforming growth factor-beta superfamily type I activin receptor-like kinase (ALK) receptors ALK4, ALK5, and ALK7. Mol. Pharmacol. 2002;62:65–74. doi: 10.1124/mol.62.1.65. [DOI] [PubMed] [Google Scholar]
- 22.Vincent S.D., Dunn N.R., Hayashi S., Norris D.P., Robertson E.J. Cell fate decisions within the mouse organizer are governed by graded Nodal signals. Genes Dev. 2003;17:1646–1662. doi: 10.1101/gad.110050317/13/1646. [DOI] [PMC free article] [PubMed] [Google Scholar]
- 23.Na J., Furue M.K., Andrews P.W. Inhibition of ERK1/2 prevents neural and mesendodermal differentiation and promotes human embryonic stem cell self-renewal. Stem Cell Res. 2010;5:157–169. doi: 10.1016/j.scr.2010.06.002. [DOI] [PubMed] [Google Scholar]
- 24.Peters H., Wappler I., Evans J., Hyslop L., Armstrong L., Lako M., Stojkovic M., Hughes O., Stojkovic P., Stewart R., et al. The role of PI3K/AKT, MAPK/ERK and NFκβ signalling in the maintenance of human embryonic stem cell pluripotency and viability highlighted by transcriptional profiling and functional analysis. Hum. Mol. Genet. 2006;15:1894–1913. doi: 10.1093/hmg/ddl112. [DOI] [PubMed] [Google Scholar]
- 25.Singh A.M., Reynolds D., Cliff T., Ohtsuka S., Mattheyses A.L., Sun Y., Menendez L., Kulik M., Dalton S. Signaling network crosstalk in human pluripotent cells: a Smad2/3-regulated switch that controls the balance between self-renewal and differentiation. Cell Stem Cell. 2012;10:312–326. doi: 10.1016/j.stem.2012.01.014. [DOI] [PMC free article] [PubMed] [Google Scholar]
- 26.Yu P., Pan G., Yu J., Thomson J.A. FGF2 sustains NANOG and switches the outcome of BMP4-induced human embryonic stem cell differentiation. Cell Stem Cell. 2011;8:326–334. doi: 10.1016/j.stem.2011.01.001. [DOI] [PMC free article] [PubMed] [Google Scholar]
- 27.Arnold S.J., Robertson E.J. Making a commitment: cell lineage allocation and axis patterning in the early mouse embryo. Nat. Rev. Mol. Cell Biol. 2009;10:91–103. doi: 10.1038/nrm2618. [DOI] [PubMed] [Google Scholar]
- 28.Sui L., Bouwens L., Mfopou J.K. Signaling pathways during maintenance and definitive endoderm differentiation of embryonic stem cells. Int. J. Dev. Biol. 2013;57:1–12. doi: 10.1387/ijdb.120115ls. [DOI] [PubMed] [Google Scholar]
- 29.Dorey K., Amaya E. FGF signalling: diverse roles during early vertebrate embryogenesis. Development. 2010;137:3731–3742. doi: 10.1242/dev.037689. [DOI] [PMC free article] [PubMed] [Google Scholar]
- 30.Morrison G.M., Oikonomopoulou I., Migueles R.P., Soneji S., Livigni A., Enver T., Brickman J.M. Anterior definitive endoderm from ESCs reveals a role for FGF signaling. Cell Stem Cell. 2008;3:402–415. doi: 10.1016/j.stem.2008.07.021. [DOI] [PubMed] [Google Scholar]
- 31.Kaitsuka T., Kobayashi K., Otsuka W., Kubo T., Hakim F., Wei F.Y., Shiraki N., Kume S., Tomizawa K. Erythropoietin facilitates definitive endodermal differentiation of mouse embryonic stem cells via activation of ERK signaling. Am. J. Physiol. Cell Physiol. 2017;312:C573–C582. doi: 10.1152/ajpcell.00071.2016. [DOI] [PubMed] [Google Scholar]
- 32.Lanner F., Rossant J. The role of FGF/Erk signaling in pluripotent cells. Development. 2010;137:3351–3360. doi: 10.1242/dev.050146. [DOI] [PubMed] [Google Scholar]
Associated Data
This section collects any data citations, data availability statements, or supplementary materials included in this article.
Supplementary Materials
Data Availability Statement
RNA-Seq data can be accessed in GEO under the accession number: GSE110806.
This paper does not report original code.
Any additional information required to reanalyze the data reported in this paper is available from the lead contact upon request.