

Abstract
Mitoquinone (MitoQ), a mitochondria-targeted antioxidant, has been used to treat several diseases. The present study aimed to investigate the therapeutic effects of MitoQ in benign prostatic hyperplasia (BPH) models and their underlying molecular mechanisms. In this study, we determined that MitoQ inhibited dihydrotestosterone (DHT)-induced cell proliferation and mitochondrial ROS by inhibiting androgen receptor (AR) and NOD-like receptor family pyrin domain-containing 3 (NLRP3) signaling in prostate epithelial cells. Molecular modeling revealed that DHT may combine with AR and NLRP3, and that MitoQ inhibits both AR and NLRP3. AR and NLRP3 downregulation using siRNA showed the linkage among AR, NLRP3, and MitoQ. MitoQ administration alleviated pathological prostate enlargement and exerted anti-proliferative and antioxidant effects by suppressing the AR and NLRP3 signaling pathways in rats with BPH. Hence, our findings demonstrated that MitoQ is an inhibitor of NLPR3 and AR and a therapeutic agent for BPH treatment.
Keywords: Androgen receptor, Benign prostatic hyperplasia, Dihydrotestosterone, Mitoquinone, NLRP3
Graphical abstract

1. Introduction
Benign prostatic hyperplasia (BPH) has been identified as a common clinical problem in men aged >50 years [1]. According to descriptive epidemiology, the incidence of BPH ranges from 12% to 42%, and one study showed that the lifetime risk of BPH is 29% [[2], [3], [4]]. The 2019 Global Burden of Disease study revealed that the absolute burden of BPH is rising at an alarming rate. Globally, the estimated prevalence of BPH in 2019 was 11.26 million cases, up from 5.48 million in 1990 [5]. Histological determination of BPH is based on the abnormal proliferation of epithelial and stromal cells of the prostate tissue, resulting in prostate growth, lower urinary tract symptoms (LUTS), and bladder outlet obstruction [6]. Several factors, including aging, hormones, chronic inflammation, growth factors, and oxidative stress, are considered to influence BPH development [7]. While the exact underlying molecular mechanism remains unclear, sex hormones have been considered the main contributing factors for BPH [8].
Androgens mediate their action via the androgen receptor (AR) in the prostate, stimulating the differentiation and proliferation of epithelial and stromal cells [9]. Some studies suggest that androgen ablation therapy for volume reduction and changes in LUTS along with 5α-reductase inhibitors (5ARIs), known as dihydrotestosterone (DHT) blockers should be primarily used to treat BPH. However, AR signaling is not the only modulator of BPH, as evidenced by the fact that more than 25% of patients do not respond to 5ARIs. Hence, androgens play a major role in pathogenesis within the prostate tissue by stimulating inflammation. Accumulating evidence suggests the combined and interactive effects of androgens and inflammation on prostate tissues. Tong et al. suggested that as androgens can act on inflammation, which can also act on androgens [10]. Several studies have demonstrated the role of oxidant products and antioxidant depletion in patients with BPH. Prostate inflammation can lead to free radical production and oxidative stress. Evidence has revealed that oxidative stress may result in cellular proliferation and BPH [11]. However, as the exact effects of reactive oxygen species (ROS) on BPH pathology have not been identified, their role must be investigated.
A clinical study indicated that inflammasome components were elevated in prostate tissues from patients with BPH, suggesting that inflammasomes are important mediators of prostate inflammation associated with BPH [12]. The NOD-like receptor family pyrin domain-containing 3 (NLRP3) inflammasome is associated with a wide range of diseases, including chronic inflammatory disorders [13]. Upon detecting cellular stress, activation of NLRP3 recruits caspase-1-dependent proinflammatory cytokines, such as IL-1β and IL-18 [14,15]. The NLRP3 inflammasome reportedly perceives mitochondrial dysfunction and may explain the positive correlation between mitochondrial ROS (mtROS) and inflammatory diseases [16]. Aberrant activation of the NLRP3 inflammasome promotes cellular proliferation and tumor pathogenesis, although its role in BPH development remains unclear [17,18].
Mitoquinone (MitoQ; 10-(4,5-dimethoxy-2-methyl-3,6-dioxo-1,4-cyclohexadien-1-yl)decyl triphenylphosphonium) was designed to decrease mtROS levels [19]. MitoQ has been evaluated in clinical trials, and numerous studies have shown that it protects against oxidative damage in a number of diseases. Although MitoQ has not been approved by the FDA as a drug yet, several studies have been conducted to evaluate its effectiveness in various diseases. MitoQ has high bioavailability, and previous studies have reported its anti-inflammatory potential [20]. MitoQ exerts anti-inflammatory effects by inhibiting the NLRP3 inflammasome and/or the mtROS/NLRP3 axis in experimental animal models [21,22]. Additionally, MitoQ exhibits anti-proliferative effects and induces apoptotic cell death in cancer cells [23,24]. However, the molecular mechanisms underlying the antioxidant and anti-proliferative effects of MitoQ in BPH development remain unclear.
2. Materials and methods
2.1. Cell culture and sample treatment
The normal human prostate epithelial cell line, RWPE-1, was obtained from the American Type Culture Collection (Manassas, VA, USA). RWPE-1 cells were cultured in keratinocyte serum-free medium supplemented with 0.05 mg/mL bovine pituitary extract, 5 ng/mL human recombinant epidermal growth factor, and antibiotic-antimycotic solution (Gibco®, Big Cabin, OK, USA). Cells were cultured in a humidified environment at 37 °C and 5% CO2. Cells were cultured in serum-free medium to block the effects of autocrine androgens. To mimic BPH induced by androgens in vivo, seeded cells were treated with 10 nM DHT for 72 h with or without various concentrations of MitoQ (25, 50, and 100 μM).
2.2. CCK-8 assay
Cell viability and proliferation were measured using the Cell Counting Kit-8 (CCK-8, Dojindo Molecular Technologies, Inc., D.C., USA). RWPE-1 cells were seeded in 96-well plates (1 × 10⁵ cells/well) and incubated for 24 h. The following day, cells were pretreated with or without various concentrations of MitoQ (3.125–200 μM) for 1 h prior to stimulation with 10 nM DHT for 24 h. After treatment, CCK-8 solution was added to each well and incubated for 4 h. The number of viable cells was monitored by measuring absorbance at 450 nm using an Epoch microplate reader (Biotek, Winooski, VT, USA).
2.3. Immunofluorescence (IF)
RWPE-1 cells treated with DHT and/or MitoQ (25, 50, and 100 μM) were fixed in 100% methanol, blocked with 10% normal goat serum (Gibco®), and incubated with primary antibodies against 8-OHdG (Cat. No. sc-66036; Santa Cruz Biotechnology), NLRP3 (Cat. No. NBP2-12446, Novus Biologicals), and AR (Cat. No. sc-7305) overnight. The cells were then washed and incubated with FITC-conjugated anti-mouse or TRITC-conjugated anti-rabbit secondary antibodies. Nuclei were stained with 4′,6-diamidino-2-phenylindole (Life Technologies). Images were captured using an optical microscope (ECLIPSE Ni-U, Nikon, Tokyo, Japan).
After deparaffinization and rehydration, rat prostate tissue slides were incubated with anti-mouse 8-OHdG antibodies or anti-rabbit NLRP3 antibodies and visualized with FITC-conjugated anti-mouse and TRITC-conjugated anti-rabbit secondary antibodies, respectively. The slides were mounted and detected using a Nikon X-Cite-Series 120 Q microscope (Nikon, Japan). The exposure parameters were the same for each sample.
2.4. Assessment of mitochondrial activity and mtROS levels
RWPE-1 cells were plated on a chamber slide at a density of 1 × 10⁵ cells/well the day before treatment. The RWPE-1 cells were treated with 10 nM DHT and/or 100 μM MitoQ for 24 h. Before incubating with fluorescent dye, RWPE-1 cells were treated with 0.6% H2O2 for 30 min. Mitochondrial activity and mtROS levels were measured by incubating cells with MitoTracker™ Green FM and MitoSOX™ Mitochondrial Superoxide Indicator (Invitrogen, MA, USA) for 30 min 37 °C. The slides were mounted and detected using an EVOS M5000 microscope (Invitrogen).
2.5. Western blot analysis
Total protein was extracted from RWPE-1 cells and rat prostate tissues, and western blot analysis was performed as described previously [25]. Antibodies against AR (Cat. No. sc-7305) were purchased from Santa Cruz Biotechnology, Inc. (TX, USA). Boster Biological Technology (CA, USA) provided the antibodies against prostate-specific antigen (PSA; Cat. No. PB9259). Antibodies against caspase-3 (Cat. No. #9661) were purchased from Cell Signaling Technology. Novus Biologicals (CO, USA) provided antibodies against NLRP3 (Cat. No. NBP2-12446). Antibodies against IL-1β (Cat. No. 2105) were purchased from Abcam (Cambridge, UK).
2.6. Quantitative real-time polymerase chain reaction (qRT-PCR) analysis
Total RNA was isolated using Easy-Blue® reagent (iNtRON Biotechnology, Inc., Gyeonggi-do, Korea) and transcribed into cDNA according to the manufacturer's instructions. Oligonucleotide primers (Table 1) were purchased from Bioneer Corporation (Daejeon, Korea). qRT-PCR was performed as previously described [26].
Table 1.
Primer sequences.
| Gene name | Sense primers | Anti-sense primers |
|---|---|---|
| Human HO-1 | GAGGCCAAGACTGCGTTCC | GGTGTCATGGGTCAGCAGC |
| Human GPX-1 | AGTCGGTGTATGCCTTCTCG | CGATGTCAGGCTCGATGTCA |
| Human NLRP3 | GGAGAGACCTTTATGAGAAAGCAA | GCTGTCTTCCTGGCATATCACA |
| Human PYCARD | TGACGGATGAGCAGTACCAG | GCTTCCGCATCTTGCTTGG |
| Human IL-1β | TGGACCTCTGCCCTCTGGAT | GGCAGGGAACCAGCATCTTC |
| Human AR | GAGCCAGGTGTAGTGTGTGC | TCGTCCACGTGTAAGTTGCG |
| Human 5α-reductase 2 | GGGCTTTCCGAGATTTGGGG | CCCTCCCAGCACTTGCATTT |
| Human PSA | ATAGGATTGCCCAGGCAGAA | CTAAGGGTAAAAGCAGGGAGAGAGT |
| Human β-actin | GGCCAGGTCATCACCATTGG | CTTTGCGGATGTCCACGTCA |
| Rat PCNA | GATCGCAGCGGTATGTGTCG | CTGCTGGGACATCAGTTCGG |
| Rat HO-1 | GCGAAACAAGCAGAACCCAG | GCCTCTGGCGAAGAAACTCT |
| Rat SOD-1 | TTTGCACCTTCGTTTCCTGC | TCCCAATCACACCACAAGCC |
| Rat PGC1α | CATGCAAACCACACCCACAG | TGAGCACTGAGGACTTGCTG |
| Rat PYCARD | CCATCCTGGACGCTCTTGAA | GGTCTGTCACCAAGTAGGGC |
| Rat IL-1β | TGTGATGAAAGACGGCACAC | TGTGCAGACTCAAACTCCAC |
| Rat 5α-reductase 2 | GGCAGCTACCAACTGTGACC | CTCCCGACGACACACTCTCT |
| Rat AR | AGCTCACCAAGCTCCTGGAT | AAGGGAACAAGGTGGGTTTG |
| Rat SRC-1 | GAACCCCACCTGCTTCTACC | GACATTCTGCTGCATCTGCG |
| Rat GAPDH | TGATTCTACCCACGGCAAGT | AGCATCACCCCATTTGATGT |
2.7. Transfection of siRNA
RWPE-1 cells were transfected with siRNA (Bioneer Corporation) or pmaxGFPtm vector using a 4D-Nucleofectortm system (Lonza, Basel, Switzerland). The following siRNA nucleotide sequences were used: NLRP3 siRNA, CGUGACAGUCCUUCUGGAA = tt(1-AS) and UUCCAGAAGGACUGUCACG = tt(1-AA) and AR siRNA, CUCUCUUCACAGCCGAAGA = tt (6-AS) (forward) and UCUUCGGCUGUGAAGAGAG = tt(6-AA) (reverse). After 4 h of incubation, the cells were treated in the presence or absence of MitoQ 100 μM. The effect of NLRP3 or AR knockdown was detected using qRT-PCR.
2.8. Docking simulation
A crystal structure of the NACHT domain of NLRP3 was recently identified [27]. The structure was downloaded from the Protein Data Bank (PDB ID: 7ALV). The structure contained a potent di-aryl sulfonylurea inhibitor, RM5 (PubChem CID: 10195003). For AR (PDB ID: 2AMA), the crystal structure, to which DHT is bound, was used. The coordinates and size of the search space for the docking simulation were determined based on the 3D coordinate ranges of RM5 in the NACHT domain and the DHT binding site of the AR. A docking simulation was performed using AutoDock Vina v1.1.2 for testosterone, DHT, MitoQ, and RM5 [28]. The binding affinity of each ligand was predicted based on the best mode of binding, and the corresponding binding energy was calculated as kcal/mol. A lower binding energy indicates a greater binding affinity.
2.9. ATPase assay
RWPE-1 cells were seeded in dishes at a density of 1 × 10⁵ cells/well, and the serum-free medium was replaced the next day. The RWPE-1 cells were treated with 10 nM DHT and/or MitoQ (25, 50, and 100 μM) for 24 h. ATPase activity was determined using a commercially available kit (Abcam, MA, USA). According to the manufacturer's instructions, the cells were homogenized in ATPase assay buffer and centrifuged at 4 °C for 10 min, and the supernatant was used. Phosphate in the cell lysate was removed using an ammonium sulfate solution (Thermo Fisher, MA, USA). The reaction mix and ATPase assay developer were added to the samples, and ATPase activity was measured at 650 nm using an Epoch microplate spectrophotometer (BioTek, Winooski, VT, USA).
2.10. ATP determination assay
RWPE-1 cells were seeded in dishes at a density of 1 × 10⁵ cells/well and treated with 10 nM DHT and/or MitoQ (25, 50, and 100 μM) for 24 h. ATP level was determined using a CellTiter-Glo® Luminescent Cell Viability Assay kit (Promega, WI, USA). ATP disodium salt (Sigma Aldrich, St. Louis, MI, USA) was used to generate an ATP standard curve. CellTiter-Glo® reagent was added to the samples, and luminescence was measured using an Epoch microplate spectrophotometer (BioTek, Winooski, VT, USA).
2.11. Experimental animals and sample treatment
Six-week-old male Sprague-Dawley rats (n = 40; 200 ± 20 g) were purchased from Daehan Biolink Co. (Daejeon, Korea). The animals were randomly allocated at four rats per cage and housed under conditions in accordance with the guidelines for the care and use of laboratory animals adopted and promulgated by Sangji University according to the requirements established by the National Institutes of Health. All experimental protocols were approved by the Institutional Animal Care and Use Committee (IACUC) of Sangji University before the initiation of any study (IACUC Animal Approval Protocol #2018-18). The rats were acclimatized to laboratory conditions for 1 week before starting the experiment. Briefly, rats were randomly divided into five groups (n = 8 per group): group 1, control (Con, normal prostate with vehicle: 100 μL corn oil, s.c.); group 2, BPH-induced rats (BPH, 10 mg/kg testosterone propionate dissolved in corn oil); group 3, BPH-induced rats treated with Saw palmetto, 100 mg/kg/day, p.o. (Saw); group 4, BPH-induced rats treated with MitoQ, 5 mg/kg/day, p.o. (Mito 5); and group 5, BPH-induced rats treated with MitoQ, 25 mg/kg/day, p.o. (Mito 25). To eliminate the influence of intrinsic testosterone, all rats in the BPH-induced groups underwent bilateral orchiectomies, which were performed 7 days prior to the administration of testosterone propionate. The rats in the control group were cut open and sewn up without removing the testicles following anesthesia using zoletil 50 (intraperitoneal injection, 10 mg/kg). After a 1-week recovery period, the rats in the BPH-induced groups were subcutaneously injected with 10 mg/kg/day testosterone propionate alone or in combination with MitoQ or Saw for 4 weeks, except on weekends. Twenty-four hours after the final administration, all rats were euthanized following anesthesia with zoletil 50 (i.p., 20 mg/kg). Blood samples were drawn via cardiac puncture, and serum was obtained via centrifugation and stored at −80 °C.
2.12. Histological analysis
Prostate tissues from each group were fixed in 4% formalin and embedded in paraffin. Tissues were cut into 4-μm sections. The sections were stained with hematoxylin and eosin (H&E) for histological examination. Images were acquired using a Leica DFC 295 microscope (Leica, Wetzlar, Germany). The thickness of the epithelium in the prostate tissue was measured using the Leica Application Suite software (LAS ver. 3.3.0; Leica Microsystems, Inc., Buffalo Grove, IL, USA).
2.13. Immunohistochemistry (IHC)
IHC was performed using formalin-fixed paraffin-embedded samples. Paraffin blocks were cut into 4-μm thick sections, mounted onto poly l-lysine-coated slides, and dried. After the dried slides were de-paraffinized, antigen retrieval was performed using an automated antigen retrieval machine for 20 min using ethylenediaminetetraacetic acid (pH 9.0). Non-specific binding to the sections was blocked via incubation for 1 h in 15–20% normal goat serum (Gibco Life Technologies, NY, USA) prior to incubation with the appropriate primary antibodies for 2 h at 22–25 °C or overnight at 4 °C. Secondary rabbit antibodies were used to detect the primary antibodies, followed by detection using streptavidin-tagged horseradish peroxidase (Ventana Medical Systems, Tucson, AZ, USA). Diaminobenzidine (Sigma-Aldrich) was used to induce signaling, and bluing reagent (Ventana Medical Systems) was used as a counterstain. The IHC slides were visualized using an optical microscope (Leica) and rendered using Leica software. IHC staining of antibodies against PCNA (Cat. No. sc-56) was performed.
2.14. ROS assay
After the male rats were euthanized, the prostate tissues were excised and treated with type I collagenase (Thermo Fisher Scientific, MA, USA) to dissociate the cells. Single cells from primary prostate tissues were mixed with Muse® Oxidative Stress Reagent working solution. Cells were incubated for 30 min at 37 °C and detected using a Muse® Cell Analyzer (Merck, Darmstadt, Germany).
2.15. DHT and testosterone measurement
Serum levels of DHT and testosterone were quantified using commercial ELISA kits (Cusabio, TX, USA). The assays were performed according to the manufacturer's instructions.
2.16. Statistical analysis
Experiments were performed in triplicate, and the results are expressed as mean ± standard deviation (SD). Statistically significant values were determined using analysis of variance and Dunnett's post-hoc test. Statistical significance was set at p < 0.05. Statistical analyses were performed using GraphPad Prism 5.
3. Results
3.1. MitoQ suppressed prostate cell proliferation and abrogated oxidative stress in DHT-stimulated RWPE-1 cells
Since BPH is based on abnormal proliferation of prostate cells, regulating their proliferation is considered effective for BPH. RWPE-1 cell proliferation was suppressed by 25 μM and higher concentrations of MitoQ (Fig. 1B). Under DHT stimulation, RWPE-1 cells showed increased proliferation, which was significantly repressed by treatment with ≥6.25 μM MitoQ (Fig. 1C). The antiproliferative effects of MitoQ were evaluated at concentrations of 25, 50, and 100 μM. Next, overexpression of 8OHdG, a marker of oxidative stress, was observed in DHT-stimulated RWPE-1 cells, which MitoQ treatment notably suppressed (Fig. 1D). In addition, the mRNA levels of HO-1 and GPX-1 was significantly lower in the DHT group than those in the vehicle group. MitoQ treatment normalized these levels, and 100 μM MitoQ significantly increased the mRNA level of HO-1 and GPX-1, suggesting its antioxidant effects in DHT-stimulated prostate cells (Fig. 1E). DHT stimulation also induced excess production of mtROS via H2O2 in RWPE-1 cells, which MitoQ treatment suppressed (Fig. 1F). To modulate oxidative stress created by mtROS, mitochondria operate ROS-scavenging systems, where superoxide dismutase (SOD) converts superoxide radicals into H2O2, which is further detoxified by catalase [29]. As shown in Fig. 1G, treatment with MitoQ significantly increased SOD2 and catalase protein expression in DHT-stimulated RWPE-1 cells, exerting antioxidant effects on mtROS in prostate cells stimulated by androgen.
Fig. 1.

Antioxidant effect of MitoQ in DHT-stimulated RWPE-1 cells. (A) Molecular structure of MitoQ. (B) Viability of MitoQ-treated RWPE-1 cells at the indicated concentration for 24 h measured via the CCK-8 assay. (C) RWPE-1 cell proliferation under DHT (10 nM) stimulation and MitoQ at the indicated concentration for 24 h measured via the CCK-8 assay. (D) The expression of 8OHDG in DHT-stimulated RWPE-1 cells treated with MitoQ (25, 50, and 100 μM). (E) The mRNA expression of HO-1 and GPX-1 in DHT-stimulated RWPE-1 cells treated with MitoQ (25, 50, and 100 μM). The results are expressed as means ± SD (n = 3). ###p < 0.001 vs. vehicle group; **p < 0.01, ***p < 0.001 vs. DHT-stimulated group. (F) The manifestation of MitoTracker™ and MitoSOX™ in DHT-stimulated MitoQ-treated RWPE-1 cells (100 μM); 0.6% H2O2 was used as positive control. (G) Catalase and SOD2 protein expression in DHT-stimulated RWPE-1 cells treated with MitoQ (25, 50, and 100 μM). The results are expressed as means ± SD (n = 3). ###p < 0.001 vs. vehicle group; **p < 0.01, ***p < 0.001 vs. DHT-stimulated group.
3.2. MitoQ exerted antioxidant effects by inhibiting NLRP3 in DHT-stimulated RWPE-1 cells
The NLRP3 inflammasome was studied to elucidate the signaling pathway underlying MitoQ suppression of prostate cell proliferation. Since MitoQ inhibits mtROS by repressing the NLRP3 inflammasome [22], it was hypothesized to inhibit NLRP3 expression in DHT-stimulated RWPE-1 cells. NLRP3 protein expression increased under DHT stimulation of RWPE-1 cells, whereas MitoQ significantly suppressed it (Fig. 2A). In addition, the mRNA expressions of NLRP3, PYCARD, and IL-1β was significantly increased in DHT-stimulated RWPE-1 cells, whereas they were significantly reduced by MitoQ treatment (Fig. 2B). To clarify the effect of MitoQ on NLRP3 signaling, RWPE-1 cells were transfected with NLRP3 siRNA and then stimulated with DHT. The significant decrease in NLRP3 mRNA expression in RWPE-1 cells was confirmed using NLRP3 siRNA (Supplementary Fig. 1). In green fluorescent protein (GFP)-transfected cells, DHT stimulation significantly increased NLRP3 and IL-1β levels. In contrast, NLRP3 siRNA transfection notably suppressed their levels and neutralized the effect of MitoQ on RWPE-1 cells (Fig. 2C). As shown in Fig. 2D, a molecular docking simulation was conducted to validate whether MitoQ could directly bind to the NACHT domain of NLRP3. MitoQ, testosterone, DHT, and RM5, a recently identified inhibitor, were docked into the NACHT domain. MitoQ showed an affinity value of −9.1 kcal/mol, and testosterone and DHT showed higher binding energy values (−8.1 and −8.4 kcal/mol, respectively). Additionally, RM5 showed a higher binding energy of −9.0 kcal/mol. Of the four ligands, MitoQ was predicted to be the strongest binding ligand (lowest binding energy = −9.1 kcal/mol). Because the 3D binding structure of RM5 onto the NACHT domain was determined using X-ray crystallography [27], the better binding affinity of MitoQ predicted via docking simulation implies that it is also a strong binding ligand to the NACHT domain of NLRP3. Because ATPase activity is involved in NLRP3 inflammasome activation [30], the inhibitory effect of MitoQ on ATPase activity in DHT-stimulated RWPE-1 cells was estimated (Fig. 2E). ATPase activity was significantly higher in the DHT group than that in the vehicle group, whereas MitoQ treatment significantly suppressed ATPase-specific activity. Additionally, we analyzed ATP levels in DHT-stimulated RWPE-1 cells. DHT stimulation significantly increased ATP levels, whereas MitoQ treatment significantly reduced them in a dose-dependent manner (Fig. 2F).
Fig. 2.

Effect of MitoQ on the NLRP3 signaling pathway in DHT-stimulated RWPE-1 cells. (A) NLRP3 expression in DHT-stimulated RWPE-1 cells treated with MitoQ (25, 50, and 100 μM). (B) The mRNA expression of NLRP3, PYCARD, and IL-1β in DHT-stimulated RWPE-1 cells treated with MitoQ (25, 50, and 100 μM). The results are expressed as means ± SD (n = 3). ###p < 0.001 vs. vehicle group; *p < 0.05, **p < 0.01, ***p < 0.001 vs. DHT-stimulated group. (C) RWPE-1 cells were transfected with GFP or NLRP3 siRNA and stimulated with or without DHT, and then transfected with NLRP3 siRNA. The mRNA expression of NLRP3 and IL-1β was estimated in transfected RWPE-1 cells. ###p < 0.001 vs. GFP group; ***p < 0.001 vs. DHT-stimulated GFP group; $$$p < 0.001 vs. DHT-stimulated NLRP3 siRNA-transfected group. (D) Molecular docking simulation on the NACHT domain of NLRP3 was conducted using Autodock Vina v1.1.2. (E) The ATPase activity in MitoQ-treated RWPE-1 cells was analyzed under DHT stimulation. (F) ATP level in DHT-stimulated RWPE-1 cells treated with MitoQ (25, 50, and 100 μM). The results are expressed as means ± SD (n = 3). ###p < 0.001 vs. vehicle group; ***p < 0.001 vs. DHT-stimulated group.
3.3. MitoQ suppressed the AR signaling pathway in DHT-stimulated RWPE-1 cells
Since BPH is based on androgen-dependent abnormal proliferation of prostate cells, regulating androgen/AR signaling is considered effective in BPH. As shown in Fig. 3A, DHT stimulation induced AR overexpression in RWPE-1 cells, which was clearly suppressed by MitoQ treatment. In addition, the mRNA levels of AR, 5α-reductase 2, and PSA were significantly upregulated in the DHT-stimulated group, whereas MitoQ treatment notably inhibited them (Fig. 3B). DHT stimulation also increased PSA protein expression, which was significantly suppressed by MitoQ (Fig. 3C). AR contributes to testosterone-induced NLRP3 inflammasome activation and oxidative stress [31]. The contribution of NLRP3 and AR signaling to the effect of MitoQ on DHT-stimulated prostate cells was further evaluated using siRNA. As shown in Fig. 3D, DHT stimulation significantly increased AR levels in GFP-transfected cells. Interestingly, NLRP3 siRNA transfection also significantly increased AR levels under DHT stimulation, which were notably downregulated by MitoQ treatment. Furthermore, DHT stimulation significantly increased NLRP3 levels in GFP-transfected cells. AR siRNA transfection also significantly upregulated NLRP3 levels, whereas MitoQ treatment significantly suppressed them (Fig. 3E). These results suggest that DHT may combine with AR and NLRP3, increasing their expression, and that MitoQ acts as an inhibitor of both AR and NLRP3. Next, direct binding of MitoQ to AR was investigated via molecular docking. Docking was performed using a DHT-bound AR structure. To compare the docking affinity values of the ligands, DHT already bound to this structure was removed and then re-docked. DHT was docked to the same binding site, very similar to the shape shown by X-ray crystallography, and showed an affinity value of −10.42 kcal/mol. Testosterone and MitoQ were confirmed to bind to the binding site, and their predicted affinity values in the docking simulation were −9.94 and −9.39 kcal/mol, respectively (Fig. 3F). Although predicted MitoQ binding was not stronger than that of testosterone and DHT, it seemed to bind to AR, as the difference between the DHT and MitoQ values was quite small (∼1 kcal/mol).
Fig. 3.

Inhibitory effect of MitoQ on AR-dependent cellular proliferation in DHT-stimulated RWPE-1 cells. (A) AR protein expression in DHT-stimulated RWPE-1 cells treated with MitoQ (25, 50, and 100 μM). (B) The mRNA levels of AR, 5α-reductase, and PSA in DHT-stimulated RWPE-1 cells treated with MitoQ (25, 50, and 100 μM). (C) PSA protein level in DHT-stimulated RWPE-1 cells treated with MitoQ (25, 50, and 100 μM). (D) Under DHT stimulation, mRNA expression of AR in NLRP3 siRNA-transfected RWPE-1 cells with or without 100 μM of MitoQ and (E) the mRNA expression of NLRP3 in AR siRNA-transfected RWPE-1 cells with or without 100 μM of MitoQ. The results are expressed as means ± SD (n = 3). ###p < 0.001 vs. GFP group; ***p < 0.001 vs. DHT-stimulated GFP group; $$$p < 0.001 vs. DHT-stimulated NLRP3 siRNA or AR siRNA-transfected group. (F) Molecular docking simulation of AR was conducted using Autodock Vina v1.1.2.
3.4. MitoQ alleviated prostate enlargement and prostate cell proliferation in rats with BPH
Given the suppressive effects of MitoQ on DHT-dependent prostate cell proliferation in vitro, its therapeutic effects were evaluated in a testosterone-induced BPH rat model. Testosterone injection resulted in prostate enlargement. Saw, a highly effective anti-androgen, was used as a positive control in our experimental system [32]. Administration of 5 and 25 mg/kg of MitoQ reduced the prostate size in the positive control (Fig. 4A). Rats with BPH exhibited increased prostate weight, whereas rats in the Mito and Saw groups showed a significant reduction in prostate weight (Fig. 4B). Histological analysis showed a hyperplastic pattern in the BPH group, including thickened epithelium, whereas administration of Saw and MitoQ restored histological alterations and significantly reduced the thickened epithelium (Fig. 4C and D). In addition, the effect of MitoQ on the cell proliferation marker PCNA was analyzed. The BPH group showed significantly overexpressed PCNA protein and mRNA in comparison to that in the Con group, whereas administration of Saw and MitoQ clearly suppressed this overexpression (Fig. 4C, E, and F). In particular, the inhibitory effect of MitoQ 25 on cellular proliferation was superior to that of Saw.
Fig. 4.

Effect of MitoQ on prostate cell proliferation in rats with BPH. (A) Representative prostate pictures from each experimental group. (B) Prostate weight to body weight (PW/BW) ratio was calculated at the end of the experiments. (C) H&E and IHC staining for PCNA were conducted using prostate tissue sections. Images from each group were observed using a Leica microscope (original magnification = ×40). (D) The thickness of the epithelium of the prostate tissue was measured using Leica Application Suite software. (E) The extent of PCNA-positive units was measured based on IHC staining. (F) PCNA mRNA level in the prostate of each experimental group was quantified using qRT-PCR. ###p < 0.001 compared with the Con group; ***p < 0.001 compared with the BPH group; analysis of variance, followed by Dunnett's post-hoc test.
3.5. MitoQ exerted antioxidant effects in rats with BPH
Early studies have documented that androgen deprivation therapy can decrease oxidative stress [33]. Thus, the expression of 8-OHdG, a marker of oxidative stress, was examined in the prostate tissues from a testosterone-induced BPH rat model. The intensity of 8-OHdG-positive staining in the BPH group was significantly higher than that in the Con group. In contrast, this intensity was significantly lower in the MitoQ-treated group than that in the BPH group (Fig. 5A and B). To identify whether MitoQ exerts an antioxidant effect in the testosterone-induced BPH rat model, the extent of ROS production and the levels of antioxidant enzymes in the prostate tissues were assessed. As shown in Fig. 5C, BPH induced the generation of intracellular ROS in BPH group, compared to the Con group, whereas administration of MitoQ significantly suppressed ROS generation in a dose-dependent manner. In addition, lower mRNA levels of HO-1, SOD1, and PGC1α were observed in the BPH group, compared with the Con group. In contrast, these levels were upregulated by the administration of MitoQ, but not of Saw (Fig. 5D). As shown in Fig. 5E, the expressions of catalase and SOD2 in the BPH group were significantly lower than that in the Con group. In contrast, these expressions were significantly higher in the MitoQ-treated group than that in the BPH group.
Fig. 5.

Effect of MitoQ on oxidative stress in rats with BPH. (A) IF assay was conducted to detect the protein expression of 8-OHdG. (B) The extent of 8-OHdG positive unit was measured, based on IF assay. (C) ROS scavenging effect of MitoQ was measured using ROS assay. The extent of ROS positive cells from prostate was calculated. (D) The mRNA expression of HO-1, SOD1, and PGC1α was evaluated using qRT-PCR. ###P < 0.001 compared with the Con group; ***P < 0.001 compared with the BPH group; analysis of variance, followed by Dunnett's post-hoc test. (F) The protein expression of Catalase and SOD2 in rats with BPH. The results are expressed as the mean ± SD (n = 3). ###p < 0.001 vs. vehicle group; ***p < 0.001 compared with the BPH group.
3.6. MitoQ inhibited the NLRP3 signaling pathway in rats with BPH
Next, the involvement of the NLRP3 inflammasome in the prostate tissues from rats with BPH was analyzed. BPH upregulated the expression of NLRP3, which was reversed by MitoQ treatment (Fig. 6A and B). Fig. 6C also shows that the increased mRNA levels of PYCARD and IL-1β induced by BPH were repressed by MitoQ administration. As shown in Fig. 6D and E, BPH induction increased the protein expression of NLRP3, pro-caspase 1, cleaved caspase 1, and IL-1β, compared to the Con group. However, MitoQ treatment suppressed the overexpression of these proteins. These results strongly support the protective effects of MitoQ in BPH via regulation of the NLRP3 signaling pathway.
Fig. 6.

Effect of MitoQ on NLPR3 signaling pathway in rats with BPH. (A) An IF assay was conducted to detect NLRP3 protein expression. (B) NLRP3-positive units were measured based on the IF assay. (C) The mRNA expression of PYCARD and IL-1β was evaluated using qRT-PCR. (D) The protein level of NLRP3, pro-caspase 1, cleaved caspase 1, and IL-1β was measured using western blotting. (E) The relative protein level was normalized to that of β-actin (housekeeping gene). ###p < 0.001 compared with the Con group; *p < 0.05, **p < 0.01, and ***p < 0.001 compared with the BPH group; analysis of variance, followed by Dunnett's post-hoc test.
3.7. MitoQ repressed the expression of androgen-relative markers in rats with BPH
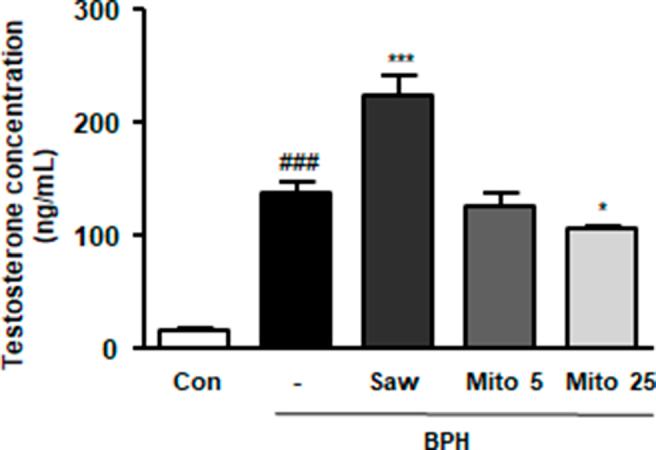
Considering the in vitro results, where MitoQ treatment suppressed AR and 5α-reductase levels, its inhibitory effects on androgen signaling were investigated in rats with BPH. As shown in Fig. 7A, BPH induction increased DHT production, whereas MitoQ and Saw administration significantly suppressed overproduction. Moreover, BPH induction significantly increased circulating testosterone levels, which 25 mg/kg MitoQ significantly reduced. Saw administration increased the serum testosterone level in BPH rats (Supplementary Fig. 3). As shown in Fig. 7B and C, Saw and MitoQ administration downregulated the mRNA levels of 5α-reductase 2, AR, and SRC-1, which were enhanced by BPH induction. The protein expression of PSA, a biomarker for the diagnosis of prostate diseases, increased in the BPH group, and decreased under Saw and MitoQ (Fig. 7D). These findings suggest that MitoQ suppresses BPH progression via androgen signaling.
Fig. 7.

Effect of MitoQ on the androgen/AR signaling pathway in rats with BPH. (A) DHT level in the serum from each experimental group was measured using an ELISA kit. (B, C) The mRNA level of (B) 5α-reductase 2 and (C) AR and SRC-1 was quantified using qRT-PCR. (D) PSA protein expression was evaluated using western blotting. ##p < 0.01, ###p < 0.001 compared with the Con group; **p < 0.01, ***p < 0.001 compared with the BPH group; analysis of variance, followed by Dunnett's post-hoc test.
4. Discussion
In men with hypogonadism, testosterone replacement induces prostate enlargement [34], indicating androgen involvement. Androgens have been shown to increase AR transactivation, nuclear localization, and protein expression [35]. In addition, androgens increase basal level of ROS, regarded as a downstream mediator of androgen-dependent signaling [36]. Oxidative stress should be considered as the main factor leading to compensatory cellular proliferation and the resulting BPH [37]. Prostate tissue is vulnerable to oxidative damage owing to the faster cell turnover and low levels of DNA repair enzymes. In prostate cells, an imbalance between ROS and antioxidants assists disease development [38]. AR activities are regulated by ROS, and the AR signaling pathway operates by generating ROS, suggesting a regulatory loop between AR and ROS [39]. In agreement with a previous study, where excessive activation of AR by testosterone could provoke systemic oxidative stress [40], a notable increase in ROS and upregulation of AR were observed in the prostate tissues from testosterone-induced BPH rats and androgen-stimulated prostate cells. AR is a nuclear transcription factor that directly functions in the mitochondria and is associated with mitochondrial dysfunction, which induces AR expression [41]. Here, AR expression and mtROS production were blocked by MitoQ, suggesting that MitoQ may act as an AR blocker and antioxidant in BPH.
Under disease conditions, the NLRP3 inflammasome is differentially expressed between male and female patients and is closely related to the progression of severe inflammation, which may be related to sex hormones. Several studies have demonstrated that androgen influences activation of the NLRP3 inflammasome in some pathological states [42]. Testosterone treatment has been reported to induce NLRP3 inflammasome activation and mtROS production, where an AR antagonist and NLRP3 inhibitor prevent testosterone-induced dysfunction, suggesting a link between AR, NLRP3, and ROS [31]. Consistent with previous studies, these results showed the antioxidant effects of MitoQ via inhibition of the AR and NLRP3 pathways in BPH. The NLRP3 inflammasome consists of three domains: an N-terminal pyrin domain (PYD), central NACHT, and C-terminal leucine-rich repeat (LRR) domain. PYD interacts with ASC adaptor proteins. The NACHT domain has ATPase activity, which is crucial for the function of NLRP3. LRR is thought to provoke auto-inhibition by folding back into the NACHT region [43]. NLRP3 inhibitors, such as CY-09 and MCC950, target the NACHT domain and suppress ATPase activity [44]. In this study, our results revealed that MitoQ directly and strongly binds to the NLRP3 NACHT domain and suppresses ATPase activity (Fig. 2). Additionally, we observed that MitoQ inhibited ATP production in DHT-stimulated RWPE-1 cells (Fig. 2F). The inhibitory effect of MitoQ on ATP production is the result of APTase inhibition and the ability of MitoQ to inhibit prostate cell proliferation. Although details of ATPase activity in NLRP3 function have not been fully elucidated, in this study, we suggest that MitoQ exerts anti-proliferative effects on prostate cells by inhibiting the NLRP3 NACHT domain. In addition, as inhibitors that target the PYD of NLRP3, MitoQ, testosterone, and DHT were docked into the PYD. As shown in Supplementary Fig. 2, MitoQ revealed an affinity value of −6.9 kcal/mol, whereas testosterone and DHT revealed higher binding energy values (−4.5 and −6.1 kcal/mol, respectively), suggesting MitoQ as binding ligand of the PYD of NLRP3.
Although the antioxidant effect of MitoQ has previously been reported, this is the first study to reveal a novel mechanism of its anti-proliferative effects in BPH. MitoQ has already undergone phase I safety and phase II efficacy clinical trials for various diseases, including Parkinson's disease and hepatitis C. Some studies have shown that MitoQ protects against oxidative stress-induced conditions in cell lines and animal disease models [42,45]. Initially, MitoQ was developed to prevent cell death caused by oxidative stress in pathological diseases, including Parkinson's disease [46]. In contrast, Rao et al. demonstrated the anti-proliferative effect of MitoQ through an apoptotic cell death mechanism, suggesting that MitoQ causes cytotoxicity in cancer cells, but not in healthy cells. These findings also suggest that MitoQ could inhibit the proliferation of diseased prostate cells. Unlike other tissues, normal prostate epithelial cells depend on glycolysis, because the TCA cycle enzyme mitochondrial aconitase is blocked by high intracellular zinc levels. In the early stage of carcinogenesis, prostate cells lose their ability to accumulate zinc owing to the suppression of zinc transporters. Therefore, TCA blockade is mitigated, and the cells change their metabolism to produce energy via oxidative phosphorylation [47]. In this study, we observed that DHT stimulation induced an increase in mitochondrial activity and mtROS, whereas MitoQ treatment significantly suppressed mtROS production by modulating catalase and SOD2 (Fig. 1F and G, Fig. 5E). Our results suggest that increased mtROS production in BPH could be related to the early stage of carcinogenesis, and MitoQ might present a therapeutic effect in prostate cancer treatment. Although the efficacy and safety of MitoQ have been confirmed in many studies, further studies are needed to validate its effect on BPH and prostatic cancer.
Meanwhile, there is additional consideration in this study. Here, we used six-week-old male rats to induce BPH. As BPH is known to be a disease of elderly men, there may be concern about difficulty of extrapolating our results to humans. However, the mechanisms of the linkage between the development and progression of BPH with age are not completely understood. Additionally, the association of BPH with not only age but also prostatic inflammation has been actively discussed [48,49]. The testosterone-induced BPH rats model has shown a significant increase in urinary frequency and a decrease in mean voided volume, which is very similar to the clinical symptoms experienced by BPH patients. Although a recent study has reported that old rats are more susceptible to developing BPH in comparison to young rats, it has also been found that young rats treated with testosterone exhibit a significant increase in prostate weight and prostatic index [50]. However, additional experiments using mature rats are also needed for the future clinical use of MitoQ.
To the best of our knowledge, this is the first study to suggest association among MitoQ, AR, and NLRP3 in BPH. This study showed that MitoQ exerts antioxidant effects by inhibiting NLPR3 and AR expression, thereby suppressing androgen-dependent prostate cell proliferation and ultimately mitigating the progression of BPH. In particular, these results demonstrated that DHT combines with AR and NLRP3, and MitoQ acts as an inhibitor of both AR and NLRP3. Using a docking assay, MitoQ was predicted to bind to AR as successfully as DHT; in particular, MitoQ binds to NLRP3 stronger than its inhibitor, RM5. The evidence from this study suggests that MitoQ could be an efficient agent for the treatment of BPH via AR and NLRP3 inhibition.
Ethics approval and consent to participate
All experimental protocols were approved by the IACUC of Sangji University before the initiation of the study (IACUC Animal approval protocol #2018-18).
Consent for publication
Not applicable.
Availability of data and materials
The data supporting the findings of this study are available from the corresponding author upon reasonable request.
Funding
This work was supported by the Basic Science Research Program through the National Research Foundation of Korea, funded by the Ministry of Science, ICT & Future Planning (NRF-2021R1A6A3A01086659), and a grant from the Korea Health Technology R&D Project through the Korea Health Industry Development Institute, funded by the Ministry of Health & Welfare, Republic of Korea (HI21C2537).
Author contributions
B.R.J. and H.J.A. conceptualized and designed the experiments; B.R.J., H.J.K., and C.Y.L. performed the experiments; B.R.J., H.J.A., and M.L. analyzed the data; H.J.A. and M.L. provided the reagents, materials, and analysis tools; B.R.J. and H.J.A. drafted the manuscript. All authors read and approved the final manuscript.
Declaration of competing interest
The authors declare that they have no known competing financial interests or personal relationships that could have appeared to influence the work reported in this paper.
Footnotes
Supplementary data to this article can be found online at https://doi.org/10.1016/j.redox.2023.102816.
Contributor Information
Minho Lee, Email: MinhoLee@dgu.edu.
Hyo-Jin An, Email: hjan@khu.ac.kr.
Appendix A. Supplementary data
The following are the supplementary data to this article:
Supplementary Fig. 1.

NLRP3 and AR mRNA expressions in siRNA-transfected RWPE-1 cells. (A) NLRP3 mRNA expression in NLRP3 siRNA-transfected RWPE-1 cells. (A) AR mRNA expression in AR siRNA-transfected RWPE-1 cells. ###p < 0.001 compared with the GFP group; analysis of variance, followed by Dunnett's post-hoc test.
Supplementary Fig. 2.

Molecular docking simulation of the PYD of NLRP3.
Supplementary Fig. 3.
Testosterone level in rats with BPH. The level of testosterone in the serum from each experimental group was measured using an ELISA kit.
Data availability
Data will be made available on request.
References
- 1.Roehrborn C.G. Male lower urinary tract symptoms (LUTS) and benign prostatic hyperplasia (BPH) Med. Clin. 2011 Jan;95(1):87–100. doi: 10.1016/j.mcna.2010.08.013. PubMed PMID: 21095413. [DOI] [PubMed] [Google Scholar]
- 2.Lee S.W.H., Chan E.M.C., Lai Y.K. The global burden of lower urinary tract symptoms suggestive of benign prostatic hyperplasia: a systematic review and meta-analysis. Sci. Rep. 2017 Aug 11;7(1):7984. doi: 10.1038/s41598-017-06628-8. PubMed PMID: 28801563. Pubmed Central PMCID: 5554261. [DOI] [PMC free article] [PubMed] [Google Scholar]
- 3.Glynn R.J., Campion E.W., Bouchard G.R., Silbert J.E. The development of benign prostatic hyperplasia among volunteers in the Normative Aging Study. Am. J. Epidemiol. 1985 Jan;121(1):78–90. PubMed PMID: 3964994. [PubMed] [Google Scholar]
- 4.Naslund M.J., Gilsenan A.W., Midkiff K.D., Bown A., Wolford E.T., Wang J. Prevalence of lower urinary tract symptoms and prostate enlargement in the primary care setting. Int. J. Clin. Pract. 2007 Sep;61(9):1437–1445. doi: 10.1111/j.1742-1241.2007.01508.x. PubMed PMID: 17686091. [DOI] [PubMed] [Google Scholar]
- 5.Awedew A.F., Han H., Abbasi B., Abbasi-Kangevari M., Ahmed M.B., Almidani O., et al. The global, regional, and national burden of benign prostatic hyperplasia in 204 countries and territories from 2000 to 2019: a systematic analysis for the Global Burden of Disease Study 2019. The Lancet Healthy Longevity. 2022;3(11):e754–e776. doi: 10.1016/S2666-7568(22)00213-6. [DOI] [PMC free article] [PubMed] [Google Scholar]
- 6.Ng M., Baradhi K.M. 2020. Benign Prostatic Hyperplasia. [PubMed] [Google Scholar]
- 7.Chughtai B., Lee R., Te A., Kaplan S. Role of inflammation in benign prostatic hyperplasia. Rev. Urol. 2011;13(3):147–150. PubMed PMID: 22110398. Pubmed Central PMCID: 3221555. [PMC free article] [PubMed] [Google Scholar]
- 8.Da Silva M.H.A., De Souza D.B. Current evidence for the involvement of sex steroid receptors and sex hormones in benign prostatic hyperplasia. Res. Rep. Urol. 2019;11:1. doi: 10.2147/RRU.S155609. [DOI] [PMC free article] [PubMed] [Google Scholar]
- 9.Cannarella R., Condorelli R.A., Barbagallo F., La Vignera S., Calogero A.E. Endocrinology of the aging prostate: current concepts. Front. Endocrinol. 2021;12 doi: 10.3389/fendo.2021.554078. PubMed PMID: 33692752. Pubmed Central PMCID: 7939072. [DOI] [PMC free article] [PubMed] [Google Scholar]
- 10.Tong Y., Zhou R.Y. Review of the roles and interaction of androgen and inflammation in benign prostatic hyperplasia. Mediat. Inflamm. 2020;2020 doi: 10.1155/2020/7958316. PubMed PMID: 33192175. Pubmed Central PMCID: 7641707. [DOI] [PMC free article] [PubMed] [Google Scholar]
- 11.Minciullo P.L., Inferrera A., Navarra M., Calapai G., Magno C., Gangemi S. Oxidative stress in benign prostatic hyperplasia: a systematic review. Urol. Int. 2015;94(3):249–254. doi: 10.1159/000366210. PubMed PMID: 25503259. [DOI] [PubMed] [Google Scholar]
- 12.Kashyap M., Pore S., Wang Z., Gingrich J., Yoshimura N., Tyagi P. Inflammasomes are important mediators of prostatic inflammation associated with BPH. J. Inflamm. 2015;12(1):1–8. doi: 10.1186/s12950-015-0082-3. [DOI] [PMC free article] [PubMed] [Google Scholar]
- 13.He M., Chiang H.H., Luo H., Zheng Z., Qiao Q., Wang L., et al. An acetylation switch of the NLRP3 inflammasome regulates aging-associated chronic inflammation and insulin resistance. Cell Metabol. 2020 Mar 3;31(3):580–591. doi: 10.1016/j.cmet.2020.01.009. e5. PubMed PMID: 32032542. Pubmed Central PMCID: 7104778. [DOI] [PMC free article] [PubMed] [Google Scholar]
- 14.Davis B.K., Wen H., Ting J.P. The inflammasome NLRs in immunity, inflammation, and associated diseases. Annu. Rev. Immunol. 2011;29:707–735. doi: 10.1146/annurev-immunol-031210-101405. PubMed PMID: 21219188. Pubmed Central PMCID: 4067317. [DOI] [PMC free article] [PubMed] [Google Scholar]
- 15.Liu Q., Zhang D., Hu D., Zhou X., Zhou Y. The role of mitochondria in NLRP3 inflammasome activation. Mol. Immunol. 2018 Nov;103:115–124. doi: 10.1016/j.molimm.2018.09.010. PubMed PMID: 30248487. [DOI] [PubMed] [Google Scholar]
- 16.Zhou R., Yazdi A.S., Menu P., Tschopp J. A role for mitochondria in NLRP3 inflammasome activation. Nature. 2011 Jan 13;469(7329):221–225. doi: 10.1038/nature09663. PubMed PMID: 21124315. [DOI] [PubMed] [Google Scholar]
- 17.Yu S., Yin J.J., Miao J.X., Li S.G., Huang C.Z., Huang N., et al. Activation of NLRP3 inflammasome promotes the proliferation and migration of esophageal squamous cell carcinoma. Oncol. Rep. 2020 Apr;43(4):1113–1124. doi: 10.3892/or.2020.7493. PubMed PMID: 32323780. Pubmed Central PMCID: 7057919. [DOI] [PMC free article] [PubMed] [Google Scholar]
- 18.Sun H.J., Ren X.S., Xiong X.Q., Chen Y.Z., Zhao M.X., Wang J.J., et al. NLRP3 inflammasome activation contributes to VSMC phenotypic transformation and proliferation in hypertension. Cell Death Dis. 2017 Oct 5;8(10) doi: 10.1038/cddis.2017.470. PubMed PMID: 28981106. Pubmed Central PMCID: 5680591. [DOI] [PMC free article] [PubMed] [Google Scholar]
- 19.Murphy M.P. Understanding and preventing mitochondrial oxidative damage. Biochem. Soc. Trans. 2016 Oct 15;44(5):1219–1226. doi: 10.1042/BST20160108. PubMed PMID: 27911703. Pubmed Central PMCID: 5095902. [DOI] [PMC free article] [PubMed] [Google Scholar]
- 20.Piscianz E., Tesser A., Rimondi E., Melloni E., Celeghini C., Marcuzzi A. MitoQ is able to modulate apoptosis and inflammation. Int. J. Mol. Sci. 2021 Apr 30;(9):22. doi: 10.3390/ijms22094753. PubMed PMID: 33946176. Pubmed Central PMCID: 8124358. [DOI] [PMC free article] [PubMed] [Google Scholar]
- 21.Dashdorj A., Jyothi K.R., Lim S., Jo A., Nguyen M.N., Ha J., et al. Mitochondria-targeted antioxidant MitoQ ameliorates experimental mouse colitis by suppressing NLRP3 inflammasome-mediated inflammatory cytokines. BMC Med. 2013 Aug 6;11:178. doi: 10.1186/1741-7015-11-178. PubMed PMID: 23915129. Pubmed Central PMCID: 3750576. [DOI] [PMC free article] [PubMed] [Google Scholar]
- 22.Chong L., Li H., Zhu L., Yu G. Regulatory effect of mitoQ on the mtROS-NLRP3 inflammasome pathway in leptin-pretreated BEAS-2 cells. Exp. Ther. Med. 2021 May;21(5):466. doi: 10.3892/etm.2021.9897. PubMed PMID: 33763153. Pubmed Central PMCID: 7983181. [DOI] [PMC free article] [PubMed] [Google Scholar]
- 23.Cheng G., Zielonka J., McAllister D., Hardy M., Ouari O., Joseph J., et al. Antiproliferative effects of mitochondria-targeted cationic antioxidants and analogs: role of mitochondrial bioenergetics and energy-sensing mechanism. Cancer Lett. 2015 Aug 28;365(1):96–106. doi: 10.1016/j.canlet.2015.05.016. PubMed PMID: 26004344. Pubmed Central PMCID: 4476640. [DOI] [PMC free article] [PubMed] [Google Scholar]
- 24.Rao V.A., Klein S.R., Bonar S.J., Zielonka J., Mizuno N., Dickey J.S., et al. The antioxidant transcription factor Nrf2 negatively regulates autophagy and growth arrest induced by the anticancer redox agent mitoquinone. J. Biol. Chem. 2010 Nov 5;285(45):34447–34459. doi: 10.1074/jbc.M110.133579. PubMed PMID: 20805228. Pubmed Central PMCID: 2966059. [DOI] [PMC free article] [PubMed] [Google Scholar]
- 25.Jin B.R., Chung K.S., Kim H.J., An H.J. Chinese Skullcap (Scutellaria baicalensis Georgi) inhibits inflammation and proliferation on benign prostatic hyperplasia in rats. J. Ethnopharmacol. 2019 May 10;235:481–488. doi: 10.1016/j.jep.2019.01.039. PubMed PMID: 30708034. [DOI] [PubMed] [Google Scholar]
- 26.Jin B.R., An H.J. Baicalin alleviates benign prostate hyperplasia through androgen-dependent apoptosis. Aging. 2020 Feb 4;12(3):2142–2155. doi: 10.18632/aging.102731. PubMed PMID: 32018227. Pubmed Central PMCID: 7041748. [DOI] [PMC free article] [PubMed] [Google Scholar]
- 27.Dekker C., Mattes H., Wright M., Boettcher A., Hinniger A., Hughes N., et al. Crystal structure of NLRP3 NACHT domain with an inhibitor defines mechanism of inflammasome inhibition. J. Mol. Biol. 2021 Dec 3;433(24) doi: 10.1016/j.jmb.2021.167309. PubMed PMID: 34687713. Epub 2021/10/24. [DOI] [PubMed] [Google Scholar]
- 28.Eberhardt J., Santos-Martins D., Tillack A.F., Forli S. AutoDock Vina 1.2.0: new docking methods, expanded force field, and Python bindings. J. Chem. Inf. Model. 2021 Aug 23;61(8):3891–3898. doi: 10.1021/acs.jcim.1c00203. PubMed PMID: 34278794. [DOI] [PMC free article] [PubMed] [Google Scholar]
- 29.Peoples J.N., Saraf A., Ghazal N., Pham T.T., Kwong J.Q. Mitochondrial dysfunction and oxidative stress in heart disease. Exp. Mol. Med. 2019 Dec 19;51(12):1–13. doi: 10.1038/s12276-019-0355-7. PubMed PMID: 31857574. Pubmed Central PMCID: 6923355. [DOI] [PMC free article] [PubMed] [Google Scholar]
- 30.Shim D.-W., Shin W.-Y., Yu S.-H., Kim B.-H., Ye S.-K., Koppula S., et al. BOT-4-one attenuates NLRP3 inflammasome activation: NLRP3 alkylation leading to the regulation of its ATPase activity and ubiquitination. Sci. Rep. 2017;7(1):1–12. doi: 10.1038/s41598-017-15314-8. [DOI] [PMC free article] [PubMed] [Google Scholar]
- 31.Alves J.V., da Costa R.M., Pereira C.A., Fedoce A.G., Silva C.A.A., Carneiro F.S., et al. Supraphysiological levels of testosterone induce vascular dysfunction via activation of the NLRP3 inflammasome. Front. Immunol. 2020;11:1647. doi: 10.3389/fimmu.2020.01647. PubMed PMID: 32849566. Pubmed Central PMCID: 7411079. [DOI] [PMC free article] [PubMed] [Google Scholar]
- 32.Grant P., Ramasamy S. An update on plant derived anti-androgens. Int. J. Endocrinol. Metabol. 2012 doi: 10.5812/ijem.3644. Spring;10(2):497-502. PubMed PMID: 23843810. Pubmed Central PMCID: 3693613. [DOI] [PMC free article] [PubMed] [Google Scholar]
- 33.Jin B.R., Kim H.J., Na J.H., Lee W.K., An H.J. Targeting benign prostate hyperplasia treatments: AR/TGF-beta/NOX4 inhibition by apocynin suppresses inflammation and proliferation. J. Adv. Res. 2023 Apr 14 doi: 10.1016/j.jare.2023.04.006. PubMed PMID: 37061215. [DOI] [PubMed] [Google Scholar]
- 34.Jarvis T.R., Chughtai B., Kaplan S.A. Testosterone and benign prostatic hyperplasia. Asian J. Androl. 2015 Mar-Apr;17(2):212–216. doi: 10.4103/1008-682X.140966. PubMed PMID: 25337845. Pubmed Central PMCID: 4650459. [DOI] [PMC free article] [PubMed] [Google Scholar]
- 35.Siciliano T., Sommer U., Beier A.-M.K., Stope M.B., Borkowetz A., Thomas C., et al. The androgen hormone-induced increase in androgen receptor protein expression is caused by the autoinduction of the androgen receptor translational activity. Curr. Issues Mol. Biol. 2022;44(2):597–608. doi: 10.3390/cimb44020041. [DOI] [PMC free article] [PubMed] [Google Scholar]
- 36.Shigemura K., Sung S.Y., Kubo H., Arnold R.S., Fujisawa M., Gotoh A., et al. Reactive oxygen species mediate androgen receptor- and serum starvation-elicited downstream signaling of ADAM9 expression in human prostate cancer cells. Prostate. 2007 May 15;67(7):722–731. doi: 10.1002/pros.20565. PubMed PMID: 17342749. [DOI] [PubMed] [Google Scholar]
- 37.Vital P., Castro P., Ittmann M. Oxidative stress promotes benign prostatic hyperplasia. Prostate. 2016 Jan;76(1):58–67. doi: 10.1002/pros.23100. PubMed PMID: 26417670. Pubmed Central PMCID: 5469601. [DOI] [PMC free article] [PubMed] [Google Scholar]
- 38.Hamid A.R., Umbas R., Mochtar C.A. Recent role of inflammation in prostate diseases: chemoprevention development opportunity. Acta medica Indonesiana. 2011 Jan;43(1):59–65. PubMed PMID: 21339547. [PubMed] [Google Scholar]
- 39.Han C., Wang Z., Xu Y., Chen S., Han Y., Li L., et al. Roles of reactive oxygen species in biological behaviors of prostate cancer. BioMed Res. Int. 2020;2020 doi: 10.1155/2020/1269624. PubMed PMID: 33062666. Pubmed Central PMCID: 7538255 paper. [DOI] [PMC free article] [PubMed] [Google Scholar]
- 40.Liu S., Navarro G., Mauvais-Jarvis F. Androgen excess produces systemic oxidative stress and predisposes to beta-cell failure in female mice. PLoS One. 2010 Jun 24;5(6) doi: 10.1371/journal.pone.0011302. PubMed PMID: 20585581. Pubmed Central PMCID: 2892018. [DOI] [PMC free article] [PubMed] [Google Scholar]
- 41.Papachristodoulou A., Rodriguez-Calero A., Panja S., Margolskee E., Virk R.K., Milner T.A., et al. NKX3.1 localization to mitochondria suppresses prostate cancer initiation. Cancer Discov. 2021 Sep;11(9):2316–2333. doi: 10.1158/2159-8290.CD-20-1765. PubMed PMID: 33893149. Pubmed Central PMCID: 7611624. [DOI] [PMC free article] [PubMed] [Google Scholar]
- 42.Zhang H., Tang Y., Tao J. Sex-related overactivation of NLRP3 inflammasome increases lethality of the male COVID-19 patients. Front. Mol. Biosci. 2021;8 doi: 10.3389/fmolb.2021.671363. PubMed PMID: 34150848. Pubmed Central PMCID: 8212049. [DOI] [PMC free article] [PubMed] [Google Scholar]
- 43.Swanson K.V., Deng M., Ting J.P. The NLRP3 inflammasome: molecular activation and regulation to therapeutics. Nat. Rev. Immunol. 2019 Aug;19(8):477–489. doi: 10.1038/s41577-019-0165-0. PubMed PMID: 31036962. Pubmed Central PMCID: 7807242. [DOI] [PMC free article] [PubMed] [Google Scholar]
- 44.Jiang H., He H., Chen Y., Huang W., Cheng J., Ye J., et al. Identification of a selective and direct NLRP3 inhibitor to treat inflammatory disorders. J. Exp. Med. 2017 Nov 6;214(11):3219–3238. doi: 10.1084/jem.20171419. PubMed PMID: 29021150. Pubmed Central PMCID: 5679172. [DOI] [PMC free article] [PubMed] [Google Scholar]
- 45.Smith R.A., Murphy M.P. Animal and human studies with the mitochondria-targeted antioxidant MitoQ. Ann. N. Y. Acad. Sci. 2010 Jul;1201:96–103. doi: 10.1111/j.1749-6632.2010.05627.x. PubMed PMID: 20649545. [DOI] [PubMed] [Google Scholar]
- 46.Snow B.J., Rolfe F.L., Lockhart M.M., Frampton C.M., O'Sullivan J.D., Fung V., et al. A double-blind, placebo-controlled study to assess the mitochondria-targeted antioxidant MitoQ as a disease-modifying therapy in Parkinson's disease. Mov. Disord. : official journal of the Movement Disorder Society. 2010 Aug 15;25(11):1670–1674. doi: 10.1002/mds.23148. PubMed PMID: 20568096. [DOI] [PubMed] [Google Scholar]
- 47.Ahmad F., Cherukuri M.K., Choyke P.L. Metabolic reprogramming in prostate cancer. Br. J. Cancer. 2021 Oct;125(9):1185–1196. doi: 10.1038/s41416-021-01435-5. PubMed PMID: 34262149. Pubmed Central PMCID: 8548338. [DOI] [PMC free article] [PubMed] [Google Scholar]
- 48.Madersbacher S., Sampson N., Culig Z. Pathophysiology of benign prostatic hyperplasia and benign prostatic enlargement: a mini-review. Gerontology. 2019;65(5):458–464. doi: 10.1159/000496289. [DOI] [PubMed] [Google Scholar]
- 49.Fibbi B., Penna G., Morelli A., Adorini L., Maggi M. Chronic inflammation in the pathogenesis of benign prostatic hyperplasia. Int. J. Androl. 2010;33(3):475–488. doi: 10.1111/j.1365-2605.2009.00972.x. [DOI] [PubMed] [Google Scholar]
- 50.Bespalov V.G., Alexandrov V.A., Semenov A.L., Tochilnikov G.V., Ermakova E.D., Zmitrichenko Y.G., et al. Old rats are more susceptible to induction of benign prostatic hyperplasia (BPH) at comparative to young mature. Curr. Aging Sci. 2021;14(2):124–132. doi: 10.2174/1874609814666210203091803. [DOI] [PubMed] [Google Scholar]
Associated Data
This section collects any data citations, data availability statements, or supplementary materials included in this article.
Data Availability Statement
The data supporting the findings of this study are available from the corresponding author upon reasonable request.
Data will be made available on request.