

Abstract
Pulmonary arterial hypertension (PAH) is a rare vasculopathy, with high morbidity and mortality. The sensitivity of the current european society of cardiology/european respiratory society (ESC/ERS) risk assessment strategy may be improved by the addition of biomarkers related to PAH pathophysiology. Such plasma‐borne biomarkers may also reduce time to diagnosis, if used as diagnostic tools in patients with unclear dyspnea, and in guiding treatment decisions. Plasma levels of proteins related to tumor necrosis factor (TNF), inflammation, and immunomodulation were analyzed with proximity extension assays in patients with PAH (n = 48), chronic thromboembolic pulmonary hypertension (PH; CTEPH, n = 20), PH due to left heart failure (HF) with preserved (HFpEF‐PH, n = 33), or reduced (HFrEF‐PH, n = 36) ejection fraction, HF without PH (n = 15), and healthy controls (n = 20). TNF‐related apoptosis‐inducing ligand (TRAIL) were lower in PAH versus the other disease groups and controls (p < 0.0082). In receiver operating characteristics analysis, TRAIL levels identified PAH from the other disease groups with a sensitivity of 0.81 and a specificity of 0.53 [area under the curve: 0.70; (95% confidence interval, CI: 0.61–0.79; p < 0.0001)]. In both single (p < 0.05) and multivariable Cox regression models Annexin A1 (ANXA1) [hazard ratio, HR: 1.0367; (95% CI: 1.0059–1.0684; p = 0.044)] and carcinoembryonic antigen‐related cell adhesion molecule 8 [HR: 1.0603; (95% CI: 1.0004–1.1237; p = 0.0483)] were significant predictors of survival, adjusted for age, female sex and ESC/ERS‐initial risk score. Low plasma TRAIL predicted PAH among patients with dyspnea and differentiated PAH from those with CTEPH, HF with and without PH; and healthy controls. Higher plasma ANXA1 was associated with worse survival in PAH. Larger multicenter studies are encouraged to validate our findings.
Keywords: biomarkers, immunomodulation, inflammation, pulmonary hypertension, TNF‐signaling
INTRODUCTION
Pulmonary arterial hypertension (PAH) is a rare condition characterized by a progressive vasculopathy of pulmonary arteries leading to elevated pulmonary pressures, right heart failure (HF), and early death. Despite the advancement of new targeted PAH therapies and treatment strategies during the past three decades, morbidity and mortality are still affected by a diagnostic delay that has not noticeably improved since the 1980s, independent of sex, age, and PAH‐etiology. 1 , 2 The current diagnostic delay in PAH is partly related to unspecific symptoms, including dyspnea and fatigue, as well as due to the rising prevalence of elderly with multiple comorbidities. 3 The identification of new blood‐borne biomarkers with pathophysiological relevance to PAH, that could differentiate among various causes of dyspnea including pulmonary hypertension (PH), could if clinically used potentially lead to earlier diagnosis and treatment initiation and consequently improved prognosis.
In PAH, prognostic risk stratification according to the 2015 and 2022 european society of cardiology/european respiratory society (ESC/ERS) PH guidelines are imperative in guiding treatment decisions at both baseline and follow‐ups. 4 , 5 Despite becoming an essential part in guiding PAH treatment, the contemporary risk stratification models used to estimate mortality exhibit suboptimal prognostic accuracies with area under the curves (AUCs) ranging from 0.54 to 0.76. 6 , 7 , 8 Inclusion of additional parameters comprising biochemical markers, associated with the pathophysiology and prognosis of PAH, may potentially improve the prognostic accuracies of contemporary risk assessments models, allowing for optimized individual treatment strategies in relation to the patient's risk status.
Pathways of inflammation, dysregulated cellular growth, and proliferation have been postulated to be part in PAH pathology and progression. 9 For instance, tumor necrosis factor‐alpha (TNF‐α), has been found to reduce the expression of bone morphogenetic protein receptor type‐2 (BMPR2) in vascular cells and promote BMPR2 cleavage in pulmonary arterial smooth muscle cells. 10 In addition, TNF‐related apoptosis‐inducing ligand (TRAIL) was required for the development of PAH in three independent animal models, where inhibition of TRAIL reduced pulmonary vascular remodeling through reduced cellular proliferation and increased apoptosis. 11 Related to TRAIL, osteoprotegerin has been proposed as a key driver of pulmonary vascular remodeling via interaction with the FAS‐ligand receptor (a death receptor), potentially advocating a possible therapeutic target in PAH. 12
The present study therefore aimed to: (i) investigate whether proteins associated with inflammation, including TNF and immunomodulation could identify PAH among patients with other causes of dyspnea, including other PH subgroups and (ii) if such proteins exhibit a prognostic value in PAH in relation to ESC/ERS risk assessment models.
METHODS
Study population
The study population comprised adults (≥18 years) including 152 patients evaluated for unclear dyspnea between September 2011 and March 2017 at the Hemodynamic lab at Skåne University Hospital in Lund; as well as 20 healthy controls, devoid of cardiovascular comorbidities, all of which were enrolled in the Lund Cardio Pulmonary Registry (LCPR). Patients were divided as follows: PAH (n = 48), chronic thromboembolic pulmonary hypertension (CTEPH, n = 20), PH due to HF with preserved (HFpEF‐PH, n = 33) or reduced (HFrEF‐PH, n = 36) ejection fraction (EF), as well as HF without PH (HF‐non‐PH, n = 15; HFrEF, n = 8, and HFpEF, n = 7).
According to the prevailing ESC/ERS guidelines at the time of evaluation, patients exhibiting a resting mean pulmonary arterial pressure (MPAP) ≥ 25 mmHg with right heart catheterization (RHC) were defined as having PH and were further categorized using pulmonary arterial wedge pressure (PAWP) into precapillary (PAWP ≤ 15 mmHg) and postcapillary (PAWP > 15 mmHg) PH. PH due to left HF were furthermore classified into isolated postcapillary PH or combined post‐ and precapillary PH according the prevailing hemodynamic definitions. 13 , 14 Echocardiography and/or magnetic resonance imaging were used to identify systolic and diastolic left ventricular dysfunction, to classify HF, and to exclude intracardiac shunts. HFrEF and HFpEF were defined as EF < 50% and EF ≥ 50%, respectively. 15
PAH and CTEPH were identified using the diagnostic work‐up recommended, by at the time of evaluation, prevailing ESC/ERS guidelines, including pulmonary scintigraphy. 4 World Health Organization (WHO) group III PH, associated with hypoxia/and or lung disease, had clinically been excluded using high‐resolution computer tomography (HRCT) in addition to spirometry with diffusion capacity. 4 For subgroup analyses, PAH due to connective tissue disease (CTD‐PAH, n = 25) were considered as one entity, whereas idiopathic PAH and familial PAH (IPAH/FPAH, n = 23) were regarded as another.
RHC and plasma sampling
All patients underwent RHC by experienced cardiologists as part of the clinical evaluation for diagnosis, using Swan–Ganz catheters (Baxter Healthcare Corp.), predominantly inserted via the right internal jugular vein with the tip protruding into the internal jugular vein alternatively the superior vena cava. At the time of RHC, plasma samples from patients were collected from the venous introducer. Venous blood samples were also collected from the healthy controls. These were drawn peripherally from the forearm, mostly Vena mediana cubiti. After collection, the blood‐samples were centrifuged, and extracted plasma were stored in –80°C in the LCPR cohort of the Region Skåne's biobank, according to the regional biobank practice. Median storage time was 3.7 years, ranging between 1.2 and 5.7 years. Plasma samples were collected prospectively, whereas analyses were made retrospectively on collected samples.
Mean arterial pressure (MAP), MPAP, and PAWP were recorded during RHC. Cardiac output (CO, thermodilution) and mixed venous blood oxygen saturation (SvO2) were measured during RHC. Heart rate was measured by electrocardiogram. Six‐min walking distance (6MWD) values at the time of RHC were retrieved from medical records. The following formulae were used to calculate other hemodynamic parameters: Body surface area (BSA) = (weight0.425 × height0.725 × 0.007184); cardiac index (CI) = CO∕BSA; stroke volume (SV) = (CO × 1000) ∕ HR; SV index (SVI) = SV ∕ BSA; left ventricular stroke work index (LVSWI) = (MAP − PAWP) × SVI; right ventricular stroke work index (RVSWI) = (MPAP − mean right atrial pressure [MRAP]) × SVI; transpulmonary pressure gradient (TPG) = MPAP − PAWP; and pulmonary vascular resistance (PVR) = TPG ∕ CO.
Protein selection and analysis
Plasma protein levels were analyzed using the Proseek Multiplex Cardiovascular II, Cardiovascular III, and Oncology II, 96‐plex immunoassay panels (Olink Proteomics) and were reported in arbitrary units (AUs). The analysis utilizes proximity extension assays read out by quantitative polymerase chain reaction (qPCR). In brief, pairs of antibodies with complementary oligonucleotide strands bind the target protein, and when in proximity the strands hybridize creating a DNA chain serving as an id‐tag which is elongated with DNA polymerase and read out by qPCR. A comprehensive description is found elsewhere. 16 From the three Olink panels, 25 proteins related to TNF and immunomodulation were selected for analysis. Moreover, 28 other inflammatory proteins, that previously had been found altered in plasma of patients with PAH compared to controls, 17 were additionally analyzed.
TNF and immunomodulatory
We measured caspase‐3 (CASP‐3), CD27 antigen (CD27), CD40 ligand (CD40‐L), FAS‐associated death domain protein (FADD), tartrate‐resistant acid phosphatase type 5 (TR‐AP), transmembrane glycoprotein neuromedin‐B, tumor necrosis factor receptor superfamily member 6 (FAS), osteoclast‐associated immunoglobulin‐like receptor (hOSCAR), osteoprotegerin, tumor necrosis factor ligand superfamily member 6 (FASLG), lymphotoxin‐beta receptor (LTBR), TNF receptor 1 (TNF‐R1), TNF receptor 2 (TNF‐R2), TNF receptor superfamily member 10A (TNFRSF10A), TNFRSF10C, TNFRSF11A, TNFRSF13B, TNFRSF14, TNFRSF19, TNFRSF4, TNFRSF6B, TNF ligand superfamily member 13 (TNFSF13), TNFSF13B, TRAIL, TRAIL receptor 2 (TRAIL‐R2).
Inflammatory
We measured Annexin A1 (ANXA1), azurocidin, C–C motif chemokine 3 (CCL3), CCL15, CD4, CD70, carcinoembryonic antigen‐related cell adhesion molecule 8 (CEACAM8), chitotriosidase‐1 (CHIT1), chitinase‐3‐like protein 1 (CHI3L1), C–X–C motif chemokine 1 (CXCL13), CXCL17, E‐selectin (SELE), Fc receptor‐like B (FcRLB), growth/differentiation factor 15 (GDF‐15), interluekin (IL)‐1 receptor antagonist protein (IL‐1RN) (IL.1ra), IL‐1 receptor type 2 (IL‐1RT2), IL‐4 receptor subunit alpha (IL‐4R‐alpha), IL‐6, pro‐IL‐16, IL‐17D, IL‐27, kidney injury molecule 1 (KIM‐1), monocyte chemotactic protein 1 (MCP‐1), peptidoglycan recognition protein 1 (Pglyrp1), polymeric immunoglobulin receptor (PIgR), pulmonary surfactant‐associated protein D (PSP‐D), pentraxin‐related protein PTX3 (PTX3), and signaling lymphocytic activation molecule family member 7.
Study setup and statistical analyses
The study was conducted in two major steps: (i) with an initial diagnostic arm including TNF‐related proteins and (ii) a second prognostic arm including TNF‐related and inflammatory proteins with altered levels in PAH compared to controls. An overview of the study setup can be found in Figure 1.
Figure 1.

Study setup. A diagnostic (1) arm was followed by a prognostic (2) arm. ANXA1, Annexin A1; C, control; CTEPH, chronic thromboembolic pulmonary hypertension; HFpEF‐PH, pulmonary hypertension due to heart failure with preserved ejection fraction; HFrEF‐PH, pulmonary hypertension due to heart failure with reduced ejection fraction; HF‐non‐PH, heart failure without pulmonary hypertension; PAH, pulmonary arterial hypertension; ROC, receiver operating characteristics; TNF, tumor necrosis factor; TRAIL, TNF‐related apoptosis‐inducing ligand; 3‐year‐survivors: patients surviving 3 years from diagnosis.
Statistical analyses were performed with GraphPad Prism GraphPad Prism version 9.3.1. and R version 4.0.5. a language and environment for statistical computing (R Foundation for Statistical Computing). Normality was assessed with histograms. Due to nonnormally distributed data, proteins' levels were analyzed with Kruskal–Wallis tests followed by a Benjamini and Hochberg false discovery rate (FDR) (Q: 5%) to limit false positives. Proteins with Kruskal–Wallis p values below FDR threshold were analyzed with multiple comparisons for PAH versus controls, CTEPH, HFrEF‐PH, HFpEF‐PH, and HF‐non‐PH, followed by a second FDR analysis yielding a new threshold for multiple comparisons p values. For uncorrected p values, <0.05 was considered statistically significant. Receiver operating characteristic (ROC) curves were used to evaluate proteins' ability to discriminate PAH from other dyspnea groups, and to determine protein level‐specific cut‐offs between survivors and nonsurvivors for Kaplan–Meier analyses. Youden's index was used to determine ideal cut‐off values for optimal specificity and sensitivity. Patients were stratified based on survival ≤ 3 or >3 years and Mann–Whitney's test used to assess difference in protein levels between 3‐year survivors and nonsurvivors. Proteins displaying a difference between survivors and nonsurvivors were analyzed using Kaplan–Meier curves and log‐rank tests. Death or lung transplantation were considered events and data were censored at the last day of follow‐up on the of April 25, 2022.
The effect estimates of potential prognostic proteins were in Kaplan–Meier analyses, as well as variables including age, sex, and ESC/ERS risk scores were assessed with Cox proportional‐hazards analyses. Significant proteins in the univariable models were included in multivariable Cox‐regression models to adjust for age, sex, and risk scores.
Risk scores
Risk scores were calculated using the ESC/ERS risk table and the swedish PAH registry (SPAHR) strategy assigning each parameter a value of 1 for “low‐risk,” 2 for “intermediate‐risk,” or 3 for “high risk,” adding them together and dividing with the number of included parameters. Values were then rounded to the nearest integer according to Kylhammar et al. 18 Parameters included were WHO functional class (WHO‐FC), 6MWD, NT‐proBNP, MRAP, confidence interval (CI), SvO2. For Cox‐regression analyses, exact risk‐scores were used.
RESULTS
Population characteristics
Population characteristics are reported in Table 1. The study population has previously been described in related manuscripts. 17 , 19 The control population tended to be younger 41 (26.8–50.5) years. The median survival of the PAH patients was 3.3 (1.5–5.6) years. At diagnosis, 8 (16.7%) PAH patients were in the low; 26 (54.2%) intermediate; and 14 (29.2%) in the high‐risk group, respectively. Thirty‐two (80%) of the PAH patients were in WHO‐FC III and IV at diagnosis (Table 1).
Table 1.
Population characteristics.
| Control | PAH (n = 48) | CTEPH (n = 20) | HFpEF‐PH (n = 33) | HFrEF‐PH (n = 36) | HF‐NON‐PH (n = 15) | |
|---|---|---|---|---|---|---|
| Females, n (%) | 10 (50.0) | 40 (83.3) | 13 (65.0) | 21 (63.6) | 7 (19.4) | 8 (53.3) |
| Age (years) | 41 (26.8–50.5) | 71.5 (64–76) | 75 (70.8–77.8) | 75 (68.5–83) | 54 (47.3–59.5) | 60 (46–76) |
| BSA (m2) | 1.9 (1.8–2) | 1.7 (1.6–2) | 1.8 (1.8–2) | 1.9 (1.7–2.1) | 2 (1.9–2.1) | 2 (1.7–2.1) |
| Creatinine (µmol/L) | ‐ | 90 (70.8–113.5) | 88 (73–122.5) | 99 (79–117) | 121 (90–145) | 93 (80.5–123) |
| NT‐proBNP (AU) | ‐ | 3.1 (2.1–3.8) | 2.6 (1.0–4.2) | 2.9 (2.4–3.3) | 4.9 (4.1–5.4) | 3.2 (1.3–4.4) |
| 6MWD (m) | ‐ | 242 (172.5–349) | 300 (237.5–325)(n − 3) | ‐ | ‐ | ‐ |
| WHO‐FC (I/II/III/IV/NA), n | ‐ | 1/9/28/4/8 | 0/6/13/0/1 | ‐ | ‐ | ‐ |
| PAH risk scores, low/intermediate/high, n | ‐ | 8/26/14 | ‐ | ‐ | ‐ | ‐ |
| Hemodynamics | ||||||
| CI (L/min/m2) | ‐ | 2.2 (1.8–2.8) | 2.3 (1.9–2.5) | 2.4 (2.1–2.8) | 1.6 (1.4–1.9) | 1.9 (1.6–2.2) |
| CO (L/min) | ‐ | 3.8 (3.0–5.1) | 4 (3.5–4.7) | 4.5 (3.7–5.7) | 3.2 (2.8–4.0) | 3.3 (3.0–4.4) |
| HR (beats/min) | ‐ | 77.5 (70–94.3) | 75 (69.5–88) | 70 (61.5–82.5) | 71 (68.3–86) | 72 (60–84) |
| LWSWI (mmHg × mL/m2) | ‐ | 2488 (2045–3213) | 2508 (2330–3187) | 2664 (2189–3308) | 1152 (957–163−6(n − 1) a | 2168 (1650–2716) |
| MAP (mmHg) | ‐ | 96 (89.4–104) | 98.5 (94–110.3) | 98 (91.5–104.5) | 79.5 (75.3–88.8) | 89 (80–96) |
| MPAP (mmHg) | ‐ | 43 (37–54.8) | 42 (35–54.3) | 34 (28.5–46) | 34.5 (29–40.8) | 20 (17–22) |
| MRAP (mmHg) | ‐ | 7 (4–11) | 5.5 (3.3–8) | 10 (6.5–14) | 14.5 (9–17) | 6 (2–16) |
| PAWP (mmHg) | ‐ | 8 (6–11) | 9.5 (7–13) | 18 (16–22.5) | 25 (19–28( n − 1) a | 15 (9–18) |
| PVR (WU) | ‐ | 9.5 (6.2–11.8) | 9.3 (5.9–10.8) | 3.6 (2.4–4.9) | 3.0 (2.3–3.7( n − 1) a | 1.5 (1.0–2.0) |
| RVSWI (mmHg × mL/m2) | ‐ | 990.5 (807.2–1246) | 1111 (844.5–1298) | 831.5 (670.7–1140) | 439.6 (305.8–649.3) | 382.4 (195.5–494.5) |
| SV (mL/beat) | ‐ | 51.2 (40.8–56.3) | 56.3 (45.8–65.1) | 61.7 (48.8–83.7) | 45.1 (36.0–54.5) | 54.8 (44.8–58.8) |
| SVI (mL/beat/m2) | ‐ | 28.7 (35–22.6) | 30.5 (32.5–26.3) | 33.8 (42.3–28.1) | 22.5 (27.2–18.2) | 29 (31.9–25.2) |
| SvO2 (%) | ‐ | 59.3 (51.1–66.2) | 62.5 (54.9–67.9) | 64.1 (57.8–66.8) | 50.3 (46.5–55.2) | 61.2 (58.5–69.2) |
| PAH subgroup, n (%) | ||||||
| IPAH | ‐ | 21 (43.8) | ‐ | ‐ | ‐ | ‐ |
| FPAH | ‐ | 2 (4.2) | ‐ | ‐ | ‐ | ‐ |
| SSc‐PAH | ‐ | 21 (43.8) | ‐ | ‐ | ‐ | ‐ |
| CTD‐PAH | ‐ | 4 (8.3) | ‐ | ‐ | ‐ | ‐ |
| Comorbidities, n (%) | ||||||
| Atrial fibrillation | ‐ | 4 (8.3) | 3 (15.0) | 25 (78.1( n − 1) | 14 (38.9) | 8 (61.5( n − 2) |
| Diabetes mellitus | ‐ | 12 (25.0) | 0 (0) | 11 (36.7( n − 3) | 4 (11.1) | 3 (21.4)(n − 1) |
| Ischemic heart disease | ‐ | 7 (14.6) | 2 (5.0) | 6 (23.1)(n − 7) | 6 (16.7) | 6 (42.9)(n − 1) |
| Hypertension | ‐ | 17 (35.4) | 11 (55.0) | 22 (75.9)(n − 4) | 7 (19.4) | 7 (53.8)(n − 2) |
| Stroke | ‐ | 2 (4.2) | 3 (5.0) | 6 (22.2)(n − 6) | 4 (11.1) | 2 (15.4)(n − 2) |
| Thyroid disease | ‐ | 11 (22.9) | 1 (5.0) | 2 (7.7)(n − 7) | 3 (8.3) | 3 (21.4)(n − 1) |
| Medications, n (%) | ||||||
| ACEi | ‐ | 10 (21.3(n − 1) | 2 (11.1)(n − 2) | 12 (36.4) | 19 (52.8) | 3 (20) |
| ARB | ‐ | 4 (8.5)(n − 1) | 7 (38.9)(n − 2) | 10 (30.3) | 14 (38.9) | 5 (33.3) |
| Beta blockers | ‐ | 16 (34)(n − 1) | 9 (50)(n − 2) | 25 (75.8) | 35 (97.2) | 11 (73.3) |
| Immunosuppressants | ‐ | 5 (10.6)(n − 1) | 1 (5.6)(n − 2) | 0 (0) | 1 (2.8) | 3 (20) |
| MRA | ‐ | 11 (23.4)(n − 1) | 3 (16.7)(n − 2) | 9 (27.3) | 21 (58.3) | 7 (46.7) |
Note: Categorical variables are presented as numbers and percentage, n (%). Continuous variables are presented as median (25–75 percentile). Superscript (n − x) indicates number of missing values.
Abbreviations: ‐, data not available; 6MWD, 6‐min walk distance; ACEi, angiotensin converting enzyme inhibitor; ARB, angiotensin receptor blocker; AU, arbitrary units; BSA, body surface area; CI, cardiac index; CO, cardiac output; CTD‐PAH, connective tissue disease associated PAH; CTEPH, chronic thromboembolic pulmonary hypertension; FPAH, familial PAH; HF‐non‐PH, heart failure (HF) without PH; HFpEF‐PH, PH due to HF with preserved ejection fraction (EF); HFrEF‐PH, PH due to HF with reduced EF; HR, heart rate; IPAH, idiopathic PAH; LVSWI, left ventricular stroke work index; MAP, mean arterial pressure; MPAP, mean pulmonary artery pressure; MRA, mineral corticoid receptor antagonist; MRAP, mean right atrial pressure; NT‐proBNP, N‐terminal pro b‐type natriuretic peptide; PAH, pulmonary arterial hypertension; PAWP, pulmonary artery wedge pressure; PVR, pulmonary vascular resistance; RVSWI, right ventricular stroke work index; SSc‐PAH, systemic sclerosis associated PAH; SV, stroke volume; SVI, stroke volume index; SvO2, mixed venous oxygen saturation; WHO‐FC, the World Health Organization functional class.
One patient being unable to go through complete testing.
PAH versus the other groups
Kruskal–Wallis tests and post‐hoc multiple comparisons
Twenty‐four of 25 proteins yielded a significant Kruskal–Wallis test (p < 0.045). CASP‐3 was not significant (p = 0.08) and was excluded from analysis with multiple comparisons (Table 2).
Table 2.
Proteins' levels and multiple comparison analysis.
| Proteins (AU) | Control (n = 20) | PAH (n = 48) | CTEPH (n = 20) | HFpEF‐PH (n = 33) | HFrEF‐PH (n = 36) | HF‐no‐PH (n = 15) |
|---|---|---|---|---|---|---|
| Caspase‐3 | 463.2 (269–768.2)a | 256.8 (153.6–651.5) | 275.1 (183.8–512.2)ns | 313.9 (194.8–586.3)ns | 242.8 (128–458.9)a | 360 (223.6–685.2)ns |
| CD27 | 145.7 (132.1–168.2)(n − 1)ns | 216.7 (175–281.5) | 184 (164.1–234.7)ns | 259.4 (204.9–320.8)ns | 175.4 (137–231.8(n − 1) ns | 214.1 (140.3–277.4)ns |
| CD40‐L | 86.4 (55.8–229.6)ns | 63.2 (35–122.9) | 77.1 (37.2–120.1)ns | 89.2 (44.8–149.6)ns | 53 (23–103.5)ns | 78.1 (47.8–195.2)ns |
| FADD | 3.5 (1.6–5.6)(n − 1)ns | 2.2 (1.6–3.5) | 1.7 (1.4–2.4)ns | 2 (1.5–3.3)ns | 1.5 (1.1–2.5)(n − 1) a | 2.3 (1.5–3.4)ns |
| FAS | 18.4 (16.8–21.1)ns | 20.4 (17.2–27.6) | 23.1 (17.3–26.4)ns | 25.1 (20.2–31.4)a | 22.7 (17.4–30.5)ns | 22.7 (20–‐26.4)ns |
| FASLG | 439 (356.7–515.2)(n − 1)ns | 294.4 (239.3–397.9) | 346.2 (260.2–421.3)ns | 365.4 (263.9–461.1)ns | 337.7 (273.8–458.7)(n − 1)ns | 316.8 (276.2–399.8)ns |
| GPNMB | 52.4 (48.8–55.6)(n − 1) a | 56.6 (52.7–62.4) | 58.9 (55–62.8)ns | 60.5 (57.6–69.8)a | 61.5 (56.3–70(n − 1) a | 62.8 (53.2–71.2)ns |
| hOSCAR | 757 (702–814)ns | 838 (708–935) | 903 (749–989)ns | 926 (814–1029)a | 860 (756–971)ns | 821 (762–950)ns |
| LTBR | 6.5 (6.2–7)ns | 7.5 (6.2–10) | 8.7 (7.7–10.9)ns | 11.6 (8.5–13.4)a | 10.3 (7.2–13.4)a | 8.9 (7.1–10.4)ns |
| TNFRSF10A | 6.4 (5.6–7.7)a | 10.6 (7.7–12.4) | 10.9 (9.4–11.8)ns | 13.4 (10–14.6)a | 11.8 (9.1–13.7)ns | 10.9 (8.8–13.9)ns |
| TNFRSF11A | 24.7 (20.6–27.1)a | 40.7 (30.1–61.5) | 43 (36.6–58.9)ns | 58.5 (46.9–80.1)a | 53.8 (34.6–68)ns | 46.4 (42.5–58.5)ns |
| TNFRSF13B | 186.6 (151.6–201.1)a | 255.5 (206–331.6) | 263.8 (237–284.9)ns | 293.6 (235.5–369.6)ns | 288.5 (244.5–354.2)ns | 270.7 (193.8–346)ns |
| Osteoprotegerin | 6.2 (5–6.8)a | 7.6 (5.6–9.1) | 7.5 (6.2–9.1)ns | 8.4 (6.8–10.2)ns | 7.3 (6.1–9.9)ns | 7.1 (5.9–8.3)ns |
| TRAIL‐R2 | 22.3 (18.9–25.1)a | 48.6 (37.3–65.4) | 53.2 (40.8–67.3)ns | 62.3 (49.3–76.2)ns | 59.7 (43.9–75.3)ns | 42.6 (35.1–57.5)ns |
| TNF‐R1 | 19.1 (17.8–21.6)a | 29.2 (21.3–38.4) | 28.6 (25.8–37.4)ns | 41.3 (29.8–54.6)a | 36.6 (25.1–48.4)ns | 32.5 (25.3–36.7)ns |
| TNF‐R2 | 15.9 (15.2–17.8)a | 23.9 (16.3–30.9) | 20.8 (17.5–25.1)ns | 27.8 (21–43.5)a | 24.8 (17.1–35.5)ns | 21.7 (19.2–31.3)ns |
| TNFRSF10C | 44 (34.5–51.2)ns | 47.5 (31.7–65.3) | 55.5 (41.9–64.4)ns | 54.3 (40.3–74.8)ns | 47.8 (32.4–55.4)ns | 35.5 (27.1–49.5)ns |
| TNFRSF14 | 18.3 (16.2–21.5)a | 22.4 (16–29.9) | 22.4 (18.3–26.3)ns | 28.8 (23–37.2)a | 22.6 (19.3–30.6)ns | 23.3 (21.3–27.2)ns |
| TNFRSF19 | 10.7 (9.4–12.6) (n − 1) a | 16.1 (12.8–23.3) | 17.9 (14.8–24)ns | 21 (17.9–35)a | 22.7 (16.4–32.9)(n − 1) a | 17.1 (13.6–18.3)ns |
| TNFRSF4 | 6.5 (5.8–7.8)(n − 1) a | 13.8 (7.7–18.5) | 8.4 (7.5–10.9)ns | 11 (8.6–16.5)ns | 10.4 (8.5–17.3)(n − 1)ns | 8.3 (7.2–13.4)ns |
| TNFRSF6B | 11.2 (7.5–14.6)(n − 1) a | 28.3 (19.4–38) | 20.5 (12–29)ns | 25.6 (17.6–41)ns | 19.6 (14.3–34.4)(n − 1) ns | 17.5 (13.3–30.1)ns |
| TNFSF13 | 173 (154.4–216)(n − 1) a | 307.6 (270.1–384) | 372.4 (307.2–422.2)ns | 442.7 (290.8–485.2)a | 344 (257.2–445.5)(n − 1) ns | 328.8 (220.1–406.3)ns |
| TNFSF13B | 48.5 (42.4–50.1)a | 70.1 (50.4–97.3) | 55.9 (43.6–74.7)ns | 59.8 (48–102.6)ns | 61.7 (53.8–85.5)ns | 57.6 (45.5–75.3)ns |
| TRAIL | 146.1 (118.5–163.7)(n − 1) a | 112.5 (97.1–135.3) | 147.9 (117.5–176.5)a | 139.2 (118.5–159.1)a | 135.4 (116.5–171.1)(n − 1) a | 151.4 (119.3–176.7)a |
| TR‐AP | 25.3 (19.8–32.8)ns | 20.9 (14.5–28.1) | 23.4 (19.8–30.1)n s | 22.1 (18–29.6)ns | 17 (13.8–23.8)ns | 20 (15.9–31.6)ns |
Note: Proteins' levels are presented in AU, p values below threshold 0.0152 considered significant.
Abbreviations: AU, arbitrary units; CD27, cluster of differentiation; CD40‐L, CD40 ligand; FADD, FAS‐associated death domain protein; FAS, tumor necrosis factor receptor superfamily member 6; FASLG, tumor necrosis factor ligand superfamily member 6; GPNMB, transmembrane glycoprotein neuromedin‐B; hOSCAR, osteoclast‐associated immunoglobulin‐like receptor; LTBR, lymphotoxin‐beta receptor; ns, nonsignificant; TNF‐R, tumor necrosis factor receptor; TNFRSF, tumor necrosis factor receptor superfamily member; TNFSF, tumor necrosis factor ligand superfamily member; TRAIL, TNF‐related apoptosis‐inducing ligand; TRAIL‐R2, TRAIL‐receptor 2; TR‐AP, tartrate‐resistant acid phosphatase type 5.
Significant difference compared to PAH.
After post‐hoc multiple comparison test, 16 proteins exhibited significantly different plasma levels in PAH compared to controls. TRAIL was the only protein with different plasma levels in PAH compared to controls (p = 0.0061) and all other included disease groups with dyspnea (p < 0.0082) (Table 2, Figure 2).
Figure 2.

TRAIL is lower compared to all other groups. p values are shown for each comparison. AU, arbitrary units; CTEPH, chronic thromboembolic pulmonary hypertension; HFpEF‐PH, pulmonary hypertension due to heart failure with preserved ejection fraction; HFrEF‐PH, pulmonary hypertension due to heart‐failure with reduced ejection fraction; HF‐no‐PH, heart failure without pulmonary hypertension; TRAIL, TNF‐related apoptosis‐inducing ligand.
ROC analyses
A ROC curve of plasma TRAIL levels identifying PAH versus a composite dyspnea group comprising CTEPH, HFrEF‐PH, HFpEF‐PH, and HF‐non‐PH resulted in an AUC of 0.70 (95% CI: 0.61–0.79; p < 0.0001), with a sensitivity of 0.81 (95% CI: 0.68–0.90), a specificity of 0.53 (95% CI: 0.44–0.63), using a protein threshold of >138 AU (Figure 3).
Figure 3.
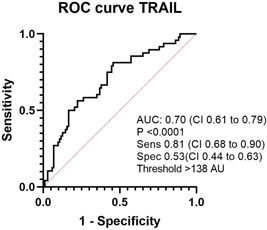
ROC curve of TRAIL as a discriminator of PAH in a dyspnea population. ROC, receiver operating characteristic; TRAIL, TNF‐related apoptosis‐inducing ligand.
Proteins' levels in survivors versus nonsurvivors
Patients were stratified in survivors and non‐survivors at the 3 years follow‐up. Protein levels differed between patients surviving ≤3 years compared to >3 years after PAH diagnosis for ANXA1 (p = 0.013), CEACAM8 (p = 0.023), CXCL17 (p = 0.0074), GDF‐15 (p = 0.011), IL‐6 (p = 0.039), PSP‐D (p = 0.027), and TRAIL‐R2 (p = 0.030) (Table 3). Next, these proteins were further analyzed with Kaplan–Meier curves and log‐rank tests. All seven proteins displayed significant difference in survival in a low versus high protein level group (Figure 4).
Table 3.
Mann–Whitney 3‐year survivors versus no survivors.
| Proteins (AU) | Survival ≤ 3 years | Survival < 3 years | p Value |
|---|---|---|---|
| ANXA1 | 3.3 (2.6–3.8) | 4.3 (3–5) | 0.0132* |
| Azurocidin | 3.3 (2.4–4.7) | 4.5 (3.2–5.8) | 0.0772 |
| CASP‐3 | 230.8 (152.4–581.4) | 310 (148.1–784.6) | 0.4332 |
| CCL15 | 91.9 (81.5–113.8) | 108.1 (91.4–157.7) | 0.1301 |
| CCL3 | 6.3 (5.3–7.9) | 5.2 (4.6–8.2) | 0.7575 |
| CD4 | 19.1 (14.5–24.4) | 18.8 (16.5–26.2) | 0.4579 |
| CD70 | 11.4 (9.2–17.2) | 12.4 (10.1–15.2) | 0.6804 |
| CEACAM8 | 11.9 (9.8–20.4) | 19.6 (15.3–25.8) | 0.0225* |
| CHI3L1 | 42.9 (36.8–59) | 56.6 (44.1–75.8) | 0.0581 |
| CHIT1 | 4.2 (2.3–6.6) | 6 (3.9–6.9) | 0.207 |
| CXCL13 | 598.7 (421.6–1145) | 449.6 (347.7–816.6) | 0.1853 |
| CXCL17 | 36.8 (32–42.6) | 45.9 (38.9–57.1) | 0.0074* |
| FCRLB | 2.9 (2–3.7) | 3.6 (2.9–4.8) | 0.0581 |
| GDF‐15 | 29.9 (20.1–43.5) | 46.9 (31.3–58.4) | 0.011* |
| GPNMB | 56.6 (52.8–61.9) | 56.6 (52.3–64) | 0.9017 |
| IL‐17D | 5.7 (5–6.7) | 6.4 (5.4–7.2) | 0.3424 |
| IL‐1ra | 17.8 (14.7–31.8) | 20.4 (14.6–31.7) | 0.4212 |
| IL‐1RT2 | 17.9 (15.2–22.1) | 17.8 (13.6–20.3) | 0.6956 |
| IL‐4RA | 6.6 (5.3–11.8) | 8 (6.1–10.3) | 0.5501 |
| IL‐6 | 7.1 (5.3–14) | 13.4 (7.8–31.4) | 0.0388* |
| IL16 | 34.5 (25.1–54.4) | 38 (31.6–54.6) | 0.4455 |
| IL27 | 18.7 (15.3–22.4) | 21.6 (17.4–25.5) | 0.0808 |
| KIM‐1 | 549.9 (312.7–770.5) | 489.7 (269.8–830.5) | 0.8692 |
| MCP‐1 | 6.2 (5.3–7.6) | 7.1 (5.4–7.9) | 0.3116 |
| Osteoprotegerin | 7 (5.3–9.2) | 8 (6.8–9) | 0.5229 |
| PGLYRP1 | 110.4 (75.4–146.7) | 117.5 (96.7–153.1) | 0.3217 |
| PIgR | 55.3 (50.1–58.4) | 54 (51.1–59.4) | 0.8854 |
| PSP‐D | 6.3 (3.3–9.3) | 9.9 (6–14.9) | 0.0266* |
| PTX3‐log | 9.2 (7.7–11.6) | 10 (8.8–12.5) | 0.1529 |
| SELE | 4.5 (2.8–5.6) | 4.6 (3.6–5.7) | 0.5229 |
| SLAMF7 | 3.9 (2.4–5.1) | 4.6 (3.8–5.7) | 0.0872 |
| TNF‐R1 | 25 (19.2–33.1) | 33.9 (22.8–40.3) | 0.064 |
| TNF‐R2 | 18.9 (14.4–31.5) | 26 (18.9–30.6) | 0.2146 |
| TNFRSF10A (TRAIL‐R1) | 9.6 (7.1–12.6) | 10.7 (9.3–12.3) | 0.3319 |
| TNFRSF11A | 40.1 (30.1–60.1) | 43.4 (31.2–61.9) | 0.4706 |
| TNFRSF13B | 255 (200.7–326.5) | 256 (213.5–346) | 0.578 |
| TNFRSF14 | 21.4 (14.3–29.3) | 23.7 (17.4–30.6) | 0.5501 |
| TNFRSF19 | 14 (11.8–23.4) | 18.4 (14.1–24.3) | 0.1923 |
| TNFRSF4 | 11.5 (7.4–16.9) | 14.7 (8.4–19.1) | 0.2735 |
| TNFRSF6B | 26.4 (15.3–36.3) | 32.5 (21.4–45.4) | 0.159 |
| TNFSF13 | 306.5 (243.7–369.8) | 325.8 (277.7–394.5) | 0.2224 |
| TNFSF13B | 68.6 (50.1–78.1) | 71.5 (51–101.2) | 0.3116 |
| TRAIL‐R2 | 46.3 (35.2–59.5) | 60 (44.1–97.3) | 0.0297* |
| TRAIL | 113.9 (100.1–132.7) | 109.6 (95.7–136.4) | 0.6505 |
Note: Table of protein levels in patients surviving ≤3 years or >3 years compared with Mann–Whitney's tests. Protein levels presented in AU, median (25–75 quartiles). p < 0.05 considered significant are marked with *; bold.
Abbreviations: ANXA1, annexin A1; AU, arbitrary units; CASP‐3, caspase‐3; CCL, C–C motif chemokine; CD, cluster of differentiation; CEACAM8, carcinoembryonic antigen‐related cell adhesion molecule 8; CHIT1, chitotriosidase‐1; CHI3L1, chitinase‐3‐like protein 1; CXCL, C–X–C motif chemokine; FcRLB, Fc receptor‐like B; GDF‐15, growth/differentiation factor 15; GPNMB, transmembrane glycoprotein neuromedin‐B; IL, interleukin; IL.1ra, IL‐1 receptor antagonist protein; IL‐1RT2, IL‐1 receptor type 2; IL‐4R‐alpha, IL‐4 receptor subunit alpha; KIM‐1, kidney injury molecule 1; MCP‐1, monocyte chemotactic protein 1; Pglyrp1, peptidoglycan recognition protein 1; PIgR, polymeric immunoglobulin receptor; PSP‐D, pulmonary surfactant‐associated protein D; PTX3, pentraxin‐related protein; SELE, E‐selectin; SLAMF7, signaling lymphocytic activation molecule family member 7; TNF‐R, TNF receptor; TNFRSF, TNF receptor superfamily member; TNFSF, TNF ligand superfamily member; TRAIL, tumor necrosis factor‐related apoptosis‐inducing ligand; TRAIL‐R2, TRAIL receptor 2.
Figure 4.
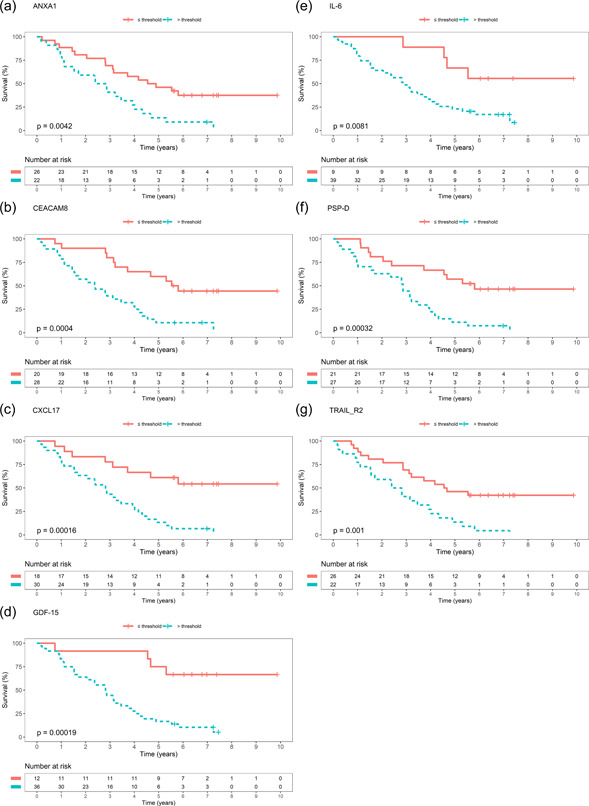
Kaplan–Meier curves. Kaplan–Meier curves of survival with protein's level's below or equal respective above threshold for survival in a ROC analysis. (a) ANXA1, (b) CEACAM8, (c) CXCL17, (d) GDF‐15, (e) IL‐6, (f) PSP‐D, (g) TRAIL‐R2. Abbreviations as in Table 3.
Cox regression analyses
GDF‐15 was not significant in the univariable cox regression model and was excluded from further analysis (Table 4). Age, female sex, and risk score were significant predictors of death or lung transplantation in the univariable cox regression model and were thus included as covariables in the multivariable models (Table 4).
Table 4.
Univariable cox regression.
| HR (95% CI) | p Value | |
|---|---|---|
| Age | 1.0367 (1.0059–1.0684) | 0.0193 |
| Female | 0.3756 (0.1615–0.8738) | 0.023 |
| Risk score | 1.9593 (1.0121–3.793) | 0.046 |
| ANXA1 | 1.4195 (1.124–1.7927) | 0.0033 |
| CEACAM8 | 1.084 (1.0359–1.1343) | 0.0005 |
| CXCL17 | 1.0291 (1.0119–1.0466) | 0.0009 |
| GDF‐15 | 1.0024 (0.9981–1.0066) | 0.2752 |
| IL‐6 | 1.0169 (1.0014–1.0327) | 0.0328 |
| PSP‐D | 1.0692 (1.0165–1.1246) | 0.0094 |
| TRAIL‐R2 | 1.0142 (1.0046–1.0239) | 0.0036 |
Note: p < 0.05 marked as bold.
Abbreviations: CI, confidence interval; HR, hazard ratio. Other abbreviations as in Table 3.
In the multivariable Cox‐regression analyses; when adjusted for age, female sex, and initial risk score, of the six proteins, only ANXA1 (hazard ratio [HR]: 1.0367; 95% CI: 1.0059–1.0684; p = 0.044) and CEACAM8 (HR: 1.0603; 95% CI: 1.0004–1.1237; p = 0.0483) remained statistically significant (Table 5).
Table 5.
Multivariable cox regression.
| HR (95% CI) | p Value | |
|---|---|---|
| ANXA1 | 1.3361 (1.0078–1.7713) | 0.044 |
| Age | 1.0334 (1.0008–1.0671) | 0.0443 |
| Female | 0.2568 (0.1016–0.649) | 0.0041 |
| Risk score | 1.261 (0.5903–2.6937) | 0.5492 |
| CEACAM8 | 1.0603 (1.0004–1.1237) | 0.0483 |
| Age | 1.0315 (0.9979–1.0663) | 0.0664 |
| Female | 0.2962 (0.1175–0.7466) | 0.0099 |
| Risk score | 1.0815 (0.5016–2.3317) | 0.8415 |
| CXCL17 | 1.009 (0.9878–1.0307) | 0.4084 |
| Age | 1.0343 (0.9976–1.0723) | 0.0673 |
| Female | 0.3346 (0.1202–0.9312) | 0.036 |
| Risk score | 1.467 (0.7188–2.9941) | 0.2924 |
| IL‐6 | 1.0119 (0.9917–1.0325) | 0.2514 |
| Age | 1.0399 (1.0065–1.0744) | 0.0188 |
| Female | 0.2763 (0.1111–0.6872) | 0.0057 |
| Risk score | 1.2215 (0.5458–2.7337) | 0.6264 |
| PSP‐D | 1.0532 (0.9945–1.1153) | 0.0764 |
| Age | 1.0274 (0.9931–1.0628) | 0.1185 |
| Female | 0.3012 (0.1203–0.7539) | 0.0104 |
| Risk score | 1.7346 (0.8209–3.6651) | 0.149 |
| TRAIL‐R2 | 1.0104 (0.9974–1.0235) | 0.1168 |
| Age | 1.0341 (0.9997–1.0698) | 0.0524 |
| Female | 0.2577 (0.1019–0.6518) | 0.0042 |
| Risk score | 1.198 (0.5586–2.5695) | 0.6426 |
Note: p < 0.05 marked as bold.
Abbreviations: CI, confidence interval; HR, hazard ratio. Other abbreviations as in Table 3.
DISCUSSION
TRAIL as a potential diagnostic marker of PAH
In PAH, since contemporary diagnostic delays are associated with worse survival, 1 it is imperative to reduce time to PAH diagnosis among patients with unclear dyspnea. Unfortunately, time to diagnosis has barely improved during the last four decades despite improved awareness of the disease. 1 Thus, there is a huge necessity for new diagnostic tools, such as plasma proteins with pathophysiological relevance, which could gain in reducing diagnostic delay, facilitate PAH diagnosis, and allow for earlier treatment initiation and improved prognosis. In the present study, we found that plasma levels of TRAIL were lower in PAH compared to the other dyspnea‐exhibiting disease groups, thus, differentiating PAH, and in addition, TRAIL showed diagnostic potential for PAH in a ROC analysis.
Inclusion of novel biomarkers associated with different pathophysiological mechanisms could be of value in risk stratification as well as in the diagnosis of PAH. Analyzing a combination of several different proteins or “deep phenotyping,” has been proposed as a new means to achieve an aggregated larger diagnostic and prognostic potential than focusing on separate proteins. 20 This may be the direction forward in PAH, as the disease may be reflected by multiple pathological pathways.
TRAIL is a transmembrane protein, expressed in a wide variety of tissues, predominantly in the spleen, lungs, and prostate. 21 Apart from having the potential to bind to four transmembrane receptors, of which two are decoy receptors, TRAIL can also bind soluble protein osteoprotegerin receptor. 22 In a rat monocrotaline (MCT) model of PAH, TRAIL blockage improved survival and resulted in regression of pulmonary vascular remodeling and has previously been suggested as a target for novel PAH treatment. 11 Moreover, TRAIL‐mediated signaling can induce apoptosis and clinical trials have investigated Dulanermin, recombinant human TRAIL as potential treatment for several malignancies. 23 , 24 , 25 Interestingly the plasma TRAIL levels were in our study lower in PAH than in the other disease groups. Speculatively, this downregulation may possibly be ascribed to the vascular alterations in PAH, and reduced susceptibility to apoptosis. Alternatively, an explanation may be different effector proteins and activation of TRAIL‐R1 and TRAIL‐R2 lead to apoptosis but the detrimental effect in PAH is mediated by osteoprotegerin. 11 , 12 , 26 To our knowledge, the effects of recombinant TRAIL or inhibition of osteoprotegerin treatment have been not demonstrated in clinical trials in PAH.
PAH is a progressive disease involving vasoconstriction and vascular remodeling. 9 Current treatments are mainly targeting vasoconstriction and it is possible that they do not affect the expression and/or activity of proteins involved in pulmonary vascular remodeling. Proteins linked to pulmonary arterial remodeling could therefore be a target for future therapies. Interestingly in a recent study of inflammatory phenotypes in PAH, TRAIL was suggested to be part of a high‐risk phenotype associated with worse survival. 27 This is in contrast to the present study in which plasma TRAIL did not differ at baseline between patients stratified into 3‐year survivors versus nonsurvivors. Our result may be attributable to PAH being a progressive disease and albeit initial TRAIL levels are similar corresponding to disease progression.
ANXA1 as a potential prognostic marker in PAH
Current risk stratification strategies guiding PAH‐treatment decisions may be improved by the inclusion of novel biomarkers to achieve better prognostic accuracy, potentially resolving the large intermediate‐risk group into intermediate‐low and intermediate‐high category, respectively. 4 , 5 Increasing the accuracy of risk stratification models may allow for more precise and individualized PAH‐guided treatment alternatives, potentially reduce morbidity, and improve survival of PAH patients. In the prognostic arm of this study, we found that high plasma levels of ANXA1 were associated with worse prognosis compared to low levels, in both uni‐ and multivariable models when adjusted for age and sex. The association was, however, not significant when adjusted for SPAHR‐based ESC/ERS risk scores in the model. However, other factors, such as the comorbid burden may have impacted the results, which were not accounted for in the current study. Therefore, further studies addressing whether ANXA1 have an added value to the ESC/ERS risk score or operate only as a surrogate marker for deterioration of right heart function. 28
Strength and limitations
Strengths of the present study include the use of proximity extension assays, allowing the measurement of many proteins simultaneously while minimizing cross‐reactivity. Although the higher age interval of included PAH patients could be considered somewhat high compared to the other disease groups, The age of the PAH group is, however, in line with contemporary registries including comparative, prospective registry of newly initiated therapies for pulmonary hypertension and SPAHR. 29 , 30
Although circulating protein levels may not reflect the protein expression in the lung tissue or pulmonary vasculature, plasma biomarkers are an established means for diagnosis and prognostication. This study encompassed several dyspnea groups of cardiac origin, but not lung disease. Future studies evaluating discriminative ability versus lung disease, for example, chronic obstructive lung disease would be of value. Moreover, the present study is a single‐center study with a relatively small study population, resulting in a limited number of cases and events, therefore limiting the number allowed of covariables in regression analyses. Future validation in larger external cohorts is, therefore, encouraged.
CONCLUSIONS
In the present study, lower plasma TRAIL levels identified PAH, among healthy controls and other dyspnea groups (HFpEF‐PH, HFrEF‐PH, HF‐no‐PH, CTEPH), with a good accuracy. TRAIL could potentially, alone or as a part of a deep phenotyping array identify patients with PAH among other patients with dyspnea. Moreover, ANXA1 was associated with worse prognosis in patients with PAH and may be a potential biomarker in prognostication. Future multicenter studies are encouraged to validate our results in other external cohorts.
AUTHOR CONTRIBUTIONS
Mattias Arvidsson, Abdulla Ahmed, Salaheldin Ahmed, Joanna Säleby, Roger Hesselstrand, and Göran Rådegran made a substantial contribution to the concept or design of the work; as well as acquisition, analysis, and/or interpretation of data. Mattias Arvidsson drafted the article. Mattias Arvidsson, Abdulla Ahmed, Salaheldin Ahmed, Joanna Säleby, Roger Hesselstrand, and Göran Rådegran revised it critically for important intellectual content and approved the final version to be published.
CONFLICTS OF INTEREST STATEMENT
Dr. Roger Hesselstrand is also an employee at Boehringer Ingelheim since October 2021. Dr. Abdulla Ahmed and Dr. Salaheldin Ahmed report personal lecture fees from Janssen‐Cilag AB and Nordic Infucare, outside the submitted work. Dr. Göran Rådegran reports personal lecture fees from Actelion Pharmaceuticals, Bayer Health Care, GlaxoSmithKline, Janssen Cilag AB, and Nordic Infucare, outside the submitted work. Dr. Göran Rådegran has received unrestricted research grants from Actelion Pharmaceuticals, GlaxoSmithKline, Nordic Infucare, and a noninterventional investigator‐initiated study research grant from Janssen Cilag AB. Göran Rådegran is and has been primary‐, or co‐, investigator in; clinical PAH trials for Acceleron, Actelion Pharmaceuticals, Bayer, GlaxoSmithKline, Janssen, Pfizer, and United Therapeutics, and in clinical heart transplantation immunosuppression trials for Novartis. The remaining authors declare no conflict of interest.
ETHICS STATEMENT
This study was conducted in accordance with the declaration of Helsinki and Istanbul. All participants had provided informed and written consent before enrollment. The study was approved by the regional ethics board, Lund, Sweden (Diary numbers 2010/114, 2010/248, 2010/442, 2011/368, 2015/270).
ACKNOWLEDGMENTS
We acknowledge the support of the staff at the Haemodynamic Lab, The Section for Heart Failure and Valvular Disease, VO Heart and Lung Medicine, Skåne University Hospital, Lund, Sweden, and The Department of Clinical Sciences, Lund, Cardiology, Lund University, Lund, Sweden. Special thanks to Anneli Ahlqvist for assembling the plasma samples and LCPR registration. In addition, we acknowledge the biobank services and retrieval of blood samples from LCPR performed at Lab Medicine Skåne, University, and Regional Laboratories, Region Skåne, Sweden. This study was financed by Swedish governmental funding of clinical research (ALF) and a noninterventional investigator‐initiated study research grant from Janssen‐Cilag AB.
Arvidsson M, Ahmed A, Säleby J, Ahmed S, Hesselstrand R, Rådegran G. Plasma TRAIL and ANXA1 in diagnosis and prognostication of pulmonary arterial hypertension. Pulm Circ. 2023;13:e12269. 10.1002/pul2.12269
REFERENCES
- 1. Khou V, Anderson JJ, Strange G, Corrigan C, Collins N, Celermajer DS, Dwyer N, Feenstra J, Horrigan M, Keating D, Kotlyar E, Lavender M, McWilliams TJ, Steele P, Weintraub R, Whitford H, Whyte K, Williams TJ, Wrobel JP, Keogh A, Lau EM. Diagnostic delay in pulmonary arterial hypertension: insights from the Australian and New Zealand pulmonary hypertension registry. Respirology. 2020;25:863–871. 10.1111/resp.13768 [DOI] [PubMed] [Google Scholar]
- 2. Rich S. Primary pulmonary hypertension. Ann Intern Med. 1987;107:216–223. 10.7326/0003-4819-107-2-216 [DOI] [PubMed] [Google Scholar]
- 3. Michelson E, Hollrah S. Evaluation of the patient with shortness of breath: an evidence based approach. Emerg Med Clin North Am. 1999;17:221–237. 10.1016/S0733-8627(05)70054-7 [DOI] [PubMed] [Google Scholar]
- 4. Galiè N, Humbert M, Vachiery JL, Gibbs S, Lang I, Torbicki A, Simonneau G, Peacock A, Vonk Noordegraaf A, Beghetti M, Ghofrani A, Gomez Sanchez MA, Hansmann G, Klepetko W, Lancellotti P, Matucci M, McDonagh T, Pierard LA, Trindade PT, Zompatori M, Hoeper M, ESC Scientific Document G. 2015 ESC/ERS Guidelines for the diagnosis and treatment of pulmonary hypertension: The Joint Task Force for the Diagnosis and Treatment of Pulmonary Hypertension of the European Society of Cardiology (ESC) and the European Respiratory Society (ERS): endorsed by: Association for European Paediatric and Congenital Cardiology (AEPC), International Society for Heart and Lung Transplantation (ISHLT). Eur Heart J. 2016;37:67–119. 10.1093/eurheartj/ehv317 [DOI] [PubMed] [Google Scholar]
- 5. Humbert M, Kovacs G, Hoeper MM, Badagliacca R, Berger R, Brida M, Carlsen J, Coats A, Escribano‐Subias P, Ferrari P, Ferreira DS, Ghofrani HA, Giannakoulas G, Kiely DG, Mayer E, Meszaros G, Nagavci B, Olsson KM, Pepke‐Zaba J, Quint JK, Rådegran G, Simonneau G, Sitbon O, Tonia T, Toshner M, Vachiery JL, Vonk Noordegraaf A, Delcroix M, Rosenkranz S, ESC/ERS Scientific Document G. 2022 ESC/ERS Guidelines for the diagnosis and treatment of pulmonary hypertension. Eur Heart J. 2022;43:3618–3731. 10.1093/eurheartj/ehac237 [DOI] [PubMed] [Google Scholar]
- 6. Benza RL, Gomberg‐Maitland M, Elliott CG, Farber HW, Foreman AJ, Frost AE, McGoon MD, Pasta DJ, Selej M, Burger CD, Frantz RP. Predicting survival in patients with pulmonary arterial hypertension. Chest. 2019;156:323–337. 10.1016/j.chest.2019.02.004 [DOI] [PubMed] [Google Scholar]
- 7. Benza RL, Kanwar MK, Raina A, Scott JV, Zhao CL, Selej M, Elliott CG, Farber HW. Development and validation of an abridged version of the REVEAL 2.0 risk score calculator, REVEAL lite 2, for use in patients with pulmonary arterial hypertension. Chest. 2021;159:337–346. 10.1016/j.chest.2020.08.2069 [DOI] [PMC free article] [PubMed] [Google Scholar]
- 8. Zelt JGE, Hossain A, Sun LY, Mehta S, Chandy G, Davies RA, Contreras‐Dominguez V, Dunne R, Doyle‐Cox C, Wells G, Stewart DJ, Mielniczuk LM. Incorporation of renal function in mortality risk assessment for pulmonary arterial hypertension. J Heart Lung Transplant. 2020;39:675–685. 10.1016/j.healun.2020.03.026 [DOI] [PubMed] [Google Scholar]
- 9. Humbert M, Guignabert C, Bonnet S, Dorfmüller P, Klinger JR, Nicolls MR, Olschewski AJ, Pullamsetti SS, Schermuly RT, Stenmark KR, Rabinovitch M. Pathology and pathobiology of pulmonary hypertension: state of the art and research perspectives. Eur Respir J. 2019;53:1801887. 10.1183/13993003.01887-2018 [DOI] [PMC free article] [PubMed] [Google Scholar]
- 10. Hurst LA, Dunmore BJ, Long L, Crosby A, Al‐Lamki R, Deighton J, Southwood M, Yang X, Nikolic MZ, Herrera B, Inman GJ, Bradley JR, Rana AA, Upton PD, Morrell NW. TNFα drives pulmonary arterial hypertension by suppressing the BMP type‐II receptor and altering NOTCH signalling. Nat Commun. 2017;8:14079. 10.1038/ncomms14079 [DOI] [PMC free article] [PubMed] [Google Scholar]
- 11. Hameed AG, Arnold ND, Chamberlain J, Pickworth JA, Paiva C, Dawson S, Cross S, Long L, Zhao L, Morrell NW, Crossman DC, Newman CMH, Kiely DG, Francis SE, Lawrie A. Inhibition of tumor necrosis factor–related apoptosis‐inducing ligand (TRAIL) reverses experimental pulmonary hypertension. J Exp Med. 2012;209:1919–1935. 10.1084/jem.20112716 [DOI] [PMC free article] [PubMed] [Google Scholar]
- 12. Arnold ND, Pickworth JA, West LE, Dawson S, Carvalho JA, Casbolt H, Braithwaite AT, Iremonger J, Renshall L, Germaschewski V, McCourt M, Bland‐Ward P, Kowash H, Hameed AG, Rothman AMK, Frid MG, Roger Thompson AA, Evans HR, Southwood M, Morrell NW, Crossman DC, Whyte MKB, Stenmark KR, Newman CM, Kiely DG, Francis SE, Lawrie A. A therapeutic antibody targeting osteoprotegerin attenuates severe experimental pulmonary arterial hypertension. Nat Commun. 2019;10:5183. 10.1038/s41467-019-13139-9 [DOI] [PMC free article] [PubMed] [Google Scholar]
- 13. Galie N, Hoeper MM, Humbert M, Torbicki A, Vachiery JL, Barbera JA, Beghetti M, Corris P, Gaine S, Gibbs JS, Gomez‐Sanchez MA, Jondeau G, Klepetko W, Opitz C, Peacock A, Rubin L, Zellweger M, Simonneau G. Guidelines for the diagnosis and treatment of pulmonary hypertension. Eur Respir J. 2009;34:1219–1263. 10.1183/09031936.00139009 [DOI] [PubMed] [Google Scholar]
- 14. Galiè N, Humbert M, Vachiery J‐L, Gibbs S, Lang I, Torbicki A, Simonneau G, Peacock A, Vonk Noordegraaf A, Beghetti M, Ghofrani A, Gomez Sanchez MA, Hansmann G, Klepetko W, Lancellotti P, Matucci M, McDonagh T, Pierard LA, Trindade PT, Zompatori M, Hoeper M. 2015 ESC/ERS Guidelines for the diagnosis and treatment of pulmonary hypertension. Eur Respir J. 2015;46:903–975. 10.1183/13993003.01032-2015 [DOI] [PubMed] [Google Scholar]
- 15. Mcmurray JJ, Adamopoulos S, Anker SD, Auricchio A, Böhm M, Dickstein K, Falk V, Filippatos G, Fonseca C, Gomez‐Sanchez MA, Jaarsma T, Køber L, Lip GY, Maggioni AP, Parkhomenko A, Pieske BM, Popescu BA, Rønnevik PK, Rutten FH, Schwitter J, Seferovic P, Stepinska J, Trindade PT, Voors AA, Zannad F, Zeiher A, ESC Committee for Practice G. ESC Guidelines for the diagnosis and treatment of acute and chronic heart failure 2012: The Task Force for the Diagnosis and Treatment of Acute and Chronic Heart Failure 2012 of the European Society of Cardiology. Developed in collaboration with the Heart Failure Association (HFA) of the ESC. Eur Heart J. 2012;33:1787–1847. 10.1093/eurheartj/ehs104 [DOI] [PubMed] [Google Scholar]
- 16. Assarsson E, Lundberg M, Holmquist G, Björkesten J, Bucht Thorsen S, Ekman D, Eriksson A, Rennel Dickens E, Ohlsson S, Edfeldt G, Andersson AC, Lindstedt P, Stenvang J, Gullberg M, Fredriksson S. Homogenous 96‐plex PEA immunoassay exhibiting high sensitivity, specificity, and excellent scalability. PLoS One. 2014;9:e95192. 10.1371/journal.pone.0095192 [DOI] [PMC free article] [PubMed] [Google Scholar]
- 17. Arvidsson M, Ahmed A, Bouzina H, Rådegran G. Plasma proteoglycan prolargin in diagnosis and differentiation of pulmonary arterial hypertension. ESC Heart Fail. 2021;8:1230–1243. 10.1002/ehf2.13184 [DOI] [PMC free article] [PubMed] [Google Scholar]
- 18. Kylhammar D, Kjellström B, Hjalmarsson C, Jansson K, Nisell M, Söderberg S, Wikström G, Rådegran G. A comprehensive risk stratification at early follow‐up determines prognosis in pulmonary arterial hypertension. Eur Heart J. 2018;39:4175–4181. 10.1093/eurheartj/ehx257 [DOI] [PubMed] [Google Scholar]
- 19. Arvidsson M, Ahmed A, Bouzina H, Rådegran G. Matrix metalloproteinase 7 in diagnosis and differentiation of pulmonary arterial hypertension. Pulm Circ. 2019;9:1–8. 10.1177/2045894019895414 [DOI] [PMC free article] [PubMed] [Google Scholar]
- 20. Frost A, Badesch D, Gibbs JSR, Gopalan D, Khanna D, Manes A, Oudiz R, Satoh T, Torres F, Torbicki A. Diagnosis of pulmonary hypertension. Eur Respir J. 2019;53:1801904. 10.1183/13993003.01904-2018 [DOI] [PMC free article] [PubMed] [Google Scholar]
- 21. Wiley SR, Schooley K, Smolak PJ, Din WS, Huang CP, Nicholl JK, Sutherland GR, Smith TD, Rauch C, Smith CA, Goodwin RG. Identification and characterization of a new member of the TNF family that induces apoptosis. Immunity. 1995;3:673–682. 10.1016/1074-7613(95)90057-8 [DOI] [PubMed] [Google Scholar]
- 22. Emery JG, McDonnell P, Burke MB, Deen KC, Lyn S, Silverman C, Dul E, Appelbaum ER, Eichman C, DiPrinzio R, Dodds RA, James IE, Rosenberg M, Lee JC, Young PR. Osteoprotegerin is a receptor for the cytotoxic ligand TRAIL*. J Biol Chem. 1998;273:14363–14367. 10.1074/jbc.273.23.14363 [DOI] [PubMed] [Google Scholar]
- 23. Holland PM. Targeting Apo2L/TRAIL receptors by soluble Apo2L/TRAIL. Cancer Lett. 2013;332:156–162. 10.1016/j.canlet.2010.11.001 [DOI] [PubMed] [Google Scholar]
- 24. Ouyang X, Shi M, Jie F, Bai Y, Shen P, Yu Z, Wang X, Huang C, Tao M, Wang Z, Xie C, Wu Q, Shu Y, Han B, Zhang F, Zhang Y, Hu C, Ma X, Liang Y, Wang A, Lu B, Shi Y, Chen J, Zhuang Z, Wang J, Huang J, Wang C, Bai C, Zhou X, Li Q, Chen F, Yu H, Feng J. Phase III study of dulanermin (recombinant human tumor necrosis factor‐related apoptosis‐inducing ligand/Apo2 ligand) combined with vinorelbine and cisplatin in patients with advanced non‐small‐cell lung cancer. Invest New Drugs. 2018;36:315–322. 10.1007/s10637-017-0536-y [DOI] [PubMed] [Google Scholar]
- 25. von Karstedt S, Montinaro A, Walczak H. Exploring the TRAILs less travelled: TRAIL in cancer biology and therapy. Nat Rev Cancer. 2017;17:352–366. 10.1038/nrc.2017.28 [DOI] [PubMed] [Google Scholar]
- 26. Lawrie A. The role of the osteoprotegerin/tumor necrosis factor related apoptosis‐inducing ligand axis in the pathogenesis of pulmonary arterial hypertension. Vascul Pharmacol. 2014;63:114–117. 10.1016/j.vph.2014.10.002 [DOI] [PubMed] [Google Scholar]
- 27. Sweatt AJ, Hedlin HK, Balasubramanian V, Hsi A, Blum LK, Robinson WH, Haddad F, Hickey PM, Condliffe R, Lawrie A, Nicolls MR, Rabinovitch M, Khatri P, Zamanian RT. Discovery of distinct immune phenotypes using machine learning in pulmonary arterial hypertension. Circ Res. 2019;124:904–919. 10.1161/CIRCRESAHA.118.313911 [DOI] [PMC free article] [PubMed] [Google Scholar]
- 28. Potus F, Hindmarch C, Dunham‐Snary K, Stafford J, Archer S. Transcriptomic signature of right ventricular failure in experimental pulmonary arterial hypertension: deep sequencing demonstrates mitochondrial, fibrotic, inflammatory and angiogenic abnormalities. Int J Mol Sci. 2018;19:2730. 10.3390/ijms19092730 [DOI] [PMC free article] [PubMed] [Google Scholar]
- 29. Hoeper MM, Huscher D, Ghofrani HA, Delcroix M, Distler O, Schweiger C, Grunig E, Staehler G, Rosenkranz S, Halank M, Held M, Grohé C, Lange TJ, Behr J, Klose H, Wilkens H, Filusch A, Germann M, Ewert R, Seyfarth HJ, Olsson KM, Opitz CF, Gaine SP, Vizza CD, Vonk‐Noordegraaf A, Kaemmerer H, Gibbs JSR, Pittrow D. Elderly patients diagnosed with idiopathic pulmonary arterial hypertension: results from the COMPERA registry. Int J Cardiol. 2013;168:871–880. 10.1016/j.ijcard.2012.10.026 [DOI] [PubMed] [Google Scholar]
- 30. Rådegran G, Kjellström B, Ekmehag B, Larsen F, Rundqvist B, Blomquist SB, Gustafsson C, Hesselstrand R, Karlsson M, Kornhall B, Nisell M, Persson L, Ryftenius H, Selin M, Ullman B, Wall K, Wikström G, Willehadson M, Jansson K. Characteristics and survival of adult Swedish PAH and CTEPH patients 2000‐2014. Scand Cardiovasc J. 2016;50:243–250. 10.1080/14017431.2016.1185532 [DOI] [PubMed] [Google Scholar]