

SUMMARY
Emerging new evidence highlights the importance of prolonged daily fasting periods for the health and survival benefits of calorie restriction (CR) and time-restricted feeding (TRF) in male mice; however, little is known about the impact of these feeding regimens in females. We placed 14-month-old female mice on five different dietary regimens, either CR or TRF with different feeding windows, and determined their effects on physiological responses, progression of neoplasms and inflammatory diseases, serum metabolite levels, and lifespan. Compared to TRF feeding, CR elicited a robust systemic response, as it relates to energetics and healthspan metrics, a unique serum metabolomics signature in overnight fasted animals, and was associated with an increase in lifespan. These results indicate that daytime (rest-phase) feeding with prolonged fasting periods initiated late in life confer greater benefits when combined with imposed lower energy intake.
Keywords: Calorie restriction, time-restricted feeding, fasting, female mice, aging phenotypes, circadian misalignment, histopathology, metabolomics
eTOC
In this study, Duregon et al. reveal greater benefits of a mild reduction of caloric intake over time-restricted feeding in adult female mice, highlighting the added contribution of reduced energy intake to further improve the effects of daily fasting in terms of fitness, in vivo metabolism, and survival.
Graphical Abstract
INTRODUCTION
Dietary interventions are valuable strategies for promoting healthy aging. Calorie restriction (CR) without malnutrition markedly increases longevity and delays the onset of age-associated diseases and pathologies in most model organisms and mammals.1–3 The effectiveness of CR in a clinical setting is limited because this intervention is difficult to maintain for extended periods of time. As a result, alternative feeding regimens have become increasingly popular, including intermittent fasting and repeated cycles of fasting mimicking diet.4,5 Time-restricted feeding (TRF), which originally arose from circadian timing and alignment, involves limiting the daily access to food to 8–10 h or less without specifically imposed caloric restriction.6,7 This approach results in prolonged fasting intervals between meals and offers protection from metabolic diseases in mice and ameliorates symptoms in healthy people with obesity and patients with prediabetes.8–12
Short-term studies in 10-week-old male C57BL/6J mice have reported that CR and imposed 12-h TRF differentially impacted food intake patterns, health measure outcomes, and behavior.13 A second short-term study in 16-week-old C57BL/6J mice showed that 12-h TRF, with feeding starting 2h after the lights off that extends 2h during the rest phase, induces a broad improvement of metabolic health, but also elicits a metabolically different response from once-a-day CR, which was given during the nighttime.14 Mice on CR consumed their food portion rapidly, leading to longer fasting times compared to the 12-h TRF group, coupled with the lower food intake likely accounts for the metabolic differences. An extensive study on the short-term impact of TRF in 12-week-old male mice fed an obesogenic diet revealed profound transcriptional changes in the diurnal expression profiles in various tissues.15 The consequences of long-term exposure to TRF vs. CR on physiological, metabolic, and aging phenotypes are still ill-defined. Although genetic background and sex play determinant roles in the health and longevity benefits of calorie restriction,16–20 most of the studies investigating the metabolic responses to CR and TRF strategies have been conducted in male mice, resulting in significant underrepresentation of female animals even though they are generally protected against diet-induced glucose and lipid dysregulation compared to males.21–23
The impact of age on the control of energy homeostasis and metabolism22,24 led us to consider whether CR and TRF elicited differential health measure outcomes, distinct pathophysiological processes, and unique metabolic signatures in female C57BL/6J mice when the feeding paradigms were initiated at midlife. We used a large cohort of 60-week-old animals (n=250) maintained on regular laboratory chow and distributed the mice into five feeding regimens: ad libitum (AL), TRF for 4 h and 8 h, and 20% CR provided either once-a-day or divided into two mini-meals (CRx2) given 8 h apart. Misalignment of feeding/fasting periods through daytime feeding lessens the health benefits of dietary interventions of mice (nocturnal animals) without impacting maximum lifespan.25 Despite this limitation and possible effect on health,26–31 we examined the long-term impact of limiting access to food to a few hours during daytime using a customized version of a commercial 7-day carousel feeder affixed to standard mouse cages to allow control of the duration and frequency of meals, including the inter-meal fasting periods. Over the next 80 weeks, we performed a comprehensive phenotypic and metabolic assessment along with a lifespan and histopathological analysis at the time of death, metabolomics analysis of serum samples, and integration of physiological and metabolic variables. Overall, the results support the notion of a superior systemic impact of sustained low-calorie intake vs. TRF in conferring the health benefits and life-extending properties of fasting.
RESULTS
Patterns of food intake and body weight (BW) changes for mice on AL, TRF and CR diets
After one-week acclimatization to the manually operated 7-day carousel feeder system (Figure S1A), 61-week-old C57BL/6J female mice fed AL (n=50) consumed a constant amount of NIH-31 chow (3.62 ± 0.29 g/mouse/day) while maintaining their BW (34.45 ± 5.35 g) for the next 24 weeks, after which the animals (now at 85 weeks of age) started to consume more food while progressively losing weight (Figures 1A and 1B). Food consumption plateaued at around 45 weeks (106-week-old mice) with BW continuing to drop. Mice on TRF8 (n=48) and TRF4 (n=47) had unlimited access to food for 8 and 4 h, respectively (Figure S1B). Both groups showed a 22–24% reduction in food intake for the first 24 weeks after diet switching compared with AL controls (g/mouse/day; 3.07 ± 0.23 and 3.01 ± 0.27, respectively, vs. 3.95 ± 0.21, p<0.0001), but then were gradually consuming more food, approaching the levels of AL mice after a 45–50-week intervention period (g/mouse/day; 4.48 ± 0.39 and 4.26 ± 0.19 vs. 4.79 ± 0.54, p=0.277 and 0.046, respectively) (Figures 1B and 1C), while steadily losing weight (27% loss after diet switching for 67 weeks). The overall calorie restriction achieved in the TRF groups averaged ~15%. Mice on CR and CRx2 consumed a pre-weighed amount of food (3.0 g chow/day) throughout the experiment either as a single portion or split into two mini servings, respectively (Figure S1B). The fact that CRx2 mice had access to a second meal later in the day served as pair-fed controls to CR animals, but with a shortened fasting period. Because of the progressive increase in food consumption under AL feeding, mice on CR experienced a higher degree of calorie restriction, passing from 20% at the start of the experiment to ~35% restriction after 45 weeks (Figure 1C). In agreement with earlier reports,1 mice on 20% CR ate their food within a few hours followed by a prolonged fasting period, approaching the dietary pattern of TRF4 mice. As anticipated, mice on CR and CRx2 gradually lost weight throughout the experiment. The trajectories of food consumption and BW change across the first 66 weeks of treatment were divided into 3 × 20-week windows (bin 1: 4– 24; bin 2, 25–45; bin 3, 46–66) to illustrate better the temporal changes in feeding behavior (Figure S1C). Focusing on the critical 25–45-week intervention period (bin 2), we observed a sharper rate of decline in the ‘weight change-to-food consumption’ ratio for mice on TRF (TRF4 and TRF8) compared to CR (CR and CRx2) (Figure S1D). Thus, female mice fed AL and TRF for 26 weeks spontaneously increased their food intake while maintaining stable body temperature at around 37 °C (Figure S1E).
Figure 1. Effect of late onset feeding regime on markers of health in female C57BL/6J mice.
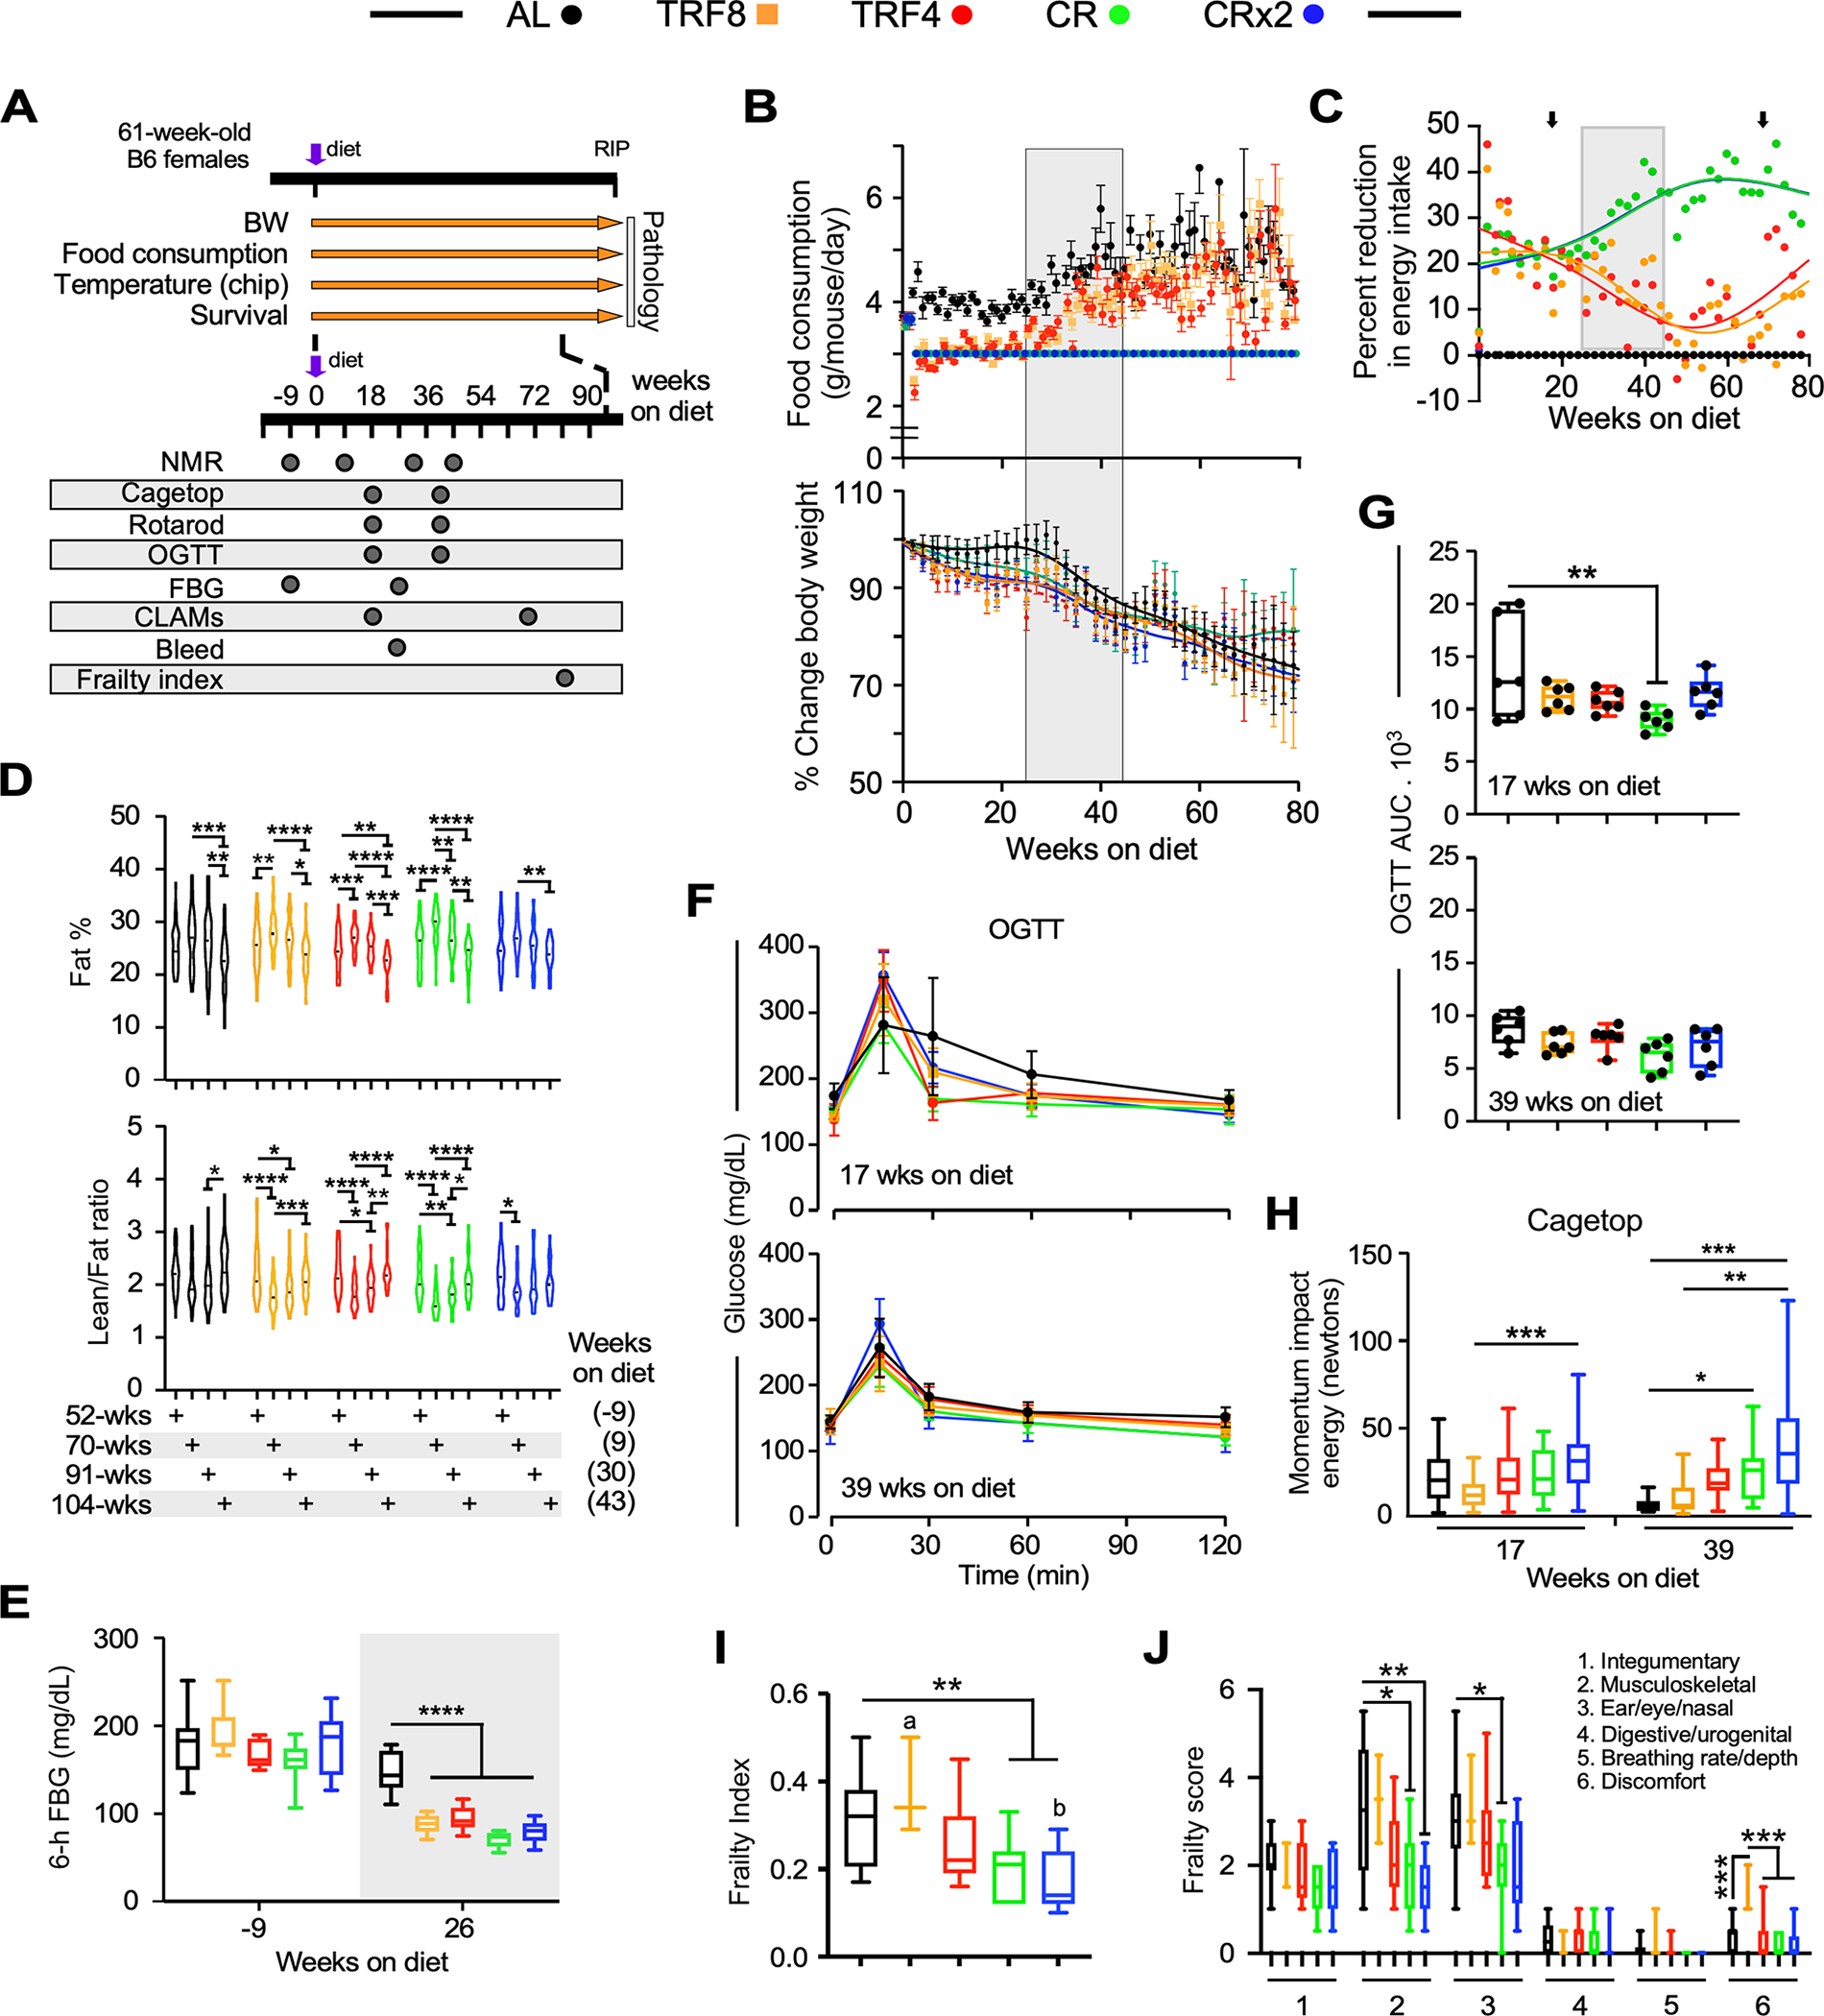
(A) Timetable for the measure of the indicated physiological parameters.
(B) Trajectories of food consumption (top panel) and percent change in body weight (bottom panel) over the course of 80 weeks under the indicated feeding regimens. Data are expressed as means +/− 95% confidence intervals (CI). Gray box indicates a volitional increase in food consumption (25–45 weeks after diet switching) by mice fed AL, TRF4 and TRF8.
(C) Degree of calorie restriction (referred as percent reduction in energy intake vs. AL feeding) over the course of 80 weeks after diet switching. Black arrows denote measurements of energy metabolism from indirect calorimetry. See Figure 2 for additional details.
(D) Percentage of whole-body fat mass (upper panel) and lean-to-fat ratio calculation (bottom panel) as assessed by low-field nuclear magnetic resonance imaging. Data distribution is visualized as violin plots with a marker for the median.
(E) Fasting blood glucose (FBG) levels at baseline and 26 weeks after diet switching. Mice were fasted for 6 h. n=6 per group.
(F) Trajectories of blood glucose clearance during an oral glucose tolerance test (OGTT), with values represented as means +/− SD. n=6 per group.
(G) Area under the curve (AUC) from the OGTT experiment.
(H) Momentum of impact energy derived from the inverted cage top experiment.
(I, J) Overall frailty index score (I) and domain-specific frailty scores (J) were recorded. n=11–16 per group. (F, H-J) Data are represented as box and whisker plots, depicting minimum, lower quartile (Q1), median (Q2), upper quartile (Q3) and maximum values.
Data have been analyzed using either two-way ANOVA coupled with Sidak’s post-hoc test (D) or one-way ANOVA with Dunnett’s post-hoc test (E,G-J) (see Table S1). *, **, ***, ****, p < 0.05, 0.01, 0.001, and 0.0001. Different lowercase letters indicate significant differences at p < 0.01 (panel I).
Body composition analysis using low-field NMR spectroscopy was performed at baseline and after a 9-, 30-, and 43-week intervention period. A significant body weight loss was found in mice on the various feeding regimens for 43 weeks (Figure S1F). Mice fed AL for 9 weeks gained body fat (as % BW) and remained stable up to 30 weeks before losing fat by 43 weeks of feeding (Figure 1D). Despite a significant increase in food consumption in mice on TRF4 and TRF8 vs. CR and CRx2, diet switching resulted in fat gain (as percent of body weight) in the 4 groups of mice after 9 weeks of treatment followed by a progressive loss of fat mass (Figure 1D, upper panel). Regardless of feeding regimens, significant reduction in lean-to-fat ratio occurred at 30 weeks after diet switching, mirroring the increase in fat mass, followed by a progressive increase at 43 weeks, coincident with fat loss (Figure 1D, lower panels). Thus, no clear differences in body composition were observed in response to the various feeding interventions even though mice were consuming different amounts of food.
The impact of feeding regimen on whole-body metabolism and glucose homeostasis was investigated next. Fasting blood glucose (FBG) was measured 9 weeks before the start of the study (52 weeks of age) and 26 weeks after diet switching (87 weeks of age). While all groups of mice had similar FBG at baseline, the blood glucose levels were significantly lower in response to the four interventions vs. AL feeding (Figure 1E) as mice were entering the second 20-week window.
Oral glucose tolerance test (OGTT) was then performed to assess the glucose clearance rate from the bloodstream. Glucose levels in mice kept on their respective feeding regimen for 17 weeks rose rapidly upon bolus administration of glucose, reaching a peak at 15 min before returning to basal levels, with the AL mice exhibiting a much slower decline, consistent with a state of partial insulin resistance (Figure 1F, upper panel). After a 39-week intervention period, there was an overall reduction in peak glucose (Figure 1F, bottom panel) that translated into lower area under the curve (AUC) values compared to the former groups of mice (Figure 1G, bottom vs. top panel). Mice maintained on CR for 17 weeks exhibited significantly greater glucose clearance than AL controls (Figure 1G), regardless of whether the OGTT results were normalized by % body fat (Figures S1G, S1H).
The impact of diet switching and associated body composition changes on physical performance measurements was evaluated using traditional rotarod and inverted cage top tests. While none of the feeding regimens conferred benefits after a 17-week intervention period compared to AL, mice on TRF4 for 39 weeks showed greater coordination and balance, as measured by the rotarod test (Figure S1I). Moreover, mice maintained on CR and CRx2 for 39 weeks significantly outperformed TRF and AL animals on the cage top test, in which the latency to fall, body weight, and gravity were considered to calculate the momentum impact energy (in newtons) (Figure 1H).
Frailty is an established aging biomarker characterized in part by loss of BW and muscle strength, as well as cognitive decline.32,33 A significant reduction in frailty index was observed 80 weeks after diet switching in mice fed CR and CRx2, but not TRF (Figure 1I), of which the musculoskeletal and ear/eye/nasal components were significantly changed (Figure 1J). Overall, these results suggest greater improvement in key phenotypic measures in the CR animals, likely because of the different degrees of calorie restriction between the continuous CR and the TRF groups.
The impact of the various feeding regimens on in vivo metabolism of mice was assessed by indirect calorimetry using metabolic chambers. Three-day experiments were carried out at 17 and 69 weeks after diet switching, collecting weight changes, food intake, oxygen consumption (VO2) and CO2 produced (VCO2), calculated respiratory exchange ratio (RER), energy expenditure (EE), and ambulatory activity counts.
Mice on AL for 17 weeks lost on average 0.97 g (95%CI: −0.47–2.42) of body weight (~ 2.7% of their starting weight), whereas those on TRF8, TRF4, CR and CRx2 lost on average 2.87 g (95%CI: 0.83–4.90), 1.33 g (95%CI: −0.48–3.15), 2.48 g (95%CI: 0.96–4.01), and 3.55 g (95%CI: 2.90–4.20) of body weight, respectively, which amounted to 8.4%, 4.5%, 7.8%, and 11.2% of their starting weight (Figure 2A, left panel). None of the groups showed significant separation from the AL group (one-way ANOVA: F (4,25) = 1.806, p=0.1592). In contrast, following a 69-week intervention, mice on AL housed in metabolic cages lost on average 1.41 g (95% CI: 0.53–2.28) of body weight (~5.3% of their starting weight), whereas TRF8, TRF4, CR, and CRx2 feeding caused mice to lose on average 4.10 g (95%CI: 2.95–5.24), 4.12 g (95%CI: 3.23–5.02), 4.57 g (95%CI, 3.10–6.04), and 4.50 g (95%CI: 3.87–5.12) of body weight, respectively, which amounted to 14.5%, 15.4%, 17.6%, and 18.9% of their starting weight (Figure 2A, right panel). All four feeding regimens were associated with significant separation from the AL group (one-way ANOVA: F (4,24) = 6.226, p=0.0014). Food consumption was significantly lower in the four experimental groups of mice vs. AL-fed controls, regardless of the intervention period (Figure 2B). The feeding efficiency, defined as the change in body weight over the number of calories consumed while in the metabolic cage, was not impacted by diet switching for 17 weeks, but was significantly reduced only in mice on CRx2 vs. AL for 69 weeks (Figure 2C).
Figure 2. Impact of late onset feeding regimens on in vivo metabolic function in female mice.
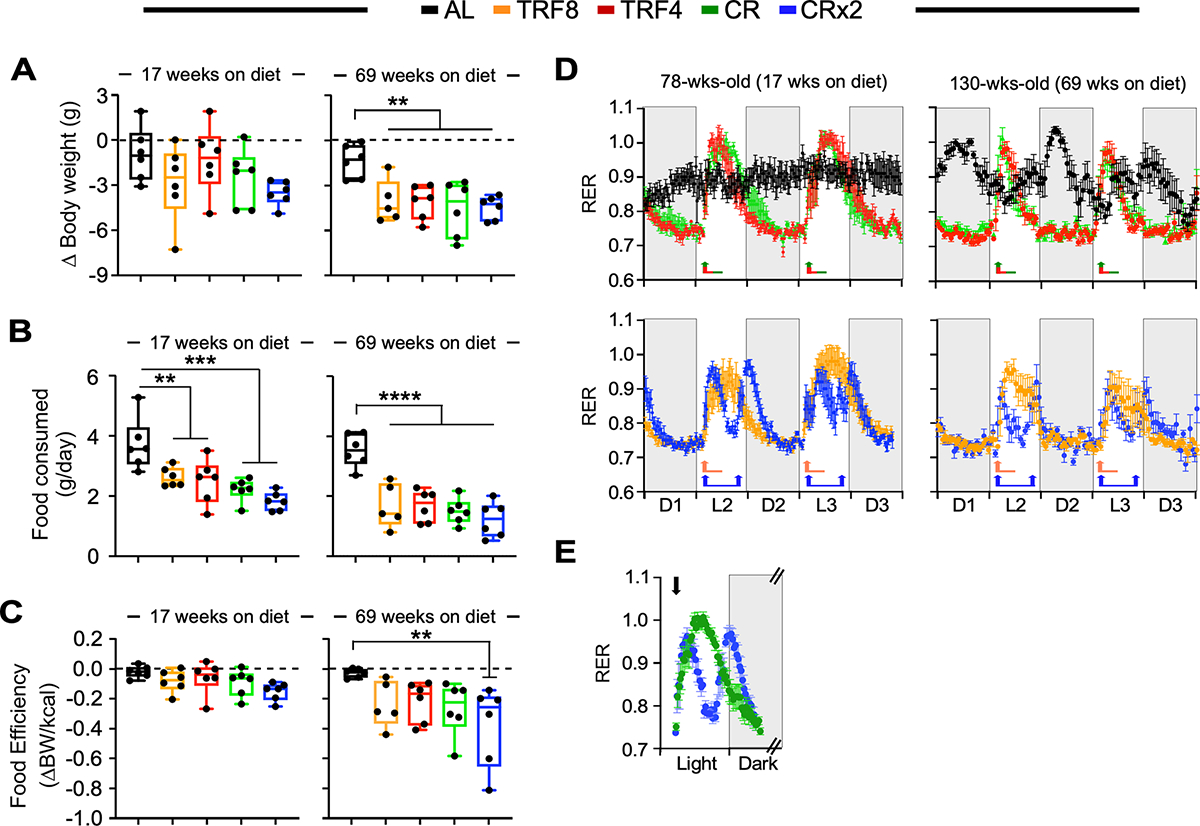
Mice exposed to the indicated feeding regimen for 17 and 69 weeks were placed into metabolic cages for 72 h to measure VO2, VCO2, respiratory exchange ratio (RER), energy expenditure (EE), and locomotor activity. The values associated with the first 12 h acclimatization phase (L1) were discarded. n=6 per group.
(A) Change in body weight as mice entered and left the metabolic cage. The lack of change in body weight is indicated by the dashed line.
(B) Daily food consumption while in metabolic cages.
(C) Food efficiency was calculated as the ratio between body weight changes and the net energy intake (kCal) while mice were in the metabolic cage. The lack of change in body weight yields a food efficiency of ‘0’ as indicated by the dashed line.
(D) Averaged hourly RER trajectories were captured during 3 dark and 2 light cycles in mice exposed to the indicated feeding regimens for 17 weeks (left panels) and 69 weeks (right panels). Arrows indicate feeding time (8:30 AM for all groups and 4:30 PM for CRx2 only).
(E) Averaged hourly RER trajectories of CR (green symbols) and CRx2 (blue symbols) mice under light and dark phases. Arrow, feeding time at 8:30 AM.
(A-C) Data are represented as box and whisker plots, depicting minimum, lower quartile (Q1), median (Q2), upper quartile (Q3) and maximum values. One-way ANOVA coupled with Dunnett’s post-hoc test was performed. **, *** and ****, p < 0.01, 0.001 and 0.0001.
To determine the possible impact of the various feeding regimens on whole-body metabolic function, hourly trajectories of energetic parameters were captured over 60 h (D, dark phase; L, light phase). Distinctive diurnal patterns of RER, defined as the ratio of VCO2 / VO2, were observed in mice on TRF8, TRF4, CR, and CRx2 vs. AL-fed controls (Figure 2D). Minimal fluctuations of RER between the dark and light cycles were observed in AL-fed female mice following a 17-week intervention, whereas switching diet to TRF8, TRF4 and CR led to large RER fluctuations upon feeding at 8:30 AM (arrow), consistent with metabolic flexibility and preferential use of carbohydrates (RER ~1.0) in the fed state before slowly returning to postprandial fatty acid oxidation as primary fuel source (RER ~0.70–0.75) (Figure 2D, left panels). Since CRx2 mice consumed two mini-meals at 8:30 AM and 4:30 PM, we noticed smaller RER amplitudes and shorter duration of carbohydrate fuel utilization compared to mice on CR [AUC (95%CI), CRx2 peak 1: 4.77 (4.22–5.12); peak 2: 5.72 (5.22–6.23) vs. CR single peak: 11.75 (10.97–12.53), p < 0.001] (Figure 2E). Comparable trajectories were observed after 69 weeks of diet switching, although RER amplitudes were smaller and of shorter duration (Figure 2D, right panels) despite having AL and TRF mice consuming more food as they got older vs. CR and CRx2 animals. The fluctuation in circadian RER in mice on AL for 69 weeks compared to 17 weeks (130 vs. 78 weeks of age, respectively) may reflect the fact that old females have significantly less body fat than younger ones (Figure 1D, upper panel) and, therefore, need to consume more food and increase whole-body CHO oxidation to support energy demand and maintain body temperature. A salient feature of the study was the dramatic age-associated reduction in O2 consumption and CO2 production rates that coincided with the length of intervention, regardless of the feeding regimen (Figures S2A and S2B). Although no differences in the average daily RER values were found among feeding regimens and length of treatment, the metabolic heat generation (EE) was significantly lower after the 17-week intervention period in TRF8, CR, and CRx2 groups compared to AL, and in CRx2 vs. AL after 69 weeks of diet swapping (Figures S2C and S2D). Under these experimental conditions, no effects on locomotor activity were detected (Figures S2E and S2F).
Thus, single-housed mice in metabolic cages exhibited similar eating and metabolic flexibility behaviors as group-housed mice in their home cage.
Survival study and histopathological analysis
Starting CR and CRx2 regimen in middle-aged female mice led to a significant increase in maximum survival compared to AL controls (Figure 3A). The log-rank test evaluating separately CR and TRF interventions revealed a modest effect on median lifespan, ranging from ~2.4 – 4.1% increase vs. AL (Table S2; CR vs. AL, p =0.026; CR vs. TRF8, p =0.016; all other pairwise comparisons did not return statistically significant differences). When all the data were pooled, the change in median lifespan was 3.2%. The average increase in the age at which 90% of the mice have died was only 2%, calculated as the mean of the whole cohort of mice vs. AL. Using the method of Wang and Allison,34 we compared the number of mice in each pairwise comparison that remained alive at the age at which 90% of the mice have died (Table 1). By this test, significant increases in maximum lifespan were observed for CR (q <0.001) and CRx2 (q = 0.0297) vs. AL and CR vs. TRF8 (q <0.001). Thus, late-onset CR and CRx2 regimens caused a small, but significant lifespan extension with late-life effects in female mice.
Figure 3. Survival analysis and histopathological grading of the most prevalent lung diseases at necropsy.
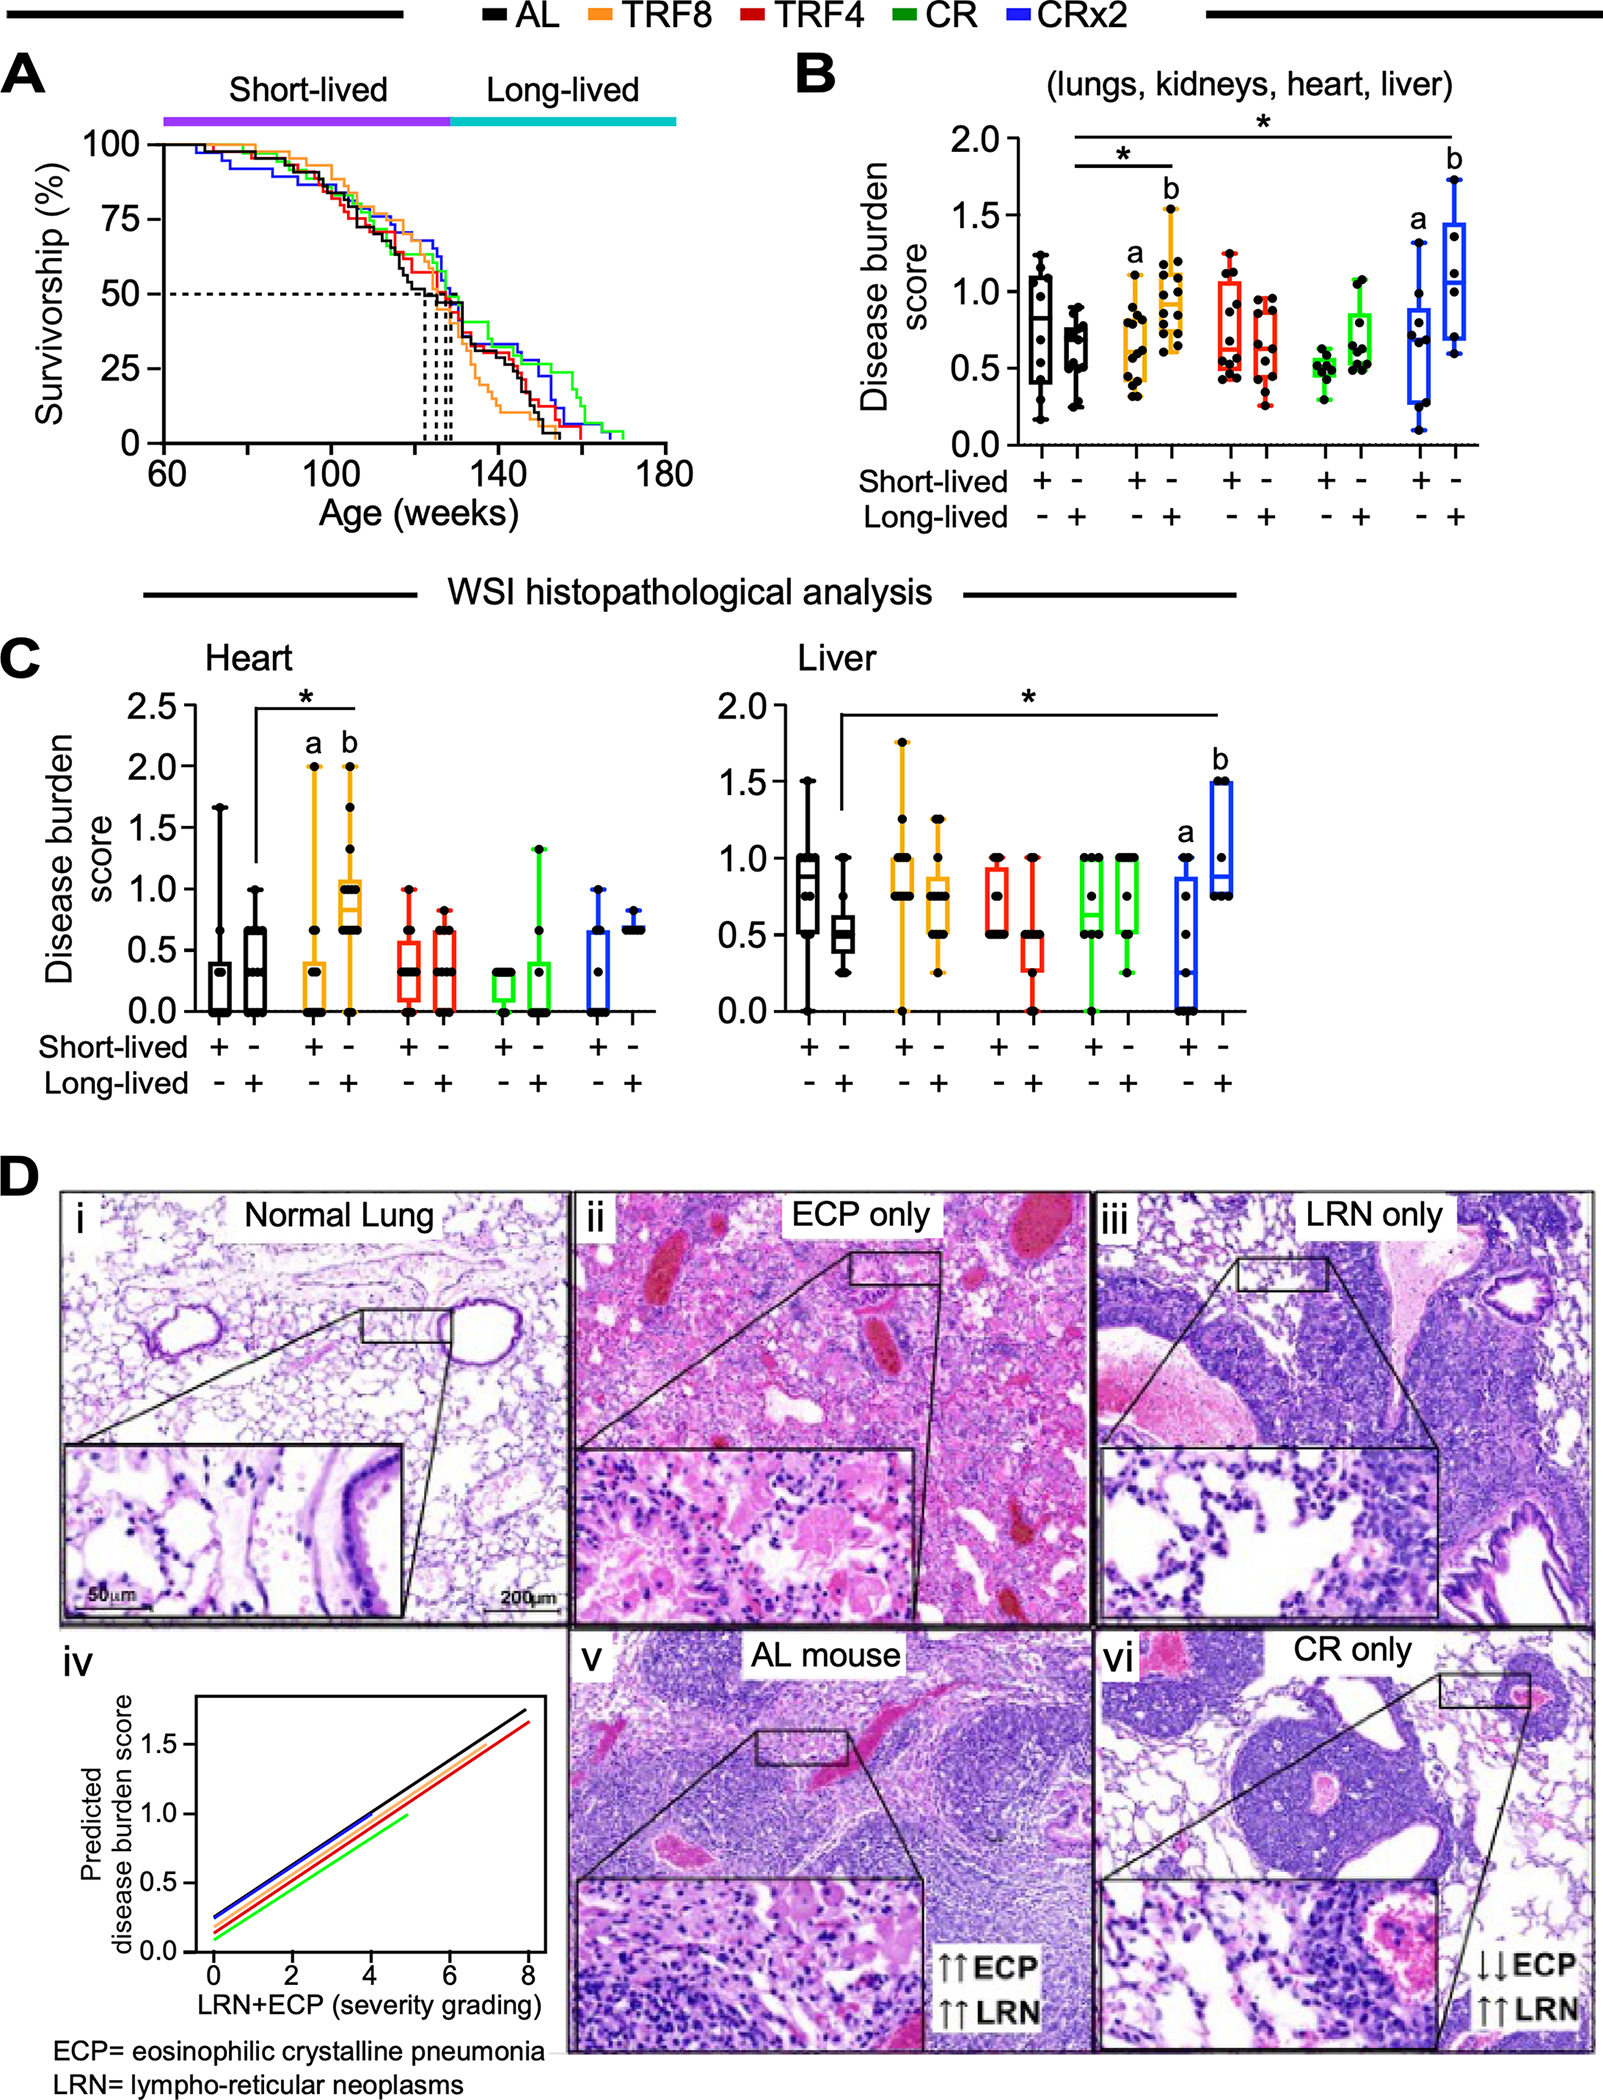
(A) Kaplan-Meier survival curves. Mice that died before the median lifespan of their feeding cohort were labeled as short-lived and those that died after were identified as long-lived. Related to Figure S3A and Table S2.
(B, C) Whole-slide image histopathological analysis depicting the averaged disease burden score in 4 tissues (lungs, kidneys, heart, and liver) (B) and in the heart or liver (C). Two-way ANOVA coupled with Sidak’s post-hoc test was performed to assess the effect of feeding regime, survival (short- vs. long-lived) and their interaction (See Table S1). Data are represented as box and whisker plots, depicting minimum, lower quartile (Q1), median (Q2), upper quartile (Q3) and maximum values. *, p < 0.05. Different letters indicate statistical significance with p < 0.05. Related to Figure S3E.
(D) Representative images of normal lungs (i), lungs with eosinophilic crystalline pneumonia (ECP, ii) and lungs with lympho-reticular neoplasm (LRN, iii). Severity grading of LRN occurring together with ECP under different feeding regimens (iv). The severity of ECP surrounding LRN was significantly higher in AL-fed mice (v) compared to CR mice (vi). Hematoxylin & Eosin staining, scale bar 200 μm, inset 50 μm.
Table 1.
Pairwise maximum lifespan comparisons
| Group Diet 1 | Group Diet 2 | |||||||||
|---|---|---|---|---|---|---|---|---|---|---|
| Comparison [Diet 1 vs. Diet 2] | Percentile 90th Lifespan (P90) | Mice above P90 | Mice below P90 | Proportion | Mice above P90 | Mice below P90 | Proportion | p-value | FDR | Sig. |
| AL vs. CR | 158 | 0 | 43 | 0.00 | 8 | 27 | 0.23 | 0.0000 | 0.0000 | *** |
| AL vs. CRx2 | 153 | 1 | 42 | 0.02 | 8 | 29 | 0.22 | 0.0089 | 0.0297 | * |
| AL vs. TRF4 | 151 | 4 | 39 | 0.09 | 5 | 39 | 0.11 | 0.8526 | 0.8588 | |
| AL vs. TRF8 | 148 | 7 | 36 | 0.16 | 4 | 38 | 0.10 | 0.4234 | 0.5451 | |
| CR vs. CRx2 | 159 | 6 | 29 | 0.17 | 2 | 35 | 0.05 | 0.1556 | 0.2593 | |
| CR vs. TRF4 | 159 | 6 | 29 | 0.17 | 2 | 42 | 0.05 | 0.0905 | 0.1810 | |
| CR vs. TRF8 | 158 | 8 | 27 | 0.23 | 0 | 42 | 0.00 | 0.0000 | 0.0000 | *** |
| CRx2 vs. TRF4 | 154 | 5 | 32 | 0.14 | 5 | 39 | 0.11 | 0.8588 | 0.8588 | |
| CRx2 vs. TRF8 | 153 | 8 | 29 | 0.22 | 2 | 40 | 0.05 | 0.0323 | 0.0808 | |
| TRF4 vs. TRF8 | 150 | 6 | 38 | 0.14 | 3 | 39 | 0.07 | 0.4361 | 0.5451 | |
p-value corresponding to pairwise maximum lifespan comparison was evaluated by the Wang/ Allison method QT3 (coupling quantile regression and Boschloo’s test, two sided).34.
Each mouse within a feeding group was classified as short-lived or long-lived based on its time of death relative to its median lifespan (Figure S3A). Histopathological analyses at death revealed that most mice had at least one neoplasm. Broadly speaking, short-lived animals displayed the highest prevalence of tumors compared to those living longer, regardless of the feeding regimen (Figure S3B). Lympho-reticular neoplasms (LRNs, mostly histiocytic sarcomas and lymphomas) were the most represented malignancies among all groups and most prevalent probable cause of death observed, with short-lived CR mice displaying the highest rate of histiocytic sarcoma and the lowest rate of lymphoma (n=11 and 0 incidence in 15 mice, respectively). AL mice exhibited the highest repertoire of neoplastic lesions, including carcinomas of different organs. Compared to short-lived mice, those who lived longer had a higher frequency of non-neoplastic disease at the time of death independent of the feeding regimen (Figure S3C), in agreement with previous findings in male mice.1 Overall, neoplastic diseases were the most prevalent probable cause of death in all groups, leading to shorter survival than non-neoplastic disease causes (Figure S3D).
In-depth descriptive and semi-quantitative analyses of the necropsy whole slide images (WSI) of heart, lung, liver, and kidney led to the definition of the organ disease burden score in each mouse, defined as the quantitative measurement of all the histopathological lesions observed in each of those organs. The grading system adopted to determine the organ disease burden score was an adaptation of the Geropathology grading system for aging mouse studies35 proposed by the NIA-sponsored Geropathology Research Network (modifications detailed in Table S3).
Non-statistically significant differences in the type, prevalence, or severity of each pathology in the four organs analyzed (lung, kidney, heart, and liver) were found. The composite disease burden score (combined average score from the four organs) (Figure 3B) and score for individual organs including heart and liver were significantly higher in long-lived TRF8 and CRx2 mice vs. AL controls, respectively, and between long-lived vs. short-lived mice on TRF8 and/or CRx2 (Figure 3C). None of the feeding regimens had any significant effect on the lung’s overall disease burden score while TRF8 led to a higher score in the kidney of long- vs. short-lived mice (Figure S3E). In the lungs, LRNs and eosinophilic crystalline pneumonia (ECP), alone or in combination, were the most prevalent pathologies in this tissue, regardless of the feeding paradigm. Even though there was no statistical difference among the groups in the prevalence or severity of these pathologies considered as single entities, interestingly, when assessed in association, CR mice displayed the least severe forms of ECP associated with LRN and overall lung impairment compared to AL mice (Figure 3D). These results suggest that, even when started at midlife, CR intervention can reduce malignant neoplasm progression and the severity of the inflammatory diseases in the lung.
Metabolomics analysis reveals distinct signatures between the serum of TRF and CR mice
To investigate whether differences in healthspan metrics between the experimental groups correlate with metabolic remodeling, we performed untargeted serum metabolomics from mice fed for 26 weeks (87 weeks of age) in their respective regimen. Both CR and TRF groups were fasted overnight during their active phase (4:30 pm to 8:30 am) while AL mice remained fully fed.
Univariate analysis returned more than 300 metabolites significantly impacted between the five experimental groups, of which 234 had HMDB identifiers. Clustering analysis using heatmap visualization of averaged group intensities indicated feeding regimen-dependent signatures (Figure S4A). Partial least squares discriminant analysis (PLS-DA) showed clear group separation with significant overlap between TRF4 and TRF8 as well as CR and CRx2 (Figure 4A). A heatmap of the top 25 metabolites responsible for the group effects (q-value < 0.05) revealed 12 and 13 metabolites having decreased and increased levels, respectively, in response to TRF and CR vs. AL-fed controls (Figure 4B, Table S4). The former group of metabolites consisted mostly of xenobiotics (brown arrows), largely from food components, and amino acids (dark blue arrows), while the latter group comprised various lipid species, including ketone bodies and saturated/unsaturated fatty acids (light blue arrows). The complete list of significant metabolites with associated q-values and their super-pathways can be found in Data S1 – Source Data.
Figure 4. Untargeted metabolomics revealed unique signature of CR from serum of female mice after 26 weeks of diet switching.
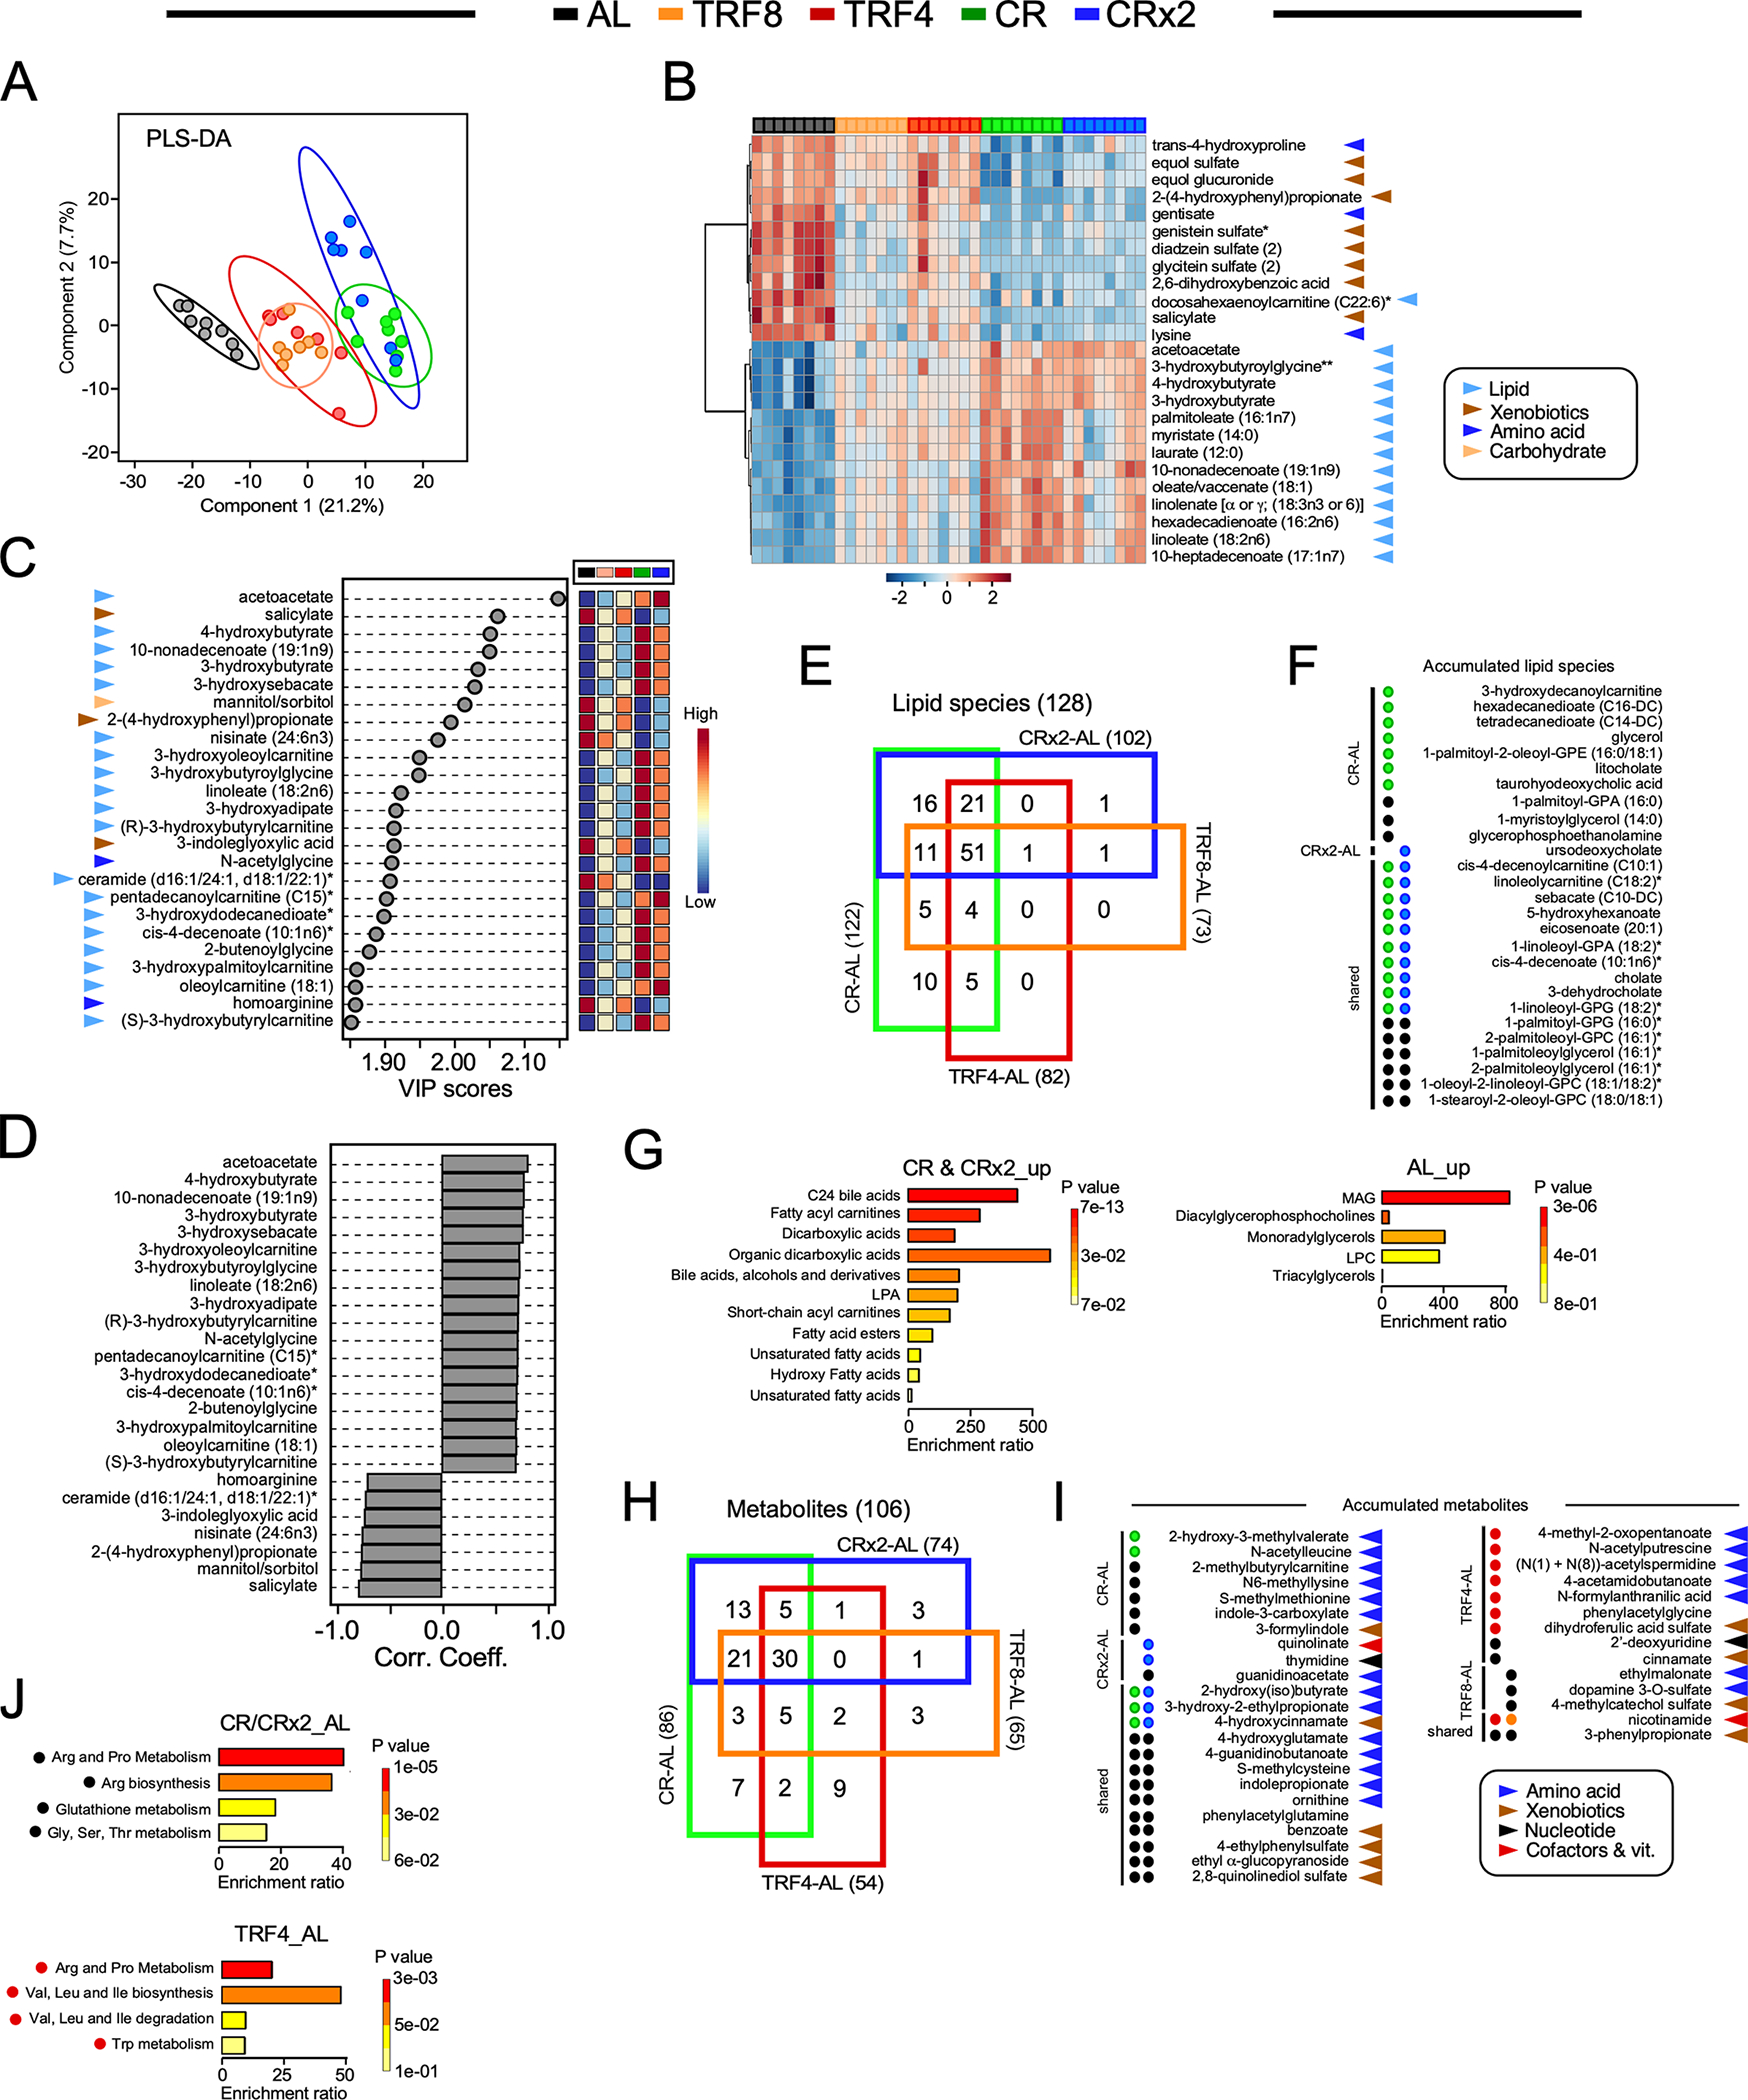
(A) Partial Least Square Determinant Analysis (PLS-DA) represented as 2D plots. The ellipses correspond to 95% confidence intervals for a normal distribution. AL, n=8; TRF8, n=7; TRF4, n=7; CR, n=8; CRx2, n=8.
(B) Heatmap depicting normalized values of the top 25 features identified by one-way ANOVA and post-hoc test analysis in each animal. The direction (positive or negative) and strength (color intensity) of expression are coded red and blue, respectively, and normalized between 2 and −2 according to the scale bar on the bottom.
(C) Variable importance in projection (VIP) scores of the top 25 serum metabolites responsible for feeding regimen-dependent metabolic differences. The colored boxes on the right indicate the relative concentrations of the corresponding metabolite in each group under study.
(D) Correlation coefficients of the top 25 serum molecules that correlated positively and negatively regardless of the feeding regimen.
(E) 4-way Venn diagram of the 128 lipid species with HMDB identifiers that were significantly impacted by the indicated pairwise comparisons.
(F) Significant accumulation of serum lipid species restricted to CR (green circles, n=7/10) vs. AL (black circles, 3/10) and CRx2 (blue circle, n=1/1) vs. AL (0/1), or; shared by CR and CRx2 regimens (n=10/16) vs. AL (n=6/16). There was no accumulation of lipid species restricted to TRF4-AL, TRF8-AL, or shared by both TRF regimens vs. AL.
(G) Enrichment analysis of the 18 lipid species accumulated in response to the two CR regimens vs. AL (left panel) and the 9 lipid molecules selectively elevated with AL (right panel). See the list in (F).
(H) 4-way Venn diagrams of the 106 serum metabolites with HMDB identifiers in the indicated pairwise comparisons. </p/> (I) Significant accumulation of serum metabolites restricted to CR (n=2/7) vs. AL (5/7); CRx2 (n=2/3) vs. AL (1/3); shared by CR & CRx2 (n=3/13) vs. AL (n=10/13); TRF4 (red circles, n=7/9) vs. AL (n=2/9); TRF8 (orange circles, n=0/3) vs. AL (n=3/3); and shared by TRF4 & TRF8 (n=1/2) vs. AL (n=1/2). </p/> (J) Enrichment analysis of the 16 metabolites depleted in the CR-AL and CRx2-AL pairwise comparisons (top panel) and of the 7 compounds accumulated with TRF4 vs. AL (bottom panel). See the list in (I). Table S4 provides the complete list of chemical compounds and p-value (−log10) used to generate panels F and I.
(B, C, I) Arrowheads indicate the metabolic super-pathway each metabolic species belongs to: Lipids, light blue; xenobiotics, brown; amino acid, dark blue; carbohydrate, light orange; nucleotide, black; cofactors & vitamins, red.
From PLS-DA, the main metabolites responsible for group separation were analyzed by variable importance in projection (VIP), producing scores that rank the importance of the top 25 individual metabolites in distinguishing among feeding regimens (Figure 4C). Of these, lipid species were the predominant organic chemicals (19) followed by xenobiotics (3). Strong positive correlation among lipid species was observed with concurrent inverse relationship with ceramides, carbohydrates (mannitol/sorbitol) and xenobiotics (Figure 4D). This pattern is consistent with the fact that during fasting, less food components (xenobiotics) are consumed while lipids, and to a lesser extent amino acids, are utilized as substrates by different organs. Comparatively, TRF interventions did not elicit strong patterns of change as compared to CR and CRx2 (Figures 4B and 4C), suggesting that the response was specific to the amounts of calories ingested. Indeed, the initial analysis revealed that heatmaps of hierarchically clustered metabolites and lipid species from serum significantly changed across feeding regimen vs. AL (Figure S4B). For example, the abundance of some metabolites and lipids was either impacted by both TRF and CR (e.g., acetoacetate, malonate) or responsive to a specific feeding regimen (Figure S4C).
Using four-way Venn diagrams, we identified lipid species with HMDB identifiers that were shared or unique between the four feeding regimens vs. AL. No lipid species were found exclusively in either the TRF4-AL or TRF8-AL pairwise comparison or shared between ‘TRF4 and TRF8’ vs. AL in contrast to the accumulation of 10, 1 and 16 lipid molecules restricted in the CR-AL, CRx2-AL, and ‘CR and CRx2’ vs. AL pairwise comparisons (Figure 4E). The directionality and statistical significance of the observed differences in the accumulated lipid species between treatment groups are shown (Figure 4F, Table S5). Using these 27 metabolites (10+1+16) as input for the enrichment analysis module of MetaboAnalyst (version 5.0), notable differences were detected between the lipid classes impacted by CR and CRx2 (e.g., bile acids, fatty acylcarnitines, dicarboxylic acids) and AL (e.g., monoacylglycerols, glycerophospholipids) (Figure 4G). The same approach was then used to identify metabolites (other than lipids) that were shared or unique between the four feeding regimens vs. AL (Figures 4H–I and Table S5). The effects of either CR (2/7), CRx2 (2/3), or shared between CR and CRx2 (3/13) vs. AL on the abundance of unique metabolites were modest, whereas more than 7 metabolites (out of 9) were uniquely enriched in the TRF4-AL comparison, none with TRF8 (0/3) and one shared between TRF4 and TRF8 (1/2) vs. AL (Figure 4I). Chemically modified amino acids, including methylation, acetylation and hydroxylation accounted for a large proportion of their abundance. Enrichment analysis revealed a preponderance of pathways related to the metabolism of ‘Arg & Pro’, glutathione and ‘Gly, Ser, Thr’ in response to AL vs. CR and CRx2, whereas TRF4 elicited enrichment of pathways related to ‘Arg & Pro’ and Trp metabolism as well as the biosynthesis/degradation of Val, Leu, and Ile (Figure 4J). These results suggest that the serum metabolomics signature of CR differs from TRF when compared to AL.
A similar analytical approach was utilized to directly evaluate the different adaptations of the CR and TRF groups to fasting phases (e.g., CR vs. TRF4 and CRx2 vs. TRF8; fasting periods of 20 h and 16 h, respectively) and the impact of varying length of fasting when consuming the same amount of food (e.g., TRF4 vs. TRF8 and CR vs. CRx2). Four-way Venn diagrams revealed unique metabolites for each pairwise comparison. More than 18 lipids for both CR-TRF4 and CRx2-TRF8 and only 1 and 4 lipids for TRF4-TRF8 and CR-CRx2, respectively, were found (Figure 5A). The directionality and statistical significance of the observed differences in the accumulated lipid species between treatment groups are shown (Figure 5B, Table S5). Enrichment analysis confirmed the striking difference in the lipid signatures between CR and TRF4 (Figure 5C) and between CRx2 and TRF8 (Figure 5D). Both CR regimens were associated with increased abundance of lipids that can be metabolized for energy (e.g., bile acids, dicarboxylic acids, saturated/unsaturated fatty acids, acylcarnitines) while TRFs led to the increased glycerophospholipids, monoacylglycerols, ceramides, and some acylcarnitines. Subsequently, unique metabolites (other than lipids) were identified from these 4 pairwise comparisons, providing 11 and 5 compounds for CR-TRF4 and CRx2-TRF8, respectively, as well as 5 and 3 metabolites for TRF4-TRF8 and CR-CRx2 (Figure 5E). Once again, chemically modified amino acids accounted for a large proportion of abundant metabolites in the CR-TRF4 comparison, whereas xenobiotics, nicotinamide, and γ- and β-tocopherols were among the metabolites upregulated in CRx2 vs. TRF8 (Figure 5F and Table S5). Enrichment analysis indicated a modest increase in ‘Arg and Pro’ and ‘Gly-Ser-Thr’ metabolism in response to TRF4 vs. CR (Figure 5G). Together, these data suggest that after long-term exposure to CR and TRF, the animals react and adapt differently to fasting stimuli in relation to the serum metabolome due to their distinct degree of calorie restriction (Figure 5H). Moreover, AL and TRF appeared to remodel glycerophospholipid and sphingolipid metabolism to a far greater extent than CR. This study provides a comprehensive view of the impact of feeding intervention and daily periods of fasting on the circulating metabolome.
Figure 5. Identification of unique metabolomics signature in response to the feeding regimen.
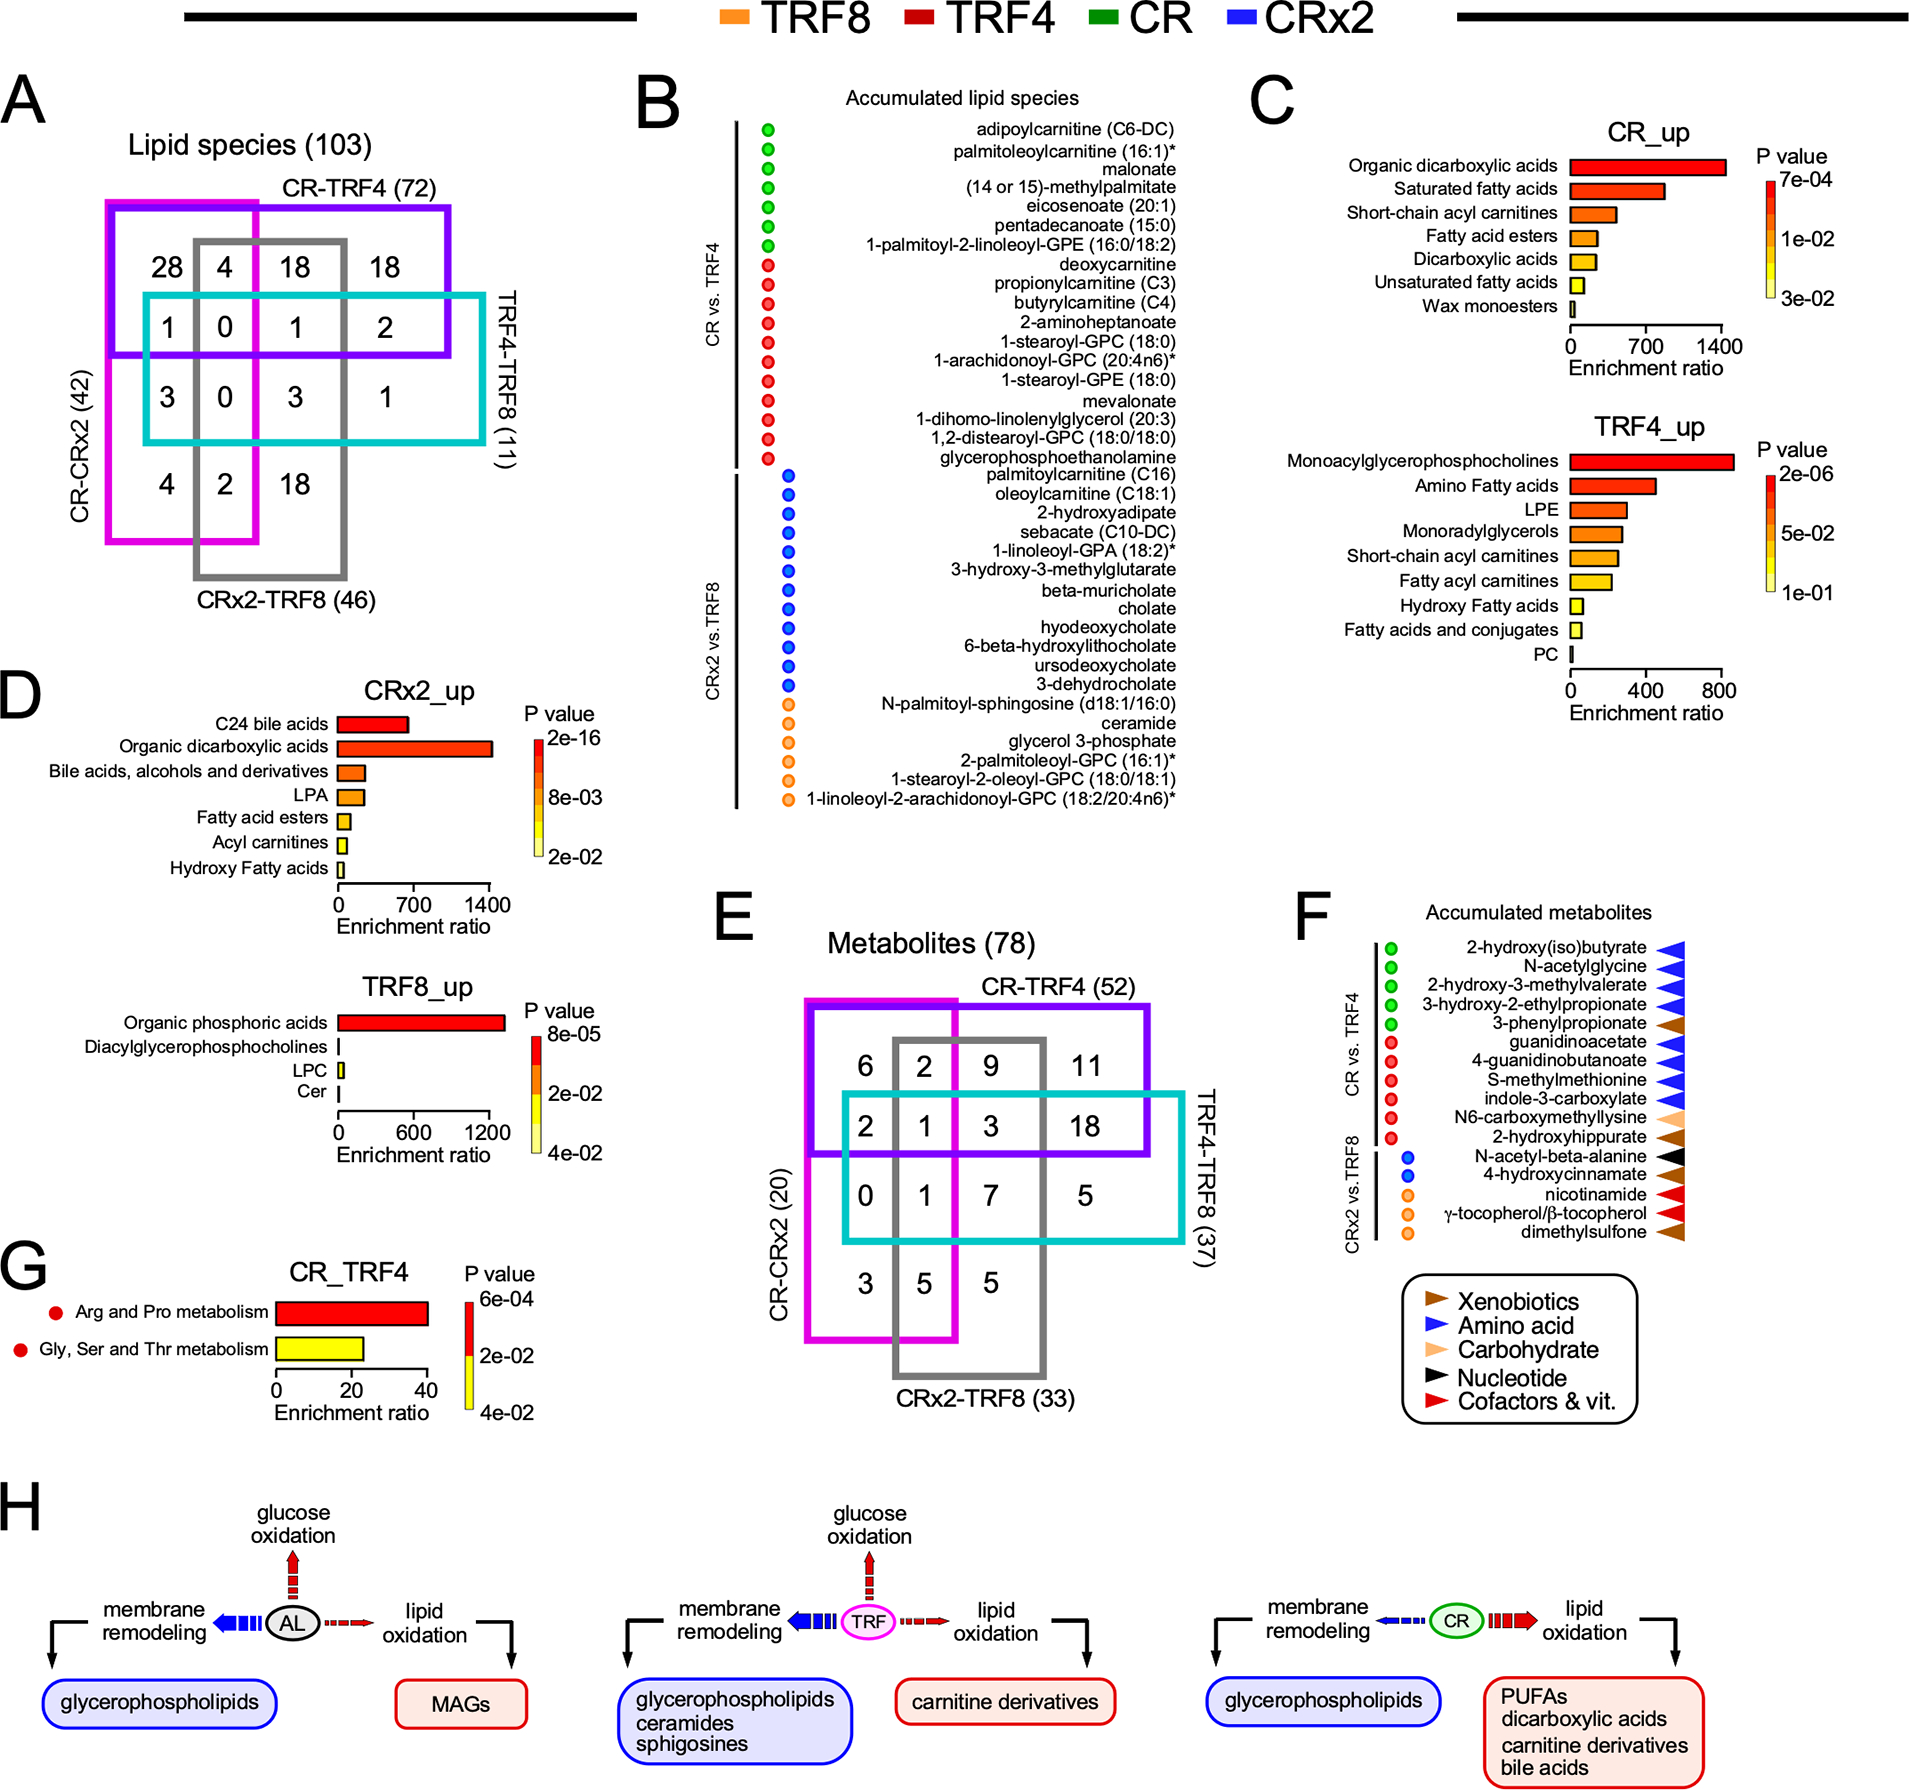
(A) 4-way Venn diagram of the 103 lipid species with HMDB identifiers that were significantly impacted in the indicated pairwise comparisons.
(B) Significant accumulation of serum lipid species restricted to CR (green circles, n=7/18) vs. TRF4 (red circles, 11/18), and CRx2 (blue circles, n=12/18) vs. TRF8 (orange circles, n=6/18).
(C) Enrichment analysis of the lipid species accumulated in response to CR (top panel) vs. TRF4 (bottom panel). See the list in (B).
(D) Enrichment analysis of the lipid species accumulated in response to CRx2 (top panel) vs. TRF8 (bottom panel). See the list in (B).
(E) 4-way Venn diagrams of the 78 serum metabolites with HMDB identifiers that were significantly impacted in the indicated pairwise comparisons.
(F) Significant accumulation of serum metabolites found only in CR (n=5/11) vs. TRF4 (6/11), and CRx2 (n=2/5) vs. TRF8 (3/5).
(G) Enrichment analysis of metabolites depleted in CR vs. TRF4. See the list in (F).
(H) Diagram depicting broadly the different lipid metabolic signatures in serum of mice fed AL, TRF and CR.
Table S4 provides the complete list of chemical compounds and p-value (−log10) used to generate panels B and F.
Systemic impact of nutritional interventions and their metabolic signatures from covariation of metabolites with energetics and healthspan metrics
To assess the systemic impact of CR and TRF nutritional interventions on the energetic cost of maintaining health and, ultimately, survival, firstly, we determined the strength of the links between metabolites and phenotypic outcomes using correlation matrices; secondly, we generated global polar heat maps depicting hierarchical clustering of z-normalized serum metabolome signatures from nutritional interventions, energetics and frailty index (FI), and thirdly, we quantified by principal component analysis (PCA) the relative impact of nutritional intervention vs. AL regimen as well as their degree depending upon modality, i.e., CR, CRx2, TRF4, TRF8.
Correlation matrices between serum metabolome signatures and % energy intake (Figure 1C), momentum impact energy, and musculoskeletal, integumentary, and ear/eye/nasal components of the frailty index (FI) (Figures 1H–J) were performed (Figure 6A–D). Compared to TRF (namely TRF4), CR was the most distinctively impactful intervention producing a metabolic signature comprised of readily available lipidic sources of energy (e.g., carnitines, PUFAs, dicarboxylic) rather than membrane remodeling species (e.g., glycerophospholipids, sphingosines (Figures 4B, 4H). Therefore, we correlated the shared metabolic signature between CR-CRx2 and TRF4-TRF8 comprised of 15 up-modulated metabolites (Figure 4B) with the abovementioned physiological metrics (Figure 6A–D).
Figure 6. Integrated interpretation of various data sets that includes functional signatures of physiological and metabolic outcomes.
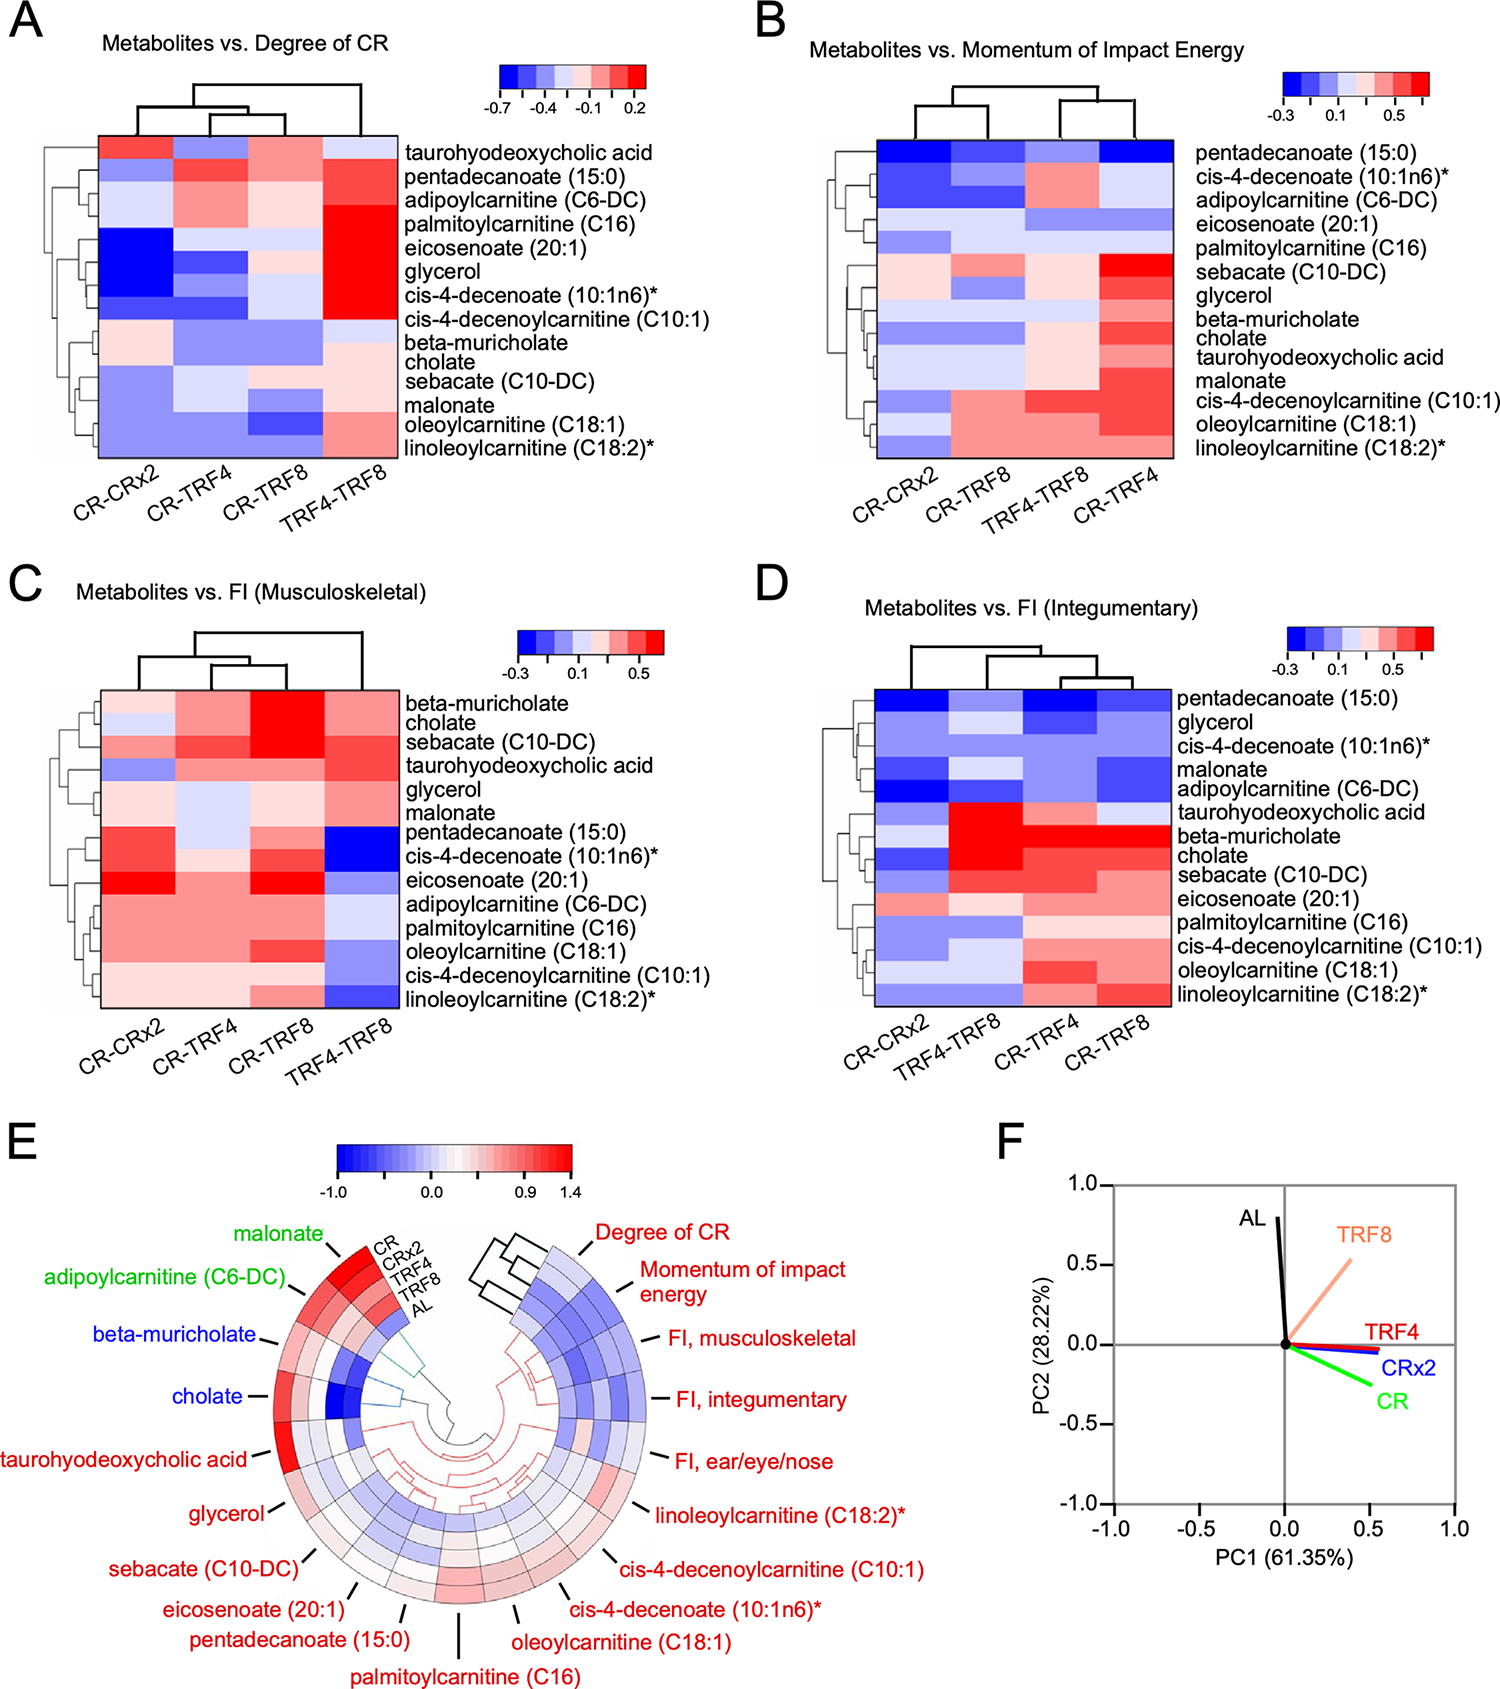
(A-D) Heatmaps of hierarchically clustered correlation coefficients of significantly changed 14 metabolites vs degree of CR (i.e., energy intake, Fig. 1C) (A); momentum impact energy [kg * m/sec] (B); and frailty index (FI) components such as musculoskeletal (C) and integumentary (D), within each group of nutritional interventions. Correlation patterns were determined from Pearson correlation coefficients, r (p<0.05), for each of the serum 14 metabolites vs. each physiological metric displayed in panels A-D. The type (positive or negative) and strength (color intensity) of correlation are coded brown and blue, respectively, according to the bar on the top, right of each heatmap.
(E) Polar heatmap depicting hierarchical clustering with circular dendrogram. The pseudocolor scale in the bar on top of the panel denotes low (blue) and high (red) values with respect to the average of each column’s values.
(F) Principal component analysis (PCA) of z-score normalized physiological and serum metabolomics data based on average values from the 5 experimental groups. In the PCA plot displayed are the eigenvectors of the correlation matrix. Physiological functional outcomes and serum metabolome signatures reflect the impact of nutritional interventions and their type as the major and second principal components, respectively, of groups’ separation.
Related to Figure S5.
The negative correlation of most lipids in the metabolic signature of CR-CRx2 indicates that the higher the degree of CR the higher the % reduction in energy intake (Figure 1C) resulting in higher metabolic dependence upon lipid oxidation thus explaining their decreased levels in serum (Figure 6A, first column). The fact that CR coupled with TRF4 or TRF8 only slightly changed the correlation pattern, although enough to cluster separately CR-CRx2 from CR-TRF4 and CR-TRF8 intervention couples, indicates that the CR’s signature metabolome dominates over the TRF interventions when the degree of CR increases. This is further supported by the distinct correlation pattern exhibited by the metabolome signature corresponding to the TRF4-TRF8 couple (Figure 6A, last column).
A similar interpretation applies to ‘momentum energy impact’ where again a negative correlation pattern of lipidic metabolites abundance happens in the CR-CRx2 nutritional interventions vs. the momentum energy (Figure 6B, first column). Since momentum impact energy equals the product of mass (kg) * gravity (9.8 m/s2) * time hanging (sec), the higher the time a mouse hangs the higher the energy impact momentum along with the dependence of energy metabolism on lipids oxidation thus again explaining the general metabolome’s negative correlation pattern exhibited by the CR-CRx2 interventions (Figure 6B).
Unlike energy intake and momentum energy impact, the musculoskeletal (Figure 6C) and ear/eye /nasal FI (Figure S5A) components exhibit distinct positive correlation patterns as revealed by increased abundance of metabolites from the serum metabolome signature, mostly dominated by the CR-CRx2 interventions as compared to TRF4 and TRF8. In stark contrast, the FI integumentary component (Figure 6D) displayed an opposite negative correlation pattern that unlike the other FI components was dominated by TRF rather than CR interventions.
Polar heat map with hierarchical clustering representation (Figure 6E) and PCA (Figure 6F) of the ensemble of physiological and metabolic variables from all five groups, revealed the PC1 with 61% of the variation as given by AL whereas PC2 with 28% corresponding to the contribution of the type of intervention, i.e., CR, CRx2, TRF4, and TRF8 (Figure 6F). This result is in agreement with the metabolomics analyses (Figures 4, 5) and with the clustering of the interventions in the polar heat map (Figure 6E) while, it helps to discriminate the underlying responsible physiological and serum metabolome variables (Figure 6E, F).
In sum, the correlation patterns of the two energy-related physiological outcomes agree with the expected negative correlation pattern of metabolic lipids signature in the CR-CRx2 interventions where a shift from glucose to lipids metabolism happens.19 Unlike the CR-CRx2 interventions, TRF4 and TRF8 show a positive correlation pattern of lipid abundance in serum implying that in those treatments mice are less dependent on lipids due to an incomplete shift in energy substrates from glucose to lipids under our experimental conditions. It remains intriguing the resemblance of the negative correlation pattern exhibited by the integumentary component of FI as compared to energy-related physiological metrics. Taken together, the correspondence between the metabolomic analyses displayed in Figures 4 and 5 and the results obtained with the integration of physiological and metabolic variables support the notion of a differential systemic impact of CR vs. TRF, consistent with underlying molecular and physiological processes responsible for the salutary effects of CR.
DISCUSSION
In the present study, we sought to investigate and compare the effects of lifelong CR and TRF initiated at 61 weeks of age in female C57BL/6J mice on several health and metabolic metrics together with detailed histopathology at death, assessment of overall survival, and metabolomics analysis in serum samples. Covariation in patterns of serum metabolites with energetics and healthspan metrics was also examined to provide insights into the influence of these interventions on geroprotection. While male mice have been the focus of most studies aiming at assessing the metabolic and survival benefits of CR in aging research, we directed our attention to female mice. Admittedly, dysregulation of lipid and glucose homeostasis in old female mice, as shown by elevated fasting insulin and insulin resistance,36 could contribute to potential sex differences in response to lifelong nutritional interventions such as CR and TRF.
The study design is based on our previous findings showing that male mice fed a regular diet with 30% fewer calories during daytime consumed their food within 1–5 h followed by a long period of fasting (19–23 h). Although the feeding and fasting periods were misaligned in this nocturnal animal model, significant beneficial effects on health and survival were observed.1 We aimed to understand whether the short duration of feeding times in CR vs. free access to food during the same amount of time on TRF could lead to comparable health and survival benefits. Additionally, two arms of the study were introduced with the daily CR portion given in two allotments during an 8-h window (CRx2) vs. free access to food for 8 h (TRF8). Thus, we wanted to tease out the contribution of daily fasting periods alone or combined with calorie restriction in old female mice, an underrepresented cohort in rodent studies.
Earlier work from our lab had also shown that starting daytime feeding with CR in female C57BL/6J mice at 26 weeks of age led to a significant increase in mean and maximum lifespan when fed 20% but not 40% CR as compared to AL.19 However, the daily amount of food consumed by the AL group was assumed to be constant across the lifespan, which we show here to be likely incorrect. TRF in this study, as with other rodent studies, indicates that the time animals are allowed to eat is limited, but the amount of food provided during that time is not restricted. Under this dietary regimen, the amount that animals eat compared to AL will likely vary depending on sex, strain, diet provided, and other factors. Both TRF groups started with ~20% calorie restriction, closely matching the 20% CR groups by design, with TRF mice being self-restricted while calorie restriction was imposed on CR animals. Unexpectedly, by 25 weeks both AL and TRF mice gradually increased food intake, resulting in an overall 15% reduction in caloric intake in TRF mice throughout the experiment. Therefore, we surmise that a progressive increase in the degree of restriction may have inadvertently occurred in the CR groups, resulting in differential effects on healthspan and longevity. We cannot discount the possibility that maintaining mice on 20% CR adjusted relative to changes in AL feeding throughout old age would confer greater health benefits and longer lifespans than the current groups of CR animals. Although chronic 15% CR promotes healthy aging in male C57BL/6NCrl mice,37 these authors did not assess the consequences of long-term 15% CR in female mice across lifespan, highlighting again the potential sex and strain differences in the phenotypic, metabolic and survival response to CR.
Fasting periods between meals contribute to the health/longevity benefits of CR.38 In this study, mice fed 20% CR were under conditions of self-imposed TRF with an extended fasting period throughout life and showed improvement in lifespan and other health metrics even under circadian misalignment (i.e., daytime feeding and nighttime fasting). In contrast, TRF animals began with a similar extent of food restriction (~18%) but after ~6 months on this feeding regimen steadily increased their daily caloric intake nearly to the same levels as AL mice, resulting in minimal effects on health without lifespan benefits. Although an imposed window of 4–8-h TRF did not increase lifespan, a self-imposed fasting period driven by providing a single meal daily without time restriction did result in lifespan benefits,1 indicating that additional factors such as sex, age of onset, and/or circadian misalignment may have contributed to these divergent results. Interestingly, the recent study from Takahashi’s group showed that the lifespan of male C57BL/6J mice increased equally with fasting in combination with 30% CR vs. AL controls independent of whether mice were fed during the day or night, although under those conditions, fasting combined with misaligned (daytime) or aligned (nighttime) feeding led to a 20% and 35% median lifespan increase vs. AL, respectively.25 We acknowledge that long-term feeding during the rest phase constitutes a challenge for mice, suggesting that circadian alignment of feeding and fasting periods might promote the optimal effect of CR compared to TRF.
The TRF and CR interventions were initiated at 61 weeks of age when the animal is more susceptible to functional decline39,40 and shows heightened vulnerability to stress.41,42 The modest impact of CR observed in this study may stem from the fact that for most species the benefits of CR on lifespan are less pronounced when initiated later in life. Consistent with this, we observed significant improvements in momentum impact energy and frailty index score, but not balance and coordination, in response to CR while TRF showed no effect. The segregation of each mouse as either short- or long-lived, based on the time of death relative to the group’s median lifespan, revealed higher prevalence of tumors in the former group than in the latter and vice versa for non-neoplastic disease, regardless of the feeding intervention. Sluggish changes in resilience and phenotypic networks associated with aging43 may give rise to a different signature of functional outcomes, disease pattern at death, and longevity in older mice on CR and TRF compared to younger animals. Additional work is needed to ascertain whether introducing these feeding regimens in younger mice may offer better protection and delay the onset of malignancies and non-neoplastic diseases.
With age, all groups of animals are losing weight, particularly body fat. As laboratory mice are generally housed at sub-thermoneutral temperatures, maintenance of body temperature accounts for a large proportion of their energy expenditure. This is more pronounced when animals are individually housed, as they are during metabolic cage experiments.44 Indeed, the conditions under which metabolic chamber analysis was done differs from that of the animals in home cages, which may impact their metabolic state. This provides an explanation for why older animals show greater BW loss during these experiments and the impaired ability to consume more food in response to this increased energetic demand likely exacerbates these effects.45 After an overnight fast, both the TRF and CR animals exhibited similar metabolic flexibility in response to their access to food, with preferential utilization of CHO upon feeding (8:30 am) and progressive return to lipid oxidation. This pattern was noticeably absent in AL mice which had access to food around the clock, eating largely at night and nibbling bits of food during the resting period.
A direct comparison of the serum metabolome from fasted TRF and CR groups revealed the presence of a differential metabolite-based signature comprising lipids and metabolites (other than lipids). CR remodels metabolism, as reflected by a significant increase in circulating lipids associated with the expression/activity of energy-related metabolic pathways (e.g., bile acids, dicarboxylic acids, saturated/unsaturated fatty acids, acylcarnitines). The TRF interventions produced an enhanced serum abundance of glycerophospholipids, monoacylglycerols, and ceramides, lipid metabolites known to decrease insulin sensitivity.46,47 Pairwise comparisons unveiled chemically modified amino acids accounting for the bulk of increased serum metabolite levels (other than lipids) implicated in top ranked central catabolic and redox-related pathways e.g., ‘Gly-Ser-Thr’, ‘Leu-Ile-Val’, ‘Met-Cys-SAM and taurine’, ‘glutathione’, and ‘Trp metabolism’,48,49 whereas nicotinamide, and γ- and β-tocopherols were among the list of upregulated metabolites with anti-aging, anti-inflammatory and anti-cancer properties.50–54 The integration of physiological and metabolic signatures supports the notion of a differential systemic impact of CR vs. TRF, which is consistent with the underlying molecular and physiological processes responsible for the salutary influence of CR.
In contrast to our aged laboratory female mice, humans consumed less food as they get older.55 This difference in energy intake between the two species as they age is reminiscent of the inverse relationship between the association of FBG with survival for mice vs. humans.39 The gradual increase in food intake both in AL and TRF female mice despite losing weight may indicate malabsorption of nutrients, reduced metabolic efficiency, shift in microbiota composition,56,57 an alteration in body composition, higher resting metabolic rate, and/or loss of cage mates, thus affecting total energy expenditure. Regardless, increased food consumption with age represents an important finding with significant implications in preclinical research. When pharmaceuticals and pharmacological compounds are mixed with food, the bioactive drug concentrations may very well be much higher in old mice as they consume more food and weigh less than younger animals.
Study Limitations
Some limitations of our study must be considered when interpreting the results, including using only C57BL/6j females. Recent studies have demonstrated that the optimum beneficial effects of CR when feeding is synchronized with the dark phase of the circadian cycle,25,30 suggesting that circadian alignment of feeding and fasting periods might improve the effect of CR/TRF compared to ad libitum feeding. This important topic will be the subject of future investigations.
Concluding remarks
Despite abnormal feeding patterns in mice (daytime feeding during the resting state), data integration of phenotypic and serum metabolomic analyses showed greater benefits of CR over TRF, supporting the notion that a moderate reduction in energy intake provides an added value to prolonged daily fasting in term of fitness, in vivo metabolism, and survival. Future studies are needed to determine how alterations in mitochondrial energy metabolism between CR and TRF regimens differentially impact epigenetic changes through modulation of histone/non-histone modification and DNA methylation by supplying critical metabolites such as acetyl-CoA and one-carbon intermediates. Because of the sexually dimorphic response to CR in mice, identifying non-coding RNA molecules,58,59 proteins, and metabolites implicated in core survival pathways in key metabolic tissues would be informative and necessary.
STAR METHODS
RESOURCE AVAILABILITY
Lead Contact —
Further information and requests for resources and reagents should be directed to and will be fulfilled by the Lead Contact, Rafael de Cabo (decabora@mail.nih.gov).
Materials Availability—
This study did not generate new unique reagents.
Data and Code Availability —
The mass spectrometry metabolomics data have been deposited in the MetaboLights database60 with the following accession number MTBLS790 (https://www.ebi.ac.uk/metabolights/MTBLS790). The published article and Supplemental information include datasets used to generate the graphs and figures in the paper (Data S1 – Source Data).
This paper does not report original code.
Any additional information required to reanalyze the data reported in this paper is available from the lead contact upon request.
EXPERIMENTAL MODEL DETAILS
Animals and Husbandry
Female C57BL/6J mice at 48-week of age were purchased from the Jackson Laboratories (Bar Harbor, ME) and were maintained in groups of four animals per cage with free access to a standard chow diet (NIH-31, Teklad Global 18% Protein Extruded Rodent Diet, #2018S, Envigo, Frederick, MD) and drinking water. Low-velocity HEPA filtered air was supplied through sealed shelf plenums directly into the cage through air supply orifices above the cage filter top. Animal rooms were maintained at 22.2 ± 1 °C and 30–70% humidity, with lights on at 7:00 AM (ZT0) and lights off at 7:00 PM (ZT12). Animals were provided shepherd shacks and nestles for enrichment. Mice were inspected twice daily for health issues and veterinary care was provided as needed. Moribund animals were culled, and every animal found dead or euthanized was necropsied. The criteria for euthanasia were based on an independent assessment by a veterinarian according to AAALAC guidelines. Mice were housed in cages of four. When an animal’s cage mate died during the study, animals were not rehoused and, instead, were provided a scientific exception to justify the single housing of a social species. All protocols and experiments were in accordance with and approved by the Animal Care and Use Committee of the National Institute on Aging, NIH, protocol number 277-TGB-2022.
METHOD DETAILS
Dietary Intervention
After 12 weeks of acclimation, mice were randomly assigned to 5 experimental groups (n ~50 per condition) as defined below. Mice were fed with regular NIH-31 chow pellets containing ~4.33 kcal/g, with 18% calories from fat, 24% from protein and 58% kcal from carbohydrates. Food access was controlled by a manually operated 7-day carousel feeder system (Super Mouse 750™ Polycarbonate Cage w/ Carousel Feeder (CF714C) Lab Products, Inc, Seaford, DE) that allows daily access and timing to a pre-measured food portion by turning the carousel (Figure S1A). After one week of recording under ad libitum food access, mice, now at 61 weeks of age, were exposed to their assigned feeding conditions: 24 h access ad libitum (AL); unlimited amount but temporally restricted to 4 h during the light phase (TRF4; 8:30 AM – 12:30 PM); unlimited amount but temporally restricted to 8 h during the light phase (TRF8; 8:30 AM – 4:30 PM); 24 h access but calorically restricted (3 g per day, corresponding to 80% of baseline AL levels) (CR; start at 8:30 AM); and CR portion divided into two mini-meals (CRx2; 1.5 g twice a day given at 8:30 AM and 4:30 PM) (Figure S1B).
Quantification of Consumed Food
The average food intake was determined by monitoring the amount of food eaten per cage. Except for the AL group, no food was found in any of the cages for either the TRF or CR mice. Cages were changed weekly, and while it is possible that a minimal amount of crumbled food remained in the cages after the allotted feeding period, the research staff examined each cage at the end of the feeding cycle and took special care in sifting thru bedding with a comb to recover shredded food at the bottom of each cage, if any.
While the feeding window for the TRF animals is 4 or 8 hours, the actual time that they have direct access to the food is likely more limited as only 1–2 animals can access the food at any given time. However, this does not appear to have a major impact on the ability of the animals to access food as evidenced by the lack of difference in food consumption between TRF4 and TRF8 animals and the ability of animals to increase their food consumption late in life. As such, it seems that the self-imposed restriction in calories at earlier stages of the experiment is more likely linked to the amount of food the animals chose to eat during this limited feeding window.
Food spillage in the cage bottom during feeding and collection of crumbles of food in the cages may somehow blur the length of the fasting window. However, the fact that TRF4 and CR mice have similar body mass and weigh significantly less than AL-fed mice during the first 45-week intervention does not support the notion of TRF mice consuming food outside their feeding window due to food spillage. Mice on CR tend to gorge, a likely compensatory behavior in response to hunger and negative energy balance,61 and a similar ingestive behavior is to be expected from TRF animals. In fact, an average group housed mouse that has ad libitum access to food for only 4 h using the carousel feeder (i.e., TRF4 cohort) may be consuming 15–18% of body weight in food in less than 2 h to account for the limited access to the feeding cup.
Weight and Body Temperature
Mice were weighed the same day every other week and core body temperature was recorded for animals that were microchipped (cat# IPTT-300, Bio Medic Data Systems, Seaford, DE). We used the nonparametric, graphical tool Loess in R and GraphPad Prism version 9.3.1 to generate a smooth line through the BW trajectory plots.
By measuring the trajectory of body weight change of each animal every week as a surrogate for food consumed, we found that most cages had at least one mouse that did not lose weight under TRF and CR regimens compared to 2 mice per cage for the AL group that either maintained or gained weight. Even in the presence of continuous access to food a significant proportion of AL mice (30%) was shedding weight over the span of 25 weeks. Such evidence of heterogeneity within each cage is to be expected as large phenotypic variations among littermates often occur even though environmental variables are well controlled (e.g., food, temperature, husbandry).62
Survival Study
Animals that had died before the start of the feeding regimen were eliminated from the mortality analysis. Mortality during the survival study was assessed using the log-rank test to compare the differences in Kaplan-Meier survival curves. Maximal lifespan was defined as the 10th percentile of mice still alive. The p-value corresponding to pairwise maximum lifespan comparison was evaluated by the method of Wang and Allison,34 using quantile regression coupled with Boschloo’s test, two-sided. Survival curves were generated using the survfit in the “survival” package in R and ggsurvplot functions in the “survminer” package in R. The following animals were censored: Six mice who died before the study started; 25 animals who were sacrificed for tissue collection (104-week-old, 43 weeks on diet; AL=5; TRF4=5; TRF8=5; CR=5; CRx2=5); 2 mice who were culled due to head tilt and whose report was not found (TRF=1, CRx2=1); one due to being misplaced on the report (CR=1); one mouse who had otitis (CRx2=1); 6 mice who were culled due to underlying polyarteritis nodosa (AL=1; TRF4=1; TRF8=2; CRx2=2), and 7 mice whose necropsy reports were not found (AL=1, CR=5; CRx2=1).
Body Composition
A Bruker’s Minispec Whole Body Composition Analyzer LF90 (Bruker Optics, Billerica, MA, USA) was used to evaluate the body composition of unanesthetized mice, measuring body fat, free body fluid, and lean tissue content. Measurements were acquired at baseline and after 9, 30, and 43 weeks on diet, corresponding to mice at 52, 69, 91, and 104 weeks of age, respectively.
Glucose Determination
Concentrations of blood glucose were measured from the submandibular vein of mice after a 6-h fast (7:00 AM-1:00 PM) using the Bayer Breeze2 handheld glucometer (Bayer, Mishawaka, IN).
Oral Glucose Tolerance Test
Following a 16-h overnight fast (4:30 PM – 8:30 AM), mice received a 30% glucose solution (1.5 g/kg glucose by gavage) at 8:30–9:00 AM. Glucose was measured from the tail vein blood using either the Breeze2 glucose meter or Contour Next EZ meter (Bayer) at 0, 15, 30, 60, and 120 min after gavage. The area under the curve (AUC) was generated to compare the levels of circulating glucose among the experimental groups. Test was performed on 78- and 100-week-old mice maintained for 17 and 39 weeks on diet, respectively. Data are presented as mean ± standard deviation (n=6 per group).
In vivo Metabolic Assessment
The metabolic rate of each mouse was assessed by indirect calorimetry in open-circuit Oxymax chambers using the Comprehensive Lab Animal Monitoring System (CLAMS; Columbus Instruments, Columbus, OH, USA). Mice were singly housed with ad libitum access to water and maintained at 20–22°C under a 12:12 h light:dark cycle (light period 7:00 AM–7:00 PM). Food and water level in each chamber was checked once daily at approximately 8:30 AM and the amount of food left in the cage from the previous 24 h of chamber time, if any, was collected and measured. All mice were acclimatized to monitoring cages for 12 h prior to recording. Sample air was dried and passed through an oxygen sensor for determination of oxygen content. Oxygen consumption was determined by measuring oxygen concentration in the air entering the chamber compared with air leaving the chamber. The sensor was calibrated against a standard gas mix containing defined quantities of oxygen, carbon dioxide, and nitrogen. Constant airflow (0.5 L/min) was drawn through the chamber and monitored by a mass-sensitive flow meter. The concentrations of oxygen and carbon dioxide were monitored at the inlet and outlet of the sealed chambers to calculate oxygen consumption. Measurement in each chamber was recorded for 30 s at 30 min intervals for a total of 60 h. Ambulatory activity (both horizontal and vertical) was also monitored by dual-axis detection using infrared photocell technology. Mice at 78- and 130 weeks of age were maintained on their respective diet for 17 and 69 weeks, respectively (n = 6 mice per group).
Physical Performance Tests
Physical performance was measured by cagetop and rotarod tests as detailed.63 In brief, cagetop test was performed by suspending mice upside-down from wire cage hoppers, one meter above a padded cushion. Wire hoppers were held in place and leveled using a custom-built acrylic support structure. Mice were allowed to grip with all four paws and move freely about the hopper, but gentle manual adjustment was used to discourage them from wrapping their tails around the wire. The time from inversion to when the mouse lost its grip was recorded in seconds. Mice rested for 30 min between three consecutive trials, which were used to calculate average latency to fall. A more accurate determination for the latency to fall from the cage top was also carried out by using the momentum of impact energy, which is calculated by multiplying the body weight in kg by gravity (9.8 m/seĉ2) and by the time in seconds to yield kg.m/sec - also known as newton. For the rotarod test, the time to fall from an accelerating rotarod (4–40 rpm over 5 min; Med Associates Inc., Fairfax, VT) was measured with a maximum trial length of 5 min. The average latency to fall from 3 consecutive trials was computed, with 30 min rest between trials. Mice at 78- and 100 weeks of age were maintained on their diet for 17 and 39 weeks, respectively (n = 22–24 mice per group).
Frailty Index
The frailty index is composed of 31 clinical parameters, and was calculated by summing the number of deficits in factors related to integument, physical/musculoskeletal, vestibulocochlear/auditory, ocular/nasal, digestive/urogenital, respiratory, and aspects of physical discomfort for each mouse divided by the total number of possible deficits.32 A higher frailty index, with a potential score ranging from 0 to 1, is associated with lower survivability in mice.33
Procedures for Necropsy and Histopathological Examination
All mice found dead or moribund and euthanized were formalin fixed and examined for a full necropsy by the Division of Veterinary Resources (DVR/NIH, Bethesda, MD). The tissues harvested during the necropsy were processed routinely and stained with hematoxylin-eosin (H&E) for histopathological examination. Whole slide images (WSI) of all available necropsy H&E-stained slides were acquired with a high-resolution Zeiss Axio Scan.Z1 digital slide scanner (Zeiss, Oberkochen, Germany). Histopathological diagnoses were performed according to the INHAND Project (International Harmonization of Nomenclature and Diagnostic Criteria for Lesions in Rats and Mice; https://www.toxpath.org/inhand.asp). Based on the pathological lesions diagnosed on the necropsy reports and probable cause of death assessment, a profile of all neoplastic and non-neoplastic diseases for each mouse was compiled to obtain the percentage of tumor-bearing mice and tumor burden. The probable cause of death for each mouse was determined by the severity of the diseases found at necropsy independently by 4 pathologists blinded to the experimental conditions. When any of the diseases identified were not considered severe enough to be responsible of the death of the mouse, the probable cause of death was categorized as ‘undetermined’. The percentage of tumor-bearing mice was defined as the percentage of mice with neoplastic lesions, regardless of their severity, whereas the tumor burden was defined as the number of different tumor types found in a mouse (e.g., a mouse with histiocytic sarcoma in three different body sites and a pituitary adenoma had a tumor burden of 2). The organ disease burden was defined as the number of total histopathological changes in an organ of individual animal. As the organ sampling is variable from mouse to mouse during a necropsy, the disease burden was evaluated only in the heart, lung, liver, and kidney, the four organs with consistent sampling across necropsies. The grading system adopted to determine the organ disease burden was a modification of the geropathology grading system for aging mouse studies proposed by the Geropathology Research Network35 (see Table S3 for further details).
Serum Metabolomics
Metabolon, Inc. (Research Park Triangle, NC, USA) performed untargeted metabolomic profiling on serum samples from 87-week-old female mice maintained on their respective diet for 26 weeks. Except for the AL group, the other groups of mice had their food removed at 4:30 PM and were then fasted overnight until 8:30 AM for blood collection via submandibular bleeding with a lancet. Metabolite profiles were analyzed using MetaboAnalyst version 5.0,64 utilizing univariate and multivariate built-in analytical methods from modules of this web-based platform, as specified. The curation of the original serum metabolomics data has produced a ranked metabolite list filtered by the FDR ‘Q’ value threshold [e.g., multiple testing correction across all metabolites using the Benjamini-Hochberg procedure]. AL (n = 8), TRF8 (n = 7), TRF4 (n =7), CR (n = 8), and CRx2 (n = 8).
Hierarchically clustered heat maps with dendrograms of correlation patterns of metabolites vs. physiological metrics.
Scatter plot correlation matrices from Origin v. 2022b (Origin Lab Corp., Northampton, MA, USA) were utilized to determine the Pearson correlation coefficient, r (p<0.05), for each of the serum 14 metabolites vs. each physiological metric within each group of nutritional interventions. Correlation coefficients were utilized as input and the groups average clustered.
Polar heat maps with unsupervised hierarchical clustering and principal component analysis of physiological and serum metabolomics variables.
Data were normalized across the five experimental groups and polar heat maps with dendrograms constructed with Origin 2022b using groups average along radius and angle. Principal component analysis was performed with the same input data using the multivariate statistics subroutine of Origin 2022b.
QUANTIFICATION AND STATISTICAL ANALYSIS
Investigators were not blinded to allocation during experiments and outcome assessments. No statistical methods were used to predetermine sample size. The sample sizes were chosen based on previous literature. In each figure caption, the n values for each treatment group have been specified. GraphPad Prism software was used to determine whether data sets passed the D’Agostino & Pearson normality test (α=0.05). Where normality failed, Kruskal-Wallis test was applied. Outliers were identified and removed using the ROUT method65 developed by GraphPad Prism. Unless otherwise indicated, data were expressed as box-and whisker plots, depicting minimum, lower quartile (Q1), median (Q2), upper quartile (Q3) and maximum values, with the difference between feeding interventions evaluated by one-way ANOVA coupled with Dunnett’s post-hoc tests. The comparison between groups was also performed by a two-factor ANOVA coupled with Sidak’s post-hoc tests by considering feeding regimen, time (e.g., short-lived vs. long-lived), and interaction terms, with the p-value for the feeding intervention taken as the key outcome (See Table S1). A p ≤ 0.05 was considered statistically significant. Graphs were generated by GraphPad Prism version 9.3.1 and CanvasX Draw version 7.0.3 software packages.
Statistical Analysis of the Histopathology Data.
For each lesion type, two-way tables were constructed of the lesion score versus feeding pattern. Fisher’s exact test was employed to test if the distribution of the lesion score was the same across all feeding patterns. ANOVAs were used to analyze whether age at necropsy and combined lesion score were associated with the feeding pattern and lesion score for each lesion type. The model initially included an interaction between feeding pattern and lesion score. If not statistically significant, this interaction was removed from the model and significant main effects, when present, are described. Post-hoc multiple comparison methods were used to identify differences between groups for significant terms in the model. Lastly, the lesion score was treated as a numerical variable and linear regression was applied. Again, an interaction was initially included to evaluate whether the slopes of the regression lines were the same for all feeding patterns. As before, this interaction was eliminated if it was not statistically significant.
Supplementary Material
Data S1. Source data underlying all figures and display items. Related to Figures 1–6 and Supplemental Figures 1–5.
Key resources table.
| REAGENT or RESOURCE | SOURCE | IDENTIFIER |
|---|---|---|
| Biological samples | ||
| Mouse serum samples for metabolomics | This paper | n/a |
| Fixed mouse liver tissues | This paper | n/a |
| Fixed mouse lung tissues | This paper | n/a |
| Fixed mouse kidney tissues | This paper | n/a |
| Fixed mouse heart tissues | This paper | n/a |
| Deposited data | ||
| Mass spectrometry metabolomics data | This paper | MTBLS790 |
| Data S1 – Source Data | This paper | Data S1 – Source Data |
| Experimental models: Organisms/strains | ||
| Female C57BL/6J mice | The Jackson Laboratory | JAX 000664 |
| Software and algorithms | ||
| Prism 8.0 | GraphPad | http://www.graphpad.com/scientificsoftware/prism; RRID:SCR_002798 |
| Canvas Draw 7.0.2 | Canvas GFX | RRID:SCR_014288 |
| Microsoft Excel (version 16.63) | Microsoft Corp. |
https://www.microsoft.com/en-gb/; RRID:SCR_016137 |
| MetaboAnalyst (version 5.0) | Web-based resource (McGill University, Canada) |
https://www.metaboanalyst.ca/MetaboAnalyst/faces/home.xhtml |
| R Project for Statistical Computing (version 4.0.2) | R Development Core Team | RRID:SCR_001905; https://scicrunch.org/resolver/SCR_001905 |
| Origin (version 2022b) | Origin Lab Corp. Northampton, MA, USA | RRID:SCR_014212 |
| Other | ||
| NIH-31 diet | Envigo | Cat# 2018S |
| Implantable temperature transponder | Bio Medic Data Systems | Cat# IPTT-300 |
| 7-day carousel feeder | Lab product, LLC | Cat# CF714C |
| Breeze2 Glucometer | Bayer |
http://personalcare.manualsonline.com/ Bayer HealthCare Blood Glucose Meter |
| Contour Next EZ meter | Bayer | https://www.ascensiadiabetes.com/products/contour-next-ez/ |
| Minispec LF90 | Bruker Optics | https://www.bruker.com/products/mr/td-nmr/minispec-lf-series.html |
| Oxymax Open Circuit Indirect Calorimeters | Columbus Instruments | http://www.colinst.com/docs/OxymaxBrochure.pdf |
| Five Lane Rota-Rod for mouse | Med Associates Inc | Cat# ENV-574M |
| High-resolution Zeiss Axio Scan.Z1 slide scanner | Zeiss | https://www.microscopeworld.com/images/Brochures/Zeiss_AxioScanZ1-brochure.pdf |
Highlights.
CR promotes health and survival in old female mice despite circadian misalignment
Old female mice on TRF are hyperphagic and inefficient at maintaining body weight
CR reduces neoplastic incidence and severity of inflammatory diseases in the lung
CR and TRF induce distinct serum metabolomic patterns
Acknowledgments
We are grateful to our Animal Research Support Specialists at NIA and Kelly Government Solutions. Marc Raley, Visual Media Specialist at NIA, for creating the graphical abstract. This work was supported by the Intramural Research Program of the National Institute on Aging/NIH.
Inclusion and Diversity
We support the inclusive, diverse, and equitable conduct of research.
Footnotes
Declaration of interests
The authors declare no competing interests.
ADDITIONAL RESOURCES
Not applicable
Publisher's Disclaimer: This is a PDF file of an unedited manuscript that has been accepted for publication. As a service to our customers we are providing this early version of the manuscript. The manuscript will undergo copyediting, typesetting, and review of the resulting proof before it is published in its final form. Please note that during the production process errors may be discovered which could affect the content, and all legal disclaimers that apply to the journal pertain.
REFERENCES
- 1.Mitchell SJ, Bernier M, Mattison JA, Aon MA, Kaiser TA, Anson RM, Ikeno Y, Anderson RM, Ingram DK, and de Cabo R (2019). Daily Fasting Improves Health and Survival in Male Mice Independent of Diet Composition and Calories. Cell Metab. 29, 221–228.e3. 10.1016/j.cmet.2018.08.011. [DOI] [PMC free article] [PubMed] [Google Scholar]
- 2.Pomatto-Watson LCD, Bodogai M, Bosompra O, Kato J, Wong S, Carpenter M, Duregon E, Chowdhury D, Krishna P, Ng S, et al. (2021). Daily caloric restriction limits tumor growth more effectively than caloric cycling regardless of dietary composition. Nat. Commun. 12, 6201. 10.1038/s41467-021-26431-4. [DOI] [PMC free article] [PubMed] [Google Scholar]
- 3.Green CL, Lamming DW, and Fontana L (2022). Molecular mechanisms of dietary restriction promoting health and longevity. Nat. Rev. Mol. Cell. Biol. 23, 56–73. 10.1038/s41580-021-00411-4. [DOI] [PMC free article] [PubMed] [Google Scholar]
- 4.de Cabo R, and Mattson MP (2019). Effects of Intermittent Fasting on Health, Aging, and Disease. N Engl J Med. 381, 2541–2551. Erratum in: N Engl J Med. (2020). 382, 298 and 978. 10.1056/NEJMra1905136. [DOI] [PubMed] [Google Scholar]
- 5.Longo VD, Di Tano M, Mattson MP, and Guidi N (2021). Intermittent and periodic fasting, longevity, and disease. Nat Aging 1, 47–59. 10.1038/s43587-020-00013-3. [DOI] [PMC free article] [PubMed] [Google Scholar]
- 6.Longo VD, and Panda S (2016). Fasting, Circadian Rhythms, and Time-Restricted Feeding in Healthy Lifespan. Cell Metab. 23, 1048–1059. 10.1016/j.cmet.2016.06.001. [DOI] [PMC free article] [PubMed] [Google Scholar]
- 7.Manoogian ENC, and Panda S (2017). Circadian rhythms, time-restricted feeding, and healthy aging. Ageing Res Rev. 39, 59–67. 10.1016/j.arr.2016.12.006. [DOI] [PMC free article] [PubMed] [Google Scholar]
- 8.Hatori M, Vollmers C, Zarrinpar A, DiTacchio L, Bushong EA, Gill S, Leblanc M, Chaix A, Joens M, Fitzpatrick JA, et al. (2012). Time-restricted feeding without reducing caloric intake prevents metabolic diseases in mice fed a high-fat diet. Cell Metab. 15, 848–860. 10.1016/j.cmet.2012.04.019. [DOI] [PMC free article] [PubMed] [Google Scholar]
- 9.Chaix A, Zarrinpar A, Miu P, and Panda S (2014). Time-restricted feeding is a preventative and therapeutic intervention against diverse nutritional challenges. Cell Metab. 20, 991–1005. 10.1016/j.cmet.2014.11.001. [DOI] [PMC free article] [PubMed] [Google Scholar]
- 10.Hofer SJ, Carmona-Gutierrez D, Mueller MI, and Madeo F (2021). The ups and downs of caloric restriction and fasting: from molecular effects to clinical application. EMBO Mol. Med. 15, e14418. 10.15252/emmm.202114418. [DOI] [PMC free article] [PubMed] [Google Scholar]
- 11.Crose A, Alvear A, Singroy S, Wang Q, Manoogian E, Panda S, Mashek DG, and Chow LS (2021). Time-Restricted Eating Improves Quality of Life Measures in Overweight Humans. Nutrients 13, 1430. 10.3390/nu13051430. [DOI] [PMC free article] [PubMed] [Google Scholar]
- 12.Sutton EF, Beyl R, Early KS, Cefalu WT, Ravussin E, and Peterson CM (2018). Early Time-Restricted Feeding Improves Insulin Sensitivity, Blood Pressure, and Oxidative Stress Even without Weight Loss in Men with Prediabetes. Cell Metab. 27, 1212–1221.e3. 10.1016/j.cmet.2018.04.010. [DOI] [PMC free article] [PubMed] [Google Scholar]
- 13.Acosta-Rodríguez VA, de Groot MHM, Rijo-Ferreira F, Green CB, and Takahashi JS (2017). Mice under Caloric Restriction Self-Impose a Temporal Restriction of Food Intake as Revealed by an Automated Feeder System. Cell Metab. 26, 267–277.e2. 10.1016/j.cmet.2017.06.007. [DOI] [PMC free article] [PubMed] [Google Scholar]
- 14.Velingkaar N, Mezhnina V, Poe A, Makwana K, Tulsian R, and Kondratov RV (2020). Reduced caloric intake and periodic fasting independently contribute to metabolic effects of caloric restriction. Aging Cell 19, e13138. 10.1111/acel.13138. [DOI] [PMC free article] [PubMed] [Google Scholar]
- 15.Deota S, Lin T, Chaix A, Williams A, Le H, Calligaro H, Ramasamy R, Huang L, and Panda S (2023). Diurnal transcriptome landscape of a multi-tissue response to time-restricted feeding in mammals. Cell Metab. 35, 150–165.e4. 10.1016/j.cmet.2022.12.006. [DOI] [PMC free article] [PubMed] [Google Scholar]
- 16.Hempenstall S, Picchio L, Mitchell SE, Speakman JR, and Selman C (2010). The impact of acute caloric restriction on the metabolic phenotype in male C57BL/6 and DBA/2 mice. Mech. Ageing Dev. 131, 111–118. 10.1016/j.mad.2009.12.008. [DOI] [PubMed] [Google Scholar]
- 17.Liao CY, Rikke BA, Johnson TE, Diaz V, and Nelson JF (2010). Genetic variation in the murine lifespan response to dietary restriction: from life extension to life shortening. Aging Cell 9, 92–95. 10.1111/j.1474-9726.2009.00533.x. [DOI] [PMC free article] [PubMed] [Google Scholar]
- 18.Swindell WR (2012). Dietary restriction in rats and mice: a meta-analysis and review of the evidence for genotype-dependent effects on lifespan. Ageing Res. Rev. 11, 254–270. 10.1016/j.arr.2011.12.006. [DOI] [PMC free article] [PubMed] [Google Scholar]
- 19.Mitchell SJ, Madrigal-Matute J, Scheibye-Knudsen M, Fang E, Aon M, González-Reyes JA, Cortassa S, Kaushik S, Gonzalez-Freire M, Patel B, et al. (2016). Effects of Sex, Strain, and Energy Intake on Hallmarks of Aging in Mice. Cell Metab. 23, 1093–1112. 10.1016/j.cmet.2016.05.027. [DOI] [PMC free article] [PubMed] [Google Scholar]
- 20.Ukraintseva S, Arbeev K, Duan M, Akushevich I, Kulminski A, Stallard E, and Yashin A (2021). Decline in biological resilience as key manifestation of aging: Potential mechanisms and role in health and longevity. Mech Ageing Dev. 194, 111418. 10.1016/j.mad.2020.111418. [DOI] [PMC free article] [PubMed] [Google Scholar]
- 21.Yang Y, Smith DL Jr., Keating KD, Allison DB, and Nagy TR (2014). Variations in body weight, food intake and body composition after long-term high-fat diet feeding in C57BL/6J mice. Obesity (Silver Spring) 22, 2147–155. 10.1002/oby.20811. [DOI] [PMC free article] [PubMed] [Google Scholar]
- 22.Mauvais-Jarvis F, Arnold AP, and Reue K (2017). A Guide for the Design of Pre-clinical Studies on Sex Differences in Metabolism. Cell Metab. 25, 1216–1230. 10.1016/j.cmet.2017.04.033. [DOI] [PMC free article] [PubMed] [Google Scholar]
- 23.Casimiro I, Stull ND, Tersey SA, Mirmira RG (2021). Phenotypic sexual dimorphism in response to dietary fat manipulation in C57BL/6J mice. J. Diabetes Complications 35, 107795. 10.1016/j.diacomp.2020.107795. [DOI] [PMC free article] [PubMed] [Google Scholar]
- 24.Hahn O, Drews LF, Nguyen A, Tatsuta T, Gkioni L, Hendrich O, Zhang Q, Langer T, Pletcher S, Wakelam MJO, et al. (2019). A nutritional memory effect counteracts the benefits of dietary restriction in old mice. Nat. Metab. 1, 1059–1073. 10.1038/s42255-019-0121-0. [DOI] [PMC free article] [PubMed] [Google Scholar]
- 25.Acosta-Rodríguez V, Rijo-Ferreira F, Izumo M, Xu P, Wight-Carter M, Green CB, and Takahashi JS (2022). Circadian alignment of early onset caloric restriction promotes longevity in male C57BL/6J mice. Science 376, 1192–1202. 10.1126/science.abk0297. [DOI] [PMC free article] [PubMed] [Google Scholar]
- 26.Ribas-Latre A, and Eckel-Mahan K (2016). Interdependence of nutrient metabolism and the circadian clock system: Importance for metabolic health. Mol Metab. 5, 133–152. 10.1016/j.molmet.2015.12.006. [DOI] [PMC free article] [PubMed] [Google Scholar]
- 27.Zarrinpar A, Chaix A, and Panda S (2016). Daily Eating Patterns and Their Impact on Health and Disease. Trends Endocrinol Metab. 27, 69–83. 10.1016/j.tem.2015.11.007. [DOI] [PMC free article] [PubMed] [Google Scholar]
- 28.Jiang P, and Turek FW (2017). Timing of meals: when is as critical as what and how much. Am J Physiol Endocrinol Metab. 312, E369–E380. 10.1152/ajpendo.00295.2016. [DOI] [PMC free article] [PubMed] [Google Scholar]
- 29.Cedernaes J, Huang W, Ramsey KM, Waldeck N, Cheng L, Marcheva B, Omura C, Kobayashi Y, Peek CB, Levine DC, et al. (2019). Transcriptional Basis for Rhythmic Control of Hunger and Metabolism within the AgRP Neuron. Cell Metab. 29, 1078–1091.e5. 10.1016/j.cmet.2019.01.023. [DOI] [PMC free article] [PubMed] [Google Scholar]
- 30.Acosta-Rodríguez VA, Rijo-Ferreira F, Green CB, and Takahashi JS (2021). Importance of circadian timing for aging and longevity. Nat. Commun. 12, 2862. 10.1038/s41467-021-22922-6. [DOI] [PMC free article] [PubMed] [Google Scholar]
- 31.Koronowski KB, and Sassone-Corsi P (2021). Communicating clocks shape circadian homeostasis. Science 371, eabd0951. 10.1126/science.abd0951. [DOI] [PMC free article] [PubMed] [Google Scholar]
- 32.Palliyaguru DL, Moats JM, Di Germanio C, Bernier M, and de Cabo R (2019). Frailty index as a biomarker of lifespan and healthspan: focus on pharmacological interventions. Mech. Ageing Dev. 180, 42–48. 10.1016/j.mad.2019.03.005. [DOI] [PMC free article] [PubMed] [Google Scholar]
- 33.Kane AE, Hilmer SN, Boyer D, Gavin K, Nines D, Howlett SE, de Cabo R, and Mitchell SJ (2016). Impact of Longevity Interventions on a Validated Mouse Clinical Frailty Index. J. Gerontol. A Biol. Sci. Med. Sci. 71, 333–339. 10.1093/gerona/glu315. [DOI] [PMC free article] [PubMed] [Google Scholar]
- 34.Wang C, Li Q, Redden DT, Weindruch R, and Allison DB (2004). Statistical methods for testing effects on “maximum lifespan”. Mech. Ageing Dev, 125, 629–632. 10.1016/j.mad.2004.07.003. https://doi.org/10.1016.j.mad.2004.07.003 [DOI] [PubMed] [Google Scholar]
- 35.Snyder JM, Snider TA, Ciol MA, Wilkinson JE, Imai DM, Casey KM, Vilches-Moure JG, Pettan-Brewer C, Pillai SPS, Carrasco SE et al. (2019). Validation of a geropathology grading system for aging mouse studies. Geroscience 41, 455–465. 10.1007/s11357-019-00088-w. [DOI] [PMC free article] [PubMed] [Google Scholar]
- 36.Romero-Aleshire MJ, Diamond-Stanic MK, Hasty AH, Hoyer PB, and Brooks HL (2009). Loss of ovarian function in the VCD mouse-model of menopause leads to insulin resistance and a rapid progression into the metabolic syndrome. Am J Physiol Regul Integr Comp Physiol. 297, R587–R592. 10.1152/ajpregu.90762.2008. [DOI] [PMC free article] [PubMed] [Google Scholar]
- 37.Peters EC, Safayan L, Marx TJ, Ngu E, Vasileva A, Zappia I, Powell WH, Duca FA, and Stern JH (2022). Metabolic and physical function are improved with lifelong 15% calorie restriction in aging male mice. Biogerontology 2022 Oct 31. doi: 10.1007/s10522-022-09996-5. . [DOI] [PMC free article] [PubMed] [Google Scholar]
- 38.Pak HH, Haws SA, Green CL, Koller M, Lavarias MT, Richardson NE, Yang SE, Dumas SN, Sonsalla M, Bray L, et al. (2021) Fasting drives the metabolic, molecular and geroprotective effects of a calorie-restricted diet in mice. Nat Metab. 3, 1327–1341. 10.1038/s42255-021-00466-9. [DOI] [PMC free article] [PubMed] [Google Scholar]
- 39.Palliyaguru DL, Shiroma EJ, Nam JK, Duregon E, Vieira Ligo Teixeira C, Price NL, Bernier M, Camandola S, Vaughan KL, Colman RJ, et al. (2021). Fasting blood glucose as a predictor of mortality: Lost in translation. Cell Metab. 33, 2189–2200.e3. 10.1016/j.cmet.2021.08.013. [DOI] [PMC free article] [PubMed] [Google Scholar]
- 40.Petr MA, Alfaras I, Krawcyzk M, Bair WN, Mitchell SJ, Morrell CH, Studenski SA, Price NL, Fishbein KW, Spencer RG, et al. (2021). A cross-sectional study of functional and metabolic changes during aging through the lifespan in male mice. Elife 10, e62952. 10.7554/eLife.62952. [DOI] [PMC free article] [PubMed] [Google Scholar]
- 41.Kirkland JL, Stout MB, and Sierra F (2016). Resilience in Aging Mice. J Gerontol A Biol Sci Med Sci. 71, 1407–1414. 10.1093/gerona/glw086. [DOI] [PMC free article] [PubMed] [Google Scholar]
- 42.Unnikrishnan A, Matyi S, Garrett K, Ranjo-Bishop M, Allison DB, Ejima K, Chen X, Dickinson S, and Richardson A (2021). Reevaluation of the effect of dietary restriction on different recombinant inbred lines of male and female mice. Aging Cell 20, e13500. 10.1111/acel.13500. [DOI] [PMC free article] [PubMed] [Google Scholar]
- 43.Freund A (2019). Untangling Aging Using Dynamic, Organism-Level Phenotypic Networks. Cell Syst. 8, 172–181. 10.1016/j.cels.2019.02.005. [DOI] [PubMed] [Google Scholar]
- 44.Ziegler AA, Grobe CC, Reho JJ, Jensen ES, Thulin JD, Segar JL, and Grobe JL. (2022). Short-term Housing in Metabolic Caging on Measures of Energy and Fluid Balance in Male C57BL/6J Mice (Mus musculus). J Am Assoc Lab Anim Sci. 61, 132–139. 10.30802/AALAS-JAALAS-21-000087. [DOI] [PMC free article] [PubMed] [Google Scholar]
- 45.Manini TM (2010). Energy expenditure and aging. Ageing Res. Rev. 9, 1–11. 10.1016/j.arr.2009.08.002. [DOI] [PMC free article] [PubMed] [Google Scholar]
- 46.Samuel VT, and Shulman GI (2012). Mechanisms for insulin resistance: common threads and missing links. Cell 148, 852–871. 10.1016/j.cell.2012.02.017. [DOI] [PMC free article] [PubMed] [Google Scholar]
- 47.Glass CK, and Olefsky JM (2012). Inflammation and lipid signaling in the etiology of insulin resistance. Cell Metab. 15, 635–645. 10.1016/j.cmet.2012.04.001. [DOI] [PMC free article] [PubMed] [Google Scholar]
- 48.Aon MA, Bernier M, Mitchell SJ, Di Germanio C, Mattison JA, Ehrlich MR, Colman RJ, Anderson RM, and de Cabo R (2020). Untangling Determinants of Enhanced Health and Lifespan through a Multi-omics Approach in Mice. Cell Metab. 32, 100–116.e4. 10.1016/j.cmet.2020.04.018. [DOI] [PMC free article] [PubMed] [Google Scholar]
- 49.Castro-Portuguez R, and Sutphin GL (2020). Kynurenine pathway, NAD+ synthesis, and mitochondrial function: Targeting tryptophan metabolism to promote longevity and healthspan. Exp. Gerontol. 132, 110841. 10.1016/j.exger.2020.110841. [DOI] [PMC free article] [PubMed] [Google Scholar]
- 50.Yang SJ, Choi JM, Kim L, Park SE, Rhee EJ, Lee WY, Oh KW, Park SW, and Park CY (2014). Nicotinamide improves glucose metabolism and affects the hepatic NAD-sirtuin pathway in a rodent model of obesity and type 2 diabetes. J Nutr Biochem. 25, 66–72. 10.1016/j.nutbio.2013.09.004. [DOI] [PubMed] [Google Scholar]
- 51.Wu CS, Muthyala SDV, Klemashevich C, Ufondu AU, Menon R, Chen Z, Devaraj S, Jayaraman A, and Sun Y (2021). Age-dependent remodeling of gut microbiome and host serum metabolome in mice. Aging (Albany NY) 13, 6330–6345. 10.18632/aging.202525. [DOI] [PMC free article] [PubMed] [Google Scholar]
- 52.Wu W, Bours MJL, Koole A, Kenkhuis MF, Eussen SJPM, Breukink SO, van Schooten FJ, Weijenberg MP, and Hageman GJ (2021). Cross-Sectional Associations between Dietary Daily Nicotinamide Intake and Patient-Reported Outcomes in Colorectal Cancer Survivors, 2 to 10 Years Post-Diagnosis. Nutrients 13, 3707. 10.3390/nu13113707. [DOI] [PMC free article] [PubMed] [Google Scholar]
- 53.Pazdro R, and Burgess JR (2010). The role of vitamin E and oxidative stress in diabetes complications. Mech Ageing Dev. 131, 276–286. 10.1016/j.mad.2010.03.005. [DOI] [PubMed] [Google Scholar]
- 54.Ju J, Picinich SC, Yang Z, Zhao Y, Suh N, Kong AN, and Yang CS (2010). Cancer-preventive activities of tocopherols and tocotrienols. Carcinogenesis 31, 533–542. 10.1093/carcin/bgp205. [DOI] [PMC free article] [PubMed] [Google Scholar]
- 55.Drewnowski A, and Shultz JM (2001). Impact of aging on eating behaviors, food choices, nutrition, and health status. J. Nutr. Health Aging. 5, 75–79. https://doi.org/ [PubMed] [Google Scholar]
- 56.Maynard C, and Weinkove D (2018). The Gut Microbiota and Ageing. Subcell. Biochem. 90, 351–371. 10.1007/978-981-13-2835-0_12. [DOI] [PubMed] [Google Scholar]
- 57.Funk MC, Zhou J, and Boutros M (2020). Ageing, metabolism and the intestine. EMBO Rep. 21, e50047. 10.15252/embr.202050047. [DOI] [PMC free article] [PubMed] [Google Scholar]
- 58.Abraham KJ, Ostrowski LA, and Mekhail K (2017). Non-Coding RNA Molecules Connect Calorie Restriction and Lifespan. J. Mol. Biol. 429, 3196–3214. 10.1016/j.jmb.2016.08.020. [DOI] [PubMed] [Google Scholar]
- 59.Hamilton S, de Cabo R, and Bernier M. (2020). Maternally expressed gene 3 in metabolic programming. Biochim. Biophys. Acta Gene Regul. Mech. 1863, 194396. 10.1016/j.bbagrm.2019.06.007. [DOI] [PMC free article] [PubMed] [Google Scholar]
- 60.Haug K, Cochrane K, Nainala VC, Williams M, Chang J, Jayaseelan KV, and O’Donovan C (2020). MetaboLights: a resource evolving in response to the needs of its scientific community. Nucleic Acids Res. 48, D440–D444. 10.1093/nar/gkz1019. https://doi.org/ [DOI] [PMC free article] [PubMed] [Google Scholar]
- 61.Diaz-Ruiz A, Rhinesmith T, Pomatto-Watson LCD, Price NL, Eshaghi F, Ehrlich MR, Moats JM, Carpenter M, Rudderow A, Brandhorst S, et al. (2021). Diet composition influences the metabolic benefits of short cycles of very low caloric intake. Nat Commun. 12, 6463. 10.1038/s41467-021-26654-5. [DOI] [PMC free article] [PubMed] [Google Scholar]
- 62.Alfaras I, Ejima K, Vieira Ligo Teixeira C, Di Germanio C, Mitchell SJ, Hamilton S, Ferrucci L, Price NL, Allison DB, Bernier M, and de Cabo R (2021). Empirical versus theoretical power and type I error (false-positive) rates estimated from real murine aging research data. Cell Rep. 36, 109560. 10.1016/j.celrep.2021.109560. [DOI] [PMC free article] [PubMed] [Google Scholar]
- 63.Bellantuono I, de Cabo R, Ehninger D, Di Germanio C, Lawrie A, Miller J, Mitchell SJ, Navas-Enamorado I, Potter PK, Tchkonia T, et al. (2020). A toolbox for the longitudinal assessment of healthspan in aging mice. Nat. Protoc. 15, 540–574. 10.1038/s41596-019-0256-1. [DOI] [PMC free article] [PubMed] [Google Scholar]
- 64.Pang Z, Chong J, Zhou G, Morais D, Chang L, Barrette M, Gauthier C, Jacques PÉ, Li S, and Xia J (2021). MetaboAnalyst 5.0: narrowing the gap between raw spectra and functional insights. Nucl. Acids Res. 49, W388–W396. 10.1093/nar/gkab382. [DOI] [PMC free article] [PubMed] [Google Scholar]
- 65.Motulsky HJ and Brown RE (2006). Detecting outliers when fitting data with nonlinear regression - a new method based on robust nonlinear regression and the false discovery rate. BMC Bioinformatics 7, 123. 10.1186/1471-2105-7-123. [DOI] [PMC free article] [PubMed] [Google Scholar]
Associated Data
This section collects any data citations, data availability statements, or supplementary materials included in this article.
Supplementary Materials
Data S1. Source data underlying all figures and display items. Related to Figures 1–6 and Supplemental Figures 1–5.
Data Availability Statement
The mass spectrometry metabolomics data have been deposited in the MetaboLights database60 with the following accession number MTBLS790 (https://www.ebi.ac.uk/metabolights/MTBLS790). The published article and Supplemental information include datasets used to generate the graphs and figures in the paper (Data S1 – Source Data).
This paper does not report original code.
Any additional information required to reanalyze the data reported in this paper is available from the lead contact upon request.