

Abstract

Selective incorporation of conformational constraints into thyclotides can be used to modulate their binding to complementary oligonucleotides, increase polarity, and optimize uptake into HCT116 cells without assistance from moieties known to promote cell uptake. The X-ray structure and biophysical studies of a thyclotide–DNA duplex reveal that incorporation of tetrahydrofurans into an aegPNA backbone promotes a helical conformation that enhances binding to complementary DNA and RNA. Selective incorporation of tetrahydrofurans into the aegPNA backbone allows polarity to be increased incrementally so that uptake into HCT116 cells can be optimized. The enhanced binding, polarity, and cellular uptake properties of thyclotides were used to demonstrate effective inhibition of microRNA-21 in HCT116 cells.
Keywords: thyclotide, peptide nucleic acids (PNAs), binding properties, cell uptake, X-ray crystal structure, backbone modification, miR-21 inhibition, preorganization
Introduction
Since the 1980s, scientists have worked to develop chemically modified oligonucleotides with antisense sequences that can alter gene expression by binding to DNA or RNA target sequences within cells. Despite the potential for antisense molecules to be developed as drugs, only a few have been approved for clinical use.1−4 In 1991, Nielsen and co-workers first described the nucleic acid analogues termed peptide nucleic acids (PNAs) (Figure 1).5−9 The most common PNA (1) consists of nucleobases bonded to a highly flexible N-(2-aminoethyl) glycine (aeg) backbone that does not occur naturally. The lack of negative charge on the pseudopeptide backbone of aegPNA 1 facilitates strong binding to complementary oligonucleotides, and the synthetic backbone conveys resistance to enzymatic degradation.10−14 These unique properties make aegPNAs ideal molecules for antisense applications in addition to probes for molecular diagnostics.15−24 However, aegPNAs are limited by poor cellular uptake and low aqueous solubility.25 Numerous efforts have been made to modify aegPNA to address these concerns,26−31 and the addition of charged groups either to the backbone or the ends of aegPNA will improve aqueous solubility and cellular uptake via mechanisms typically involving endocytosis. In general, aegPNA needs the assistance of a delivery mechanism to enter cells, and there are many strategies available with varying degrees of success.32−36 In our previous work, we have shown that cyclopentane (cp) groups incorporated into the aegPNA backbone constrain the flexible aeg backbone to adopt a right-handed helical conformation with improved binding affinity to complementary nucleic acids (Figure 1, cpPNA 2).37 The hydrophobic cp rings on the backbone, however, do not improve water solubility. We reasoned that the introduction of a more polar five-membered ring, tetrahydrofuran (thf), into the PNA backbone could potentially improve its water solubility while maintaining the binding properties of cpPNA (Figure 1). In this article, we present detailed insights into the chemical, biophysical, structural, and biological properties of tetrahydrofuran-derived PNAs 3 (which we call thyclotides). We previously demonstrated that thyclotides containing thf at every position in a PNA sequence could enter cells and target a microRNA sequence.38 Here, we show how the incremental incorporation of thf groups into a PNA sequence affects binding to oligonucleotides and leads to additional improvements in cellular uptake. Compared with aegPNA, thyclotides display stronger binding affinity to complementary DNA and RNA. While placing thf at every position in a PNA sequence that targets microRNA-21 resulted in good cellular uptake,38 we show in this article that careful placement of thf groups at only select positions results in more favorable cell uptake and enhanced biological activity against the microRNA target. We also show that both cp and thf groups may be incorporated into a mixPNA 4. The unique properties of thyclotides may provide a new strategy for the cellular delivery of antisense molecules.
Figure 1.

Approaches to controlling the backbone conformations of aegPNAs by incorporation of cyclopentanes or tetrahydrofurans.
Results and Discussion
Preparation of Thyclotides
Thyclotide oligomers are prepared from monomers using Fmoc-based solid phase peptide synthesis (SPPS). An efficient synthetic route for the preparation of thyclotide monomers was developed based on the protocols for cpPNA monomers.38 Initially, a nine-residue mixed-base sequence was chosen to study the properties of the thyclotides. Using this test sequence, thf groups were gradually introduced into the sequence.37 Nine different thyclotides 3a–3i, one cpPNA 2a, and one mixed PNA 4a were prepared (Table 1).
Table 1. aegPNA, Thyclotide, and cpPNA Used in the Melting Experiments.

Cyclopentane stereochemistry is (S,S), and tetrahydrofuran stereochemistry is (R,R); B* = thf residue, B# = cp residue. PNA and thyclotide sequences are written from the N- to C-terminal. In each oligomer, 2-aminoethoxy-2-ethoxy acetic acid (AEEA) is the first residue at the C-terminal, and the N-terminal is a free amine.
In each oligomer, 2-aminoethoxy-2-ethoxy acetic acid (AEEA) is the first C-terminal residue and the N-terminal is a free amine. After the completion of peptide synthesis, the oligomer is cleaved from the resin, all protecting groups are removed, and the crude products are purified by reversed-phase high-pressure liquid chromatography (RP-HPLC) (Figure 2A,B, Figures S53–S107, and Tables S17–S19). Before subsequent studies, each oligomer is characterized by ESI-TOF mass spectrometry (Table S1 and Figures S53–S107).
Figure 2.
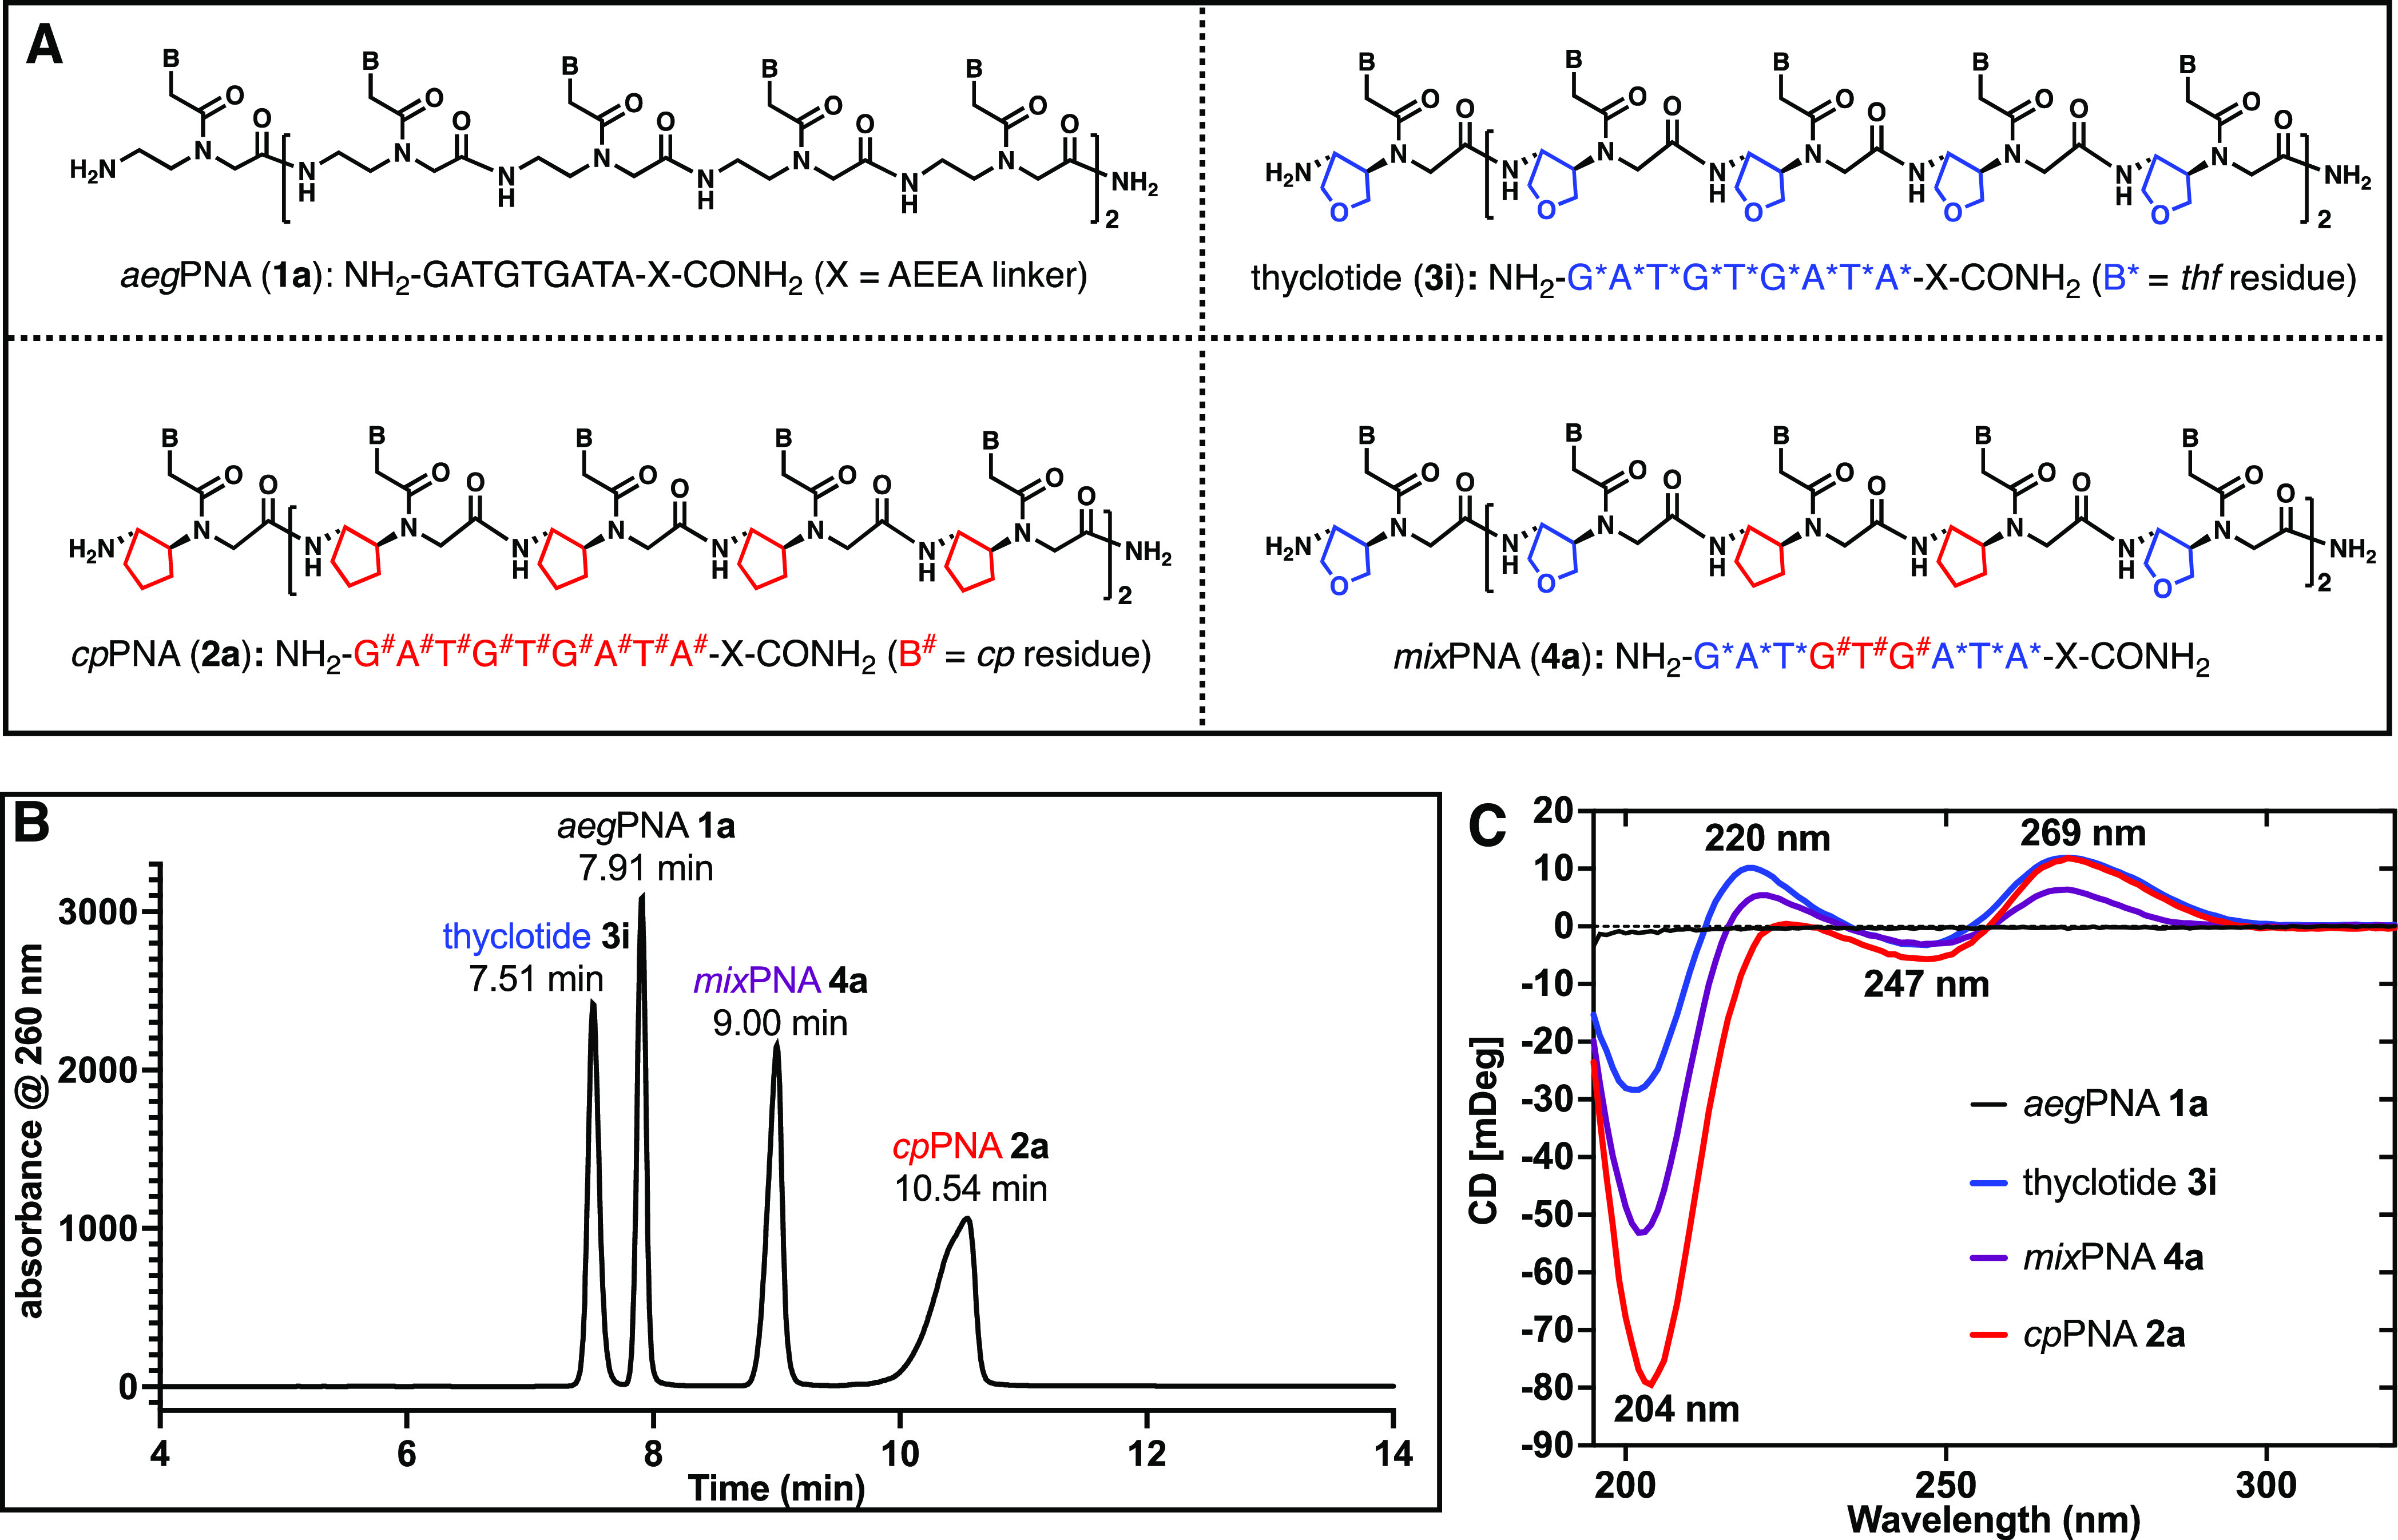
Backbone modifications of peptide nucleic acids (PNAs) with tetrahydrofuran (thf) and cyclopentane (cp). (A) Structural schematic of aegPNA (top left), thyclotide (top right), cpPNA (bottom left), and mixPNA (bottom right). Nine-nucleobase sequences representing aegPNA 1a, thyclotide 3i, cpPNA 2a, and mixPNA 4a. B* represents thf residue, B# represents cp residue, and AEEA = 2-(2-aminoethoxy)ethoxyacetyl group. (B) HPLC chromatogram of a mixture of aegPNA 1a, cpPNA 2a, thyclotide 3i, and mixPNA 4a (∼1:1:1:1 ratio). (C) CD spectra of unhybridized (single-strand) aegPNA 1a, thyclotide 3i, cpPNA 2a,37 and mixPNA 4a (50 μM in water).
Polarity and Single-Strand Circular Dichroism (CD)
The relative polarities of aegPNA 1a, cpPNA 2a, thyclotide 3i, and mixPNA 4a were examined by RP-HPLC outfitted with a C18 column while eluting with a mixture of water and acetonitrile. The retention time of a molecule on the C18 column is related to the polarity and hydrophobicity of the molecule. The HPLC chromatogram of a mixture of 1a, 2a, 3i, and 4a showed that thyclotide 3i elutes first, followed by aegPNA 1a, mixPNA 4a, and finally, cpPNA 2a (Figure 2A,B). This observation indicates that the thyclotide is more polar than aegPNA and cpPNA.
According to the “like dissolves like” rule,39 the increase in polarity of the thyclotide leads to its enhanced solubility in water compared with aegPNA and cpPNA. The mixPNA with three cp and six thf groups elutes later than the aegPNA, indicating that the cp groups contribute significant hydrophobicity to the molecule. The relative hydrophilicity was further assessed by determining distribution of each molecule at equilibrium between octanol and water. Within the series, thyclotide 3i has the lowest octanol/water partition coefficient (Kow = 2.59 × 10⁻³) and, therefore, a higher affinity for the aqueous phase than aegPNA 1a (Kow = 5.03 × 10⁻³), mixPNA 4a (Kow = 1.85 × 10⁻²), and cpPNA 2a (Kow = 4.58 × 10⁻²; Table S2 and Figures S1–S8). The circular dichroism (CD) spectra of aegPNA 1a, thyclotide 3i, mixPNA 4a, and cpPNA 2a were each measured in water (Figure 2C). Except for 1a, each molecule reveals a distinct CD spectrum that will be discussed in a subsequent section.
UV Experiments
The effects of thf substitution on the binding of thyclotides to DNA and RNA were determined by examining the melting temperatures (Tm’s) for molecules 3a–3i and comparing the change (ΔTm) relative to unmodified aegPNA 1a (Figure 3A,B, Figures S9–S14, and Table S3). Our results show that a single thf in a thyclotide increases the melting temperature of the duplex with complementary DNA as well as RNA (1avs3a, Figure 3A,B). Additional thf units further increase the Tm values (3b–3i). The average increase in Tm per thf modification is around +4 °C for DNA binding and +3 °C for RNA binding. When bound to DNA, the fully thf-modified thyclotide 3i has a Tm of 77 °C, an increase of 35 °C compared to the corresponding aegPNA–DNA duplex. When bound to RNA, thyclotide 3i has a Tm of 72 °C, which is 26 °C higher than that of the corresponding aegPNA–RNA duplex (1avs3i, Figure 3A,B). For thyclotides 3a–3e, which contain one to five thf groups, the Tm values of the thyclotide–RNA duplexes are higher than the corresponding thyclotide–DNA duplexes (Figure 3A,B). This observation is consistent with aegPNA, which typically shows higher Tm values when bound to RNA versus DNA. When additional five-membered rings are incorporated in the backbone, as with thyclotides 3f–3i, mixPNA 4a, and cpPNA 2a, the Tm values for DNA binding are higher than for RNA binding (Figure 3A,B). The increase in duplex stability with DNA associated with several five-membered rings in the PNA backbone may indicate that the RNA backbone, which is more rigid than DNA, is less able to accommodate the increases in PNA rigidity as additional five-membered rings are introduced. Interestingly, the stabilizing effect of thf for the PNA–DNA and RNA duplexes is lower than that of cp (3ivs4a and 2a, Figure 3A,B). Because cp and thf rings have very similar conformations,40 we were surprised by this noticeable difference in the Tm values of cpPNA–DNA and RNA duplexes compared with the thyclotide duplexes of identical sequences. Combining cp and thf groups in the mixPNA 4a showed Tm values of 85 °C for DNA binding and 80 °C for RNA binding, which are higher than that of the fully thf-modified thyclotide 3i. The observation that cp groups continued to provide improved duplex stability compared with thf even in mixPNA 4a prompted us to further characterize the properties of thyclotides.
Figure 3.
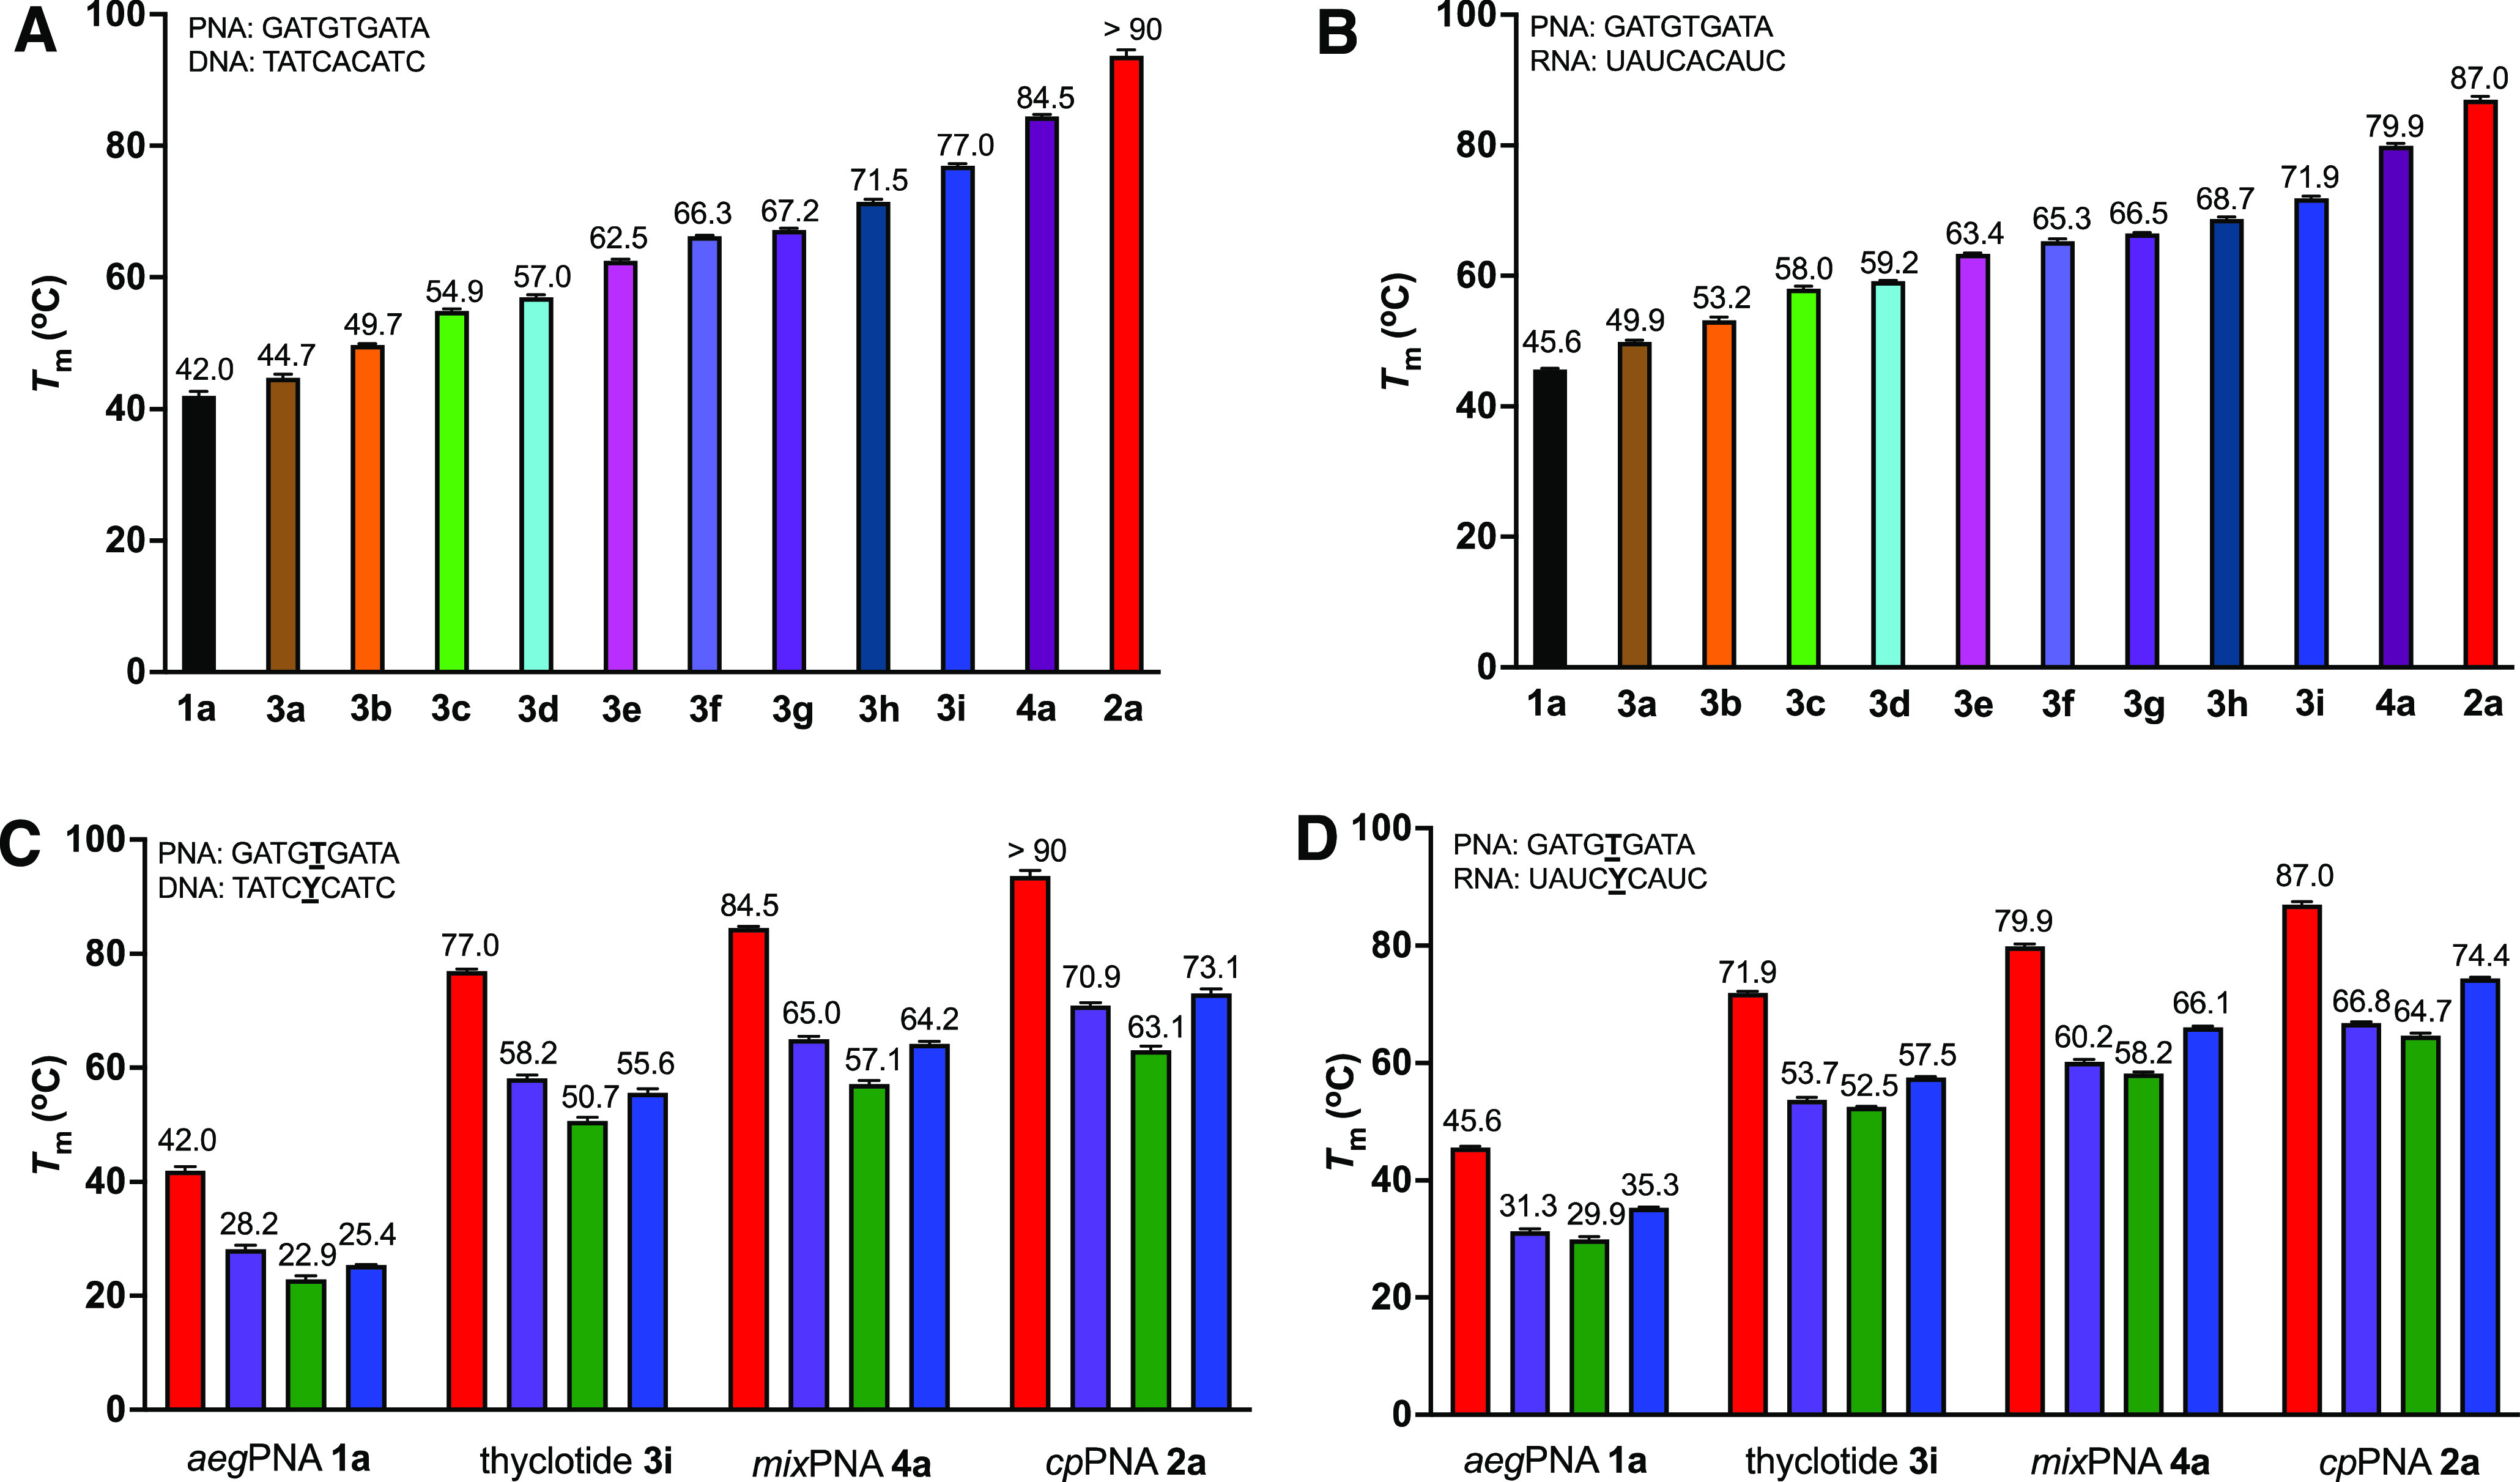
Thyclotide exhibits strong binding properties to oligonucleotides. (A) Melting temperatures for PNA–DNA duplexes (1 μM individual strand concentration) in PBS. (B) Melting temperature data for PNA–RNA duplexes (1 μM individual strand concentration) in PBS. (C) Comparison of single base mismatch discrimination between aegPNA, thyclotide, and cpPNA for DNA binding. Color codes for Y in the DNA strand: A (red), T (purple), C (green), and G (blue). (D) Comparison of single base mismatch discrimination between aegPNA, thyclotide, and cpPNA for RNA binding. Color codes for Y in the RNA strand: A (red), U (purple), C (green), and G (blue).
The ability of a PNA to discriminate between fully complementary DNA or RNA sequences versus similar sequences with only a one base mismatch is defined as the sequence specificity. In these experiments, the Tm of a duplex containing a single base mismatch is subtracted from the Tm of a duplex of the fully matched duplex to provide a ΔTm value. Larger ΔTm values indicate a higher degree of sequence specificity. The ΔTm of thyclotide 3i is greater than that of the corresponding aegPNA 1a and comparable to those of cpPNA 2a and mixPNA 4a (Figure 3C,D, Figures S15–S26, and Tables S4 and S5). The thyclotide 3i, cpPNA 2a, and mixPNA 4a displayed better sequence specificity for DNA binding than RNA binding when comparing ΔTm values (Figure 3C vsFigure 3D). When binding to the DNA or RNA with a TT mismatch or a TC mismatch, thyclotide 3i exhibited slightly worse sequence specificity than cpPNA 2a and mixPNA 4a. In contrast, when binding to the DNA or RNA with a TG mismatch, thyclotide 3i showed slightly better sequence fidelity than cpPNA 2a and mixPNA 4a. Despite some minor differences, the improvements in the sequence specificity of cp and thf groups in a PNA backbone are about the same.
Thermodynamic Analysis
To better understand the contribution of thf to the stability of the PNA–DNA or RNA duplex, nonlinear least-squares curve fitting41 was used to analyze the UV melting curves to determine the thermodynamic parameters for aegPNA 1a, thyclotides 3a–3i, mixPNA 4a, and cpPNA 2a for hybridization to DNA or RNA. The data are listed in Tables S6 and S7. Our results show that the binding constant consistently increases as more thf units are introduced into the PNA backbone (1avs3a–3i, Tables S6 and S7). Compared with the unmodified aegPNA 1a, the binding affinity to DNA and RNA for fully modified thyclotide 3i is increased by five orders of magnitude and four orders of magnitude, respectively. The binding of PNAs to complementary oligonucleotides is typically driven by favorable enthalpy resulting from hydrogen bonding between nucleobases that overcomes unfavorable entropy resulting from the loss of conformational freedom of the free PNA and the oligonucleotide when forming a duplex structure. As the number of thf groups is gradually increased for thyclotides 3a–3h, the binding to DNA mostly improves as a result of less unfavorable entropy compared with aegPNA 1a. The increase in binding affinity for cpPNA 2a for DNA is also largely driven by less unfavorable entropy (Table S6). This observation could be an effect of the conformational rigidification of the backbone with thf. However, the increased binding affinities for thyclotide 3i and mixPNA 4a binding to DNA are enthalpically driven (Table S6), as are the RNA binding of thyclotides 3a–3i, mixPNA 4a, and cpPNA 2a (Table S7). Clearly, the binding of thyclotides and cpPNA to DNA and RNA is governed by a complex interplay of enthalpy and entropy compensation.42 However, the thymodynamic data do not reveal an explanation for why thyclotides bind with slightly weaker affinity to oligonucleotides compared to cpPNA.
Circular Dichroism (CD)
To determine the effect of thf on the helical conformation of PNA, we measured the CD spectra of thyclotides 3a–3i. The aegPNA 1a lacks any distinct peaks because it is achiral and has an unstructured non-helical conformation.43 For thyclotides 3a–3i, we observed positive peaks around 220 and 269 nm and negative peaks around 204 and 247 nm (Figure S39). These CD signals suggest that thyclotides adopt a right-handed helical conformation that is intermediate between A- and B-form DNA (Figure S39).44 The magnitude of the CD signals increases as more thf groups are present in the PNA backbone. However, thyclotide 3i exhibits a much weaker CD signal compared to mixPNA 4a and cpPNA 2a (Figure 2C), suggesting that it has a lower degree of helicity. The incorporation of polar side chains in α-helical polypeptides may similarly lower the α-helical stability in aqueous solution by decreasing hydrophobic interactions.45,46 The change from hydrophobic cyclopentane groups to more polar thf groups in the PNA backbone also seems to elicit a decrease in helical stability for thyclotide 3i. The CD data are consistent with our observations that the average increase in Tm per cp modification is around +6 °C for DNA binding and +4.5 °C for RNA binding, whereas the average increase in Tm per thf modification is around +4 °C for DNA binding and +3 °C for RNA binding. The magnitudes of CD signals for thyclotides are smaller than those of mixPNA 4a and cpPNA 2a, yet these CD data suggest that the thf modification preorganizes the backbone of PNAs into a right-handed helix to some degree. The helical preorganization most likely accounts for their enhanced binding affinity to the complementary DNA or RNA.
Preparation and Purification of the Iodo-Labeled Thyclotide–DNA Duplex
Thyclotides exhibit increased binding affinity to DNA and are more polar compared with aegPNA, yet the binding affinity of cpPNA to DNA is considerably stronger than the corresponding thyclotide. One potential explanation of this difference in binding affinity is that the thf groups sterically interfere with binding due to slight differences in the conformations of the five-membered ring. To gain insight into this possibility, an X-ray structure of a thyclotide–DNA duplex was determined to observe the orientations of the thf groups. For these studies, either the thyclotide or the DNA must be labeled with a heavy atom such as iodide atom to solve the phase problem that is encountered in X-ray crystallography.47 Duplexes of thyclotides with commercially available iodo-labeled DNAs did not yield good quality crystals. Therefore, a synthesis for iodo-labeled thyclotide was developed. Monomer 7 was prepared following a similar procedure for the preparation of the other thyclotide monomers.38 The Fmoc-protected tetrahydrofuran diamine 5 was coupled with 5-iodouracil-1-yl acetic acid using N-ethyl-N′-(3-dimethylaminopropyl)carbodiimide hydrochloride (EDC) and hydroxybenzotriazole (HOBt) to afford the iodo-labeled thyclotide monomer methyl ester derivative 6. The resulting methyl ester was subjected to ester hydrolysis, followed by Fmoc protection to yield the requisite iodo-labeled thyclotide monomer 7 (Figure 4A and Scheme S1). The iodo-labeled thyclotide monomer 7 is compatible with standard Fmoc-based solid-phase synthesis, and a 9-mer thyclotide bearing a 5-iodouridine residue at the terminal position 8 was thus prepared (Figure 4B). HPLC was used to monitor the formation of the thyclotide–DNA duplex (see page S25 for details). When the iodo-labeled thyclotide 8 was mixed with its complementary DNA in a 1:1 ratio in water at room temperature, the duplex was formed exclusively (Figure 4B). The duplex was successfully purified by HPLC as the duplex peak is well separated from free thyclotide and free DNA on the HPLC chromatogram. The purified iodo-labeled thyclotide 8–DNA duplex formed single crystals used for X-ray diffraction analysis.
Figure 4.

Synthesis, purification, and crystal structure of iodo-labeled thyclotide 8 with complementary DNA. (A) Synthetic route for the preparation of iodo-labeled thyclotide monomer 7. (B) HPLC chromatograms of iodo-labeled thyclotide 8 (blue), its complementary DNA (red), and thyclotide 8–DNA duplex (purple). ItU* represents iodo-labeled thyclotide residue 7, B* represents thf residue, and X represents 2-aminoethoxy-2-ethoxy acetic acid (AEEA linker). (C) Stick view of thyclotide 8–DNA double-helix (two helices, A–B duplex and C–D duplex, in the asymmetric crystallographic unit). Hydrogen bonds are shown as purple lines. (D) Stick views of thyclotide 8–DNA double-helix structure (C–D duplex, left), the iodo-labeled thyclotide 8 (strand D, middle), and its complementary DNA (strand C, right). Resolution = 2.0 Å, R/Rfree = 23.2/26.4, and space group = I222. Hydrogen bonds are shown as purple lines.
X-ray Diffraction Analysis of the Thyclotide–DNA Duplex
The structure of the duplex was solved by single-wavelength anomalous diffraction phasing using the iodo-labeled thyclotide 8 at 2.0 Å resolution in the space group I222 and refined to an Rfactor of 23.2% and an Rfree of 26.4% (Table S8 and Figures S40–S48). Two helices, the A–B duplex and C–D duplex, were identified in the asymmetric unit (Figure 4C and Figures S49 and S50). In the C–D helix, all nucleobases on thyclotide 8 (strand D) are hydrogen-bonded to the nucleobases on its complementary DNA strand (strand C). In the A–B helix, the iodo-uridine residue on thyclotide 8 (strand B) is flipped out of the A–B duplex. Its complementary nucleobase, an A residue at the end of the complementary DNA strand (strand A), seems to interact with a G nucleobase of strand C in the C–D helix (possibly through hydrogen bonding). Although the sterically hindered iodine atom in the iodo-uridine nucleobase might weaken its hydrogen bonding to the complementary nucleobase, the flipped-out conformation of the iodo-uridine nucleobase is likely a result of crystal packing. The helical parameters of the two duplexes in the asymmetric unit are slightly different. The thyclotide 8–DNA A–B helix (A–B duplex with the flipped-out iodo-uridine) forms an antiparallel right-handed helix with a helical twist of 22.5 Å, a rise of 3.3 Å, and a pitch of 16.0 base pairs per turn (Figure 4C, Tables S9 and S11, and Table 2 (7UID: A–B)). The fully base-paired C–D duplex adopts a more twisted right-handed helix with a helical twist of 24.3 Å, a rise of 3.3 Å, and a pitch of 14.8 base pairs per turn (Figure 4D, Tables S10 and S12, and Table 2 (7UID: C–D)). In the structure of the C–D duplex, all nucleobases pair via Watson–Crick hydrogen bonds and the base pairs are almost perpendicular to the helical axis (Figure 4D). Both the thf units and the carbonyl groups of the peptide backbone orient toward the solvent, while the carbonyl in the carboxymethyl groups next to the nucleobases points toward the C-terminal. Taken together, the thyclotide–DNA duplex adopts a P-form helix (Figure 4D and Table 2).49 The thyclotide–DNA duplex exhibits a slightly smaller twist angle than the cpPNA–DNA duplex (entries 2 and 3, Table 2) and larger twist angles than other backbone-modified PNA–DNA duplexes (entries 5 and 6, Table 2).37,50−53 The helical parameters suggest that the thyclotide–DNA duplex adopts a P-form helical structure that resembles the cpPNA–DNA duplex. Overall, the thyclotide–DNA structure demonstrates that thf is a good backbone-rigidifying unit that is nicely accommodated in the complex with DNA.
Table 2. Comparison of Helical Parameters between Available PNA–DNA and Thyclotide–DNA Complexesa.
| structure | type | twist [°] | rise [Å] | base tilt [°] | displacement [Å] | bases per turn | method |
|---|---|---|---|---|---|---|---|
| 7UID (A–B) | thyclotide–DNA | 22.5 | 3.3 | 1.6 | –5.3 | 16.0 | X-ray |
| 7UID (C–D) | thyclotide–DNA | 24.3 | 3.3 | 1.4 | –5.4 | 14.8 | X-ray |
| 7KZL | cpPNA–DNA37 | 27.1 | 3.4 | 0.4 | –3.4 | 13.2 | X-ray |
| 1PDT | PNA–DNA50 | 27.5 | 3.5 | –1.3 | –2.9 | 13.1 | NMR |
| 3PA0 | γPNA–DNA51 | 22.6 | 3.3 | 3.0 | –6.6 | 15.9 | X-ray |
| 1NR8 | αPNA–DNA52 | 23.0 | 3.4 | 0.7 | –4.2 | 15.7 | X-ray |
| A-DNA | DNA–DNA53 | 32.7 | 2.6 | –4.5 | –4.5 | 11 | X-ray |
| B-DNA | DNA–DNA53 | 36.0 | 3.4 | –0.1 | 0.0 | 10 | X-ray |
A–B and C–D refer to the two duplexes in the asymmetric crystallographic unit from this work. One duplex is the pairing of strands A and B, and the other is the pairing of strands C and D. The averaged values were calculated with CURVES.48
Cyclopentane and tetrahydrofuran have very similar envelope conformations,40 and both are well tolerated in the structures of cpPNA and thyclotide when bound to DNA. Therefore, it is unlikely that conformational differences between the two rings would explain why a thyclotide–DNA duplex exhibits lower thermodynamic stability than the corresponding cpPNA–DNA duplex. After superimposing the two X-ray structures, we observed a substantial difference in the number of water molecules surrounding the helices. There are around 97 water molecules identified in the cpPNA–DNA duplex and 156 water molecules in the thyclotide–DNA duplex (Figure 5A,B). It is important to note that the cpPNA–DNA duplex was solved at 1.3 Å resolution, whereas the thyclotide–DNA duplex was solved at 2.0 Å resolution. Furthermore, water molecules are identified more readily in structures with 1.0 Å resolution compared to those solved at 2.0 Å resolution.54 The fact that many additional water molecules were identified in the structure of the thyclotide–DNA at 2.0 Å resolution compared to the cpPNA–DNA at 1.3 Å resolution indicates that thyclotides are more extensively hydrated than cpPNA. The increased hydration of thyclotides in aqueous solutions may explain the lower thermodynamic stability of thyclotide–DNA duplexes compared with cpPNA–DNA duplexes, as well as the weaker CD signals.55
Figure 5.

The thyclotide 8–DNA duplex has more water molecules than the cpPNA 2a–DNA duplex (PDB: 7KZL). (A) Superimposed stick views of cpPNA 2a–DNA (PDB: 7KZL)37 and thyclotide 8–DNA (PDB: 7UID) duplexes with water molecules from both structures. Color scheme for PNAs and DNA: cpPNA 2a is dark blue, DNA bound to cpPNA 2a is yellow, thyclotide 8 is cyan, and DNA bound to thyclotide 8 is khaki. Color scheme for water molecules: cyan spheres are water molecules from the thyclotide 8–DNA duplex, and red spheres are water molecules from the cpPNA 2a–DNA duplex. (B) Two surface views of the thyclotide 8–DNA duplex. Color scheme for PNA and DNA: thyclotide 8 is cyan, and DNA is khaki. Color scheme for water molecules: green spheres represent conserved water molecules observed only in the thyclotide 8–DNA duplex, magenta spheres represent conserved water molecules seen only in the cpPNA 2a–DNA duplex, and white spheres represent non-conserved water molecules observed in both the thyclotide 8–DNA and cpPNA 2a–DNA duplexes. ItU* represents iodo-labeled thyclotide residue 7, and B* represents thf residue.
Hydration of Thyclotide and cpPNA Determined by Osmotic Stressing
As thyclotide–DNA duplexes are more extensively hydrated than cpPNA–DNA duplexes in the solid state, we used osmotic stressing to evaluate their hydration in solution.56,57 The dissociation of nucleic acid duplexes is influenced by changes in water activity. Addition of water-binding organic co-solutes, such as ethylene glycol and glycerol, will change the activity of water in an aqueous buffer and subsequently lower the melting temperature of oligonucleotide duplexes. Rozners and Moulder57 established that the number of water molecules released upon the dissociation of oligonucleotide duplexes, Δnw, can be calculated from melting temperatures at different levels of water activity. Thyclotide 9a and cpPNA 9b with identical seven-residue sequences were designed for these experiments since the melting temperatures for their binding to DNA and RNA fall within in the range of 40–70 °C in the presence of different organic co-solutes (Table 3 and Tables S13–S16). As shown in Table 3, the Δnw values for oligonucleotide duplexes of thyclotide 9a and cpPNA 9b fall in a range of 0.47–1.16. These values are significantly lower than reported Δnw values for DNA and RNA duplexes, which are 2–3 for DNA duplexes and 3–4 for RNA duplexes.61 The results in Table 3 therefore suggest that oligonucleotide duplexes with thyclotide 9a and cpPNA 9b are less hydrated than duplexes where both strands are derived from DNA or RNA. Duplexes with RNA are typically more hydrated than those containing DNA.57 Consistent with this trend, both thyclotide 9a–RNA and cpPNA 9b–RNA duplexes have Δnw values that are slightly higher than the corresponding thyclotide 9a–DNA and cpPNA 9b–DNA duplexes (Table 3). It is also clear from the data that thyclotide 9a–oligonucleotide duplexes have Δnw values that are higher than the corresponding duplexes with cpPNA 9b (Table 3). These results suggest that thyclotide 9a is more hydrated than cpPNA 9b when it binds to oligonucleotides, and this is consistent with the observations in the X-ray crystal structures.
Table 3. Values of Δnw (per Base Pair)a.

Cyclopentane stereochemistry is (S,S), and tetrahydrofuran stereochemistry is (R,R); B* = thf residue, and B# = cp residue. PNA and thyclotide sequences are written from the N- to C-terminal. In each oligomer, 2-aminoethoxy-2-ethoxy acetic acid (AEEA) is the first residue at the C-terminal, and the N-terminal is a free amine.
Thyclotide Shows Good Cell Uptake
Thyclotides are polar molecules with a fairly rigid structure and good binding affinity and sequence specificity to complementary DNA and RNA. Some thyclotides with thf groups at every position are able to enter cells,38 yet it seemed possible that a smaller number of thf modifications could still promote uptake into mammalian cells and subsequently target a miRNA inside the cell. Among the many different miRNAs, miR-21 is a 22-nucleotide oncogenic miRNA that regulates the expression of several proteins associated with many cancers.58 Overexpression of miR-21 is a hallmark of many diseases.59−61 To test for the cellular uptake of the different thyclotides, we synthesized the fluorescein (FI)-labeled aegPNA 10a and FI-labeled thyclotides 10b–10f with a complementary nucleotide sequence to hsa-miR-21-5p (Figure 6A). The thyclotides were designed with a varying number of thf groups, ranging from 2 to 14, to directly determine the effects of differing numbers of thf groups on cell uptake. Initially, HCT116 cells were treated with the Fl-labeled aegPNA 10a or the Fl-labeled fully thf-modified thyclotide 10f to establish the negative and positive controls, respectively. Using super-resolution microscopy, HCT116 cells treated with 2.5 μM 10a clearly showed very weak fluorescence (Figure 6B and Figure S51), whereas cells treated with 2.5 μM 10f show a strong green fluorescence, confirming that regular aegPNAs are unable to efficiently enter the cells, while large amounts of the fully thf-modified thyclotide 10f do enter the cells (Figure 6C and Figure S51). We then quantitated the difference in the uptake of Fl-labeled aegPNA 10a and Fl-labeled thyclotide 10f by FACS. As shown in Figure 6D–F, 66% of HCT116 (P < 0.0001) treated with 10f showed increased fluorescence compared with cells treated with 10a, which displayed an uptake of only 13%. Even if a few cells were positive for the uptake of the aegPNA, the mean fluorescence intensity (MFI) is significantly lower compared with the MFI of cells positive for thyclotide 10f (12-fold increase; Figure 6G), showing that the number of molecules taken up per positive cell is much higher in the case of the thyclotide (P < 0.0001). Hence, the cellular uptake of thyclotide 10f is considerably higher than that of aegPNA 10a in HCT116 cells (P < 0.0001).
Figure 6.

Thyclotide exhibits cell uptake enhancement compared with aegPNA. (A) Schematic of the fluorescein-labeled (FI) aegPNA 10a and fluorescein-labeled thyclotide 10b–10f used in cell uptake experiments. B* represents thf residue, and X represents 2-aminoethoxy-2-ethoxy acetic acid (AEEA linker). (B) 3D volume reconstruction of 0.15 μm z-steps super-resolution microscopy of an HCT116 cell treated with 2.5 μM 10a for 3 h. The cell was stained with the Membrite Fix 640/660 membrane marker and Hoechst 33342 for nucleus staining. The membrane (red) and nucleus (blue) channels were successively removed from the middle and right pictures, respectively, to better show the cytoplasmic and nuclear diffusion of the aegPNA 10a (green). (C) 3D volume reconstruction of 0.15 μm z-steps super-resolution microscopy of an HCT116 cell treated with 2.5 μM 10f for 3 h. The cell was stained with the Membrite Fix 640/660 membrane marker and Hoechst 33342 for nucleus staining. The membrane (red) and nucleus (blue) channel were successively removed from the middle and right pictures, respectively, to better show the cytoplasmic and nuclear diffusion of the thyclotide 10f (green). (D) FACS data of HCT116 comparing the fluorescence of cells not treated or treated with 10a for 3 h. (E) FACS data of HCT116 comparing the fluorescence of cells not treated or treated with 10f for 3 h. (F) Mean of fluorescence intensity for negative control, aegPNA-treated cells, and thyclotide-treated cells. (G) FACS statistics of aegPNA-treated cells and thyclotide-treated cells. Cells were considered positive for cell uptake when the fluorescence was superior to the fluorescence observed for negative control (non-treated cells).
Next, we investigated whether differing numbers of thf groups affected the cell uptake of thyclotides. Examining Fl-labeled thyclotides containing 2, 5, 8, 11, or 14 thf groups (10b, 10c, 10d, 10e, and 10f; Table S1 and Figure 6A), there is a clear trend that cellular uptake increases as more thf groups are incorporated into the thyclotide (Figure 7A,B). The increase in cell uptake is small for thyclotides containing 2, 5, or 8 thf groups compared with aegPNA 10a, but there is a very noticeable increase in cell uptake for thyclotide 10e with 11 thf groups. Remarkably, the best thyclotide in terms of cell uptake efficiency is not the fully modified-14-thf thyclotide 10f but the 11 thf-thyclotide 10e (Figure 7A,B). The enhanced uptake of the 11-thf thyclotide 10e was confirmed by super-resolution microscopy (Figure S52). Clearly not every position in a thyclotide needs to be modified with thf to achieve optimal cell uptake, yet there is a critical number of thf’s that are needed. Typically, large molecules with molecular weights over 1000 Da have very poor cell permeability.62 The thyclotides 10e and 10f, with molecule weights over 5000 Da, seem to be exceptions to the limits commonly seen with the cell uptake of sizable molecules.
Figure 7.

Relationship between the number of thf groups and cell uptake. (A) FACS of HCT116 cells treated with Fl-labeled thyclotides 10b (dark green), 10c (light green), 10d (orange), 10e (blue), or 10f (red). (B) Comparisons of the MFI of HCT116 cells treated with Fl-labeled aegPNA 10a (black) and Fl-labeled thyclotides 10b (dark green), 10c (light green), 10d (orange), 10e (blue), and 10f (red). N = 3.
Thyclotide Can Effectively Bind and Inhibit miR-21
Thyclotides 10e and 10f efficiently enter HCT116 cells but at somewhat different levels of efficiency. Next, we wanted to test if 10e and 10f can inhibit miR-21 in HCT116 cells and whether they have different potencies. To perform these experiments, we synthesized several controls. The first control sequence was the antimiR-21 aegPNA 11a (Figure 8A), which we expected to have no effect on miR-21 as HCT116 cells overexpress miR-2163 and the fluorescein-labeled derivative of this aegPNA was unable to enter these cells efficiently. The next control sequences are the scrambled thyclotides 11c and 11e (Figure 8A). The sequences of these control thyclotides are not complementary to miR-21 and therefore should not have any effect on miR-21 levels. HCT116 cells were treated with 1 or 5 μM 11e, and expression of miR-21 was assessed by RT-qPCR compared with untreated cells. As shown in Figure 8B, the scrambled thyclotide 11e was a good negative control as it did not induce any changes in miR-21 expression in HCT116 cells and did not exhibit any obvious cytotoxicity.42 We then treated cells with antimiR-21 aegPNA 11a and measured miR-21 expression relative to cells treated with the scrambled sequences. As expected, 11a was unable to inhibit miR-21 expression (Figure 8C). Gratifyingly, the antimiR-21 thyclotides 11b and 11d induce a strong dose-dependent response in miR-21 expression (Figure 8D). Thyclotides bind miR-21 strongly and act as steric blockers. Therefore, miR-21 is unable to be amplified by PCR, leading to an apparent decrease in expression levels by RT-qPCR after treating HCT116 cells with thyclotides 11b and 11d. The decrease in miR-21 expression reaches about 50% at a concentration of 500 nM 11d, and total inhibition of miR-21 is obtained at 2 μM and higher (Figure 8D). Even though it has fewer thf groups, thyclotide 11b is more potent than 11d. At a concentration of 1 μM 11b, there is a complete inhibition of miR-21 (Figure 8D). For thyclotide 11d at a concentration of 1 μM, about 11% of miR-21 is still observed (Figure 8D). These results resemble the trend observed in the cell uptake experiments where the 11-thf thyclotide 10e entered cells more effectively than 14-thf thyclotide 10f (Figure 7). This is the first time we have shown that there is an optimal number of thf groups in a thyclotide to achieve maximal cell uptake and biological activity, and it is intriguing that the best activities are realized without placing thf groups at every position in the sequence.
Figure 8.
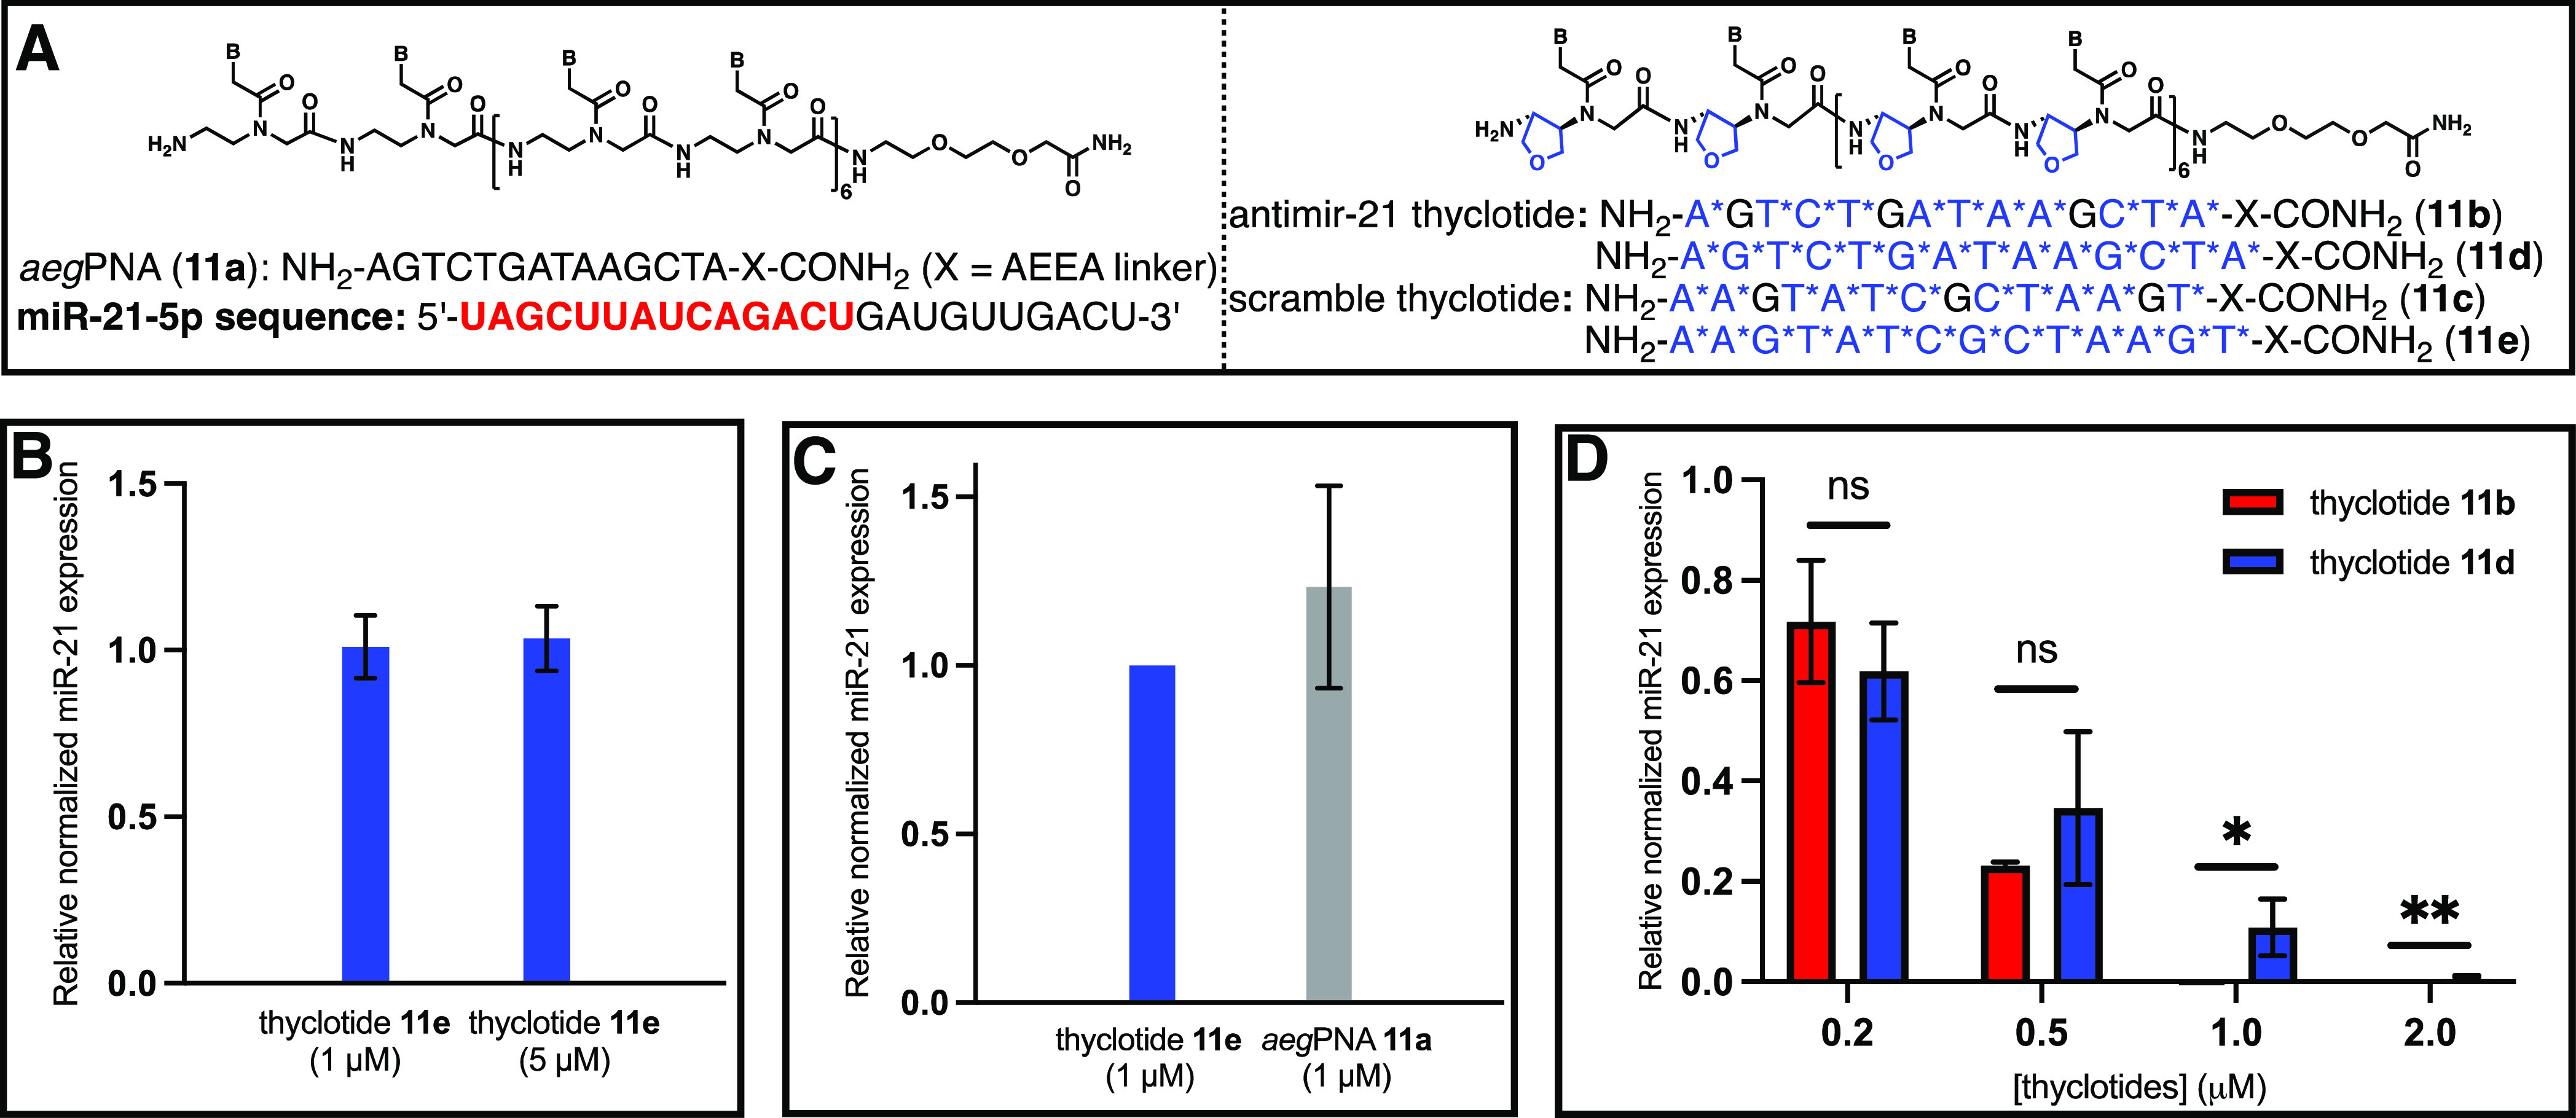
11-thf and 14-thf thyclotides (11b and 11d) inhibit miR-21. (A) AntimiR-21 aegPNA 11a, antimiR-21 thyclotides 11b and 11d, and scramble thyclotides 11c and 11e for RT-qPCR of miR-21. B* represents thf residue, and X represents 2-aminoethoxy-2-ethoxy acetic acid (AEEA linker). (B) RT-qPCR of miR-21 expression in HCT116 cells treated with 1 or 5 μM scramble thyclotide 11e. miR-21 expression was normalized to non-treated cells. N = 3. (C) RT-qPCR of miR-21 expression in HCT116 cells treated with 1 μM antimiR-21 aegPNA 11a. miR-21 expression was normalized to scramble thyclotide 11e-treated cells. N = 3. (D) RT-qPCR of miR-21 expression in HCT116 cells after treatment at varying concentrations of antimiR-21 thyclotide 11b and 11d. N = 3. Quantification was normalized to scramble thyclotide 11c or 11e. All RT-qPCRs used the combination of miR-25-5p and miR-93-5p as endogenous controls. The difference between miR-21 expressions after thyclotides 11b and 11d treatments was statistically significant using a one-tail paired t-test at 1 μM (P = 0.0411) and 2 μM (P = 0.0033).
Conclusions
Conformationally constrained thf-derived PNAs (thyclotides) exhibit remarkable binding properties and uptake by HCT116 cells. Incorporation of thyclotide monomers into PNAs enhances binding affinity and sequence specificity with DNA and RNA targets. CD experiments and an X-ray structure of thyclotide–DNA showed that the thf units rigidify the PNA backbone and preorganize PNAs into a right-hand helix. The polar thf units increase hydration compared with cpPNA, both in the solid state and in solution. This increased hydration may also contribute to the somewhat lower stability observed with thyclotide–oligonucleotide duplexes compared with the corresponding cpPNA duplexes. The increased binding properties and polarity of thyclotides seem to work in concert to promote the uptake of a thyclotide into HCT116 cells and to effectively inhibit the expression of miR-21. For the antimiR-21 sequence studied, there is an optimal number of thf groups in the thyclotide that results in the most potent biological activities in HCT116 cells. The sensitivity of cell uptake to the different numbers of thf groups in the sequence indicates that the chemical and physical properties of thyclotides can be finely tuned to maximize their biological activities. These unique properties will hopefully spark widespread use of thyclotides in a variety of applications across many areas of biomedical research.
Methods
All materials and methods used including PNA/thyclotide synthesis, UV melting experiments, thermodynamic analysis, CD experiments, X-ray diffraction analysis, osmotic stressing experiments, and cell experiments are described in full detail in the Supporting Information.
Relative Polarities by HPLC
Thyclotide 3i, aegPNA 1a, mixPNA 4a, and cpPNA 2a were dissolved in water to make 300 μM solutions. The four solutions were mixed in a 1:1:1:1 ratio, and the resulting solution was analyzed by HPLC (see page S4 for details).
Octanol Water Partition Coefficient (Kow) Measurement
To the PNA solutions (3i, 1a, 4a, and 2a) (300 μM in water, 200 μL) was added 200 μL of 1-octanol at room temperature (21.7 °C). The resulting solutions were vigorously shaken and sonicated for 1 h. Then, the resulting solutions were centrifuged to form solutions with two layers. The 1-octanol layer (100 μL) was diluted with DMSO (100 μL), and the resulting solution (100 μL) was injected into an Agilent (Santa Clara, CA) 1260 Series RP-HPLC using ultraviolet detection at 260 nm for analysis. The water layer (100 μL) was diluted with DMSO (100 μL), and the resulting solution (10 μL) was analyzed by HPLC (see page S4 for details). The Kow values (Table S2) were determined as the formula Kow = Ao/(Aw × 10), where Ao is the area under PNA peaks in the HPLC chromatogram for the 1-octanol layer, and Aw is the area under PNA peaks in the HPLC chromatogram for the water layer. Since 100 μL 1-octanol layer solution and 10 μL water solution were injected to HPLC for analysis, a factor of 10 was added to adjust the formula.
Acknowledgments
We thank John Lloyd (NIDDK/NIH) for performing mass spectrometry and Robert O’Connor (NIDDK/NIH) for his assistance with NMR spectroscopy. We also would like to thank Francisco Moris, Nicolas Ríos-Lombardia, and Javier Sabin-Gonzalez from the company Entrechem (Spain) for helping us to produce the chiral starting material (for the preparation of thyclotide monomers) via an enzymatic resolution.
Glossary
Abbreviations
- thf
tetrahydrofuran
- cp
cyclopentane
- PNA
peptide nucleic acid
Supporting Information Available
The Supporting Information is available free of charge at https://pubs.acs.org/doi/10.1021/jacsau.3c00198.
Preparation of PNA and thyclotide oligomers; polarity experiments; UV melting experiments; thermodynamic analysis; circular dichroism (CD) experiments; preparation and purification of iodo-labeled thyclotide–DNA duplex; crystallization and X-ray diffraction analysis of the thyclotide 8–DNA duplex; osmotic stressing experiments (hydration); cell experiments; HPLC chromatograms and mass spectra; NMR spectra; Figures S1–S113, Scheme S1, and Tables S1–S19 (PDF)
Author Contributions
# H.Z. and V.C. contributed equally to this work.
Author Contributions
D.H.A., H.Z., and V.C. conceived and designed the experiments. H.Z. and H.A. prepared and purified thyclotide monomers and iodo-labeled thyclotide monomer. H.Z. prepared and purified all PNAs and thyclotides. H.Z. measured Tm’s of PNA–DNA (RNA) duplexes and thyclotide–DNA (RNA) duplexes. H.Z. performed CD experiments on PNAs and thyclotides. H.Z. conducted the HPLC analyses and purifications of the thyclotide–DNA duplex. I.B. grew the single crystals and solved the crystal structure of the thyclotide–DNA duplex. S.J.M. and H.Z. analyzed the UV melting curves to obtain the thermodynamic parameters and Δnw. V.C. performed all cell experiments. H.Z., V.C., and D.H.A. co-wrote the paper. D.H.A. supervised the entire study. All authors contributed to the final version of the paper.
This research was supported by the Intramural Research Program of NIDDK, NIH. Coordinates and structure factors of the thyclotide 8–DNA duplex were deposited into the Protein Data Bank (PDB ID: 7UID).
The authors declare the following competing financial interest(s): Part of this work has been patented (Thyclotide. WO2021211786A1). Inventors: Daniel H. Appella, Hongchao Zheng, Harsha C. Amarasekara, Victor Clausse, George A. Kubi.
Supplementary Material
References
- Uhlmann E.; Peyman A. Antisense oligonucleotides: a new therapeutic principle. Chem. Rev. 1990, 90, 543–584. 10.1021/cr00102a001. [DOI] [Google Scholar]
- Goodchild J. Conjugates of oligonucleotides and modified oligonucleotides: a review of their synthesis and properties. Bioconjugate Chem. 1990, 1, 165–187. 10.1021/bc00003a001. [DOI] [PubMed] [Google Scholar]
- Sharma V. K.; Sharma R. K.; Singh S. K. Antisense oligonucleotides: modifications and clinical trials. Med. Chem. Commun. 2014, 5, 1454–1471. 10.1039/C4MD00184B. [DOI] [Google Scholar]
- Dhuri K.; Bechtold C.; Quijano E.; Pham H.; Gupta A.; Vikram A.; Bahal R. Antisense oligonucleotides: an emerging area in drug discovery and development. J. Clin. Med. 2020, 9, 2004. 10.3390/jcm9062004. [DOI] [PMC free article] [PubMed] [Google Scholar]
- Nielsen P. E.; Egholm M.; Berg R. H.; Buchardt O. Sequence-selective recognition of DNA by strand displacement with a thymine-substituted polyamide. Science 1991, 254, 1497–1500. 10.1126/science.1962210. [DOI] [PubMed] [Google Scholar]
- Egholm M.; Buchardt O.; Nielsen P. E.; Berg R. H. Peptide nucleic acids (PNA). Oligonucleotide analogs with an achiral peptide backbone. J. Am. Chem. Soc. 1992, 114, 1895–1897. 10.1021/ja00031a062. [DOI] [Google Scholar]
- Nielsen P. E. Peptide nucleic acid. A molecule with two identities. Acc. Chem. Res. 1999, 32, 624–630. 10.1021/ar980010t. [DOI] [Google Scholar]
- Nielsen P. E. Peptide nucleic acid: a versatile tool in genetic diagnostics and molecular biology. Curr. Opin. Biotechnol. 2001, 12, 16–20. 10.1016/S0958-1669(00)00170-1. [DOI] [PubMed] [Google Scholar]
- Nielsen P. E. PNA technology. Mol. Biotechnol. 2004, 26, 233–248. 10.1385/MB:26:3:233. [DOI] [PubMed] [Google Scholar]
- Egholm M.; Nielsen P. E.; Buchardt O.; Berg R. H. Recognition of guanine and adenine in DNA by cytosine and thymine containing peptide nucleic acids (PNA). J. Am. Chem. Soc. 1992, 114, 9677–9678. 10.1021/ja00050a068. [DOI] [Google Scholar]
- Egholm M.; Buchardt O.; Christensen L.; Behrens C.; Freier S. M.; Driver D. A.; Berg R. H.; Kim S. K.; Norden B.; Nielsen P. E. PNA hybridizes to complementary oligonucleotides obeying the Watson-Crick hydrogen-bonding rules. Nature 1993, 365, 566–568. 10.1038/365566a0. [DOI] [PubMed] [Google Scholar]
- Wittung P.; Nielsen P. E.; Buchardt O.; Egholm M.; Norden B. DNA-like double helix formed by peptide nucleic acid. Nature 1994, 368, 561–563. 10.1038/368561a0. [DOI] [PubMed] [Google Scholar]
- Weiler J.; Gausepohl H.; Hauser N.; Jensen O. N.; Hoheisel J. D. Hybridisation based DNA screening on peptide nucleic acid (PNA) oligomer arrays. Nucleic Acids Res. 1997, 14, 2792–2799. [DOI] [PMC free article] [PubMed] [Google Scholar]
- Ratilainen T.; Homén A.; Tuite E.; Nielsen P. E.; Nordén B. Thermodynamic of sequence-specific binding of PNA to DNA. Biochemistry 2000, 39, 7781–7791. 10.1021/bi000039g. [DOI] [PubMed] [Google Scholar]
- Pandey V. N.; Upadhyay A.; Chaubey B. Prospects for antisense peptide nucleic acid (PNA) therapies for HIV. Expert Opin. Biol. Ther. 2009, 9, 975–989. 10.1517/14712590903052877. [DOI] [PMC free article] [PubMed] [Google Scholar]
- Ray A.; Nordén B. Peptide nucleic acid (PNA): its medical and biotechnical application and promise for the future. FASEB J. 2000, 14, 1041–1060. 10.1096/fasebj.14.9.1041. [DOI] [PubMed] [Google Scholar]
- Sardone V.; Zhou H.; Muntoni F.; Ferlini A.; Falzarano M. S. Antisense oligonucleotide-based therapy for neuromuscular disease. Molecules 2017, 22, 563. 10.3390/molecules22040563. [DOI] [PMC free article] [PubMed] [Google Scholar]
- Ghosal A. Peptide nucleic acid antisense oligomers open an avenue for developing novel antibacterial molecules. J. Infect. Dev. Ctries. 2017, 11, 212–214. 10.3855/jidc.9159. [DOI] [PubMed] [Google Scholar]
- Dean D. A. Peptide nucleic acids: versatile tools for gene therapy strategies. Adv. Drug Delivery Rev. 2000, 44, 81–95. 10.1016/S0169-409X(00)00087-9. [DOI] [PMC free article] [PubMed] [Google Scholar]
- Stender H. PNA fish: an intelligent stain for rapid diagnosis of infectious diseases. Expert. Rev. Mol. Diagn. 2003, 3, 649–655. 10.1586/14737159.3.5.649. [DOI] [PubMed] [Google Scholar]
- Roberto G. Biological activity and delivery of peptide nucleic acid (PNA)-DNA chimeras for transcription factor decoy (TFD) pharmacotherapy. Curr. Med. Chem. 2004, 11, 1253–1263. 10.2174/0929867043365242. [DOI] [PubMed] [Google Scholar]
- Siddiquee S.; Rovina K.; Azriah A. A review of peptide nucleic acid. Adv. Tech. Biol. Med. 2015, 3, 1000131. [Google Scholar]
- Wu J.; Meng Q.; Ren H.; Wang H.; Wu J.; Wang Q. Recent advances in peptide nucleic acid for cancer bionanotechnology. Acta Pharmacol. Sin. 2017, 38, 798–805. 10.1038/aps.2017.33. [DOI] [PMC free article] [PubMed] [Google Scholar]
- Perera J. D. R.; Carufe K. E. W.; Glazer P. M. Peptide nucleic acids and their role in gene regulation and editing. Biopolymers 2021, 112, e23460 10.1002/bip.23460. [DOI] [PubMed] [Google Scholar]
- Nielsen P. E. Addressing the challenges of cellular delivery and bioavailability of peptide nucleic acids (PNA). Q. Rev. Biophys. 2006, 38, 345–350. [DOI] [PubMed] [Google Scholar]
- Corradini R.; Sforza S.; Tedeschi T.; Totsingan F.; Manicardi A.; Marchelli R. Peptidenucleic acids with a structurally biased backbone. Updated review and emerging challenges. Curr. Top. Med. Chem. 2011, 11, 1535–1554. 10.2174/156802611795860979. [DOI] [PubMed] [Google Scholar]
- Rozners E. Recent advances in chemical modification of peptide nucleic acids. J. Nucleic Acids 2012, 2012, 518162 10.1155/2012/518162. [DOI] [PMC free article] [PubMed] [Google Scholar]
- Sugiyama T.; Kittaka A. Chiral peptide nucleic acids with a substituent in the N-(2-aminoethy)glycine backbone. Molecules 2013, 18, 287–310. 10.3390/molecules18010287. [DOI] [PMC free article] [PubMed] [Google Scholar]
- Moccia M.; Adamo M. F. A.; Saviano M. Insights on chiral, backbone modified peptide nucleic acids: properties and biological activity. Artif. DNA PNA XNA 2014, 5, e1107176 10.1080/1949095X.2015.1107176. [DOI] [PMC free article] [PubMed] [Google Scholar]
- Bordyagin N.; Katkevics M.; Kotikam V.; Ryan C. A.; Rozners E. Chemical approaches to discover the full potential of peptide nucleic acids in biomedical applications. Beilstein J. Org. Chem. 2021, 17, 1641–1688. 10.3762/bjoc.17.116. [DOI] [PMC free article] [PubMed] [Google Scholar]
- Suparpprom C.; Vilaivan T. Perspectives on conformationally constrained peptide nucleic acid (PNA): Insights into the structural design, properties and applications. RSC Chem. Biol. 2022, 3, 648–697. 10.1039/D2CB00017B. [DOI] [PMC free article] [PubMed] [Google Scholar]
- Shiraishi T.; Nielsen P. E. Peptide nucleic acid (PNA) cell penetrating peptide (CPP) conjugates as carriers for cellular delivery of antisense oligomers. Artif. DNA PNA XNA 2011, 2, 90–99. 10.4161/adna.18739. [DOI] [PMC free article] [PubMed] [Google Scholar]
- Gupta A.; Bahal R.; Gupta M.; Glazer P. M.; Saltzman W. M. Nanotechnology for delivery of peptide nucleic acids (PNAs). J. Controlled Release 2016, 240, 302–311. 10.1016/j.jconrel.2016.01.005. [DOI] [PMC free article] [PubMed] [Google Scholar]
- Shiraishi T.; Nielsen P. E. Nanomolar cellular antisense acitivity of peptide nucleic acid (PNA) cholic acid (“umbrella)” and cholesterol conjugates delivered by cationic lipids. Bioconjugate Chem. 2012, 23, 196–202. 10.1021/bc200460t. [DOI] [PubMed] [Google Scholar]
- Gasparello J.; Manicardi A.; Casnati A.; Corradini R.; Gambari R.; Finotti A.; Sansone F. Efficient cell penetration and delivery of peptide nucleic acids by an argininocalix[4]arene. Sci. Rep. 2019, 9, 3036. 10.1038/s41598-019-39211-4. [DOI] [PMC free article] [PubMed] [Google Scholar]
- Soudah T.; Mogilevsky M.; Karni R.; Yavin E. CLIP6-PNA-Peptide Conjugates: Non-Endosomal Delivery of Splice Switching Oligonucleotides. Bioconjugate Chem. 2017, 28, 3036–3042. 10.1021/acs.bioconjchem.7b00638. [DOI] [PubMed] [Google Scholar]
- Zheng H.; Botos I.; Clausse V.; Nikolayevskiy H.; Rastede E. E.; Fouz M. F.; Mazur S. J.; Appella D. H. Conformational constraints of cyclopentane peptide nucleic acids facilitate tunable binding to DNA. Nucleic Acids Res. 2021, 49, 713–725. 10.1093/nar/gkaa1249. [DOI] [PMC free article] [PubMed] [Google Scholar]
- Clausse V.; Zheng H.; Amarasekara H.; Kruhlak M.; Appella D. H. Thyclotide, tetrahydrofuran-modified peptide nucleic acid that efficiently penetrate cells and inhibit microRNA-21. Nucleic Acids Res. 2022, 50, 10839–10856. 10.1093/nar/gkac864. [DOI] [PMC free article] [PubMed] [Google Scholar]
- Zhuang B.; Ramanauskaite G.; Koa Z.; Wang Z. Like dissolves like: A first-principles theory for predicting liquid miscibility and mixture dielectric constant. Sci. Adv. 2021, 7, eabe7275 10.1126/sciadv.abe7275. [DOI] [PMC free article] [PubMed] [Google Scholar]
- Pitzer K. S.; Donath W. E. Conformations and strain energy of cyclopentane and its derivatives. J. Am. Chem. Soc. 1959, 81, 3213–3218. 10.1021/ja01522a014. [DOI] [Google Scholar]
- Ratilainen T.; Norden B. Thermodynamics of PNA interactions with DNA and RNA. Methods Mol. Biol. 2002, 208, 59–88. 10.1385/1-59259-290-2:59. [DOI] [PubMed] [Google Scholar]
- Fox J. M.; Zhao M.; Fink M. J.; Kang K. K.; Whitesides G. M. The molecular origin of enthalpy/entropy compensation in biomolecular recognition. Annu. Rev. Biophys. 2018, 47, 223–250. 10.1146/annurev-biophys-070816-033743. [DOI] [PubMed] [Google Scholar]
- Sforza S.; Haaima G.; Marchelli R.; Nielsen P. E. Chiral peptide nucleic acids (PNAs): helix handedness and DNA recognition. Eur. J. Org. Chem. 1999, 197–204. . [DOI] [Google Scholar]
- Kypr J.; Kejnovská I.; Renciuk D.; Vorlícková M. Circular dichroism and conformational polymorphism of DNA. Nucleic Acids Res. 2009, 37, 1713–1725. 10.1093/nar/gkp026. [DOI] [PMC free article] [PubMed] [Google Scholar]
- Lotan N.; Yaron A.; Berger A. The stabilization of the α-helix in aqueous solution by hydrophobic side chain interaction. Biopolymers 1966, 4, 365–368. 10.1002/bip.1966.360040309. [DOI] [Google Scholar]
- Monera O. D.; Sereda T. J.; Zhou N. E.; Kay C. M.; Hodges R. S. Relationship of sidechain hydrophobicity and α-helical propensity on the stability of the single-stranded amphipathic α-helix. J. Pept. Sci. 1995, 1, 319–329. 10.1002/psc.310010507. [DOI] [PubMed] [Google Scholar]
- Taylor G. L. Introduction to phasing. Acta Crystallogr., Sect. D: Biol. Crystallogr. 2010, 66, 325–338. 10.1107/S0907444910006694. [DOI] [PMC free article] [PubMed] [Google Scholar]
- Lavery R.; Sklenar H. Defining the structure of irregular nucleic acids: conventions and principles. J. Biomol. Struct. Dyn. 1998, 6, 63–91. 10.1080/07391102.1989.10507728. [DOI] [PubMed] [Google Scholar]
- Betts L.; Jpsey J. A.; Veal J. M.; Joedan S. R. A nucleic acid triplex formed by a peptide nucleic acid–DNA complex. Science 1995, 270, 1838–1841. 10.1126/science.270.5243.1838. [DOI] [PubMed] [Google Scholar]
- Eriksson M.; Nielsen P. E. Solution structure of a peptide nucleic acid–DNA duplex. Nat. Struct. Biol. 1996, 3, 410–413. 10.1038/nsb0596-410. [DOI] [PubMed] [Google Scholar]
- The J. I.; Shivachev B.; Rsapireddy S.; Crawford M. J.; Gil R. R.; Du S.; Madrid M.; Ly D. H. Crystal structure of chiral γPNA with complementary DNA strand: Insights into the stability and specificity of recognition and conformational preorganization. J. Am. Chem. Soc. 2010, 132, 10717–10727. [DOI] [PMC free article] [PubMed] [Google Scholar]
- Menchise V.; De Simone G.; Tedeschi T.; Corradini R.; Sforza S.; Marchelli R.; Capasso D.; Saviano M.; Pedone C. Insights into peptide nucleic acid (PNA) structural features: The crystal structure of a D-lysine-based chiral PNA–DNA duplex. Proc. Natl. Acad. Sci. U. S. A. 2003, 100, 12021–12026. 10.1073/pnas.2034746100. [DOI] [PMC free article] [PubMed] [Google Scholar]
- Bloomfield V. A.; Crothers D. M.; Tinoco I. Jr. Nucleic acids: structures, properties, and functions. University Science Books; 2000. [Google Scholar]
- Carugo O.; Bordo D. How many water molecules can be detected by protein crystallography?. Acta Crystallogr., Sect. D: Biol. Crystallogr. 1999, 55, 479–483. 10.1107/S0907444998012086. [DOI] [PubMed] [Google Scholar]
- Saenger W.; Saenger W.. Water and nucleic acids. In Principles of Nucleic Acid Structure. Saenger W. ed. Springer, 1984, pp. 368–384, 10.1007/978-1-4612-5190-3_17. [DOI] [Google Scholar]
- Spink C. H.; Chaires J. B. Effects of Hydration, Ion Release, and Excluded Volume on the Melting of Triplex and Duplex DNA. Biochemistry 1999, 38, 496–508. 10.1021/bi9820154. [DOI] [PubMed] [Google Scholar]
- Rozners E.; Moulder J. Hydration of Short DNA, RNA and 2’-OMe Oligonucleotides Determined by Osmotic Stressing. Nucleic Acids Res. 2004, 32, 248–254. 10.1093/nar/gkh175. [DOI] [PMC free article] [PubMed] [Google Scholar]
- Pfeffer S. R.; Yang C.; Pfeffe L. M. The role of miR-21 in cancer. Drug Dev. Res. 2015, 76, 270–277. 10.1002/ddr.21257. [DOI] [PubMed] [Google Scholar]
- Kura B.; Kalocayova B.; Devaux Y.; Bartekova M. Potential clinical implications of miR-1 and miR-21 in heart disease and cardioprotection. Int. J. Mol. Sci. 2020, 21, 700. 10.3390/ijms21030700. [DOI] [PMC free article] [PubMed] [Google Scholar]
- Sheedy F. J. Turning 21: introduction of miR-21 as a key switch in the inflammatory response. Front. Immunol. 2015, 6, 19. 10.3389/fimmu.2015.00019. [DOI] [PMC free article] [PubMed] [Google Scholar]
- Jenike A. E.; Halushka M. K. miR-21: a non-specific biomarker of all maladies. Biomark. Res. 2021, 9, 18. 10.1186/s40364-021-00272-1. [DOI] [PMC free article] [PubMed] [Google Scholar]
- Matsson P.; Kihlberg J. How big is too big for cell permeability?. J. Med. Chem. 2017, 60, 1662–1664. 10.1021/acs.jmedchem.7b00237. [DOI] [PubMed] [Google Scholar]
- Ferraro A.; Kontos C. K.; Boni T.; Bantounas I.; Siakouli D.; Kosmidou V.; Spyridakis Y.; Tsipras I.; Zografos G.; Pintzas A. Epigenetic regulation of miR-21 in colorectal cancer. Epigenetics 2014, 9, 129–141. 10.4161/epi.26842. [DOI] [PMC free article] [PubMed] [Google Scholar]
Associated Data
This section collects any data citations, data availability statements, or supplementary materials included in this article.