

Abstract
We developed and conducted a community based randomized controlled trial to evaluate the impact of an intervention to promote retirement saving among low and moderate income, predominantly Spanish speaking Hispanics, who do not have access to an employer sponsored retirement account. Our educational intervention provided participants with key information related to financial planning for retirement in Spanish and made use of “behavioral nudges” to encourage participants to open a federal sponsored retirement saving account, my Retirement Account (myRA). Among 142 participants (70 and 72 in control and treatment groups, respectively), we found a significant difference-in-difference (DD) on the proportion of those who opened a myRA. In the treatment group we had 14 percent of participants opened myRA, while in the control group we had no one. Results from a DD regression show that after controlling for observable and unobservable characteristics through our design as a randomized controlled trial, the effect of our intervention is 12 percent. When we restrict our sample to those participants who had a bank account at some point of the study, we find that the effect of our intervention is higher (17 percent). We also found that our intervention is effective increasing self-reported knowledge related to retirement saving and preparedness.
Introduction
While the lack of retirement savings is widespread among people in the United States, this problem affects racial and ethnic minorities to a greater degree. Among retirees, it is observed that Hispanics and blacks are less likely than whites to have retirement savings in the form of 401(k) and IRA. The latest Report on the Economic Well-Being of US Households in 2018 shows that while 21% of whites have no retirement saving, 36% and 39% of blacks and Hispanics have none, respectively (Federal Reserve 2019). Data from this report also show that minorities feel less prepared when it comes to retirement. When households are asked if they perceive that their savings for retirement are on track, 42% of whites feel they are on track, but only 25% and 23% of blacks and Hispanics feel that way, respectively (Federal Reserve 2019).
When it comes to retirement preparedness, Hispanics face barriers to a higher degree than other groups. Even after controlling for age and income, Hispanics are less likely to have access to an employer-sponsored retirement plan in comparison to whites (Rhee 2013). Furthermore, In a study conducted by Prudential (2014), 56% of Hispanics surveyed expressed that they have a “poor” or “very poor” understanding of the U.S. Social Security System and employer-sponsored retirement plans overall. Qualitative studies have also shown that Hispanics have low levels of self-reported retirement preparedness and Social Security literacy and face significant behavioral and cultural barriers towards financial planning for retirement (Blanco et al. 2017; Fontes 2011; Ravinovich et al. 2017; Richman et al. 2015).
We developed and conducted a community-based randomized controlled trial (RCT) to evaluate the impact of an intervention to promote retirement saving among low and moderate income, predominantly Spanish speaking Hispanics. We designed our educational intervention to provide participants with key information related to financial planning for retirement in Spanish and made use of “behavioral nudges” to encourage participants to open a my Retirement Account (myRA). The myRA program was a federally sponsored retirement saving plan that had the goal to make retirement simple and accessible to individuals who did not have access to retirement saving plans through an employer. We partnered with two community organizations in Los Angeles area, and designed our intervention as a randomized controlled trial with a wait-list control group.
Among 142 participants (70 and 72 in control and treatment groups, respectively), we found a significant Difference in Differences (DD) on the proportion of those who opened a myRA. In the treatment group we had 14% of participants open a myRA, while in the control group we had no one. Results from a DD regression show that after controlling for observable and unobservable characteristics through our design as an RCT, the effect of our intervention was 12%. When we restrict our sample to those participants who had a bank account at some point of the study, we find that the effect of our intervention was higher (17%). Using the a Retirement Knowledge Indicator (RKI) we developed for this study, we found that our intervention is effective in increasing self-reported knowledge related to retirement preparedness and saving.
We contribute to the literature in several ways. First, our intervention aims to address racial and ethnic disparities, as to our knowledge this is the first study that conducts an educational intervention to promote retirement savings focused on Hispanics. Compared to other racial/ethnic groups Hispanics are less likely to have any form of retirement savings. They are also the largest minority group in the U.S. and are expected to grow significantly, reaching 29% of the U.S. population by 2060 (Colby and Ortman 2015). Thus, in providing evidence that an intervention like ours can be successful in promoting retirement savings, we offer policymakers a well-reasoned course of action to improve the wellbeing of Hispanics.
Second, we are one of the first studies to conduct an educational intervention to promote retirement savings using a community-based approach. All previous interventions focused on promoting retirement knowledge have been done in the workplace, and relied on the ability of the individual to open a retirement savings account through an employer. We are the first study to evaluate an intervention promoting a government-sponsored retirement saving plan among individuals who lack access to such resources through their employer. Our findings are especially relevant in light of new state sponsored retirement saving plans, such as the CalSavers program in California, among others.
Third, we designed and piloted the use of a simple RKI to measure self-reported knowledge about financial planning for retirement in our intervention. An indicator of this nature is crucial in order to better understand where are the informational gaps among minorities. Thus, we contribute to the literature by providing a simple measure to asses knowledge about financial planning for retirement among low and moderate income individuals, and that is appropriate for Spanish speaking individuals. A modified version of the RKI developed and piloted in this intervention will be included in the 2019 experimental module of the Health and Retirement Study (HRS).
Our paper is organized as follows. We describe previous work on educational programs to promote retirement saving and our intervention. Then we cover in detail our research design, data and estimation strategy and present the results. Finally, we provide a discussion of our findings and a conclusion.
Previous Work
As noted previously in the introduction, certain segments of the population fare worse than others when it comes to retirement knowledge and savings. In fact, data from the HRS, National Capability Study, and National Longitudinal Survey of Youth show that women, minorities, younger individuals, and those without a college education all have relatively lower levels of financial knowledge, and are consequently less prepared for retirement (Lusardi and Mitchell 2011a, 2011b; Lusardi et al. 2010).
In a 2011 study assessing financial literacy, Lusardi and Mitchell (2011a) found that while 72% of whites correctly answer a question regarding the nature and importance of compound interest in the HRS, only 54% and 47% of blacks and Hispanics answered this question correctly.1 Further blacks and Hispanics are more likely to answer that they do not know the answer to the compound interest question than whites (7% for whites versus 16% for blacks and 14% for Hispanics) in Lusardi’s and Mitchell (2011a) study. As for education levels, in this same study, individuals with a high school diploma were more likely to answer the same question correctly than those with only elementary school by more than double (65% versus 30%). HRS data also shows that females were less likely than males to answer the compound interest question correctly by 13 percentage points and to answer that they do not the answer by 6 percentage points (Lusardi and Mitchell 2011a).
The Report on the Economic Well-Being of US Households in 2018, besides showing that minorities lag behind on retirement preparedness as discussed in introduction, also shows that women are less likely than men to feel comfortable managing their retirement investment at all different levels of education (Federal Reserve 2019). In this report it is also observed that younger individuals are less likely to have no retirement savings and to feel that their retirement savings are on track. Among individuals 18-29 years old, 42% have no retirement savings, and only 26% perceive retirement savings to be on track. Comparing this group with the next age group (individuals 30-44 years old), only 26% have no retirement savings and 35% perceive their retirement savings as being on track. Thus, it is important to design and evaluate interventions that aim at improving both financial knowledge and retirement saving among the segments of the population that lag behind in these areas.
When promoting retirement saving, most research in the area of behavioral economics has concluded that auto enrollment on retirement saving plans is the most effective way to get people to save (Choi et al. 2006; Benartzi and Thaler 2007; Thaler and Sustein 2009). The behavioral economics literature has emphasized the need to work with inertia in order to get people to save for retirement. For example, Beshears et al. (2013) have found that using a tool called “Quick enrollment” in a set up in which there is no automatic enrollment, where employees have the option to enroll in a retirement savings plan that has an asset allocation and contribution rate pre-selected by the employer, increases self-initiated enrollment in retirement saving programs.
A large segment of the population, especially women and minorities, are less likely to have access to employer-sponsored retirement saving plans. Because the auto-enrollment nudge is not available for everyone, it is necessary to explore the role of financial education when it comes to getting people to save for retirement. Thus, our review of the literature here focuses on educational interventions that aim at promoting opening a retirement account.
Evaluations of the effectiveness of educational programs for retirement planning and saving are scant, especially those undertaken at the community level. Most studies on the effectiveness of educational programs for retirement planning and saving have been done in the workplace set up (university or company), where participants of the study have access to employer-sponsored retirement plans. These studies find positive but small effects from such educational interventions. Lusardi et al. (2009) studied the impact of education on retirement saving using a RCT design. In her study she sent to the control group the common information package for new employees, and for the treatment group she sent a planning aid that explained clearly and briefly how to save for retirement. She found that those in the treatment group showed higher enrollment in retirement saving programs.2 Duflo and Saez (2003) also conducted a RCT to evaluate the impact of providing an incentive to attend a benefits fair and the peer effects of attendance to the fair. They find that attendance to the benefits fair led to higher rates of participation in a retirement saving plan among those who attended the fair and also their peers.
Two more recent studies conducted in a workplace set up show that an educational intervention can be effective promoting retirement saving. In a RCT online educational intervention among employees in 45 credit unions in Wisconsin, Collins and Urban (2016) find that there was an increase on retirement saving among those who received the intervention by 6 percentage points after one month. Furthermore, Clark et al. (2017) tested out the effectiveness of an “informational nudge” that provides key information on supplemental saving plans and emphasizes the benefits from retirement saving among older (50-69 year old) state government employees in North Carolina. They also find that an informational nudge is effective getting employees to increase retirement saving.
Table 1 shows the effect of the educational interventions to promote enrollment on retirement savings plans discussed here. In this table we present the percentage change on enrollment for the control and treatment groups, and the difference between these groups for the studies discussed here. None of the studies discussed here provided information on the race and ethnicity of study participants. As discussed in the introduction, data show that minorities are significantly disadvantaged in relation to retirement preparedness when comparing to other racial and ethnic groups. Thus, further work specific to targeting minorities is crucial.
Table 1.
Effect of retirement educational program on enrollment on retirement savings plans
| Study | Tool (time in months) | Control (%Δ) |
Treatment (%Δ) |
DD |
|---|---|---|---|---|
| Duflo and Saez (2003) | Benefits fair, department (4.5) | 4.0 | 4.9 | 0.9 |
| Benefits fair, department (11) | 7.5 | 8.9 | 1.4 | |
| Lusardi et al. (2009) | Planning aid, 8 step (2) | 29 | 45 | 16 |
| Beshears et al. (2013) | Quick enrollment (1) | 7 | 18 | 11 |
| Quick enrollment (12) | 22 | 44 | 22 | |
| Collins and Urban (2016) | Online program (1) | NA | NA | 6 |
| Clark et al. (2017) | Informational nudge (1) | 2.8 | 3.8 | 1 |
“%Δ” denotes percentage change in opening a retirement account between pre- and post- intervention. “DD” denotes the Difference in Difference between control and treatment. “NA” denotes estimate not available (i.e. not provided in manuscript).
Most interventions that promote retirement savings provide participants with financial knowledge. In fact, Lusardi and Mitchell (2017) provide evidence of a causal relationship between financial literacy and retirement planning, where those who have more financial knowledge are better prepared financially for retirement. They argue that the effect of financial literacy on retirement planning is “sizable.” Financial knowledge, especially knowledge specific to retirement saving, should be recognized as an outcome in addition to whether individuals opened a retirement account.
Furthermore, when providing individuals with financial knowledge through an intervention, it is important to evaluate whether the acquisition of such knowledge results in desirable behaviors specific to money management. Dew and Xiao (2011) developed and validated a scale that measures financial management behaviors in three domains: 1) cash flow management, 2) credit management, and 3) savings and investment management. It is argued that there is a hierarchical pattern of financial management behaviors in the order mentioned here, where it is easier for individuals to improve their cash flow management than to improve credit and saving and investment management. Improving saving and investment management is the most difficult behavioral change to achieve, given that flexibility for this behavioral change is conditional on income, existing wealth, and financial commitments like educational debt (Hilgert et al. 2003).
Our Intervention
Because previous work has shown the importance of financial knowledge when it comes to planning for retirement (Clark et al. 2012; Hung et al. 2009; Lusardi and Mitchell 2011a, 2017), it is important to design educational interventions that aim at promoting retirement saving and also greater knowledge on this area. A successful intervention not only relies on relevant information, but also incorporates “behavioral nudges” that have proven effective promoting action to overcome inertia and create behavioral change. Our intervention was designed along the lines of Fertig’s et al. (2015) intervention.
We designed our intervention “Yo Planeo Mi Retiro” (translation: I plan for my retirement) to address three behavioral barriers to retirement (Table 2). First, individuals are “immersed in the here and now” rather than focused on their future, and we aimed to make retirement vivid. Following the exercise developed by Fertig et al. (2015), we asked participants to visualize what they would like to do when they reach retirement age, what would be their needs and the level of income they will need to have to be able to support that life style, and what they can do today to better prepare for the future they visualize. We include in our online Supplemental Material the visualization exercise we used in our intervention (Figures A1 and A2, English and Spanish version).
Table 2.
Barriers towards retirement saving: Solutions and Tools
| Barrier | Solution | Our Intervention Tools |
|---|---|---|
| Immersed in the here and now | Make retirement vivid | Visualizing exercise |
| Social norm of not saving | Make retirement savings commonplace | Video, images, messages |
| Procrastination | Make participants accountable | Technology (access to computer, text messages), and personal commitment (poster) |
Table constructed by authors in a similar way as the table developed by Fertig et al. (2015).
Second, there is the “social norm of not saving for retirement” prevalent in the United States, and this is more marked among Hispanics who have parents that are less likely to plan for retirement (Blanco et al. 2017). According to Payne et al. (2014) financial socialization takes place among family members, where it shapes financial knowledge and behavior. To address this barrier, we need to make retirement savings commonplace among participants. In our intervention we used a short video provided by myRA in Spanish that shows how Hispanic workers in Miami were signing up for myRA.3 We also showed images and messages during our intervention that have the goal to make retirement commonplace among participants.4
Third, procrastination has been found as a major barrier to opening a retirement saving account (Choi et al. 2006; Beshears et al. 2013). Because we are unable to use auto-enrollment in myRA given the context of our study, we use technology and social pressure to make participants accountable. We asked participants to put their initials on a poster that said “I commit to open a retirement account in the next 6 months.” We conducted our intervention in a computer lab and devoted significant amount of our intervention to give participants the opportunity to open a myRA online. We provided support during the intervention, and also sent participants text message reminders about their commitment to open a retirement account before the 6 month deadline.5 A picture of our commitment poster is included in the online appendix (Figure A3).
The information presented in our intervention was very simple and all in Spanish. While the presentation was entirely in Spanish, we had the surveys and all materials also available in English for those participants that felt more comfortable reading and writing in English (all participants expressed being able to comprehend Spanish at the screening). The presentation was given by the same person for all participants in the treatment group. We covered the following four areas: 1) What is retirement? Barriers and Benefits, 2) How do retirement saving plans work? Compound interest and common types of retirement saving plans, 3) How to open a myRA, and 4) Recommendations. The presentation of material lasted 30 minutes approximately, where approximately 20 minutes were devoted to learning how to open the account on the computer, for a 50 minute total session.6 Selected images from our power point presentation are shown in the online Appendix 1 (Figures A4 and A5, selected slides, English and Spanish versions).7 Similar to Lusardi et al. (2009), we also designed a handout to inform participants in simple steps how to open myRA (refer to Figures A6 and A7, English and Spanish version). In this handout and in our presentations during the workshops, we also directed participants to a website that provided basic information related to retirement planning and provided links to some useful resources on the topic in Spanish and English available from other sources. Our created website had an easy to remember address, yoplaneomiretiro.com.8
It is important to note that we designed our intervention as a comprehensive intervention that aims at addressing different behavioral barriers we found relevant for our target population. It is not our intend to prove if a behavioral nudge is more effective over another one. Previous work has already shown that visualization, specific messaging, social pressure, small text messages, and technological assistance are useful tools promoting behavioral change. Thus, our purpose is to conduct the “best intervention” we could deliver given the available resources and that is culturally tailored.
Research Design, Data, and Estimation Strategy
We designed our study as an RCT with a wait-list control group. The treatment group attended a two-hour initial workshop, and during the first hour we explained the study to participants and asked them to fill out our survey, and in the second hour we cover our educational material. In the follow up workshop six months later, the treatment group only participated in one-hour workshop, where we asked participants to fill out the follow up survey, and we had a short conversation about financial preparedness for retirement.
The control group attended a one-hour initial workshop, where we only explained to them the nature of the study, gave them a promotional flyer of myRA, and asked them to fill out our baseline survey. The control group received the intervention at the follow up workshop six months later, which lasted two hours. For the control group follow up workshop, we asked them to fill out our survey and then provided them with the educational intervention. The reason for the reversal of the duration of the workshops among treatment and control group at baseline and follow up is that treatment received the educational intervention in the first workshop, which lasted an hour itself, while the control group received the intervention in the second workshop six months later.
We used block randomization to assign all participants in a specific workshop session to either control or treatment group status.9 Participants were allowed to choose the day that worked best with their schedule, given that we had several dates scheduled either late at night during the week or Saturday morning. We use block randomization, where we entered the number of workshops that we planned to have, and the system provided us with an assignment for each workshop as either control or treatment group. Our modified randomization procedure allowed participants to select the day on which they attended the study, which gave them greater control over their experience in the study.
Block randomization was appropriate given the nature of our study, where we take a community-based approach and were unsure about what sample size we will reach, recruited participants in different sites, and had some limitations related to logistics. While block randomization leads to balanced sample size in treatment and control groups, it does not ensure that both groups will be equal in relation to all covariates (Suresh 2011). This method of randomization generated two samples that were not identical in all covariates. We discuss the differences between the treatment and control group in more detail in this section.
Participants were given a $40 gift card for participation in each workshop. We conducted follow up phone calls with participants at one week, one month, and three months to gather information on whether they opened a myRA. Figure 1 shows a visual explanation of our interactions with participants from the different groups over time. Our study was approved by Pepperdine Institutional Review Board for Graduate and Professional Schools (Protocol Number 16-07-350).
Figure 1.
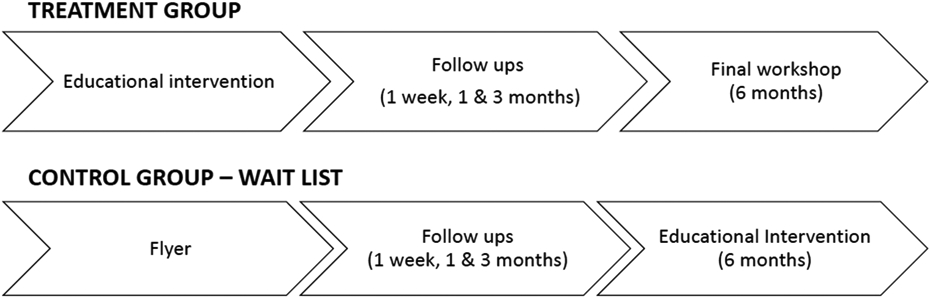
Yo Planeo Mi Retiro Educational Intervention Flow
We recruited participants for the study with the help of the Mexican American Opportunity Foundation (MAOF) and New Economics for Women (NEW). Both community organizations have the goal to promote asset building among the Hispanic community and have done extensive work promoting financial knowledge. This was the first time these organizations offered a workshop focused on financial planning for retirement. Our community partners played a key role helping with recruitment and provided us with a computer room to conduct our workshops. A third community organization, Central City Neighborhood Partners, also provided their facilities for the workshops, where MAOF assisted with the recruitment of participants for this location. It is also important to note that given that we take a community-based approach, the educational material used in our intervention was designed in close collaboration by the research team and MAOF staff. The program of myRA was important to these community partners since it provided an opportunity to open a retirement saving plan to individuals who did not have access to a retirement saving plan through their employer. With the help of our community partners, we conducted our intervention in four locations in the Los Angeles area: Downtown, Canoga Park, Commerce, and Van Nuys.
Our inclusion criteria for participants were: 1) have a social security number (SSN) or an Individual Taxpayer Identification Number (ITIN), which was a requirement to open a myRA, 2) must be between 30 and 64 years old, and 3) be proficient in Spanish. We targeted 30 and 64 years old individuals since this comprises individuals who are likely to be or have been in the labor force and had some years of experience working. We initially recruited only among women, but as some men were interested in the study we realized that our intervention was not gender specific, and that men could also benefit from this program (87% of participants were women). We also initially restricted our sample to those who did not have a retirement saving plan. We ran into the issue that some participants had one but had not contributed in years or were unsure. Thus, we let some participants who had a retirement saving plan join the study since opening a myRA was not restricted to only those who did not have other retirement saving plans.10
We had 70 and 72 participants in the treatment and control groups, respectively. We had a 65% participation rate in the second workshop. Through follow up phone calls at one week, and one and three months, we obtained information among 93% of the participants about whether they opened myRA. Participants were asked to fill out a survey at baseline (first workshop) and at six months (second workshop).
Our primary outcome variables of interest are the following. First, we are interested in measuring the impact of our educational intervention on whether participants open a myRA. Our measure of whether participants open a myRA is self-reported, which is a limitation of our study, and we discuss this later in the paper. Because we helped participants to open myRA in the computer at the end of the workshop, we are able to know with more certainty about whether participants opened the account or not for those who opened the account at the workshop.11
Second, we are interested in determining the impact of our intervention on knowledge related to financial planning for retirement. During the design stage of our study, we found that many existing retirement knowledge and planning scales are more applicable to individuals with middle to high socio-economic status. For example, the scale most recently created by Hopkins and Littell (2016) features items that require a high-level of education and literacy for individuals to fully comprehend the questions. Hettling et al. (2016) developed a financial literacy scale that includes a subscale on investing and long-term planning knowledge, and we found that this scale was not useful for our study when we first piloted our survey among our target population because many items in the scale were too complex and difficult to comprehend.
We created a simple indicator that measures self-reported knowledge related to retirement planning. Our indicator is a combination of questions in the HRS related to knowledge about retirement planning and saving similar to those used by Lusardi and Mitchell (2011a), and the indicator created by Carr et al. (2015). Table A1 in the online Supplemental Material shows the components of RKI, which consisted of 10 yes/no questions. Therefore, our indicator has a 0-10 value. We also consider a modified retirement knowledge indicator (M-RKI) that takes into consideration the fact that question 8 asks if a participant has attended a workshop about retirement planning. In the follow-up workshop we clarified and asked whether participants attended other workshops besides the one associated with this program (see Table A1 in online Supplemental Material for specific question modification). However, it might be the case that participants still count our workshop in the scale and answer yes to this question. Thus, we estimated our indicator without this question, so that our modified retirement knowledge indicator has a value 0-9.
Third, we also evaluate whether our intervention had any effect on participants’ financial management behavior. We use the indicator constructed by Dew and Xiao (2011). This scale is composed by the following subscales: 1) Saving and investment, 2) Cash management, and 3) Credit management.12 This indicator was not ideal among our population since we found that in four questions participants answered that it did not apply to them (see Table A2 in online Supplemental Material for questions used in scale and subscales). The questions where participants answered that it did not apply to them are those related to the credit management subscale because many participants do not have credit cards or have standing loans. We also had several participants who answered that saving from each paycheck was not applicable since they were not working in the last six months. In our online Supplemental Material we include our English and Spanish Baseline Surveys.13
Table 3 presents the summary statistics for demographic and socio-economic characteristics and variables of interest for the full sample and for the control and treatment groups. When we look at column 1 of Table 3, we observe that our sample is composed mostly of women (87%) with a low educational attainment (only 11% completed college or more), and low-income (70% had an income less than $30,000). In our study 85% of participants were foreign born, where 89% were Spanish native speakers and 48% did not speak English or speak it poorly. The average age for study participants was 46 years. As we can see from our summary statistics, our intervention targets the population groups that face greater barriers towards acquiring financial knowledge and preparing for retirement as we discussed in our literature review.
Table 3.
Characteristics of full sample, control, treatment, completer, and non-completer groups, percentages and means
| No. of obs | Full sample | Control | Treatment | Completer | Non-comp. | |
|---|---|---|---|---|---|---|
| (full sample) (1) |
nfull = 142 (2) |
ncont = 72 (3) |
ntreat = 70 (4) |
ncomp = 92 (5) |
nnoncomp = 50 (6) |
|
| Age | 135 | 45.852 | 45.544 | 46.164 | 45.430 | 46.591 |
| Gender (males) | 142 | 12.68% | 13.89% | 11.43% | 13.04% | 12.00% |
| Foreign born | 141 | 85.11% | 77.78% | 92.75%** | 85.87% | 83.67% |
| Mexican origin | 142 | 85.21% | 87.50% | 82.86% | 83.70% | 88.00% |
| Spanish native speaker | 142 | 89.44% | 86.11% | 92.86% | 91.30% | 86.00% |
| Speaks no English or poorly | 138 | 47.83% | 46.48% | 49.25% | 48.35% | 46.81% |
| Educational attainment | ||||||
| No High school completed | 138 | 34.06% | 31.88% | 36.23% | 36.67% | 29.17% |
| High school completed | 138 | 55.07% | 50.72% | 59.42% | 51.11% | 62.50% |
| College completed or more | 138 | 10.87% | 17.39% | 4.35%** | 12.22% | 8.33% |
| Household income | 60 | 22637 | 21107 | 24386 | 22634 | 22646 |
| Income less than 30000 | 60 | 70.00% | 68.75% | 71.43% | 68.18% | 75.00% |
| Employment status | ||||||
| Not employed | 138 | 23.19% | 20.00% | 26.47% | 23.86% | 22.00% |
| Employed part-time, self-employed, & temporal | 138 | 33.33% | 34.29% | 32.35% | 35.23% | 30.00% |
| Employed full-time | 138 | 43.48% | 45.71% | 41.18% | 40.91% | 48.00% |
| Financial Strain | 139 | 34.941 | 36.080 | 33.716 | 35.889 | 33.20%† |
| Had a bank account at some point in the study | 142 | 80.28% | 86.11% | 74.29%* | 84.78% | 72.00%* |
| Open myRA | 142 | 7.04% | 0.00% | 14.29%*** | 6.52% | 8.00% |
| Retirement knowledge, scale 0-10 | 142 | 1.606 | 1.416 | 1.800 | 1.413 | 1.960† |
| Retirement knowledge, scale 0-9 | 142 | 1.500 | 1.333 | 1.671 | 1.326 | 1.820† |
| Financial Management Behavior Scale (FMBS) | 142 | 2.575 | 2.593 | 2.556 | 2.592 | 2.542 |
| FMBS, Saving and investment subscale | 142 | 1.817 | 1.843 | 1.792 | 1.856 | 1.748 |
| FMBS, Cash management subscale | 142 | 3.495 | 3.452 | 3.538 | 3.433 | 3.608 |
| FMBS, Credit management subscale | 141 | 2.408 | 2.484 | 2.329 | 2.484 | 2.270 |
Percentages denoted with “%”, other variables denote means. All variables show values using data at baseline. We denote statistically significant differences between control and treatment, and between completer and non-completer groups at baseline.
p < 0.10.
p < .05.
p < .01.
p < .001.
In Table 3 we observe that there are no statistically significant differences among control and treatment groups for most variables. We conducted an independent t-test for differences between treatment and control groups and find that those in treatment group are more likely to be foreign born (p = 0.01), and less likely to have completed college (p = 0.01) or have a bank account at some point in the study (p = 0.05). We are not concerned about these significant differences biasing our results since these differences make it more difficult for our participants in treatment group to open a myRA, and this leads to the effect of our intervention to be biased downward instead of upward.
To further test that participants were assigned to control and treatment groups randomly, we estimate a Probit model where we use as dependent variable the treatment condition (equal to 1 if treatment group, equal to zero if control group) and regress it on demographic and socio-economic characteristics such as: age, gender, nativity status (foreign born), education attainment, Spanish native speaker, speaks no English or poorly, Mexican origin, employment status, and financial strain scale (all data collected at baseline).14 We also control in our estimations for whether participants had a bank account at some point in the study. Nativity status and education attainment related variables and whether a participant had a bank account at some point during the study are statistically significant at the 5% level. From this regression we observe that participants were more likely to be in the treatment group if they had low levels of education, if they were foreign born, and did not have a bank account at some point in the study. We conduct a Wald Test to determine that the independent variables are not jointly significant. We find that we reject the hypothesis that the variables are jointly equal to zero (Chi-squared statistic = 21.49, p-value = 0.04). To further account for this, we estimate our model considering in our sample only those participants who had a bank account at some point during the study.
To estimate the impact of our educational intervention in our primary outcomes, we test if there are statistically significant Difference in Differences (DD) between control and treatment groups in relation to the primary outcomes of interest (open myRA, retirement knowledge, and financial management practices). We will also estimate a DD model as follows,
| (1) |
Where i=1,2,…,It and t = 1,2. It denotes sample size of the tth period. Yi,t represents the value of the dependent variable for the ith participant in the tth period. is a vector of constants, X represents a set of variables related to time variant individual characteristics (financial strain and employment status in our analysis) that are presumed to affect the dependent variable (open myRA, retirement knowledge, and financial management practices), captures individual unobserved characteristics (individual fixed effects), and εit represents the error terms for the ith person in the tth period. Treat represents a variable that is equal to one if the person is in the treatment group, and equal to zero otherwise, and Post represents a variable that is equal to zero for Period 1 (baseline) and equal to one for Period 2 (post-intervention, 6 month follow up workshop). The interaction term of Post x Treat denotes the variable of interest that reflects the DD in the outcome variable Y. Given the nature of our study, where everyone in the treatment group received our educational intervention, and we are considering those individuals that attended the second workshop, we are conducting a Treatment on Treated (TOT) evaluation. We estimate our DD regression using Ordinary Least Squares (OLS).15
It is important to mention that myRA program became fully operational in November of 2015. In July 28 of 2017 it was announced that a myRA could no longer be opened. By the 4th of December of 2017, deposits were no longer accepted. Account holders were informed that deposits must be withdrawn or transferred to another Roth IRA and that the account will automatically be closed when the balance gets to $0. Our study was conducted during the period of October 2016-September 2017, and we had the treatment group intervention during the period of October 2016-April of 2017. Thus, the termination of the program did not affect our the design of our study, because our intervention period for the treatment group was prior to the announcement made in July of 2017 of the program’s conclusion.
Results
Completers versus Non-Completers
Given the nature of our study, it is likely that certain individual characteristics might be associated with participation in the second workshop. Thus, we evaluate differences among those participants who attended the follow up workshop and those who did not (completers versus non-completers), where Table 3 presents the summary statistics for these two groups as well. We observe similar rates of participation in the second workshop among control and treatment groups, 64 and 65 percent, respectively. In Table 3, from an independent t test on the differences between completers and non-completers at baseline, we can observe that non-completers showed higher levels of financial strain (marginally significant at the 10 percent) and were less likely to have a bank account at some point in the study (significant at the 5% level).
We first evaluate if individual characteristics are associated with participation in the second workshop by estimating a Probit model using a dependent variable that is equal to one for those who attended the second workshop (completer), and zero otherwise (non-completer). We use the same set of independent variables as in the treatment condition Probit model we discussed in the previous section, plus a variable that accounted for whether participants were in the treatment or control groups For this estimation we consider all data at baseline. We find that those who have a bank account at some point in the study and those who are Spanish native speakers are more likely to participate in the second workshop (variables statistically significant at the 5% level). We conduct a Wald Test to determine that all the independent variables are not jointly significant, and find that they are not (Chi-square statistic = 11.46, p-value = 0.4578). When testing the joint significance of the variables that account for having a bank account at some point in the study and being Spanish native speaker, we find that they are jointly significant (Chi-square statistic = 8.65, p-value = 0.0131). Given that these two variables are jointly significant, we also estimated our model using weights that will take this into consideration. We estimated a Probit model where we regress our attrition related variable on whether a participant had a bank account during the study and whether the participant was a Spanish native speaker to calculate the predicted probabilities of attending the second workshop. We create weights as the inverse of these probabilities to use in our estimation of the impact of our educational intervention on opening myRA.
Difference in Differences of Primary Outcomes
In Table 4 we present the DD of our primary outcomes of interest to evaluate the impact of our educational intervention. Columns 1-6 present the percentage of those who open myRA and means of the retirement knowledge indicator and financial management scale and subscales for the control and treatment groups and the difference between before and after intervention for each group. In columns 7 and 8 of Table 4 we present the difference between control and treatment groups at pre and post intervention, respectively. Column 9 of Table 4 shows the DD, which is the difference between the control and treatment groups pre-post differences. In Table 4 we can observe that those in the treatment group showed a significant DD from the control group at the 1% level for the variable open myRA. In the treatment group we had 14% of participants open a myRA, while in the control group we had no one. For the two versions of the retirement knowledge indicator, we observe a significant DD at the 5% level. The improvement on the retirement knowledge indicator was significantly greater for the treatment group after intervention in comparison to the control group. Looking at the DD, we observe that our intervention increases RKI and M-RKI by 1.7 and 1.5, which represent 91 and 85% of one standard deviation at baseline, respectively. The differences for the variables open myRA, RKI and M-RKI across groups are significant with a statistical power of 80 percent.16
Table 4.
Difference in Differences of primary outcomes related to retirement planning and financial management behavior
| Control | Treatment | Pre | Post | ||||||
|---|---|---|---|---|---|---|---|---|---|
| Pre (1) |
Post (2) |
D (3) |
Pre (4) |
Post (5) |
D (6) |
D (7) |
D (8) |
DD (9) |
|
| Open myRA | 0 | 0 | 0 | 0 | 14.3% | 14.3% | 0 | 14.3%*** | 14.3%*** |
| Retirement knowledge Indicator 0-10 | 1.417 | 2.413 | 0.996 | 1.800 | 4.109 | 2.309 | 0.383 | 1.696*** | 1.312* |
| Retirement knowledge Indicator 0-9 (modified) | 1.333 | 2.130 | 0.797 | 1.671 | 3.609 | 1.938 | 0.338 | 1.478*** | 1.140* |
| Financial Management Behavior Scale (FMBS) | 2.593 | 2.686 | 0.093 | 2.556 | 2.479 | −0.077 | −0.037 | −0.207 | −0.170 |
| FMBS - Saving and investment subscale | 1.843 | 1.909 | 0.066 | 1.792 | 2.006 | 0.214 | −0.051 | 0.097 | 0.148 |
| FMBS - Cash management subscale | 3.453 | 3.609 | 0.156 | 3.538 | 3.368 | −0.170 | 0.085 | 0.158 | −0.326 |
| FMBS - Credit management subscale | 2.484 | 2.539 | 0.055 | 2.329 | 2.062 | −0.267 | −0.155 | 0.352 | 0.453 |
D denotes difference and DD denotes Difference in Differences. All statistically significant differences shown in column 9 are significant with statistical power of 80 percent. Open myRA expressed as percentage, all other variables are means. For variable open myRA assume equal to zero if data was not available (N=142 at pre and post intervention), for other variables use available information (N=142 at pre intervention, and N=92 at post intervention). See Tables A3 and A4 for the definition of the retirement knowledge indicator and the financial management behavior scale and subscales, respectively. Higher values represent greater retirement knowledge and better financial management behaviors. The modified retirement knowledge indicator exclude the question whether a participant has attended a workshop about retirement planning and saving.
p < .05.
p < .001.
For the financial management behavior scales and subscales, we did not see any significant difference between treatment and control groups.17 It is important to mention that we found some problems when we used this scale. There were four questions out of 12 from the financial management behavior scale that participants answered that it was not applicable to them (questions denoted in Table A2). Thus, the validity of this scale is questionable, as we discussed previously.
Difference in Differences Model
Table 5 presents the coefficients of the treatment variable in the Difference in Differences (DD) model where we account for observable (financial strain and employment status) and unobservable (fixed effects) individual characteristics.18 We show the impact of our intervention on the outcomes of opening a myRA and the two constructed retirement knowledge indices (RKI and M-RKI) in Table 5. We do not include in this table estimates for the impact of our intervention in the financial management behavior scale and subscales since we did not find any significant effect of our intervention using the DD model. We hypothesize that this lack of results could be due to the validity issue of this scale, which we discussed before.
Table 5.
Difference in Differences model (OLS regression with fixed effects)
| Dependent variable |
Full sample | Full Sample, weighted | Subsample 1 | Subsample 2 | ||||||||
|---|---|---|---|---|---|---|---|---|---|---|---|---|
| Open myRA (1) |
RKI (2) |
M-RKI (3) |
Open myRA (4) |
RKI (5) |
M-RKI (6) |
Open myRA (7) |
RKI (8) |
M-RKI (9) |
Open myRA (10) |
RKI (11) |
M-RKI (12) |
|
| Post x Treat | 0.134* (0.052) |
1.180* (0.509) |
1.040* (0.453) |
0.125* (0.053) |
1.163* (0.498) |
1.042* (0.446) |
0.175** (0.061) |
1.371* (0.579) |
1.176* (0.513) |
0.185** (0.066) |
1.539* (0.594) |
1.354* (0.523) |
| Observations | 223 | 223 | 223 | 223 | 223 | 223 | 182 | 182 | 182 | 168 | 168 | 168 |
| R-squared | 0.139 | 0.435 | 0.409 | 0.129 | 0.433 | 0.413 | 0.181 | 0.441 | 0.415 | 0.194 | 0.445 | 0.429 |
| No. of participants | 140 | 140 | 140 | 140 | 140 | 140 | 112 | 112 | 112 | 104 | 104 | 104 |
Standard errors in parentheses. Model estimated including financial strain indicator, employment status and individual fixed effects. Subsample 1 includes all participants that had a bank account at some point in the study, and subsample 2 includes those participants who had a bank account at some point in the study and that are not saving for retirement in other retirement saving plan in a monthly basis.
p < .05.
p < 0.01.
In Table 5, Columns 1-3 presents the coefficient for our treatment variable when we estimate our model for the full sample. The results shown in Columns 4-6 are when we estimate our model using weights that account for the fact that those who had bank account at some point in the study and Spanish native speakers are more likely to attend the second workshop. Columns 7-9 show the coefficients of the treatment variable when we restrict our sample to those who had a bank account at some point in the study, and columns 10-12 show the treatment effect when we restrict our sample to those who had a bank account at some point in the study and also did not contribute to a retirement saving plan different to myRA in a monthly basis (as reported in the second workshop).
Our findings using the DD regression approach are very similar to what we found in the results shown in Table 4. We find that our intervention has a significant positive effect at the 5% level on opening a myRA when we use the full sample with unweighted and weighted data. In relation to the retirement knowledge indicator, we also find that our intervention has a significant positive effect at the 5% level when we estimate our model for the full sample with unweighted and weighted data (columns 2, 3, 5, and 6) and for the other subsamples (8, 9, 11, and 12).
The magnitude of the effect of our intervention seems of significant magnitude, especially when looking at the impact on opening a myRA. We observe that while no one in the control group opened a myRA, getting 13% of participants to open a myRA shows the importance of an educational intervention when promoting retirement savings. In relation to the magnitude of the effect of our intervention on retirement knowledge, looking at the coefficients from columns 5 and 6 (for full sample, weighted data), which show the smallest effect, we observe that our intervention increases RKI and M-RKI by 1.16 and 1.04, which represent 62 and 59% of one standard deviation at baseline.
When we restrict our sample to those who had a bank account at some point in the study, we find that the impact of our intervention on opening a myRA is of larger magnitude, which is expected (post-treatment coefficient equal to 0.17 in column 7). The difference in RKI and M-RKI is also higher for the treatment group when we restrict our sample to those who had a bank account at some point in the study (post-treatment coefficients equal to 1.37 & 1.17 in columns 8 and 9). We also estimate our DD model for those who had a bank account at some point in the study, but excluded those participants who were saving in another retirement saving plan at some point in the study (as reported in the follow up survey at 6 months), and results are very similar to those found before, where the magnitude of the post-treatment coefficients increases by a small amount (0.18 for open myRA, 1.54 for RKI, and 1.35 for M-RKI).
We also collected self-reported data at the second workshop on whether participants contributed to myRA on a monthly basis and how much they contributed. Only 50% of those with a myRA account contributed on a monthly basis. Of this 50% one third contributed $20 dollars on a monthly basis and other two thirds contributed $100 on a monthly basis. Those who did not contributed on a monthly basis expressed having a total amount in myRA account in the range of $600-$1500 dollars at the time of the second workshop.
Discussion
Based on the results discussed previously, we observe that our community-based intervention among low and moderate income Spanish speaking Hispanics was successful in getting them to save for retirement and improve knowledge about financial planning for retirement. Our study shows that for the people who participated in the study, our simple educational intervention, which incorporated “behavioral nudges”, motivated them to save for retirement. This is an important finding since there are significant barriers that Hispanics face when it comes to retirement planning and saving. We contribute to the literature as we are one of the first studies that evaluates the impact of an educational intervention to promote retirement saving among people who do not have access to an employer-sponsored retirement account. Focusing our study on Hispanics was crucial as this group lags significantly when it comes to retirement preparedness in comparison to other racial and ethnic groups.
There are some limitations in our intervention that must be acknowledged. First, given that our study was designed as an RCT with a control group wait-list, so that everyone benefits from the intervention, this is likely to result in an overestimation of the treatment effects (see Cunningham et al. 2013). Nevertheless, given our desire to conduct our RCTs with a community-based approach, having a control wait-list was necessary.
Other important limitation is that all data on whether participants opened a myRA was self-reported. Because of privacy, we were unable to have access to official records on enrollment and contribution by our participants. If we look at our data, we find that among those who reported opening a myRA, 90% of those who opened myRA actually started the process during our workshop. Thus, this help us to corroborate the accuracy of this self-reported data. An intervention in which we are able to keep better records of how participants contribute to their retirement saving plans and that provides some incentives, such as a lottery, could be beneficial in order to promote retirement savings. As noted by Fertig et al. (2015), the use of a lottery is a useful nudge because it lessens the feeling of loss that comes from saving. Thus, a program where individuals could accumulate points towards lottery tickets for prizes can be useful in this context.
Another limitation of our study is that the myRA program was eliminated when we were collecting data during the second workshop. We conducted a total of 11 first workshops and 10 follow up workshops, and myRA program was eliminated before we conducted our last three follow up workshops. Because of this, we relied on data collected on whether participants opened myRA up to 3 months after they had the intervention and in the follow up workshop, so that we were not affected by the announcement of the termination of the program.19 We also had instances where participants in the treatment and control groups opened a myRA during the second workshop, but we do not include these cases in our main analysis. Thus, the timing of our intervention was not ideal, but the termination of the program during our data collection process did not bias our results. Interestingly, when looking at data collected in the second workshop among the participants in the control group who attended the second workshop before it was announced that the program was going to be terminated, we find that 31% participants in this group opened a myRA during the second workshop. For the treatment group, we did not give them the opportunity to open a myRA in the second workshop.
Another issue that can be brought up in our study is that participants might have opened an retirement account during the workshop because they wanted to please the educator, which is probably an issue most interventions face. We believe that this is not the case as participants were given the option to look at the program online without any commitment to open the account. We do find that the majority of participants who opened myRA did during the workshop, which tells us that either the barrier of procrastination is salient or it was difficult for participants to open the account online by themselves. The website of myRA was simple and friendly to users. During the workshop most participants seemed comfortable using the internet and many expressed that they use their mobile phone to access the internet. Thus, we believe that probably the procrastination barrier was larger than the technological one, but we do not have a systematic way to test this in our analysis.
We should note is that we adjusted our intervention so that participants in the last three follow up workshops, which took place after it was announced that myRA program will end, could learn about retirement saving plans available in the private sector. We also had a special group to inform participants who opened a myRA and who already had the second workshop on the termination of myRA program. Interestingly, no participant showed interest in opening a retirement saving account from the private sector, even that we provided them several options and offered to help them open a retirement account online. Several participants expressed that myRA was more appealing to them since it was backed by the government, and it seemed a simple and secure way to save for retirement. Participants also expressed that they liked the feature that myRA had no cost and also allowed them to withdraw funds (i.e. their contributions, not the interest generated) without penalty if they had an emergency or wanted to use the money for buying a home or for education purposes.
While we acknowledge the limitations of our study, our study contributes to understanding the role of financial education addressing ethnic and racial disparities. Hispanics underperform whites when it comes to financial knowledge (Al-Bahrani et al. 2018; Lusardi and Mitchell 2011a, 2011b), and improving financial knowledge among minorities is crucial given that it has been positively associated with being banked, avoiding high-cost borrowing, investing in stocks, and planning for retirement (Barcellos and Zamarro 2019; Kim and Lee 2018; Lusardi and De Bassa Scheresberg 2013, Lusardi and Mitchell 2011a, Van Rooij et al. 2012).
Nonetheless, it has been argued that interventions in the area of financial education have limited efficacy. Fernandes et al. (2013) conduct a meta-analysis on the impact of interventions to improve financial literacy and find that these interventions are able to explain only 0.1% of the variance in financial behaviors. They also find that the effect of such interventions is weaker among low-income samples. Our study shows that when we combine education with behavioral nudges, we can be more effective promoting behavioral change. Fernandes et al. (2013) suggest that we move toward “just-in-time” interventions that focus on specific behaviors, which is something we did in our intervention. Participants received information of a new government program, and the educational material and activities undertaken in the workshop were focused on two specific goals: 1) creating awareness about the need for planning for retirement, and 2) opening a retirement account.
Conclusion
From our community-based RCT, where we evaluate the impact of an educational intervention to promote retirement saving among predominantly Spanish native speakers and foreign born Hispanics, we conclude that more efforts on the community outreach that focus on education should be in place. As we move forward to solve the retirement saving crisis and try to ensure greater racial/ethnic equity in older age, education programs could be an effective tool.
We find that the impact of the educational intervention was of larger magnitude than what was observed in previous studies, and this was due to our set-up. Previous studies have done similar interventions in a set-up in which people have access to an employer-sponsored retirement saving plan, so for these people the barrier to save for retirement is of much smaller magnitude. For those people who do not have access to an employer retirement saving plan, an educational intervention seems to make a difference. Our work shows that an educational intervention can be an effective tool to get people to save for retirement when the “auto enrollment” feature is not available.
One of the reasons why our intervention was successful getting participants to open a retirement account and increasing knowledge about financial planning for retirement was that we provided education to a segment of the population that has significant knowledge gaps in this area. Hispanics face cultural and language barriers when trying to acquire financial knowledge. Thus, our study shows that a simple intervention that is culturally-tailored and provided in the individuals’ native language in a community set up can make a significant difference in improving financial knowledge and changing behavior in the area of money management.
Our intervention was one of the first interventions in the Los Angeles area that focused on the topic of saving for retirement among the Hispanic community. While housing has been at the center of asset building among the community, it is important to give more attention to retirement saving as a form of wealth accumulation. Spanish language materials on financial planning for retirement are limited and in many cases far too complex for individuals with low levels of education to use meaningfully. Furthermore, as we researched different options of retirement saving plans, in order to provide alternatives to participants who opened myRA, we noticed that most products available are not tailored well for this segment of the population. The myRA program provided individuals with a secure and simple way to save for retirement, and individuals who participate in this program are likely to be less intimidated by a transition in the future to a 401k or an IRA. Thus, myRA could also be seen as a starting point for financial planning for retirement.
Our findings are also relevant because of the state sponsored retirement saving plans that are currently developing. We are the first to provide an evaluation of a government-sponsored retirement saving plan. The findings from our study are useful for the design and implementation of government-sponsored retirement saving plans such as CalSavers.20 According to the website of the California State Treasurer Office, the program CalSavers opened for statewide enrollment in July of 2019. The program is designed as an opt-out program, where employees have 30 days after employers enrolled them to act either by opting out or determining their saving rates, otherwise they will be enrolled under the default saving rate of 5% of gross pay. Employees can opt in and out of the program at any point. The feature of CalSavers as an auto-enrollment plan with an opt-out option makes it different to myRA, and this feature is crucial to ensure participation and address the procrastination barrier effectively. CalSavers is designed similarly to myRA in two dimensions. CalSavers is a portable plan and it gives individuals the option to take out money in case of an emergency without a penalty.
Findings from our study suggest that educational programs should be at the center of the CalSavers program to get minorities to participate and not opt out from the program. Improving financial knowledge specific to financial planning for retirement should be at the center if we want programs like this to be successful and to purposely help diminishing the racial/ethnic gap on retirement saving.
Supplementary Material
Acknowledgment(s):
We thank our community partners, the Mexican American Opportunity Foundation (MAOF) and New Economics for Women (NEW), for all their support during the design, data collection, and implementation stages of the project. We thank specially Isaias Hernandez and Raul De la O and from MAOF, and Leticia Andueza and Magdalena Cervantes from NEW. We also thank Central City Neighborhood Partners (CCNP) for letting us use their facilities for this study. We also thank myRA Outreach Office for their support to this project, specially to Ingrid Taylor. We acknowledge Ana Francisca Silva, who was the project coordinator, for her excellent work. We thank Michael Ong and Thomas Rice for their useful comments to our manuscript, and to William Humphrey for his research assistance. Dr. Luisa R. Blanco received support for this project from NIA-funded Grant 3P30AG021684-15:S1, 2016-17 Research Supplement to Promote Diversity in Health-Related Research through the University of California, Los Angeles (UCLA) and Charles Drew University (CDU), Resource Centers for Minority Aging Research Center for Health Improvement of Minority Elderly (RCMAR/CHIME). Pepperdine’s Office of Provost also provided funding for this study. The contents of this paper are solely the responsibility of the authors and do not necessarily represent the official views of the NIH. All errors are our own.
Footnotes
The compound interest question used when measuring financial knowledge/literacy is the following: Suppose you had $100 in a savings account and the interest rate is 20% per year and you never withdraw money or interest payments. After 5 years, how much would you have on this account in total? 1. More than $200; 2.Exactly $200; 3.Less than $200; 4.Don’t know; 5.Refuse to answer.
This study had a caveat since the sample was small and not representative of the population of employees.
The Video “Una Nueva Manera de Ahorrar en La Salle Cleaners” (A new way to save in La Salle Cleaners) was accessed in Youtube and played during the workshop. The video was all in Spanish (or with Spanish subtitles when there was something said in English). This video is no longer available in YouTube.
For example, through a Facebook experiment, Blanco and Rodriguez (2018) find that the message “Many Hispanic women like you have a plan for retirement” is more effective that a standard message and one focus on the family to get Hispanic women interested in learning more about retirement savings. Thus, the more effective message was used in our educational intervention. See message in the selected slides of the workshop presentation included in the online Appendix 1.
We sent a text at 5 months that reminded participants specifically to open a retirement account before the 6 month deadline.
All complete materials related to our educational intervention are available upon request.
All oral presentations given during our workshops were given in Spanish by a native Spanish speaker, where all participants previously expressed that they were proficient with oral communication in Spanish. All workshop documents were available in Spanish and English, where those participants that felt more comfortable reading and writing in English received the English version per their request.
Note that this website was updated in the Spring of 2018 to take out information on myRA since this program is no longer available. We also changed some of the links of available resources since some of the links we include in the website initially were no longer available. This website was used for another related project conducted by Blanco and Rodriguez (2018).
Our block randomization approach is similar to the one used by Duru et al. (2010), who conduct a randomized controlled trial of a faith-based physical activity program. We use Sealed Envelope available online to create a randomization list for the different groups. Information on groups randomization was not shared with community partners or participants (https://www.sealedenvelope.com/simple-randomiser/v1/lists).
Only 4 participants in each group expressed at the second workshop that they contributed to a retirement saving plan different than myRA in a monthly basis (6% of our sample). As a robustness check, we conducted our analysis restricting the sample to those who were not saving in another retirement saving plan during the time of the study and found the same results.
It is important to note that in our main analysis we did not count people who opened a myRA account during the second workshop in the data analyses since it will bias the results.
Please refer to Dew and Xiao (2011) for further discussion on the development and validation of this scale. See Table A2 in Online Appendix 1 for the questions used in this scale.
Follow up surveys are very similar to baseline surveys and are available upon request.
We describe next the control variables we use in our estimations: age (30 to 64), gender (male=1, female=0), nativity status (foreign born=1, native born=0), educational attainment (no primary education=0, primary education completed=1, high school completed=2, college or more completed=3), Spanish native speaker (equal to 1, zero otherwise), speaks no English or poorly (equal to 1, zero otherwise), Mexican origin (equal to 1, zero otherwise), employment status (employed part-time, full-time, or self-employed=1, unemployed, incapacitated, homemaker, retired, student=0). We use the financial strain indicator developed and validated by Hilton and Devall (1997). Refer to online Appendix 2 and 3 for the survey questions in English and Spanish from which we construct these variables.
While a Probit model will be more appropriate when using a dichotomous variable as dependent variable, we decided using OLS since we are including fixed effects, and fixed effect estimators of non-linear models can be biased (see Greene 2002; Arellano and Hahn 2007).
For power calculations we use STATA command “power twoprop” for the dichotomous variable (open myRA, and “power twomeans” for the continuous variables (RKI and M-RKI).
Note that in this part of the analysis, where we show the DD in Table 4, we are assuming a value of zero for those participants we were unable to reach via phone at the one week and one and three months follow up and who did not attended second workshop[ (completers and non-completers are considered). For the DD of the RKI we are using data for participants who attended both workshops (completers only).
In this part of the analysis, where we estimate the DD regression, we only consider those participants that attended both workshops (only completers).
Our last workshop for the collection of baseline data and deliver of intervention among treatment participants took place on March 11 of 2017, which gives us more than three months before the announcement made by myRA on the termination of the program. The announcement came in July of 2017, and at that time you can no longer open a myRA account, but you can continue to contribute to the account.
For more information on this refer to the California State Treasurer page http://www.treasurer.ca.gov/scib/.
Contributor Information
Luisa R. Blanco, School of Public Policy, Pepperdine University.
O. Kenrik Duru, David Geffen School of Medicine, University of California Los Angeles.
Carol Mangione, David Geffen School of Medicine, University of California Los Angeles.
References
- Al-Bahrani A, Weathers J, & Patel D (2019). Racial differences in the returns to financial literacy education. Journal of Consumer Affairs, 53(2), 572–599. doi: 10.1111/joca.12205 [DOI] [Google Scholar]
- Arellano M, & Hahn J (2007). Understanding bias in nonlinear panel models: Some recent developments. Econometric Society Publication, Vol. 3, P. 381. doi: 10.1017/CBO9781139060035 [DOI] [Google Scholar]
- Barcellos S, & Zamarro G (2019). Unbanked status and use of alternative financial services among minority populations. Journal of Pension Economics and Finance, 2019. doi: 10.1017/S1474747219000052 [DOI] [PMC free article] [PubMed] [Google Scholar]
- Blanco L, Aguila E, Gongora A, & Duru O (2017). Retirement planning among Hispanics: In God's hands? Journal of Aging & Social Policy, 29(4), 311–331. doi: 10.1080/08959420.2016.1272161 [DOI] [PMC free article] [PubMed] [Google Scholar]
- Blanco L, & Rodriguez L (2018). Delivering information about retirement saving among Hispanic women: two Facebook experiments. Behaviuoral Public Policy 1–27. doi: 10.1017/bpp.2018.33 [DOI] [PMC free article] [PubMed] [Google Scholar]
- Benartzi S, & Thaler RH (2007). Heuristics and Biases in Retirement Savings Behavior. The Journal of Economic Perspectives, 21(3), 81–104. doi: 10.1257/jep.21.3.81 [DOI] [Google Scholar]
- Beshears J, Choi J, Laibson D, & Madrian B (2013). Simplification and Saving. Journal of Economic Behavior and Organization. 95, 130–145. doi: 10.1016/j.jebo.2012.03.007 [DOI] [PMC free article] [PubMed] [Google Scholar]
- Carr NA, Sages RA, Fernatt FR, Nabeshima GG, & Grable JE (2015). Health Information Search and Retirement Planning. Journal of Financial Counseling and Planning, 26(1), 3–16. Retrieved from https://files.eric.ed.gov/fulltext/EJ1074664.pdf [Google Scholar]
- Choi J, Laibson D, Madrian B, & Metrick A. (2006). Saving for Retirement on the Path of Least Resistance. In: McCaffrey E, Slemrod J Behavioral Public Finance: Toward a New Agenda. New York: Russell Sage Foundation, 304–351. Retrieved from https://scholar.harvard.edu/files/laibson/files/saving_for_retirement_on_the_path_of_least_resistance.pdf [Google Scholar]
- Clark RL, Morrill MS, & Allen SG (2012). The role of financial literacy in determining retirement plans. Economic Inquiry, 50(4). 851–866. doi: 10.1111/j.1465-7295.2011.00390.x [DOI] [Google Scholar]
- Clark RL, Hammond M, Morrill MS, & Khalaf C (2017). Nudging retirement savings: a field experiment on supplemental plans. NBER Working Paper No. 23679. doi: 10.3386/w23679 [DOI] [Google Scholar]
- Colby SL & Ortman JM (2015). Projections of the Size and Composition of the U.S. Population: 2014 to 2060. U.S. Census Bureau. Retrieved from https://www.census.gov/content/dam/Census/library/publications/2015/demo/p25-1143.pdf [Google Scholar]
- Collins M, & Urban C (2016). The role of information on retirement planning: evidence from a field study. Economic Inquiry. 54(4), 1860–1872. doi: 10.1111/ecin.12349 [DOI] [Google Scholar]
- Cunningham JA, Kypri K, & McCambridge J (2013). Exploratory randomized controlled trial evaluating the impact of a waiting list control design. Bmc Medical Research Methodology, 13(1). doi: 10.1186/1471-2288-13-150 [DOI] [PMC free article] [PubMed] [Google Scholar]
- Duflo E, & Saez E (2003). The Role of Information and Social Interactions in Retirement Plan Decisions: Evidence from a Randomized Experiment. The Quarterly Journal of Economics, 118(3), 815–842. doi: 10.1162/00335530360698432 [DOI] [Google Scholar]
- Duru O, Sarkisian C, Leng M, & Mangione C (2010). Sisters in motion: A randomized controlled trial of a faith-based physical activity intervention. Journal of the American Geriatrics Society, 58(10), 1863–1869. doi: 10.1111/j.1532-5415.2010.03082.x [DOI] [PMC free article] [PubMed] [Google Scholar]
- Dew JP, & Xiao JJ (2011). The Financial Management Behavior Scale:Development and validation. Journal of Financial Counseling and Planning, 22(1), 43–59. [Google Scholar]
- United States Federal Reserve. (2019). Report on the Economic Well-being of U.S. Households in 2018. Retrieved from https://www.federalreserve.gov/publications/files/2018-report-economic-well-being-us-households-201905.pdf (accessed on October 4, 2018).
- Fernandes D, Lynch JG, & Netemeyer RG (2014). Financial Literacy, Financial Education, and Downstream Financial Behaviors. Management Science, 60(8), 1861–1883. doi: 10.1287/mnsc.2013.1849 [DOI] [Google Scholar]
- Fertig A, Lefkowitz J & Fishbane A (2015). Using Behavioral Science to Increase Retirement Savings: A new look at voluntary pension contributions in Mexico. Ideas42. Retrieved from https://www.ideas42.org/wpcontent/uploads/2015/11/I42_571_MexicoPensionsReport_ENG_final_digital.pdf [Google Scholar]
- Fontes A (2011). Differences in the Likelihood of Ownership of Retirement Saving Assets by the Foreign and Native-Born. Journal of Family and Economic Issues, 32(4), 612–624. doi: 10.1007/s10834-011-9262-3 [DOI] [Google Scholar]
- Greene W (2002). The Bias of the Fixed Effects Estimator in Nonlinear Models. Working Paper, New York University. Retrieved from http://people.stern.nyu.edu/wgreene/nonlinearfixedeffects.pdf [Google Scholar]
- Hetling A, Postmus JL, & Kaltz C (2016). A Randomized Controlled Trial of a Financial Literacy Curriculum for Survivors of Intimate Partner Violence. Journal of Family and Economic Issues, 37(4), 672–685. doi: 10.1007/s10834-015-9479-7 [DOI] [Google Scholar]
- Hilton J & Devall E (1997). The family economic strain scale: Development and evaluation of the instrument with single- and two-parent families. Journal of Family and Economic Issues, 18(3), 247–271. doi: 10.1023/A:1024974829218 [DOI] [Google Scholar]
- Hopkins J & Littell D (2016). Retirement Income Planning Literacy in America: A Method for Determining Retirement Knowledgeable Clients. Journal of Financial Planning, 28(10). [Google Scholar]
- Hung A, Meijer E, Mihaly K, & Yoong J (2009). Building Up, Spending Down: Financial Literacy, Retirement Savings Management, and Decumulation. Ssrn Electronic Journal. doi: 10.2139/ssrn.1520203 [DOI] [Google Scholar]
- Kim KT, & Lee J (2018). Financial literacy and use of payday loans in the United States. Applied Economics Letters, 25(11), 781–784. doi: 10.1080/13504851.2017.1366635 [DOI] [Google Scholar]
- Lusardi A, Keller PA, & Keller AM (2009). New ways to make people save: a social marketing approach. NBER Working Paper No. 14715. doi: 10.3386/w14715 [DOI] [Google Scholar]
- Lusardi A, and Mitchell O & Curto V (2010). Financial literacy among the young. The Journal of Consumer Affairs, 44(2), 358–380. doi: 10.1111/j.1745-6606.2010.01173.x [DOI] [Google Scholar]
- Lusardi A, and Mitchell O (2011). Financial Literacy and Planning: Implications for Retirement Wellbeing. (NBER Working Paper No. 17078). doi: 10.3386/w17078 [DOI] [Google Scholar]
- Lusardi A, & Mitchell O (2011). Financial literacy and retirement planning in the United States. Journal of Pension Economics and Finance, 10(4), 509–525. doi: 10.1017/S147474721100045X [DOI] [PMC free article] [PubMed] [Google Scholar]
- Lusardi A, & de Bassa Scheresberg C (2013). Financial literacy and high-cost borrowing in the United States. NBER Working Paper Series No.18969. doi: 10.3386/w18969 [DOI] [Google Scholar]
- Lusardi A, & Mitchell OS (2017). How Ordinary Consumers Make Complex Economic Decisions: Financial Literacy and Retirement Readiness. Quarterly Journal of Finance, 7(3). doi: 10.3386/w15350 [DOI] [Google Scholar]
- Payne S, Yorgason J, & Dew J (2014). Spending Today or Saving for Tomorrow: The Influence of Family Financial Socialization on Financial Preparation for Retirement. Journal of Family and Economic Issues. 35(1), 106–118. doi: 10.1007/s10834-013-9363-2 [DOI] [Google Scholar]
- Prudential. (2014). The Hispanic American financial experience. Retrieved from https://www.prudential.com/media/managed/hispanic_en/prudential_hafe_researchstudy_2014_en.pdf (accessed on October 4, 2018).
- Rabinovich L, Peterson J, & Smith BA (2017). Hispanics' understanding of Social Security and the implications for retirement security: A qualitative study. Social Security Bulletin. 77(3): 1–14. Retrieved from: https://heinonline.org/HOL/P?h=hein.journals/ssbul77&i=77 [Google Scholar]
- Rhee N (2013). Race and retirement insecurity in the United States. National Institute on Retirement Security. Retrieved from https://www.nirsonline.org/wp-content/uploads/2017/07/race_and_retirement_insecurity_final.pdf [Google Scholar]
- Richman K, Sun W, Sena J, & Chun S (2015). Significance of Gender for Latina/o Savings and Retirement. Notre Dame, IN: Institute for Latino Studies, University of Notre Dame. Retrieved from https://latinostudies.nd.edu/library-archives/ [Google Scholar]
- Suresh K (2011). An overview of randomization techniques: An unbiased assessment of outcome in clinical research. Journal of Human Reproductive Sciences, 4(1), 8–11. doi: 10.4103/0974-1208.82352. [DOI] [PMC free article] [PubMed] [Google Scholar] [Retracted]
- Thaler RH, & Sunstein CR (2008). Nudge: Improving decisions about health, wealth, and happiness. New Haven, Conn: Yale University Press. [Google Scholar]
- van Rooij. M, Lusardi A, & Alessie RJ (2012). Financial Literacy, Retirement Planning, and Household Wealth. The Economic Journal, 122(560), 449–478. doi: 10.1111/j.1468-0297.2012.02501.x [DOI] [Google Scholar]
Associated Data
This section collects any data citations, data availability statements, or supplementary materials included in this article.