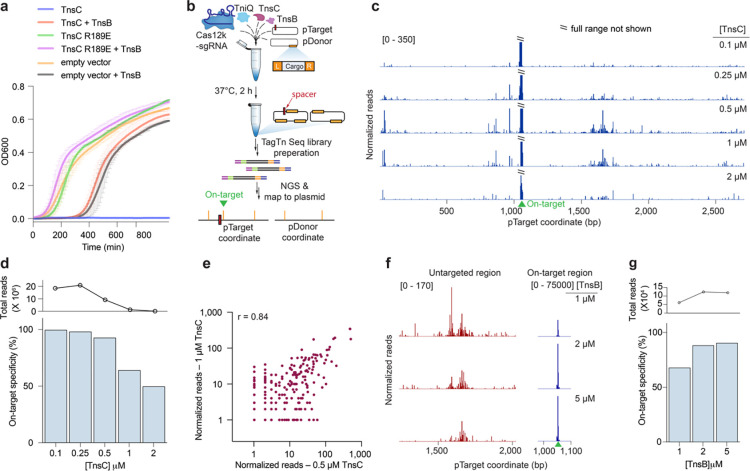
Fig. 2 |. Biochemical reconstitution of transposition reveals distinct efficiencies at on-target and untargeted sites.
a, Growth curves upon induction of WT or mutant TnsC, with or without TnsB. The data shown are mean ± s.d for n = 2 independent biological replicates, inoculated from individual colonies. b, Assay schematic for probing in vitro plasmid-to-plasmid transposition events using recombinantly expressed CAST components. c, In vitro integration reads mapping to pTarget, from experiments in which TnsC was titrated from 0.1 – 2 μM. Data were normalized and scaled to highlight untargeted integration events, relative to on-target insertions (Methods). d, On-target specificity from biochemical transposition assays at varying TnsC concentrations, calculated as the fraction of on-target reads divided by total plasmid-mapping reads (bottom). Total integration activity also decreased as a function of TnsC concentration, as seen by the normalized plasmid-mapping reads (top). e, Scatter plot showing reproducibility between untargeted integration reads observed in vitro at two high TnsC concentrations; each data point represents transposition events mapping to a single-bp position within pTarget. The Pearson linear correlation coefficient is shown (two tailed P <0.0001); on-target events were masked (Methods). f, Normalized integration reads detected at a representative untargeted site (left) and at the on-target site (right), with 1 μM TnsC and the indicated TnsB concentration. Note the differing y-axis ranges. g, On-target specificity from biochemical transposition assays at 1 μM TnsC and the indicated TnsB concentration, shown as in d.

