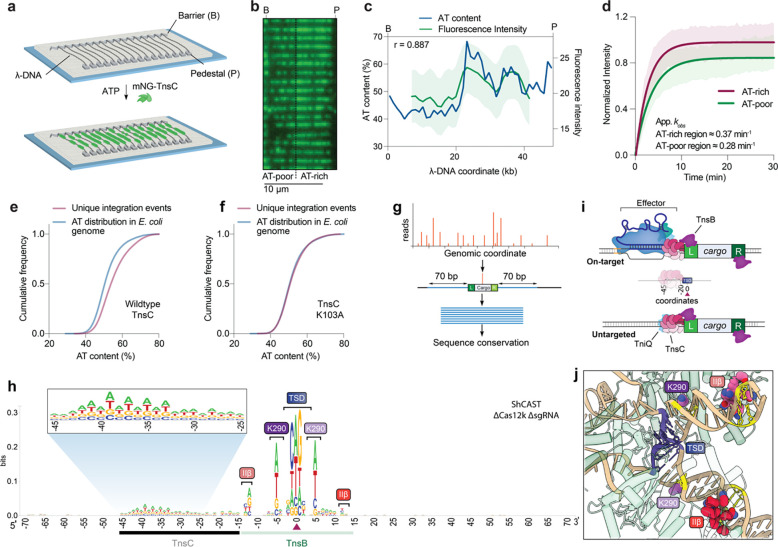
Fig. 3 |. RNA-independent integration events occur at preferred sequence motifs.
a, Schematic for single-molecule DNA curtains assay to visualize TnsC binding. λ phage DNA substrates are double-tethered between chrome pedestals and visualized used TIRF microscopy. b, mNG-labeled TnsC preferentially binds AT-rich sequences on the λ-DNA substrate near the 3’ (pedestal) end (Supplementary Movie 1). c, Correlation between AT content and mNG-TnsC fluorescence intensity visualized along the length of λ DNA. The Pearson linear correlation coefficient is shown (two-tailed P < 0.0001); data shown represent the mean ± s.d for n = 66 molecules. d, Binding kinetics for mNG-TnsC at AT-rich and AT-poor regions of the λ-DNA substrate. Apparent kobs at AT-rich sites ≈ 0.37 min−1, 95% C.I. [0.35, 0.39] and at AT-poor sites ≈ 0.28 min−1, 95% C.I. [0.27, 0.30]. The data shown represent mean ± s.d for n = 87 molecules. e, Cumulative frequency distributions for the AT content within a 100-bp window flanking integration events, using ShCAST with WT TnsC and sgRNA-1 (n = 5,505 unique integration events), compared to random sampling of the E. coli genome (n = 50,000 counts; Methods). The distributions were significantly different, based on results of a Mann-Whitny U test (P = 1.48 × 10−135). f, Cumulative frequency distribution comparison as in panel e, but with a K103A TnsC mutant (n = 1,932 unique integration events), which revealed a loss of AT bias (P = 0.1349). g, Meta-analysis of untargeted transposition specificity was performed by extracting sequences from a 140-bp window flanking the integration site and generating a consensus logo. h, WebLogo60 from a meta-analysis of untargeted genomic transposition (n = 5,855 unique integration events) with a modified pHelper lacking Cas12k and sgRNA. The site of integration is noted with a maroon triangle. An AT-rich sequence spanning ~25 bp likely reflects the footprint of two turns of a TnsC filament (black), whereas motifs within/near the target-site duplication (TSD) represent TnsB-specific sequence motifs (green). Specific TnsB residues/domains contacting the indicated nucleotides are shown. The zoomed-in inset highlights periodicity in the sequence bound by TnsC. i, Schematic showing the relative spacing of sequence features bound by Cas12k, TnsC, and TnsB in both on-target (RNA-dependent) and untargeted (RNA-independent) DNA transposition. In both cases, the TnsC footprint covers ~25-bp of DNA and directs polarized, unidirectional integration downstream in a L-R orientation. j, Zoom-in view of the ShCAST transpososome structure, highlighting sequence-specific contacts between TnsB and the target DNA that were observed in the WebLogo in h. PDB ID: 8EA323.

