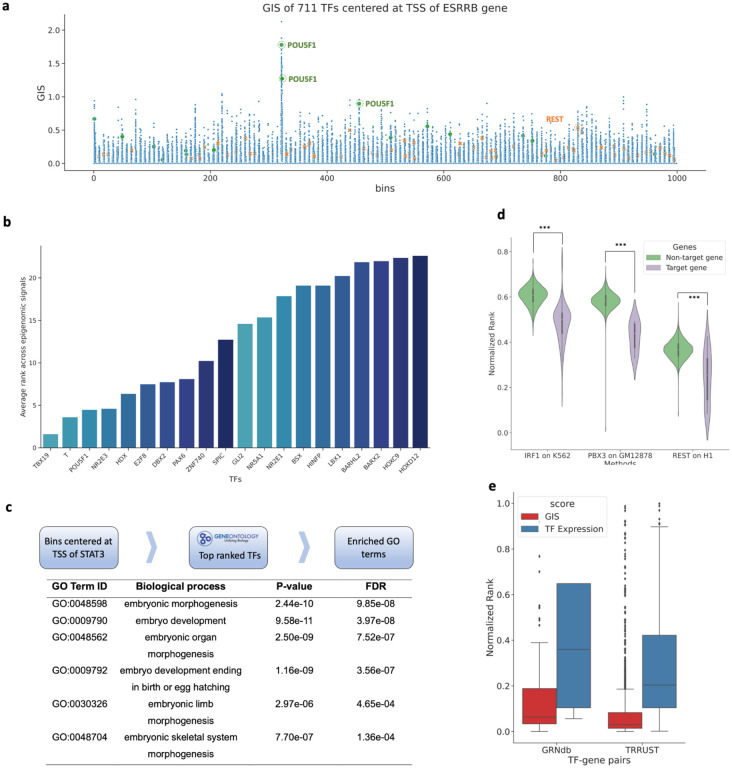
Fig. 4. Gradient importance scores (GIS) uncover regulatory transcription factors.
a, Genomic regions around TSS of the ESRRB gene and TF expression data on ESC were used in EpiGePT. The scatter plot represents the GIS scores of 711 TFs on each genomic bin. Each dot represents the GIS score of a core TF on a specific genomic bin. Two important ESC regulators REST and POU1F5 are highlighted. b, Bar plot of the top 5% ranked TFs, based on the average ranks from the GIS of eight epigenomic signals across bins (below). c, Based on the top 5% ranked TFs in 128kbp region centered at TSS of the ESRRB gene, gene ontology enrichment analysis revealed significant enrichment in biological processes related to embryonic development and cellular differentiation. d, Based on TF ChIP-seq data, all 23,635 human genes were classified into target genes and non-target genes. The results revealed that TFs exhibited significantly higher ranks on potential target genes compared to non-target genes. e, The distribution of the rank of TFs in the GIS and expression value among the 2,705 TF-gene pairs from the TRRUST database and 1,066 TF-gene pairs derived from genotype-tissue expression (GTEx) data of the liver sourced from the GRNdb database.

