

Abstract
Copper is one of a handful of biologically necessary heavy metals that is also a common environmental pollutant. Under normal conditions, copper ions are required for many key physiological processes. However, in excess, copper quickly results in cell and tissue damage that can range in severity from temporary injury to permanent neurological damage. Because of its biological relevance, and because many conserved copper-responsive genes also respond to other non-essential heavy metal pollutants, copper resistance in Drosophila melanogaster is a useful model system with which to investigate the genetic control of the response to heavy metal stress. Because heavy metal toxicity has the potential to differently impact specific tissues, we genetically characterized the control of the gene expression response to copper stress in a tissue-specific manner in this study. We assessed the copper stress response in head and gut tissue of 96 inbred strains from the Drosophila Synthetic Population Resource (DSPR) using a combination of differential expression analysis and expression quantitative trait locus (eQTL) mapping. Differential expression analysis revealed clear patterns of tissue-specific expression, primarily driven by a more pronounced gene expression response in gut tissue. eQTL mapping of gene expression under control and copper conditions as well as for the change in gene expression following copper exposure (copper response eQTL) revealed hundreds of genes with tissue-specific local cis-eQTL and many distant trans-eQTL. eQTL associated with MtnA, Mdr49, Mdr50, and Sod3 exhibited genotype by environment effects on gene expression under copper stress, illuminating several tissue- and treatment-specific patterns of gene expression control. Together, our data build a nuanced description of the roles and interactions between allelic and expression variation in copper-responsive genes, provide valuable insight into the genomic architecture of susceptibility to metal toxicity, and highlight many candidate genes for future functional characterization.
Keywords: heavy metals, gene expression, eQTL mapping, DSPR
Introduction
Many forms of stress resistance contribute to the overall health of the individual, both through immediate consequences brought on by direct exposure to the stressor, and indirectly by increasing the risk of experiencing deleterious consequences in the future. Heavy metals are one such type of stressor. Broadly, exposure to heavy metals results in oxidative stress due to the reactive state of metal ions (Stohs and Bagchi 1995; Ercal et al. 2001; Jomova et al. 2010). Acute exposure can cause gastrointestinal distress and vomiting as well as damage to intestinal lining (Taylor et al. 2020; Gerhardsson 2022). Chronic heavy metal exposure has been linked to neurodegenerative diseases in humans including Alzheimer’s and Parkinson’s Disease in adults (Bonilla-Ramirez et al. 2011; Chen et al. 2016b; Bagheri et al. 2018; Liddell and White 2018; Bisaglia and Bubacco 2020) and learning and behavioral disorders in developing individuals (Jomova et al. 2010; Blaurock-Busch et al. 2011; Hsueh et al. 2017; Lee et al. 2018). Additionally, exposure can increase morbidity associated with health conditions including multiple sclerosis and osteoporosis (Åkesson et al. 2006) as well as anemia (Turgut et al. 2007). Heavy metal exposure risk is often related to occupation (Castilla and Nealler 1978; Neuberger et al. 1990; World Health Organization et al. 1996; Khan et al. 2008; Karnchanawong and Limpiteeprakan 2009; He et al. 2015; Knoblauch et al. 2017), and like many diseases ((e.g., type 2 diabetes, Crohn’s disease, heart disease, IBD (http://www.genome.gov/gwasstudies) (Hindorff et al. 2009; Plomin et al. 2009)), susceptibility to metal stress is a genetically complex trait (Zhou et al. 2016; Everman et al. 2021, 2023).
Quantitative trait locus (QTL) mapping has provided a powerful means of characterizing allelic variation that contributes to lead, cadmium, copper, and zinc resistance in several model systems including worms, flies, yeast, and plants (MacNair 1983; Jones et al. 2006; Bálint et al. 2007; Courbot et al. 2007; Ruden et al. 2009; Ehrenreich et al. 2012; Evans et al. 2018; Everman et al. 2021). The D. melanogaster model system has been leveraged in several of these studies to examine the genetic architecture of metal stress response. It is an excellent model because all of the major genes that are involved in metal detoxification play similar roles in humans, allowing for the insight gained from work in Drosophila to have broader applications for understanding the impact of heavy metals on human health (Balamurugan et al. 2004; Egli et al. 2006a; b; Turski and Thiele 2007; Burke et al. 2008; Hatori and Lutsenko 2013; Calap-Quintana et al. 2017; Zhou et al. 2017). Genome-wide association mapping in flies revealed multiple SNPs that are associated with resistance to lead and cadmium toxicity (Zhou et al. 2016, 2017), and we previously demonstrated that resistance to copper toxicity is influenced by multiple QTL that included several conserved genes involved in copper metabolism and homeostasis (Everman et al. 2021). Collectively these studies have provided valuable insight into naturally occurring genetic variants that contribute to variation in resistance to several common heavy metal pollutants. However, most studies that examine the genetic control of heavy metal resistance have focused either on the whole-animal response or on single tissues. Furthermore, work over the last decade has clearly demonstrated that the majority of sites that influence trait variation are more likely to have impacts on gene regulation rather than to result in protein coding changes (Pickrell 2014; Zhang and Lupski 2015; reviewed in Boyle et al. 2017; Alsheikh et al. 2022). Therefore, an important opportunity remains to characterize the genetic control of the gene expression response to heavy metal stress and to determine the degree to which this control varies across tissues.
Transcriptomics studies have repeatedly demonstrated that exposure to heavy metal stressors increases expression of several gene families involved in metal detoxification, metabolism, and transport as well as oxidative stress response (González et al. 2008; Catalán et al. 2016; Calap-Quintana et al. 2017; Qu et al. 2018; Everman et al. 2021; Felmlee et al. 2022; Green et al. 2022). However, the gene expression response to metal stress is itself also subject to genetic variation in the control of the transcriptional response, i.e., different genotypes can vary in their response to the same exposure (Findley et al. 2021). The loci that contribute to variation in the gene expression response can be identified using expression QTL (eQTL) mapping (Jansen 2001; De Koning and Haley 2005; Gilad et al. 2008). By combining RNA sequencing and eQTL mapping, we examined the tissue-specific genetic control of the gene expression response to the common metal pollutant copper using the D. melanogaster model system.
Although a broad oxidative stress response is expected across tissues in response to metal stress, copper is one of several heavy metals that have the potential to elicit different gene expression responses in neurological and gut tissue. This expected tissue-specific difference is in part due to the spatial distribution of specialized copper accumulation cells found in the gut of most animals including flies and humans (Calap-Quintana et al. 2017; Miguel-Aliaga et al. 2018). Genes that are responsible for maintaining normal homeostasis of the set of essential heavy metals (e.g., copper and zinc), and that play a role in the expulsion of toxic metals such as cadmium and lead, are primarily expressed in these specialized cells where they play an important protective role against excess metal ions (Calap-Quintana et al. 2017). Here we compared the gut response with that of head tissue due to the link between metal exposure and neurological disease in humans (Chen et al. 2016b), and for the opportunity to characterize differences in the tissue-specific response to oxidative stress using copper as a model metal.
Our study leverages the Drosophila Synthetic Population Resource (DSPR (King et al. 2012a)), a panel of multiparental, advanced intercross strains exhibiting dramatic variation in copper resistance that we have previously employed to map numerous QTL for resistance (Everman et al. 2021). Here we build on this study and use a subset of 96 strains to characterize the regulatory control of copper stress. Since the DSPR is composed of genetically stable inbred strains, it is especially well suited to eQTL mapping studies that quantify expression across tissues and treatments. We identified thousands of eQTL in both gut and head tissue using animals exposed to either control or copper-exposure treatments. Tissue-specific genetic control of gene expression was extensive, suggesting that regulatory variation has the potential to have profound, yet context-specific effects on susceptibility to heavy metal stress. Ultimately, our characterization of the genetic control of gene expression response to copper stress provides nuanced insight into the genetic control of heavy metal resistance and its potential health consequences.
Methods
Fly stocks
We used the Drosophila Synthetic Population Resource (DSPR), a large multiparental mapping panel with >1500 recombinant inbred lines (RILs) (see King et al. 2012a, b for additional details). In a previous study, we exposed 60 adult females from each of 1556 RILs (767 and 789 RILs from the A and B populations, respectively) to 50mM CuSO4, expressing resistance as the percentage of adults alive at 48 hours (Everman et al. 2021). For the present study, we selected 48 of the “resistant” RILs from the B population that were in the top 25% of the distribution of adult copper resistance and 48 of the “sensitive” RILs from the bottom 25% of the distribution (Figure S1).
Rearing and assay conditions
Flies were reared and assayed across multiple batches in the same incubator at 25°C and 50% humidity with a 12:12hr light:dark photoperiod. To maintain consistency with prior work, experimental females for the present study were obtained from each of the 96 DSPR RILs in the same manner used to measure adult copper resistance (Everman et al. 2021). Briefly, adults were placed on cornmeal-molasses-yeast media and were allowed to oviposit for 2 days before being discarded. Experimental females from the following generation were sorted over CO2 into groups of 20 and allowed to recover for 24 hours on fresh cornmeal-molasses-yeast media. Following recovery, 3–5 day old females were transferred to Instant Drosophila Media (Carolina Biological Supply Company 173200) hydrated with either water (control) or 50mM CuSO4 (Copper(II) sulfate, Sigma-Aldrich C1297) and exposed to treatment conditions for 8 hours, after which tissues were harvested (see below). The 8-hour exposure period lasted from lights on (0800hrs) to 4 hours before lights off. No flies died during the 8-hour exposure period.
Strains were assayed in a series of small batches to accommodate the time required for tissue processing following the exposure period, with sensitive and resistant RILs evenly distributed across each batch. Given the different processing techniques for heads and gut, we obtained these tissues from different individuals of the same genotypes in different batches. The average batch size for head collection was 25 DSPR RILs and average batch size for gut dissection was 6 DSPR strains.
Tissue collection, RNA isolation, and sequencing library preparation
To obtain head tissue, we exposed 60 females per DSPR RIL to control and copper conditions (three vials of 20 females per treatment) for 8 hours. At the end of the exposure period, flies from each treatment and RIL were moved to a labeled screw-top 50mL tube, flash frozen in liquid nitrogen, immediately vortexed to separate heads from bodies, and then stored at −80°C for up to five days. We used a series of three-inch diameter stacking brass sieves – chilled on dry ice for at least five minutes to prevent tissue thawing – to isolate the heads from each sample (see Supplementary Methods). Heads for each RIL/treatment were dispensed into a screw-top microcentrifuge tubes containing 3–4 glass beads and held on dry ice. Subsequently, we added 300μL TRIzol Reagent (Invitrogen, 15596018) to each sample and stored samples at −80°C until RNA extraction.
To obtain gut tissue, we exposed 20 females per DSPR RIL to control and copper conditions for 8 hours. Guts, including the fore-, mid-, and hindgut, were dissected from 10 live individuals per RIL/treatment combination in 1X PBS and placed in screw-top microcentrifuge tubes containing 3–4 glass beads and 300μL TRIzol. Samples were chilled on ice during dissection and stored at −80°C until RNA extraction.
RNA was extracted from each of the 384 samples in batches of 30 samples using the Direct-zol RNA Miniprep kit (Zymo Research, R2050). Batches consisted of samples from the same tissue and were processed in the order individual samples were collected. RNA was eluted in 50μL water, and concentrations were determined via a NanoDrop spectrophotometer and then standardized to 20ng/μL in 96-well plates. Because head and gut tissues were not collected contemporaneously, two plates contained samples from heads and two contained samples from gut tissue. The order of the samples from each RIL and treatment was largely consistent across the head and gut sets of plates; all plates included both copper and control samples for a given RIL and held an even representation of sensitive and resistant RILs (Table S1).
Half-reaction, unique dual indexed TruSeq Stranded mRNA sequencing libraries (Illumina, 20020595) were generated and sequenced by the University of Kansas Genome Sequencing Core. Concentrations for every library were obtained using the Qubit dsDNA HS assay kit (ThermoFisher, Q32854), and successful libraries were pooled based on concentration within each of the four tissue-specific plates described above (Table S1). This resulted in two pools of head libraries (one 94- and one 96-plex), and two pools of gut libraries (one 93- and one 96-plex). Paired-end 37bp reads were obtained by sequencing each pool separately on NextSeq550 High-Output flowcells. Raw read counts for the 94-plex Head, 93-plex Gut, and 96-plex Gut libraries were 5.1 – 5.6 million PE37 read pairs per sample (Figure S2). The initial sequencing run of the 96-plex Head library pool under-clustered, so the pool was sequenced a second time on a NextSeq550 Mid-Output flowcell. Assessment of the reads revealed no difference in our ability to map reads from either run (Figure S3), so we combined reads across the two runs, resulting in an average of 3.8 million PE37 read pairs per sample for this library pool (Figure S2).
Sequencing data preprocessing
Read alignment and gene filtering
Quality assessment, adapter removal and read trimming (retaining reads with a minimum of 15 bp, Figure S4) were performed with fastp (v. 0.20.1) (Chen et al. 2018). Only paired reads were retained. Filtered read pairs were aligned in a variant-aware manner to the Drosophila reference genome (Release 6.33) using HISAT2 (v. 2.1.0) (Kim et al. 2019). SNP variants identified in the DSPR founders (http://wfitch.bio.uci.edu/~tdlong/SantaCruzTracks/DSPR_R6/dm6/variation/DSPR.r6.SNPs.vcf. gz) were included in the HISAT2 genome index following instructions provided with the software. Aligned reads were sorted with SAMtools (v. 1.9) (Li et al. 2009) and quantified with featureCounts (v. 2.0.1) (Liao et al. 2014). Post alignment and quantification analyses were all performed in R (v. 4.1.3) (R Core Team 2017). Average library size prior to additional filtering was 4.03 million reads. In R, genes with low expression were filtered out by first removing genes with zero counts across all samples and then by removing genes with fewer than 10 counts in 47 samples (the number of samples unique to each of the three-way interaction categories, e.g. low copper resistance head tissue samples exposed to copper stress (Chen et al. 2016a)). Following filtering, 9842 genes were retained for downstream analyses.
Comparison between alignment pipelines
We also aligned fastp-filtered reads using the kallisto (v. 0.46.2 (Bray et al. 2016)) pseudoalignment pipeline and the Ensembl Drosophila transcriptome release 90. Average library size was 3.96 million reads following kallisto alignment. We applied the same post-alignment filtering parameters described above to the kallisto generated counts. Because kallisto alignment generates output quantified by transcript, filtering resulted in retention of a slightly different set of genes totaling 9913 genes, 9434 of which were shared with the filtered HISAT2 gene set. To compare gene expression results from the HISAT2 and kallisto pipelines, we calculated gene-wise correlations in expression following log2 transformation and quantile normalization across the 379 libraries. Sample and tissue-specific read counts for the 9434 genes retained in both the kallisto and HISAT2/SAMtools/featureCounts pipeline were highly correlated (mean R = 98.2%, Figure S5). Correlations for normalized gene counts within each tissue/resistance class/treatment set of samples were also high (96% - 97%). The 267 genes with counts that were less than 90% correlated between the two pipelines were not enriched for any functional or molecular categories following gene ontology analysis (Flymine, (Lyne et al. 2007)), suggesting that differences in gene expression counts were not due to systematic discrepancies between pipelines. Given the high consistency between pipelines, all downstream differential expression (DE) analyses and eQTL mapping presented below are derived from the HISAT2/SAMtools/featureCounts pipeline.
Effect of tissue, treatment, and resistance class on gene expression
Gene expression was normalized using the weighted trimmed mean of M-values (mean of log expression ratios (Robinson and Oshlack 2010)), and DE analysis was performed with limma (Ritchie et al. 2015) by fitting the full-factorial linear model (Expression ~ Tissue * Treatment * Resistance class + Sample Pooling). The “Sample Pooling” model term accounts for technical variation due to plate, library pool and/or sequencing flowcell (these 3 factors cannot be distinguished in our design). Genes with expression variation significantly influenced by each term in the model were identified by fitting contrasts to the full model in limma with the contrasts.fit function. This step was followed by the eBayes function, which uses an empirical Bayes method to calculate log fold change in normalized gene expression and to determine significance between each group identified by the contrast (contrast order: expression in gut relative to head tissue, copper relative to control treated samples, sensitive relative to resistant strains). Significant DE was determined using adjusted P values to account for multiple comparisons (Benjamini-Hochberg multiple test correction, FDR threshold = 5%).
Tissue and treatment-specific eQTL analysis
We performed eQTL mapping for 6 separate datasets, testing different numbers of gene expression traits in each due to some genes having tissue- and/or treatment-specific expression (Head-Control: 9783, Head-Copper: 9842, Head-Response: 9830, Gut-Control: 9842, Gut-Copper: 9842, Gut-Response: 9841 genes). The “Response” to copper treatment was calculated as gene expression under copper conditions minus expression under control conditions for all paired samples. Positive Response values indicate genes with higher expression under copper conditions (copper treatment-induced), while negative Response values indicate genes that are repressed by copper treatment. Each of the six datasets was separately quantile normalized following log2 transformation. To preserve the direction of gene expression change in both Response datasets, we performed log2 transformation and quantile normalization on the absolute values of the copper-response expression and reassigned the sign following normalization.
We corrected expression measures for variation due to technical and environmental factors using principal components analysis (PCA; described in further detail below). Separately for each dataset, gene expression was corrected by regressing out the effects of PCs that explained more than 2% of the variance in gene expression, or that were correlated with known technical factors. eQTL mapping was performed on quantile normalized residual gene expression for each of the six datasets using R/qtl2 (Broman et al. 2019). eQTL mapping treats each gene expression measure as a trait, and we test for associations between genotype and variation in gene expression at each genome marker (every 10kb in the DSPR (King et al. 2012a)). For each gene, we regressed expression on additive probabilities indicating the likelihood that a particular region of the genome was inherited from one of the 8 DSPR founders. Gene-specific significance thresholds were assigned by permuting gene expression estimates among the DSPR strains 1000 times.
Given the modest sample size for each eQTL analysis (93–96 DSPR strains), we defined QTL intervals using a 3-LOD drop, since a 2-LOD drop can give overly narrow intervals when fewer RILs are assayed (King et al. 2012a). cis eQTL were defined as above-threshold peaks for which the upper or lower boundary of the 3-LOD drop was within 1.5cM of the target gene, while peaks outside this interval were classified as distant or trans eQTL. We note that broader peak intervals result in more peaks being designated as cis eQTL and fewer peaks as trans eQTL (King et al. 2014; King and Long 2017). Peaks were removed if they consisted of a single, above-threshold marker, or if the peak position was outside the lower and upper peak boundary (such phenomena are more common in experiments with limited sample size and are often found near telomere and centromere regions where the impact of low power is exacerbated). eQTL peaks, estimated founder effects, and percent variance were identified and calculated using custom code derived from the DSPRqtl (King et al. 2012b) and R/qtl2 mapping programs.
We examined the six datasets for evidence of eQTL that were shared among datasets. Comparisons were made between tissues within treatment (Head-Control vs Gut-Control, Head-Copper vs. Gut-Copper, Head-Response vs. Gut-Response) and within tissue between treatments (Heads-Control vs Heads-Copper and Gut-Control vs Gut-Copper). Our ability to identify shared eQTL across multiple datasets is influenced by power to detect eQTL and the effect size of the eQTL. In an attempt to account for increased uncertainty, eQTL were considered shared if the peak positions were within 1.5cM of each other and/or if the peak intervals overlapped.
PCA correction of gene expression for eQTL analysis
A common strategy to reduce spurious gene-eQTL associations in high-dimensional data is to use PCA to account for known and unknown technical or environmental factors (Leek and Storey 2007; Pickrell et al. 2010; Gaffney et al. 2012; King et al. 2014). To determine the most appropriate PCA correction for our data, we compared three versions of the eQTL mapping analysis using 1) uncorrected data, 2) data corrected for PCs that explained more than 2% of the variance and/or were correlated with tissue collection batch or sample pool (general linear model test of the effect of technical variation on PC, uncorrected α = 0.05) and 3) data corrected for PCs that explained more than 1% of variance and/or were correlated with technical variation. The set of PCs accounted for in each case are listed in Table S2. For brevity, we will simply refer to the two PCA-corrected versions of the dataset as 2% and 1% corrected. Corrections were made by regressing out PCs separately for each of the six expression datasets. Residuals were quantile normalized once more and treated as gene expression values for each of the eQTL analyses and for all downstream analyses.
We performed the three eQTL analyses (no correction, 2% correction, 1% correction) for each of the six datasets as described above. In Head-Control, Head-Copper, Gut-Control, and Gut-Copper eQTL analyses, failing to correct for technical variation via PCA resulted in many more peaks far from the target gene compared to the 2% and 1% cutoffs. Because not correcting for technical factors increases noise, it is likely the large number of distant peaks in the uncorrected data includes many more false positives than true trans eQTL (Figure S6). The relationship between peak number and data correction strategy was more pronounced for head samples, likely due to the known technical effect of sequencing pool (Figure S6) that we account for in the PCA-corrected versions. Head- and Gut-Response data were less sensitive to the PCA correction (Figure S6, S7). Removing PCs explaining 1% of the variance further reduced the total number of peaks in both head and gut analyses relative to the 2% variance correction (Figure S7). However, this difference was slight, and overall levels of noise observed in individual LOD plots were visually and statistically similar between the 2% and 1% data correction (average correlation in genome-wide LOD scores between 1% and 2% corrected data for genes with eQTL ranged from 70% - 83%; Figure S8). To avoid removing true positives through use of a strict 1% cutoff, all subsequent analyses/results employ the 2% PCA-corrected version of the dataset.
Identification of eQTL hotspots
Identification of eQTL hotspots in each of the six eQTL mapping datasets entailed two initial steps. First, we used a chi-square goodness of fit test, assessing each dataset separately, to determine if trans eQTL were overrepresented in any of the 2cM intervals distributed along each chromosome arm. Second, because the chi-square test only indicates whether any interval on the chromosome arm had an observed number of eQTL that deviated from expected number of eQTL, we calculated the percent contribution of each interval to the overall chi-square value. Percent contribution was calculated for each interval as
Intervals with a percent contribution value greater than 10% were considered potential hotspots. We chose 10% as a permissive threshold for detecting hotspots based on a visual assessment of percent contribution values as they varied across the chromosome arm. In most cases, our approach highlighted one interval per chromosome arm with enrichment for trans eQTL.
We took a three-step approach to further characterize trans eQTL hotspots and to identify potential regulatory candidate genes responsible for hotspots. Each step was carried out independently for each hotspot. First, we created a composite variable using PCA to summarize expression variation for all genes with a trans eQTL in that hotspot. We then used QTL mapping in the same manner as described above to isolate QTL for this composite variable (PC1), and if a peak was detected that overlapped the location of the hotspot, the hotspot was retained in subsequent steps.
Second, we repeated QTL mapping of the composite variable, but now iteratively tested whether each gene that fell within the hotspot interval had a mediating effect on the composite QTL peak by including the expression level of each gene as a covariate in the QTL analysis. If adding a gene expression covariate eliminated the composite variable QTL (or dramatically reduces the LOD score at the peak), the gene was a candidate mediating gene of the trans eQTL hotspot. The degree to which the LOD score was reduced by potential mediating genes varied across all the hotspots, making it difficult to establish a consistent cutoff value. We therefore assessed sets of mediating genes separately for each hotspot, and identified candidates that had the most pronounced mediating effect at the composite peak position. If several genes had similar mediating effects on the composite peak, we included them as candidates. This permissive approach produced a list of genes that should be considered for future follow up studies to further distinguish between true mediating genes versus those that have correlated expression with mediating genes. Because the 2cM intervals used to initially identify hotspots were created arbitrarily, we used the boundaries of the trans eQTL peak intervals to define the genomic region associated with the hotspot by using the most minimum and most maximum interval boundary for all trans eQTL in each hotspot. All the genes that fell within these expanded regions were included in this second step except for those genes that did not appear in our gene expression dataset. Some genes with very low levels of expression were removed from our expression datasets during filtering and so were not included in this analysis (see above). Covariate data used in each analysis corresponded to the dataset in which the hotspot was identified. For example, gene expression in gut tissue under copper conditions was used as covariate data to account for a composite variable derived for a hotspot detected in the Gut-Copper dataset.
Third, we further examined potential mediating genes by testing the correlation between estimated founder haplotype effects at any cis eQTL that happened to be associated with the potential mediating gene that fell within the hotspot interval. As in the second step, we used the cis eQTL that corresponded to the dataset in which the trans eQTL hotspot was detected.
Gene annotations and ontology analyses
We obtained annotation and ontology information for focal sets of genes highlighted by differential expression analysis, eQTL mapping, and assessment of eQTL hotspots using the Drosophila melanogaster annotation tool available from biomaRt (v. 2.50.3 (Durinck et al. 2005)) via Ensembl (Cunningham et al. 2022) and the orb.DM.eg.db R package (v. 3.14.0 (Carlson 2019)). Gene enrichment analyses were performed using the R package GOstats (v. 2.60.0 (Falcon and Gentleman 2007)), which uses hypergeometric tests for overrepresentation of GO terms with a correction for multiple tests.
Data availability
RNAseq reads are available from NCBI SRA BioProject PRJNA993605. All data including DE results, quantile-normalized expression data used for eQTL analyses, and code used to perform eQTL analyses are available from FigShare. Supplementary material contains Supplementary Methods that provide more detail on the isolation of head tissue as well as the alignment pipeline, code to carry out eQTL mapping analysis, and all input and output data generated for each analytical step.
Results
Effect of tissue, treatment, and resistance class on gene expression
A principal goal of our study was to characterize the gut- and head-specific gene expression responses to copper exposure in genetically diverse copper-sensitive and copper-resistant DSPR strains. Our differential expression model tested the three-way interaction between tissue (gut, head), treatment (control, 8-hour exposure to 50mM CuSO4), and DSPR strain resistance class (resistant, sensitive). The primary model parameters that influenced expression were tissue and treatment. Gene expression was strikingly distinct between gut and head samples resulting in differential expression (DE) of 8915 of the 9842 genes tested (91% of genes, 5% FDR; Figure 1A). Treatment alone influenced gene expression in 1156 genes (12%, Figure 1B), while resistance class alone influenced expression of three genes: asRNA:CR44107, CG18563 (involved in serine-type endopeptidase activity (Thurmond et al. 2019)), and CG6023.
Figure 1.

Gene expression varied between tissues and treatments. Here we employ PCA to depict variation in gene expression in the top differentially-expressed genes with FDR < 0.05 and log fold change > 1 for four significant model terms. Each PCA was carried out with a different set of genes: A. 5031 genes, B. 59 genes, C. 113 genes, D. 341 genes. The effect of tissue on gene expression is shown in (A) but is also evident in all other plots. B. Gene expression shifted in both head and gut tissue in response to copper exposure. C. Gene expression shifted in response to copper treatment in both head and gut tissue. Shifts were typically in the same direction in both tissues with a slightly higher magnitude response observed for genes in gut tissue relative to head, leading to the interaction. D. Tissue and resistance class interacted to influence gene expression, although the effect of resistance class was slight. The significant interaction was driven by a larger magnitude difference in expression between sensitive and resistant strains in the gut tissue in response to copper. In all plots, triangle symbols indicate head samples, circles indicate gut samples. Log2, quantile-normalized gene expression data were corrected for the effect of sequencing pool prior to clustering analysis.
We also found that for 70% of genes, expression was influenced by an interaction between tissue and treatment (Figure 1C). On average, this tissue x treatment interaction was driven by a response to copper exposure that was in the same direction in head and gut tissue, but that was more pronounced in gut tissue (Figure 1C). This pattern is consistent with the slightly larger effect of treatment alone in gut tissue (Figure 1B) and might be expected because flies were exposed to copper via ingestion in our assay. The effect of resistance class varied subtly between gut and head tissue, influencing 32% of genes (Figure 1D), with the interaction driven by a slightly greater effect of resistance class in gut tissue versus head tissue. The treatment and resistance class interaction did not influence the expression of any gene tested, and the three-way interaction between tissue, treatment, and resistance class influenced 13 genes (0.13%), of which 8 had known or predicted functions. None of the genes influenced by the three-way interaction were known copper response genes or had clear connections to metal toxicity response. Information on all DE genes is available in the Supplementary data.
Differential expression of copper-related genes
Seven genes that have been previously linked to binding, metabolism, and detoxification of copper were among the DE genes influenced by treatment (Figure 2A) and 28 genes in these categories were influenced by the tissue by treatment interaction (Figure 2B). For several genes that have been previously investigated in the context of copper toxicity, the change in expression across treatments/tissues was in the expected direction. For instance, Syx5 is a critical copper homeostasis gene that is required for proper accumulation of copper ions under normal (copper-scarce) conditions and is hypothesized to aid in proper localization of copper import proteins (Norgate et al. 2010). Norgate et al. (2010) demonstrated reduced expression of Syx5 increased resistance to excess copper. Complementing this previous work, we found exposure to copper stress significantly reduced expression of Syx5 in both head and gut tissues (Figure 2A), suggesting that downregulation of Syx5 in the whole organism may result from copper stress.
Figure 2.
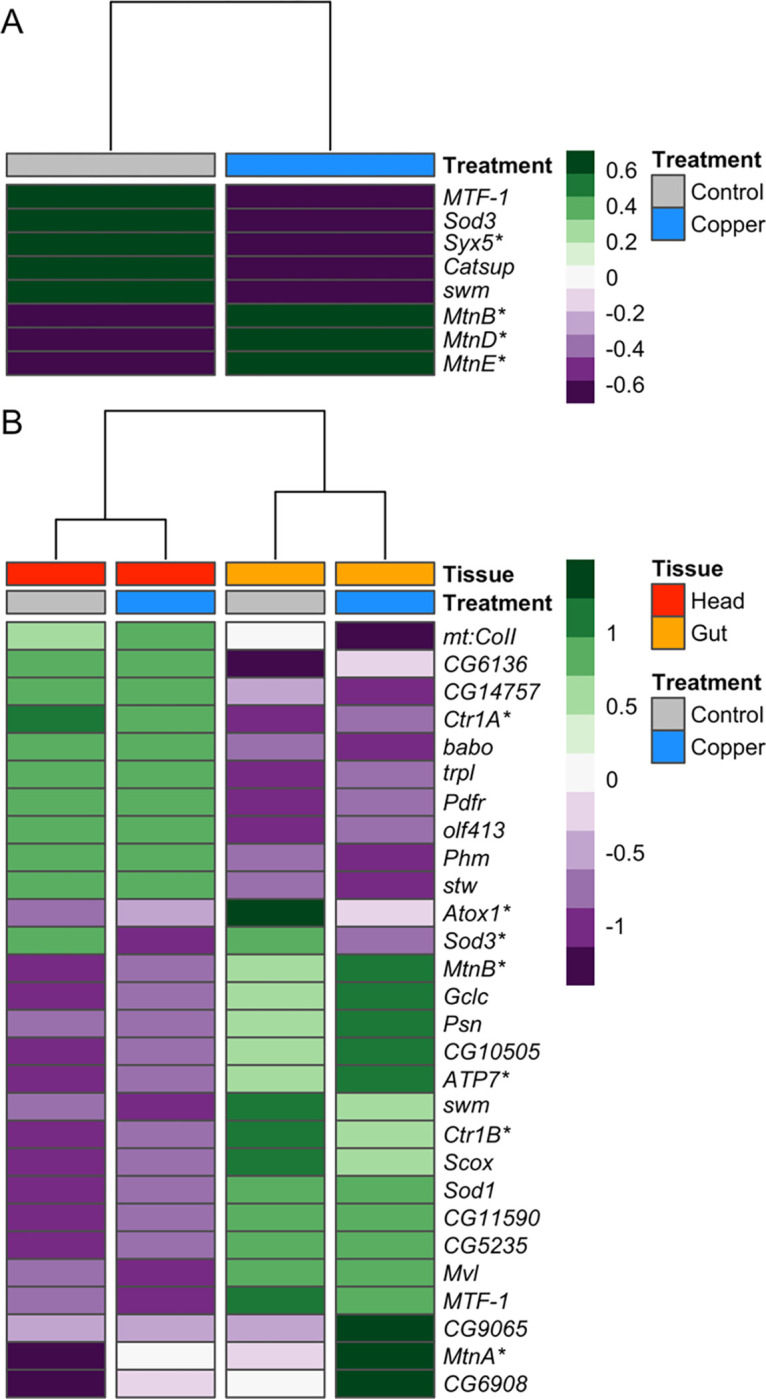
Treatment and the interaction between treatment and tissue influenced expression of several genes previously shown to be involved in detoxification, homeostasis, or binding of copper and other heavy metals. A. Heatmap of genes differentially expressed due to treatment that have been previously associated with copper ion response. B. Heatmap of genes differentially expressed due to the interaction between tissue and treatment. In both heatmaps, tissue and treatment groups are indicated at the top of the heatmaps, and gene expression is presented as average normalized expression for strains belonging to the two resistance classes. Asterisks beside gene names highlight genes discussed in text.
Expression of the metallothionein family genes in response to copper stress was also consistent with expectations. Copper exposure was expected to increase expression of the metallothionein genes, which are involved in the sequestration of excess copper ions as a first defense against copper toxicity (Egli et al. 2006a; Calap-Quintana et al. 2017). Further, expression was expected to be higher in gut compared to head tissue because primary expression of metallothioneins has been shown to occur in specialized copper accumulating cells that line the midgut in flies (Calap-Quintana et al. 2017) As expected, we found that expression of four metallothioneins (MtnA, MtnB, MtnD, and MtnE) was significantly increased in response to copper exposure in both head and gut tissue but the increase in expression was more pronounced in gut tissue (Figure 2).
Three key copper transporters (Ctr1A, Ctr1B, and ATP7) were also among the genes influenced by an interaction between tissue and treatment that followed expected expression patterns based on previous reports. The ATP7 and Ctr1B copper transporters function primarily in specialized copper-accumulating cells that line the intestine in mammals and the midgut in flies (Zhou et al. 2003; Turski and Thiele 2007; Calap-Quintana et al. 2017), whereas the Ctr1A copper transporter is ubiquitously expressed in both mammals and flies (Turski and Thiele 2007; Calap-Quintana et al. 2017). Under control and copper conditions, we observed higher expression of ATP7 and Ctr1B in gut tissue relative to head tissue and higher expression of Ctr1A in head tissue compared to gut tissue (Figure 2B). Our data are also consistent with previous reports that Ctr1A/B copper importers are downregulated in D. melanogaster in response to copper overexposure (Zhou et al. 2003; Calap-Quintana et al. 2017) as we observed a decrease in expression of both Ctr1A and Ctr1B following copper exposure. The pattern of decreased expression in response to copper was consistent across tissue but was more pronounced in head tissue (Ctr1A) or gut tissue (Ctr1B) depending on the gene. Although ATP7 expression under control conditions followed tissue-specific expectations, we observed that exposure to copper stress significantly increased ATP7 expression, a pattern that was more pronounced in gut tissue (Figure 2B). ATP7 is a major copper exporter (Zhou et al. 2003), facilitating the transfer of copper from copper accumulating cells in the gut to other tissues. Increased copper export under stressful conditions may play an important role in the response to copper toxicity.
Expression of the copper chaperone Atox1 was also differentially affected by treatment and tissue. As proteins, Atox1 transports copper to ATP7 (Calap-Quintana et al. 2017; Kamiya et al. 2018) and to the extracellular antioxidant enzyme SOD3 (Itoh et al. 2009; Kamiya et al. 2018). Both Atox1 and Sod3 were more highly expressed in gut tissue than in head tissue (Figure 2B), and exposure to copper stress led to a decrease in expression of both genes. Work presented by Itoh et al. (2009) suggests that this shift in expression may be mechanistically linked because Atox1 functions both to transfer copper to SOD3 and to regulate its expression as a copper-dependent transcription factor (Itoh et al. 2009). Under normal conditions, null mutations in Atox1 have been shown to lead to copper deficiency, and excess copper led to decreased Atox1 protein expression in wild-type flies (Hua et al. 2011).
To characterize the tissue-specific stress responses more broadly we used gene ontology analysis of those genes showing significant tissue by treatment interactions in our differential expression analysis. Of the 6362 genes with tissue- and treatment-specific patterns in expression, 778 could be categorized into one or more stress response categories (Table 1). As expected, when examined on a gene-by-gene basis within each category we often saw different responses to copper stress in head and gut tissue, indicating a range of tissue-by-treatment interactions (Figure 3A). However, when the average response of genes in each GO category was considered, we found that the overall expression response to copper treatment was often more pronounced in gut tissue compared to head tissue (Figure 3B). This pattern was observed for regulation of and response to stress (both cellular and general), response to endoplasmic reticulum stress, and categories related to stress-activation of the MAPK and protein kinase signaling cascades (Figure 3B). In contrast, copper-induced shifts in expression of genes involved in the response to oxidative stress was more pronounced in head tissue compared to gut tissue (Figure 3B). Importantly, each of the oxidative stress response genes also contribute to each of the categories that showed a more pronounced response in gut tissue. This implies that oxidative stress response is also elevated in gut tissue, but it is one stress response pathway among many that are activated in the gut, whereas in head tissue oxidative stress response is singularly pronounced.
Table 1.
Enrichment of stress-related GO categories (5% FDR) in genes with a tissue by treatment interaction.
| Term | GO ID | N Genes in GO Category | N Genes (%) with sig Interaction | P Value |
|---|---|---|---|---|
|
| ||||
| Response to stress | GO:0006950 | 1321 | 735 (56%) | <2.47e−24 |
| Regulation of response to stress | GO:0080134 | 346 | 218 (63%) | <5.97e−15 |
| Cellular response to stress | GO:0033554 | 646 | 370 (57%) | <6.83e−15 |
| Response to oxidative stress | GO:0006979 | 140 | 91 (65%) | <5.83e−8 |
| Regulation of metal ion transport | GO:0010959 | 57 | 40 (70%) | <2.16e−5 |
| Response to endoplasmic reticulum stress | GO:0034976 | 89 | 57 (64%) | <3.27e−5 |
| Stress-activated protein kinase signaling cascade | GO:0031098 | 88 | 56 (64%) | <4.99e−5 |
| Regulation of cellular response to stress | GO:0080135 | 131 | 78 (60%) | <5.95e−5 |
| Stress-activated MAPK cascade | GO:0051403 | 87 | 55 (63%) | <7.58e−5 |
| Cellular response to metal ion | GO:0071248 | 15 | 13 (87%) | <5.68e−4 |
Figure 3.

778 genes with a significant tissue by treatment interaction effect could be classified by their involvement in stress response pathways. A. At the gene level, mean expression across DSPR strains under copper and control conditions in gut and head tissue demonstrated many distinct tissue and treatment specific patterns of expression response to copper. B. When expression was summarized at the level of GO category, we found that most genes that are involved in cellular response to stress, regulation of stress response, response to endoplasmic reticulum stress, and involvement in stress-activated MAPK and protein kinase signaling had a more pronounced response in gut tissue compared to head tissue. Conversely, genes involved in the response to oxidative stress had a more consistently pronounced response in head tissue compared to gut tissue. Data shown are mean expression response for all genes in each treatment and tissue combination +/− SE. In both plots, gold indicates gut samples; red indicates head samples.
Overall, we found pervasive differences in expression between tissues, with many genes – including candidate metal responsive genes – showing an expression change in response to copper treatment as well as variation in copper response among tissues. We previously reported a minor effect of DSPR strain-specific copper resistance on the gene expression response to copper (Everman et al. 2021). Classifying DSPR strains into copper resistant and susceptible classes in the present study explained relatively little of the expression variation, and resistance class influenced only a small number of genes, none of which are members of known metal response pathways. Many of the key copper response genes highlighted above and in Figure 2 and Figure 3 have essentially equal expression in resistant and sensitive strains, suggesting that the base level toxicity response to our copper treatment is similar between resistant and sensitive strains assayed in this study.
Expression QTL mapping
Properties of mapped eQTL
eQTL mapping was executed for 6 datasets: Head-Copper, Head-Control, Head-Response, Gut-Copper, Gut-Control, Gut-Response (see Methods for additional detail). In total over all datasets, 4377 genes were associated with at least one eQTL and 98% of these 4377 genes were differentially expressed due to one or more of the DE model terms and interactions (described above). For most genes (83–98%; Table 2), we detected one eQTL (either cis or trans) per gene per dataset (Figure S9). Genes with more than one eQTL per dataset included a multidrug resistance gene Mdr65 and two cytochrome p450 genes Cyp6t3 and Cyp12d1-d, which have been linked to response to insecticides (Daborn et al. 2007; Esteves et al. 2021). Two genes linked to copper ion binding and homeostasis (Mco1 and CG6908 (Lang et al. 2012; Thurmond et al. 2019)) were also among the genes with multiple eQTL per dataset. However, no gene enrichment related to metal detoxification or response was evident in genes with more than one eQTL peak per dataset. Gene annotation and GO analysis for genes with multiple eQTL is available in the Supplementary data.
Table 2.
Summary statistics for eQTL mapping analyses.
| Analysis | eQTL Type | N eQTL Peaks | N genes with eQTL | Total N unique genes with eQTL | % Genes with 1 eQTL peak | Mean Percent Variance (range) |
|---|---|---|---|---|---|---|
|
| ||||||
| Gut-Control | cis | 1784 | 1779 | 1993 | 96% | 43.1 (25.0–74.4) |
| Gut-Control | trans | 295 | 286 | 33.7 (10.4–63.0) | ||
|
| ||||||
| Gut-Copper | cis | 1677 | 1674 | 1860 | 97% | 42.4 (22.0–76.0) |
| Gut-Copper | trans | 248 | 237 | 33.4 (21.2–68.2) | ||
|
| ||||||
| Gut-Response | cis | 139 | 138 | 316 | 98% | 40.0 (25.5–72.5) |
| Gut-Response | trans | 183 | 180 | 32.3 (16.6–41.9) | ||
|
| ||||||
| Head-Control | cis | 1875 | 1869 | 2125 | 96% | 43.6 (22.8–76.8) |
| Head-Control | trans | 334 | 320 | 33.4 (18.3–66.4) | ||
|
| ||||||
| Head-Copper | cis | 1879 | 1870 | 2152 | 97% | 43.6 (23.9–78.1) |
| Head-Copper | trans | 351 | 343 | 34.2 (20.5–67.4) | ||
|
| ||||||
| Head-Response | cis | 34 | 34 | 197 | 83% | 34.3 (21.3–64.3) |
| Head-Response | trans | 235 | 167 | 30.0 (18.8–37.5) | ||
For each of the Control and Copper datasets, cis eQTL outnumbered trans eQTL (Table 2, Figure S7). In both Response datasets, we identified fewer eQTL overall but trans eQTL were more common than cis eQTL (Table 2, Figure S7). This pattern is anticipated because the Response datasets are based on the difference in gene expression between control and copper treatments, which should eliminate genetic effects on expression that are consistent in both treatments. Since the bulk of treatment-specific eQTL are cis eQTL, the Response data set is expected to have fewer eQTL with local effects.
Across all datasets, the percent variance in gene expression explained by individual eQTL ranged from 10.4% - 78.1% (Figure S10, Table 2). Consistent with previous work (Dixon et al. 2007; Emilsson et al. 2008; King et al. 2014; Albert et al. 2018; Keele et al. 2020), cis eQTL tended to have higher percent variance estimates compared to trans eQTL in each of the six datasets (Figure S10, Table 2), suggesting that cis eQTL tend to have a larger effect on transcriptional variation compared to trans eQTL (Gibson and Weir 2005). However, percent variance estimates are likely overestimated due to Beavis effects so should be assessed with care (Beavis 1995; King and Long 2017).
Tissue specificity of mapped eQTL
Although most genes had only one eQTL per dataset (Table 2), 53.7% of genes had one or more eQTL in at least two datasets. For instance, expression of the extracellular Copper/Zinc superoxide dismutase Sod3 was associated with a single eQTL per dataset but a similarly-located Sod3 cis eQTL was detected in five of the six datasets (Figure 4A, B). For other genes, eQTL in different datasets were clearly distinct. For example, expression of the metallothionein gene MtnA was associated with a trans eQTL in the Head-Copper dataset and a cis eQTL in the Gut-Copper dataset (Figure 4C, D). This implies that tissue-specific variants influence MtnA expression under copper stress.
Figure 4.

Many genes (53.7%) were associated with eQTL in multiple datasets, but these eQTL were often localized to distinct intervals. A. and B. Expression of the gene Sod3 was associated with cis eQTL in all datasets except Head-Response. C. and D. The gene MtnA was associated with a trans eQTL on chromosome arm 2L in the Head-Copper dataset (C) and was associated with a cis eQTL in the Gut-Control dataset (D). In all plots, the dashed horizontal line indicates the significance threshold based on permutation and the red triangle point indicates the position of the gene. LOD curves are colored based on treatment: gray = Control, blue = Copper, green = Response.
To determine whether a similarly localized eQTL was detected in multiple datasets, we examined eQTL overlap on a per gene basis between tissues within treatment (Head-Control vs Gut-Control, Head-Copper vs. Gut-Copper, Head-Response vs. Gut-Response) and within tissue between treatments (Heads-Control vs Heads-Copper and Gut-Control vs Gut-Copper). eQTL were classified as overlapping if the peak positions were within 1.5cM or if the peak intervals overlapped (see Methods). Overall, cis eQTL were more likely than trans eQTL to be detected in multiple datasets regardless of which datasets were compared (Figure S11). The number of eQTL that were detected in more than one dataset was highest in within-tissue comparisons (Figure S11A, B), whereas more eQTL were distinct between tissues within treatment (Figure S11C, D). eQTL detected in the Response datasets were most distinct with only 7 cis eQTL and no trans eQTL shared between Head- and Gut-Response datasets (Figure S11E). Together, these results are consistent with our DE analysis, which identified tissue as having the greatest impact on expression variation (Figure 1).
Within each tissue the majority of cis Response eQTL (64–85%) were also detected in the Control and Copper datasets while the majority of trans Response eQTL were unique to the Response dataset (Figure S11F–I). The overlapping cis Response eQTL were typically detected as cis eQTL in both Control and Copper datasets, suggesting that these cis eQTL are either associated with different variants in the Control and Copper datasets or that the variant has different additive or magnitude effects on the expression of genes under control and copper conditions. Thorough tests of this hypothesis are beyond the scope of our data; however, correlations between Response and Control or Copper founder haplotype effects at each eQTL suggest both patterns may contribute (Figure S12).
Overall, our eQTL mapping results suggest that regulatory variation influences gene expression in a tissue-specific manner for 2581 genes with distinct eQTL (detected in only one dataset) that were involved in a broad range of processes spanning response to stimulus to cellular metabolism (Figure S13). In contrast, regulatory variants influenced expression of 705 genes with shared eQTL that were detected in both head and gut tissues following copper exposure (Figure S13). These 705 genes were enriched for a smaller number of GO categories including metal response, detoxification, oxidative stress response, and similar stress response pathways (Figure S13). This observation suggests that the control of some major components of metal stress response is potentially consistent across tissues. This said, our data provide some evidence that founder haplotype effects at shared eQTL are not always consistent, suggesting that physically-overlapping eQTL do not necessarily represent identical genetic effects. For example, founder haplotype effects at shared cis eQTL in Head and Gut tissue associated with Mdr49, Mdr65, and Sid (involved in insecticide resistance (Sun et al. 2017; Denecke et al. 2017) and oxidative stress response (Seong et al. 2014)) were negatively correlated, implying the regulatory variant may have opposite effects on expression of these genes in head and gut tissue, or that the eQTL actually represent the effects of distinct variants (Figure S14).
We also assessed tissue-specific eQTL patterns using our differential expression analysis results as a guide. Of the 778 stress-related genes (defined using GO terms available from FlyBase) with a tissue by treatment interaction (Figure 3), 349 were associated with a mapped eQTL. Of the 349 genes, 269 had eQTL that were detected in up to three of the four main datasets (for instance, detected in head tissue under copper and control conditions but not in either gut dataset), indicating that most of the genes that were highlighted by DE analysis also had eQTL that followed a tissue- and treatment-specific pattern. Combining our DE and eQTL mapping results provides an additional layer of insight into how gene expression varies across tissue and treatment. For the 269 genes with differential expression and eQTL, allelic variation that influences gene expression variation likely contributes to overall tissue-specific responses to copper stress.
Treatment specificity of eQTL
We directly compared the Control and Copper eQTL mapping results within each tissue to identify genetic variants with treatment-dependent regulatory effects on gene expression as well as eQTL with regulatory effects on expression that are consistent over treatments. Overall, we found that eQTL detected under both control and copper conditions were common in head and gut tissue (Figure S11A, B). These overlapping eQTL were associated with expression of genes that included those related to metal response, toxicity response, and copper stress, which resulted in enrichment of gene ontology terms related to stress responses that are consistent with the effects of heavy metal stress (Figure S15). Interestingly, while copper treatment changed the level of expression of metal response genes (based on GO annotation from FlyBase) with eQTL shared by both treatments (Figure 5A, D), the estimated founder haplotype effects at eQTL were generally consistent under both copper and control conditions (Figure 5B, E), i.e., the genetic effects on expression are largely preserved over treatment. Despite this, eQTL had larger effects on gene expression under copper conditions relative to control conditions in both tissues (Head Tissue: F3,1496 = 529.2, P < 0.0001, Figure 5C; Gut Tissue: F3,1258 = 311.2, P < 0.0001, Figure 5F), and this pattern was most pronounced for eQTL associated with metal response genes in gut tissue (Head Tissue, metal responsive vs non-metal responsive interaction: P = 0.4, Figure 5C; Gut Tissue, metal responsive vs non-metal responsive: P < 0.05, Figure 5F). Therefore, when genes have eQTL in both copper and control treatments, the eQTL contributes to expression variation in each environment in a similar way, but with the magnitude of the eQTL effect varying over tissue.
Figure 5.

eQTL shared between control and copper conditions are influenced by regulatory variants in a consistent manner across treatments. A. and D. Genes previously linked to copper response, toxicity response, and oxidative stress (metal response genes) shifted in expression level in response to copper treatment in head (A) and gut (D) tissue. B. and E. Founder haplotype estimated effects for shared eQTL were similar under copper and control conditions for both metal response (blue) and non-metal response genes (grey) in head (B) and gut (E) tissues. C. and F. Percent variance explained by shared eQTL estimated in control and copper conditions was positively correlated but indicated larger effects on expression under copper conditions (C, Head Tissue: F3,1496 = 529, r2 = 51%, P < 0.0001; F, Gut Tissue: F3,1258 = 312.2, r2 = 43%, P < 0.0001). We found an interaction between percent variance estimates under control and copper conditions for metal response vs non-metal response gene in gut tissue, suggesting that the additive shift in effect size was greater for metal response gene expression variation under copper conditions. In both C and F the dashed line indicates the 1:1 slope to illustrate the reduced slopes of the regressions. Solid lines indicate the best fit using glm estimation and shading indicates the 95% confidence interval of the regression.
eQTL detected in just one of the two treatment conditions per tissue represent potential loci with genotype by environment effects on gene expression. Compared to shared eQTL, there were fewer distinct eQTL between the copper and control treatments for head and gut tissue (Figure S11A, B). In head tissue, we found copper-specific eQTL associated with genes enriched for functions related to ion, cation, and metal ion transport (Figure S16A). Copper-specific head eQTL were associated with several copper-related genes including MtnA, Mco1, Mco4, Loxl2, and CG17996 (Thurmond et al. 2019; The UniProt Consortium et al. 2021). Of note are MtnA and Mco1. MtnA encodes one of five metal scavenger proteins that reduce the levels of free copper ions available in the cell (Calap-Quintana et al. 2017). Exposure to copper increases MtnA expression in head tissue (Figure 2B), and the trans eQTL associated with MtnA (Figure 4C) may indicate a distant regulatory element that influences expression under copper stress. Mco1 uses copper as a cofactor for iron metabolism (Lang et al. 2012) and was associated with a cis and a trans eQTL. The trans eQTL associated with Mco1 falls near the metal-dependent transcription binding factor MTF-1, which is one of the primary transcription factors involved in metal stress response (Egli et al. 2003; Balamurugan et al. 2004). Control-specific eQTL in head tissue highlighted a set of genes primarily enriched for functions related to broad categories including cellular process and response to stimulus (Figure S16B). Despite the lack of enrichment for metal-related GO terms, control-specific eQTL were associated with several genes involved in copper ion homeostasis including Mvl, CG10505, CG7194, Grx1, and Ctr1B (Thurmond et al. 2019; The UniProt Consortium et al. 2021). Maintaining proper copper homeostasis is critical for normal physiological function, and these eQTL with effects on expression of copper homeostasis genes may provide insight into regulation of copper transport under non-stressful conditions.
In gut tissue, we found enrichment for GO categories related to lipid metabolism, localization, and homeostasis among genes with copper-specific eQTL (Figure S17A) and enrichment for GO categories related to localization, transport, and regulation among genes with control-specific eQTL (Figure S17B). Two copper-related genes (olf413 and CG6908) had eQTL under copper conditions in gut tissue (Thurmond et al. 2019; The UniProt Consortium et al. 2021). Both eQTL were far from the gene positions (trans) and neither were near known metal-responsive transcription factors. Copper-specific eQTL also implicated several genes from the glutathione s transferase and cytochrome p450 families of genes, which are involved in the response to toxic substances (Kim and Yim 2013; Esteves et al. 2021), and we observed a copper-specific eQTL for the metallothionein gene MtnA. Similar to head tissue, several copper homeostasis genes had eQTL that were only detected under control conditions including Ccs, CG11590, CG11825, and Atox1 (Culotta et al. 1997; Hatori and Lutsenko 2013), suggesting that allelic variation in the DSPR contributes to variation in regulation of expression of these genes under non-stressful conditions.
Treatment-dependent eQTL were also identified using the Head- and Gut-Response datasets. Response eQTL reveal loci that impact the difference in gene expression between copper and control conditions in a genotype-specific manner and are thus inherently genotype by environment eQTL. Response eQTL detected in both Gut- and Head-Response datasets were associated with several potential candidate genes that may play a role in the response to copper toxicity. GO analysis of genes with Gut-Response eQTL highlighted categories related to detoxification pathways and response to toxins including glutathione s transferase family genes (glutathione metabolic process; hypergeometric test for overrepresentation of GO terms, adj p < 0.001; Figure 6) and cytochrome p450 genes (response to toxic substances and insecticides, adj p < 0.001; Figure 6) (Kim and Yim 2013; Esteves et al. 2021). We also detected Response eQTL for two ABC transporter multidrug resistance protein genes (Mdr49 and Mdr69) as well as two genes that are known to play a role in copper metabolism or binding (Sod3 and Tbh) (Itoh et al. 2009; The UniProt Consortium et al. 2021). More generally, 50 out of 316 annotated genes with Response eQTL in the Gut-Response dataset are known or predicted to be involved in metal ion binding (Thurmond et al. 2019; The UniProt Consortium et al. 2021).
Figure 6.

Enrichment of GO categories for Response eQTL genes by tissue (head tissue = 197 genes; gut tissue = 316) and for the set of eQTL genes that were shared between tissues (Shared-Response, 19 genes).
Head-Response eQTL included fewer potential candidate genes. Top GO enrichment categories included proteolysis and metabolic process (adj p < 0.0001) followed by response to insecticide (adj p < 0.001; Figure 6). We detected Head-Response eQTL for ABC transporter gene Mdr50 as well as a different trans eQTL associated with Mco1 that was distinct from those identified by comparing the copper and control-specific head eQTL. Of the 197 annotated Response eQTL genes, 26 play or are predicted to play a role in metal ion binding. There were 19 eQTL genes that were shared between the Head- and Gut-Response datasets, which included several cytochrome p450 family genes. The shared set of Response eQTL were associated with expression of genes that contribute to response to insecticide (adj p < 0.0001), response to toxic substance (adj p < 0.001) and response to DDT (adj p < 0.001) (Figure 6).
Identification of eQTL hotspots
Using a chi-square goodness of fit test, we identified between two and seven chromosomal regions that encompassed more trans eQTL peaks than expected by chance per dataset; these are potential trans eQTL hotspots (Table 3). Head- and Gut-Response datasets had the most hotspots, and overall, more hotspots were detected in head tissue compared to gut tissue datasets (Table 3). Several hotspots flanked the centromeric regions of chromosomes 2 and 3 (Figure 7) and were detected in multiple tissues and datasets (Table 3; Figure 7). This is likely because we identified hotspot locations using genetic distance, and since crossing over is low and gene density is higher in centromeric regions, the chance of detecting a hotspot at centromeres is likely inflated.
Table 3.
Chi-square analysis of trans eQTL distribution along chromosome arms and characteristics of hotspots.
| Dataset | Chr | P Value | Hotspot | Hotspot Region* (cM) | N trans eQTL | N Genes/ Hotspot** | Mean Cor*** | Possible Mediating Genes |
|---|---|---|---|---|---|---|---|---|
|
| ||||||||
| Head-Control | 2L | 4.24e-07 | H1 | 53.3–58.5 | 15 | 669 | 0.16 | CG31793, CG10366 |
|
| ||||||||
| 2R | 9.31e-07 | H2 | 53.7–61.0 | 15 | 737 | 0.19 | CG14464, Cyp6a2 | |
|
| ||||||||
| 3L | 6.42e-08 | H3 | 42.9–46.4 | 14 | 835 | 0.16 | CG4962, CG4306 | |
|
| ||||||||
| 3R | 7.91e-46 | H4 | 45.0–48.8 | 43 | 813 | 0.15 | lncRNA:CR44317, CG2846 | |
|
| ||||||||
| Head-Copper | 2L | 3.95e-08 | H5 | 18.2–22.9 | 12 | 175 | 0.56 | homer, Galt |
|
| ||||||||
| 2R | 1.04e-13 | H6 | 53.5–60.9 | 18 | 726 | 0.17 | TpnC41C, Tsp42Eg | |
|
| ||||||||
| 3R | 2.07e-53 | H7 | 45.9–48.8 | 47 | 828 | 0.16 | lncRNA:CR44317, CG2846 | |
|
| ||||||||
| Head-Response | 2L | 0.0003 | H8 | 3.42–6.68 | 8 | 184 | 0.48 | Npc2a, Auxd1 |
|
| ||||||||
| 2R | 1.42e-05 | H9 | 84.5–88.7 | 9 | 256 | 0.26 | Zda, Eip55E | |
| H10 | 86.7–90.2 | 8 | 281 | 0.49 | Fak | |||
|
| ||||||||
| 3L | 2.27e-07 | H11 | 10.8–18.0 | 10 | 294 | 0.54 | Jon65Aiv | |
|
| ||||||||
| 3R | 1.70e-35 | H12 | 46.0–48.6 | 19 | 765 | 0.65 | CG14606, CG18748 | |
| H13 | 77.0–79.0 | 32 | 61 | 0.78 | N/A | |||
|
| ||||||||
| X | 1.44e-27 | H14 | 14.1–20.9 | 22 | 206 | 0.72 | CG32751 | |
|
| ||||||||
| Gut-Control | 2L | 3.93e-05 | G1 | 53.3–57.8 | 11 | 657 | 0.20 | Tsp39D |
|
| ||||||||
| 3R | 3.17e-21 | G2 | 46.0–48.8 | 25 | 813 | 0.15 | stck | |
|
| ||||||||
| Gut-Copper | 2L | 0.002 | G3 | 51.3–55.7 | 8 | 1046 | 0.13 | Ncm, CG15170, lectin-37Da |
|
| ||||||||
| 2R | 0.002 | G4 | 54.0–58.2 | 8 | 486 | 0.33 | CG14464, Ars2, Tsp42Eq, TspEr, Cyp6a2 | |
|
| ||||||||
| 3R | 2.03e-24 | G5 | 45.6–48.9 | 28 | 831 | 0.15 | DhpD, CH42564, Syt4, alpha-Est5 | |
|
| ||||||||
| X | 0.26 | G6 | 0.006–1.32 | 5 | 202 | 0.19 | CG11384 | |
| G7 | 42.5–47.8 | 5 | 155 | 0.13 | inaE | |||
|
| ||||||||
| Gut-Response | 2L | 0.03 | G8 | 51.0–53.7 | 6 | 580 | 0.10 | Ku80, CG10341 |
|
| ||||||||
| 2R | 0.0009 | G9 | 82.4–85.8 | 8 | 251 | 0.14 | CG5742 | |
|
| ||||||||
| 3L | 8.46e-07 | G10 | −0.004–2.5 | 8 | 353 | 0.15 | LysB, LysC, LysD | |
| G11 | 42.9–47.0 | 8 | 1108 | 0.11 | Jon74E | |||
|
| ||||||||
| 3R | 5.97e-05 | G12 | 50.3–53.1 | 10 | 369 | 0.13 | CG12224, fabp Dip-C | |
Defined by the most minimum and most maximum boundaries of the trans eQTL that compose each hotspot
Number of genes that fell within the boundary of the hotspot region
Mean absolute pairwise correlations of gene expression (or response) values for trans eQTL genes corresponding to a given hotspot
Figure 7.

We detected enrichment for trans eQTL in all datasets and tissues. Several hotspots (primarily near centromere regions) were detected in multiple tissues and datasets. The majority of trans eQTL hotspots were detected in Response datasets in both head and gut tissue.
If all genes with a trans eQTL in a given hotspot are co-regulated by a genetic element in the hotspot region, we anticipate that the expression of these genes (or their expression response to copper treatment) will be correlated to some extent. Mean absolute pairwise correlations of gene expression or gene response values for trans eQTL genes corresponding to a given hotspot ranged from 6–78% in Head datasets and from 10–60% in Gut datasets (Figure S18, Figure S19; Table 3). We performed PCA on the matrix of per-RIL expression or response measures for all the genes with a trans eQTL in each hotspot, with PC1 representing a composite variable of the shared expression (or response) variation of genes with trans eQTL in that hotspot. All composite hotspot variables mapped a QTL at the location of the hotspot, and genes with high pairwise correlations (Figure S18, Figure S19) had consistent loadings on PC1 in each hotspot (Figure S20).
To identify genes that may modulate expression of the set of genes with trans eQTL at a hotspot, we used a mediation analysis approach that treated the expression level of each gene that was encompassed by a hotspot interval (Table 3) as a covariate in QTL analysis of the composite hotspot variable (see Methods). Including a true mediator as a covariate in the analysis is expected to eliminate the presence of the composite variable QTL, resulting in a drop in the LOD score at the peak position. With this approach we were able to identify between one and five genes that had complete or partial mediating effects on the composite variable for all but one hotspot (Figure S21, Figure S22; Table 3).
Our mediation analysis revealed three candidate genes that completely accounted for the H11 composite hotspot QTL (Figure 8A). H11 is composed of 10 trans eQTL peaks that were detected in the Head-Response dataset (Table 2). The three candidate mediating genes (Jon65Aiv, Jon65Aiii, and yip7) are serine proteases expressed in the adult head and are involved in proteolytic activity and protein metabolism (Kumar et al. 2021) (Figure 8A). We did not identify any eQTL associated with Jon65Aiii or yip7 but did detect one Head-Response cis eQTL near Jon65Aiv and compared the estimated haplotype effects at this QTL with those at the H11 composite peak. Estimated founder haplotype effects were significantly negatively correlated (r = −99%, p < 0.001, Figure 8B), suggesting that the haplotypes at this location have similar effects on the response of Jon65Aiv to copper and on the response at genes that have a response trans eQTL at the H11 hotspot. Jon65Aiv was recently identified as a novel candidate gene that may contribute to the gene expression response to copper stress in D. melanogaster strains derived from wild populations (Green et al. 2022). Copper exposure in wild-collected flies from that study resulted in decreased expression of Jon65Aiv; we did not observe a significant change in expression of any of the three H11 candidate mediating genes in response to copper exposure.
Figure 8.

Three genes had complete mediating effects on the composite eQTL peak for hotspot H11. A. Including Jon65Aiv (bottom purple line), Jon65Aiii, and yip7 (top purple lines) individually as covariates accounted for the composite QTL peak for H11 (black line). No other gene encompassed by the H11 composite peak had a strong mediating effect on the composite peak (green lines). B. Estimated founder haplotype effects at the composite QTL peak and at a cis eQTL associated with Jon65Aiv were significantly negatively correlated (Pearson r = −99%; p < 0.001). C. STRING analysis of the three candidate mediating genes and genes with a trans eQTL peak at the hotspot suggests that the candidate mediating genes are co-expressed with trans eQTL genes rather than having a regulatory role. Black edges indicate co-expression, green edges indicate similarity through textmining, light blue edges indicate protein homology, and dark blue edges indicate gene co-occurrence.
We leveraged the STRING database to examine potential interactions between candidate mediating genes and genes with trans eQTL at the H11 hotspot (Szklarczyk et al. 2023). Using information gathered on predicted and known protein interactions and gene co-expression, STRING analysis showed that Jon65Aiv, Jon65Aiii, and yip7 are directly or indirectly co-expressed with five of the genes with trans eQTL at the H11 hotspot, and several of the H11 trans eQTL genes have serine-type endopeptidase activity (GO enrichment analysis; p < 0.001), protein catalytic activity (p < 0.001), or hydrolase activity (p < 0.001) (Figure 8C). Together, these results suggest that Jon65Aiv, Jon65Aiii, and yip7 are not regulatory mediating genes but rather in a shared pathway with the other H11 trans eQTL genes.
We also identified a serine protease as a candidate gene with a partial mediating effect on the Gut-Response G11 trans eQTL hotspot (Figure 9A). Jon74E response to copper was associated with a cis eQTL, and similar to Jon65Aiv, estimated founder haplotype effects of the cis eQTL were negatively correlated with the estimated haplotype effects at the composite G11 hotspot peak (Pearson’s r = −98%, p < 0.001, Figure 9B). Unlike the previous candidate mediating genes, Jon74E did not have any connections to any other gene with a trans eQTL at the G11 hotspot (Figure 9C).
Figure 9.

One gene had a partial mediating effect on the composite eQTL peak for hotspot G11. A. Including Jon74E (purple line) as a covariate in QTL analysis of the G11 composite variable accounted for the composite QTL peak for H11 (black line). No other gene encompassed by the G11 composite peak had a strong mediating effect on the composite peak (green lines). B. Estimated founder haplotype effects at the composite QTL peak and at a cis eQTL associated with Jon74E were significantly negatively correlated (Pearson r = −98%; p < 0.001). C. STRING analysis of the candidate mediating gene and genes with a trans eQTL peak at the hotspot did not provide any insight into the link between the candidate mediator and the genes with trans eQTL in the hotspot.
Overall, while we identified several genes with expression patterns that appeared to mediate a trans eQTL hotspot effect (Figures S21 and S22), we found limited evidence of functional links between expression of candidate mediating genes and the genes with trans eQTL at the corresponding hotspot. Our hotspot analysis did not identify any candidate transcription factors or genes that have previously reported regulatory effects on trans eQTL genes in either head or gut tissue.
Discussion
Copper exposure results in tissue- and treatment-specific expression
The genetic architectures of complex traits such as stress resistance and disease are highly context-dependent and can vary across scales as broad as between species and populations (Whitehead and Crawford 2005; Breschi et al. 2016; Findley et al. 2021) and as small as between individuals, regions of a particular tissue (Fournier and Schacherer 2017; Çelik and Akdaş 2019; Munro et al. 2022), or even within individuals across age or development (Everman and Morgan 2017; Huang et al. 2020; Everman et al. 2021). Given anticipated tissue-specific gene expression patterns resulting from the spatial distribution of specialized copper-accumulating cells (Calap-Quintana et al. 2017; Miguel-Aliaga et al. 2018) and the potential for copper toxicity to result in acute damage to digestive tissues as well as neurological tissues (e.g., Tchounwou et al. 2008; Jomova et al. 2010), one of our principal goals was to characterize the tissue-specific transcriptomic response to copper toxicity. We demonstrate striking patterns of tissue- and treatment-specific genetic response to copper exposure using a combination of differential expression analysis and eQTL mapping. More than 90% of all genes had tissue-specific patterns of expression, and a significant tissue by treatment interaction affected 70% of the genome (Figure 1). Our data suggest that this interaction may be due to greater magnitude and diversity of the gene expression response in Gut tissue compared to Head tissue (Figure 3). Particularly, when stress-related genes were considered as a group we found that the stress response in gut tissue involved multiple stress pathways, whereas oxidative stress response was the primary stress response pathway activated in head tissue (Figure 3). Our expression QTL (eQTL) mapping results provide similar insight; the majority of eQTL were tissue-specific within treatment (Figure S11), suggesting that the genetic control of gene expression response to stress is highly context-dependent.
In general, overexposure to heavy metals results in the accumulation of reactive oxygen species (ROS) and activation of oxidative stress response pathways (e.g. Ercal et al. 2001; Gaetke 2003; Uriu-Adams and Keen 2005). Especially for heavy metals that are biologically necessary, there are also metal-specific metabolism pathways that can contribute to the metal toxicity response (Calap-Quintana et al. 2017). In the case of copper, specialized cells that are involved in uptake, metabolism, and detoxification of copper ions from the diet line the middle midgut of the fly and the acidic region of the digestive system in vertebrates (Dubreuil 2004; Calap-Quintana et al. 2017). Many of the genes that have been linked to copper response in previous studies were significantly differentially expressed under copper conditions relative to control conditions in our study (Figure 2), and our eQTL mapping results suggest that many of these copper-responsive genes are influenced by genetic variation in regulatory elements. Furthermore, we found that genes with functions related to metal response followed expected tissue-specific expression patterns (e.g. Mtn family genes; Ctr1A and Ctr1B; Atox1 and SOD3; ATP7; discussed above (Zhou et al. 2003; Turski and Thiele 2007; Itoh et al. 2009; Calap-Quintana et al. 2017; Kamiya et al. 2018)) (Figure 2). For instance, and consistent with previous reports, we found that MtnA expression was strongly induced by copper exposure (Figure 2B); however, the level of induction was much more pronounced in gut tissue compared with head tissue, leading to a significant tissue by treatment interaction. We also found variation in the genetic control of MtnA expression under copper conditions that followed a tissue specific pattern. In gut tissue, MtnA expression in response to copper is influenced by a cis eQTL (Figure 4C), whereas in head tissue MtnA expression under copper conditions is influenced by a trans eQTL (Figure 4D). Although the genetic variants that contribute to MtnA expression in either tissue are present in both tissues, each variant appears to only influence gene expression in a particular tissue.
While D. melanogaster is commonly used to characterize the genetic control of heavy metal response (e.g. Egli et al. 2003, 2006a; Balamurugan et al. 2004; Norgate et al. 2010; Hua et al. 2011), tissue-specific comparisons are not common (Fasae and Abolaji 2022). One of the few examples of tissue-specific response to heavy metal toxicity in D. melanogaster demonstrated that variation in CncC pathway activity (involved in autophagy regulation) across muscle and neurological tissue contributed to the toxicity response to methylmercury (Gunderson et al. 2020). Our differential expression analysis provides novel insight and suggests that there are tissue-specific pattens in broad responses to stress through the differential activation of pathways. Although all the stress response categories represented by our subset of genes can be linked to heavy metal stress response (Darling and Cook 1843; Kefaloyianni et al. 2005), our data suggest that oxidative stress response is the primary stress response mechanism to copper exposure in neurological tissue (proxied with head tissue in our study) while the primary stress response mechanisms in gut tissue are more diverse. Because previous studies that offer insight into tissue-specific gene expression response often focus on sets of tissues that infrequently overlap, it is challenging to determine whether the patterns we observe in our study are unique or reflective of a general pattern. However, our data do strongly suggest that there is a tissue-specific response to copper toxicity over the eight-hour exposure period used in this study. Whether this difference is due to tissue-specific vulnerability, to mode of exposure, to temporal progression of copper ions throughout the organism, or a combination of these and other factors remains to be fully determined. Additional follow up with tissue-specific knockdown or ablation of key genes involved in oxidative stress and other stress response pathways would be needed to strengthen these observations.
Transcriptomic response to copper stress is influenced by regulatory allelic variation
Allelic variation and its contribution to trait variation has been repeatedly dissected, characterized, and functionally tested in the context of complex traits ranging from those associated with human disease (e.g., Granhall et al. 2006; Hardy et al. 2018) to various stress responses including heavy metal resistance (e.g., Zhou et al. 2017; Evans et al. 2018; Everman et al. 2019, 2021). In addition to the potential to influence the functional gene product, allelic variation can also influence the response to stress via effects on gene expression patterns. The majority of allelic variation is found in non-coding regions of the genome (Umans et al. 2021), leading to the expectation that these non-coding variants play a regulatory role. By treating expression of individual genes as traits measured in multiple treatments and tissues, we were able to gain insight into context-dependent genetic control of gene expression using expression eQTL mapping. Approximately half of the annotated Drosophila genome was associated with one or more eQTL in our study, providing ample evidence of genetic variation in the control of gene expression (Table 2). Nearly all (98%) of genes that were associated with at least one eQTL were also differentially expressed, suggesting that the variants associated with these genes likely influence expression, although functional validation would be necessary to verify this hypothesis. This observation is consistent with work by Boyle et al. (2017) demonstrating that SNPs which contribute to trait variation are enriched near genes that are actively transcribed under disease states; our observations suggest this pattern extends to stress conditions as well.
Although eQTL mapping provides detailed insight into the genetic control of a given trait by examining elements that contribute to trait variation on a gene-by-gene basis, there are several challenges with this approach. Power to detect eQTL with modest effects is directly related to the number of strains in which the trait is measured (Ruden et al. 2009; King et al. 2012a; Qu et al. 2018; Arvanitis et al. 2022). By using 93–96 genotypes in our eQTL analyses, lack of power to detect modest-effect eQTL likely contributes to our estimates of tissue-specificity. For example, power estimates to detect a QTL with an effect size of 10 with 100 DSPR strains is approximately 20% (King et al. 2012a). Detection of tissue-specific eQTL is also more sensitive to false negatives, for example due to low levels of expression of a particular gene in a given tissue. However, despite these challenges our data suggest that allelic variation that contributes to the regulation of gene expression is tissue-specific for approximately 65% of eQTL detected in the control and copper datasets.
Similar studies of tissue-specific eQTL mapping are relatively rare in model organisms but have provided examples of tissue-specific eQTL. Using a mouse multiparental mapping population (Collaborative Cross (Aylor et al. 2011)) that is similar in concept to the DSPR, Keele et al. (2020) demonstrated that among lung, liver, and kidney tissue genetic control of several genes varied across tissues. Spatially discrete genetic control of gene expression can also vary at the sub-tissue level. Munro et al. (2022) demonstrated gene expression patterns that are specific to five regions of the rat brain are influenced by a combination of shared and sub-tissue specific eQTL. Shared eQTL were most common in similar brain tissue types, but sub-tissue specific eQTL were common between more distinct types of brain tissue (Munro et al. 2022). eQTL mapping studies of human disease and native state gene expression have also provided evidence of tissue- and cell type-specific genetic control of gene expression (Dimas et al. 2009; Nica et al. 2011; Fairfax et al. 2012; Peters et al. 2016; GTEx Consortium 2017; GTEx Consortium et al. 2018). A recent study presenting a novel analytical approach to identify colocalized eQTL suggests that tissue-specific eQTL may be more common than previously thought and key for identifying regulatory variants associated with complex disease traits (Arvanitis et al. 2022). The existence of other examples of tissue-specific eQTL combined with our evidence strongly suggest that tissue-specific eQTL contribute to the stress response to copper toxicity in D. melanogaster.
Consistent versus tissue-specific effects of eQTL
In addition to identifying tissue-specific eQTL, our study also provides insight into eQTL that have consistent versus environment-dependent effects within tissue type. Complex traits are dependent on both genotype and environmental variation, and the interaction between genotype and environment can contribute to overall susceptibility of individuals to stress and disease (Li et al. 2006; Duveau and Félix 2012; Moyerbrailean et al. 2016; Lea et al. 2022). The importance of genotype by environment interactions and the detection of quantitative loci with context-dependent effects was demonstrated by Lea et al. (2022) in a study using 544 human cell lines exposed to 12 environments. Using a high-powered experimental design, they demonstrated that the complex traits measured were influenced by a combination of eQTL with consistent effects in multiple environments as well as eQTL with environment-dependent effects (Lea et al. 2022). Similarly, Umans et al. (2021) offer a review and perspective on the importance of examining regulatory variants in multiple contexts. Recognizing the dynamic nature of context-dependent effects of alleles associated with disease in humans, Umans et al. (2021) propose that a critical approach to characterizing allelic variation in regulatory elements is to use multiple treatment conditions to detect important disease associated variants.
Overall, the majority of the eQTL we detected were near the position of the gene they were associated with (cis eQTL), suggesting that genetic variation in local regulatory elements plays an important role in the gene expression response to copper stress. cis eQTL generally have larger effects on trait variation and are thus easier to detect with modestly powered designs (Hill et al. 2021), and trans eQTL are additionally difficult to detect because they may not act at the level of mRNA regulation but instead have larger detectable effects at the protein level (Boyle et al. 2017). cis regulatory variation is widely appreciated to be an important contributor to phenotypic variation and plays a decisive role in the evolution of traits in natural populations and in human disease (Wray 2007; Savinkova et al. 2009; Wittkopp and Kalay 2011; Hill et al. 2021). At the treatment level and consistent with previous studies in humans, flies, and worms (Ruden et al. 2009; Snoek et al. 2017; Qu et al. 2018; Sterken et al. 2020; Lea et al. 2022), we found eQTL consistently in both treatments as well as eQTL that were only detected in one of the two treatments (Figure S11). The number of eQTL that were consistently detected was higher than treatment-specific eQTL, similar to a pattern previously reported for human cell lines (Lea et al. 2022). Similarly, in D. melanogaster, Qu et al. (2018) and Ruden et al. (2009) demonstrated that a small but non-negligeable number of eQTL were only detected following exposure to lead in head tissue or whole animals, respectively. Our analysis provides an additional layer of insight by examining the correlation between the estimated haplotype effects at each of the peaks that were consistently detected under control and copper treatment conditions in head and gut tissue (Figure 5). We found that estimated effects of founder alleles at shared eQTL often had similar effects on expression of the gene under different conditions. Despite this apparent consistency, an effect of treatment was still present in the eQTL detected under copper and control conditions in gut tissue; eQTL associated with metal-associated genes had larger effects on gene expression variation under copper conditions compared to control conditions (Figure 5F). While our results highlight the potential for even eQTL that are repeatedly detected across treatments to have treatment-specific effects on the expression of a given gene, adding a deeper dimension to gene by environment interaction eQTL, it is important to consider that the QTL intervals may include more than one variant that influences gene expression. One of these variants may influence expression under control conditions while the other influenced expression under copper conditions. Without additional follow-up studies, our analyses do not provide sufficient resolution to distinguish this case from one in which the same variant has treatment-specific effects on gene expression.
In addition to characterizing genotype by environment eQTL by examining the difference between the control and copper datasets for each tissue, we also examined eQTL that were associated with a summary metric of the gene expression response to copper stress. The majority of eQTL detected in the Head- and Gut-Response datasets were trans eQTL. Our study design partially accounts for the deficit in cis eQTL in the Response datasets, as any effects of cis eQTL that were detected with similar effects in control and copper datasets would be reduced in the Response eQTL mapping analyses. However, an enrichment of trans eQTL associated with specific environments has been previously observed in C. elegans in response to temperature stress (Li et al. 2006; Snoek et al. 2017). trans eQTL that are associated with the dynamic shift in gene expression response to the environment call attention to allelic variants that may play a role in the regulation of stress-dependent expression change that may otherwise not be detected if the treatment conditions are considered independently. We found several Response trans eQTL near genes with a wide range of functions related to response to toxic conditions (Figure 6) that highlight potential candidate regulatory QTL. Additional follow up would be necessary to corroborate our observations and to fully characterize the role that these potential QTL sites may play in the regulation of the response to copper stress.
Conclusions
Exposure to heavy metal stress results in a profound change in transcriptional activity across multiple tissues, and the genetic control of the gene expression response varies depending on the environmental conditions and tissue. By taking a combined approach of differential expression analysis and eQTL mapping, we were able to dissect and characterize more subtle differences in tissue-specific response to copper toxicity. Our work provides a novel set of candidate loci that may have context-dependent effects on gene expression and plasticity. From the patterns that differentiate the genetic response observed in head and gut tissue, we gain deeper insight into the level of toxicity response that is activated by short exposure to copper stress.
Supplementary Material
Figure S1. Adult copper resistance of B panel RILs used in the current study. We randomly sampled 48 resistant and 48 sensitive DSPR B panel RILs from the top and bottom 25% of the distribution of adult copper survival response following 48-hour exposure to 50mM CuSO4 reported in (Everman et al. 2021).
Figure S2. Distributions of raw read pair counts by library pool. Each tissue-specific pool included copper and control sample pairs, and an even representation of resistant and sensitive RILs. HO stands for “high-output” NextSeq500 flowcell, MO stands for “mid-output” flowcell. Raw reads from the two sequencing runs of the 96-plex Heads library (green shading) were combined prior to read processing.
Figure S3. Comparisons of the number of raw read pairs, the number retained following trimming, the percentage aligned, and the percentage assigned to genes following the HISAT2 pipeline from the high-output (HO) and mid-output (MO) sequencing runs for the 96-plex Head library. Apart from raw pair count, which varies due to under-clustering of the 96-plex Head library, data are consistent between the HO and MO sequencing of the same 96-plex library and are comparable to the separate 94-plex Head library that was only sequenced on one HO flowcell.
Figure S4. Variation in read length across all 379 samples. After trimming low quality bases and filtering short reads, only read pairs with >15 bp per read were retained.
Figure S5. Gene expression estimates from the HISAT2 and kallisto pipelines were consistent. After alignment and filtering out of lowly-expressed genes, expression estimates for 9842 and 9913 genes from the HISAT2 and kallisto pipelines, respectively, were retained. Gene-wise correlations in read counts across all samples for shared retained genes (9434) were highly correlated (mean R = 98.2%).
Figure S6. Correcting for known and unknown sources of technical variation reduced noise in eQTL mapping. Head-Control (top row) and Head-Copper (middle row) eQTL maps for Sod1 are noisy when technical variation is not accounted for (left column). Correcting for 2% (middle column) and 1% PCs (right column) along with those associated with known technical factors appears to limit noise. Head-Response data (bottom row) were less sensitive to data correction. In each plot, orange vertical lines indicate the location of the gene. Horizontal lines indicate the gene- and dataset-specific significance threshold.
Figure S7. Correcting for PCs that explained 2% or 1% of the variation in gene expression resulted in similar numbers of eQTL. Head samples are shown in A; Gut samples are shown in B. In both panels, the left column shows the 2% correction, the right column shows the 1% correction.
Figure S8. Genome-wide LOD scores were similar between the 1% and 2% corrected datasets for each tissue and treatment. Head-Copper, -Control, and -Response correlations are shown in A-C. Gut-Copper, -Control, and -Response correlations are shown in D-F. In each panel, orange highlights genome-wide LOD score correlations for genes that are associated with at least one eQTL in the 2% corrected data; grey highlights genes that were not associated with eQTL. Vertical color-coded lines indicate mean correlations for each group of genes.
Figure S9. For most genes (>80%), mapping yielded a single eQTL. Data shown are counts of distinct eQTL peaks per gene for each of the 6 datasets. Gut tissue is shown in orange, head tissue is shown in red. Numbers above bars provide the actual number of genes in each category.
Figure S10. Percent variance explained by mapped cis and trans eQTL. cis eQTL (blue) tended to have higher estimates compared to trans eQTL (red). Estimates were slightly lower in both response datasets for both cis and trans eQTL. Numbers at the base of each plot report the total number of cis and trans eQTL detected per dataset.
Figure S11. Many eQTL were detected in multiple datasets. Overlap was highest within tissue between treatments (A and B) but was still substantial in comparisons between tissues within treatment (C, D). Comparisons between the Head- and Gut-Response datasets revealed that most eQTL were distinct between the tissue-specific characterization of copper response. Overlap was also high in comparisons of the Response datasets against the tissue- and treatment-specific datasets (F – I). The majority (64 – 81%) of cis Response eQTL were shared with either the Control or Copper datasets for the corresponding tissue. For Head tissue, all but 9 cis Response eQTL were shared amongst Head-Control or Head-Copper cis eQTL; for gut tissue, all but 14 cis Response eQTL were shared amongst Gut-Control or Gut-Copper cis eQTL (data not shown).
Figure S12. Founder haplotype effects at cis eQTL peak positions that were detected in Response, Copper, and Control datasets for a given tissue ranged in strength of correlation for each comparison: A. Head-Response vs Head-Control, B. Head-Response vs Head-Copper, C. Gut-Response vs Gut-Control, D. Gut-Response vs Gut-Copper. Founder effect estimates are impacted by low replication per DSPR strain and should be interpreted with care; however, patterns suggest the detection of Response eQTL in our study may be influenced by a combination of genetic variants with different magnitude effects and treatment-specific additive effects.
Figure S13. Enrichment of GO categories for genes with eQTL in Head-Copper, Gut-Copper, or both datasets.
Figure S14. Correlations of estimated founder haplotype effects at peak positions of eQTL detected in both the Head-Copper and Gut-Copper datasets skewed positive for the majority of eQTL. A. Estimated founder haplotype effect correlations at eQTL associated with genes with functions unrelated to metal response based on FlyBase annotations were generally continuous and ranged from a small number of strong negative correlations to strong positive correlations. B. Estimated founder haplotype effect correlations at eQTL associated with genes with functions that are related to metal response (oxidative stress response, response to copper, response to xenobiotics, detoxification) generally fell into two groups with a small number of strong negative correlations and a larger number of strong positive correlations.
Figure S15. Gene ontology enrichment for potential genotype by environment eQTL that were detected in both control and copper conditions. A. Genes with eQTL that were detected in head tissue under copper and control conditions were enriched for categories related to metal ion transport and stress. B. Genes with eQTL that were detected in gut tissue under copper and control conditions were also enriched for metal-related processes. The size of plotted circles represents the relative number of genes per category. Z-score represents the relative proportion of genes with normalized expression higher or lower than the average (0) under copper conditions.
Figure S16. Gene ontology enrichment for potential genotype by environment eQTL. A. Genes with eQTL that were detected in head tissue only under copper conditions were enriched for categories related to metal ion transport and stress. B. Genes with eQTL that were detected in head tissue only under control conditions were enriched for categories related to cellular processes, response to stimulus, and biological regulation. The size of plotted circles represents the relative number of genes per category. Z-score represents the relative proportion of genes with normalized expression higher or lower than the average (0).
Figure S17. Gene ontology enrichment for potential genotype by environment eQTL. A. Genes with eQTL that were detected in gut tissue only under copper conditions were enriched for categories related to lipid metabolism. B. Genes with eQTL that were detected in gut tissue only under control conditions were enriched for categories related localization and transport. The size of plotted circles represents the relative number of genes per category. Z-score represents the relative proportion of genes with normalized expression higher or lower than the average (0).
Figure S18. Pairwise correlations of gene expression or expression response of trans eQTL genes detected in the three Head datasets. The bottom lollipop plot summarizes mean absolute Pearson correlations for each set of trans eQTL genes.
Figure S19. Pairwise correlations of gene expression or expression response of trans eQTL genes detected in the three Gut datasets. The bottom lollipop plot summarizes mean absolute Pearson correlations for each set of trans eQTL genes.
Figure S20. Loadings for gene included in each trans eQTL hotspot that were highly correlated loaded evenly on PC1, which was used as a composite variable in assessment of potential mediators of trans eQTL hotspots.
Figure S21. Mediation analysis of Head hotspots implicated between zero and three potential candidate genes that may influence the expression or response of the trans eQTL genes corresponding to most hotspots. In all QTL maps above, the peak associated with variation in the composite variable representing the trans eQTL genes is shown in black. Genes that fell within hotspot intervals are highlighted in green; genes with partial or complete mediating effects on the composite QTL are shown in purple. In the regression plots, estimated haplotype effects for the composite peak and for the cis eQTL associated with the potential candidate genes are shown. The purple lines represent the best fit based on a linear model with 95% confidence intervals shaded in grey; statistics provide Pearson correlations and p values are presented without multiple test correction. The DSPR has eight founder strains. Haplotype estimates based on low representation of a founder strain at a given position were not included in the correlation analyses.
Figure S22. Mediation analysis of Gut hotspots implicated between one and five potential candidate genes that may influence the expression or response of the trans eQTL genes corresponding to most hotspots. In all QTL maps above, the peak associated with variation in the composite variable representing the trans eQTL genes is shown in black. Genes that fell within hotspot intervals are highlighted in green; genes with partial or complete mediating effects on the composite QTL are shown in purple. In the regression plots, estimated haplotype effects for the composite peak and for the cis eQTL associated with the potential candidate genes are shown. The purple lines represent the best fit based on a linear model with 95% confidence intervals shaded in grey; statistics provide Pearson correlations and p values are presented without multiple test correction. The DSPR has eight founder strains. Haplotype estimates based on low representation of a founder strain at a given position were not included in the correlation analyses.
Table S1. Samples from head and gut tissue were arrayed across four 96-well plates. Sample names are written as “AB_00000_CC” where “A” is tissue (H = head, G = gut), “B” is the level of resistance exhibited by the RIL in Everman et al. (2021) (R = resistant, S = susceptible), “00000” is the five digit RIL ID and “CC” is the treatment (Cu = exposed to copper sulfate, NA = water control). Plates 1 and 2 contained only head samples; plates 3 and 4 contained only gut samples. Copper and control-treated RIL pairs were kept together on tissue-specific plates. Each plate had an even representation of resistant and sensitive RILs. Copper samples (Cu) are shaded in blue; control samples (NA) are not shaded. Black text indicates resistant RILs; red text indicates sensitive RILs. Samples for which library prep failed are indicated with strikethrough text (HR_21180_Cu, HR_21180_NA, GR_21180_Cu, GR_21232_NA, GS_21281_NA).
Table S2. Principal components used in correction of datasets in preparation for eQTL mapping.
Acknowledgements
We thank Kristen Cloud-Richardson for assistance with collection of head tissue. We also thank the anonymous reviewers for their suggestions that improved this manuscript.
Funding
This project was supported by funding from NIH: ERE was supported by two postdoctoral fellowships (F32 GM133111 and K99 ES033257) and by the Kansas INBRE (Kansas Idea Network of Biomedical Research Excellence) project (P30 GM145499). Additional support for experiments was provided by NIH R01 ES029922 and R01 OD034064 awarded to SJM. Sequencing was performed by the KU Genome Sequencing Core which is supported by the Center for Molecular Analysis of Disease Pathways and NIH Centers of Biomedical Research Excellence (P30 GM145499).
Footnotes
Conflict of Interest
The authors declare no conflicts of interest.
References
- Åkesson A., Bjellerup P., Lundh T., Lidfeldt J., Nerbrand C., et al. , 2006. Cadmium-induced effects on bone in a population-based study of women. Environ. Health Perspect. 114: 830–834. 10.1289/ehp.8763 [DOI] [PMC free article] [PubMed] [Google Scholar]
- Albert F. W., Bloom J. S., Siegel J., Day L., and Kruglyak L., 2018. Genetics of trans-regulatory variation in gene expression. eLife 7: e35471. 10.7554/eLife.35471 [DOI] [PMC free article] [PubMed] [Google Scholar]
- Alsheikh A. J., Wollenhaupt S., King E. A., Reeb J., Ghosh S., et al. , 2022. The landscape of GWAS validation; systematic review identifying 309 validated non-coding variants across 130 human diseases. BMC Med. Genomics 15: 74. 10.1186/s12920-022-01216-w [DOI] [PMC free article] [PubMed] [Google Scholar]
- Arvanitis M., Tayeb K., Strober B. J., and Battle A., 2022. Redefining tissue specificity of genetic regulation of gene expression in the presence of allelic heterogeneity. Am. J. Hum. [DOI] [PMC free article] [PubMed] [Google Scholar]
- Genet. 109: 223–239. 10.1016/j.ajhg.2022.01.002 [DOI] [Google Scholar]
- Aylor D. L., Valdar W., Foulds-Mathes W., Buus R. J., Verdugo R. A., et al. , 2011. Genetic analysis of complex traits in the emerging Collaborative Cross. Genome Res. 21: 1213–1222. 10.1101/gr.111310.110 [DOI] [PMC free article] [PubMed] [Google Scholar]
- Bagheri S., Squitti R., Haertlé T., Siotto M., and Saboury A. A., 2018. Role of copper in the onset of Alzheimer’s Disease compared to other metals. Front. Aging Neurosci. 9: 446. 10.3389/fnagi.2017.00446 [DOI] [PMC free article] [PubMed] [Google Scholar]
- Balamurugan K., Egli D., Selvaraj A., Zhang B., Georgiev O., et al. , 2004. Metal-responsive transcription factor (MTF-1) and heavy metal stress response in Drosophila and mammalian cells: a functional comparison. Biol. Chem. 385: 597–603. 10.1515/BC.2004.074 [DOI] [PubMed] [Google Scholar]
- Bálint A. F., Röder M. S., Hell R., Galiba G., and Börner A., 2007. Mapping of QTLs affecting copper tolerance and the Cu, Fe, Mn and Zn contents in the shoots of wheat seedlings. Biol. Plant. 51: 129–134. 10.1007/s10535-007-0025-9 [DOI] [Google Scholar]
- Beavis W. D., 1995. The power and deceit of qtl experiments: Lessons from comparative qtl studies. Proc. Forth-Ninth Annu. Corn Sorghum Ind. Res. Conf. 252–268. [Google Scholar]
- Bisaglia M., and Bubacco L., 2020. Copper ions and Parkinson’s Disease: Why is homeostasis so relevant? Biomolecules 10: 195. 10.3390/biom10020195 [DOI] [PMC free article] [PubMed] [Google Scholar]
- Blaurock-Busch E., Amin O. R., and Rabah T., 2011. Heavy metals and trace elements in hair and urine of a sample of Arab children with Autistic Spectrum Disorder. Mædica - J. Clin. Med. 6: 247–257. [PMC free article] [PubMed] [Google Scholar]
- Bonilla-Ramirez L., Jimenez-Del-Rio M., and Velez-Pardo C., 2011. Acute and chronic metal exposure impairs locomotion activity in Drosophila melanogaster: a model to study Parkinsonism. BioMetals 24: 1045–1057. 10.1007/s10534-011-9463-0 [DOI] [PubMed] [Google Scholar]
- Boyle E. A., Li Y. I., and Pritchard J. K., 2017. An expanded view of complex traits: from polygenic to omnigenic. Cell 169: 1177–1186. 10.1016/j.cell.2017.05.038 [DOI] [PMC free article] [PubMed] [Google Scholar]
- Bray N. L., Pimentel H., Melsted P., and Pachter L., 2016. Near-optimal probabilistic RNA-seq quantification. Nat. Biotechnol. 34: 525–527. 10.1038/nbt.3519 [DOI] [PubMed] [Google Scholar]
- Breschi A., Djebali S., Gillis J., Pervouchine D. D., Dobin A., et al. , 2016. Gene-specific patterns of expression variation across organs and species. Genome Biol. 17: 151. 10.1186/s13059-016-1008-y [DOI] [PMC free article] [PubMed] [Google Scholar]
- Broman K. W., Gatti D. M., Simecek P., Furlotte N. A., Prins P., et al. , 2019. R/qtl2: Software for mapping quantitative trait loci with high-dimensional data and multiparent populations. Genetics 211: 495–502. 10.1534/genetics.118.301595 [DOI] [PMC free article] [PubMed] [Google Scholar]
- Burke R., Commons E., and Camakaris J., 2008. Expression and localisation of the essential copper transporter DmATP7 in Drosophila neuronal and intestinal tissues. Int. J. Biochem. Cell Biol. 40: 1850–1860. 10.1016/j.biocel.2008.01.021 [DOI] [PubMed] [Google Scholar]
- Calap-Quintana P., González-Fernández J., Sebastiá-Ortega N., Llorens J., and Moltó M., 2017. Drosophila melanogaster models of metal-related human diseases and metal toxicity. Int. J. Mol. Sci. 18: 1456. 10.3390/ijms18071456 [DOI] [PMC free article] [PubMed] [Google Scholar]
- Carlson M., 2019. org.Dm.eg.db: Genome wide annotation for fly. R Package Version 382. 10.18129/B9.bioc.org.Dm.eg.db [DOI] [Google Scholar]
- Castilla J. C., and Nealler E., 1978. Marine environmental impact due to mining activities of El Salvador copper mine, Chile. Mar. Pollut. Bull. 9: 67–70. 10.1016/0025-326X(78)90451-4 [DOI] [Google Scholar]
- Catalán A., Glaser-Schmitt A., Argyridou E., Duchen P., and Parsch J., 2016. An indel polymorphism in the MtnA 3’ untranslated region is associated with gene expression variation and local adaptation in Drosophila melanogaster, (Begun D. J., Ed.). PLOS Genet. 12: e1005987. 10.1371/journal.pgen.1005987 [DOI] [PMC free article] [PubMed] [Google Scholar]
- Çelik Ö., and Akdaş E. Y., 2019. Tissue-specific transcriptional regulation of seven heavy metal stress-responsive miRNAs and their putative targets in nickel indicator castor bean (R. communis L.) plants. Ecotoxicol. Environ. Saf. 170: 682–690. 10.1016/j.ecoenv.2018.12.006 [DOI] [PubMed] [Google Scholar]
- Chen Y., Lun A. T., and Smyth G. K., 2016a. From reads to genes to pathways: differential expression analysis of RNA-Seq experiments using Rsubread and the edgeR qyasi-likelihood pipeline. F1000Research 5: 1–51. 10.12688/f1000research.8987.2 [DOI] [PMC free article] [PubMed] [Google Scholar]
- Chen P., Miah M. R., and Aschner M., 2016b. Metals and neurodegeneration. F1000Research 5: 366. 10.12688/f1000research.7431.1 [DOI] [PMC free article] [PubMed] [Google Scholar]
- Chen S., Zhou Y., Chen Y., and Gu J., 2018. fastp: an ultra-fast all-in-one FASTQ preprocessor. Bioinformatics 34: i884–i890. 10.1093/bioinformatics/bty560 [DOI] [PMC free article] [PubMed] [Google Scholar]
- Courbot M., Willems G., Motte P., Arvidsson S., Roosens N., et al. , 2007. A major quantitative trait locus for cadmium tolerance in Arabidopsis halleri colocalizes with HMA4 , a gene encoding a heavy metal ATPase. Plant Physiol. 144: 1052–1065. 10.1104/pp.106.095133 [DOI] [PMC free article] [PubMed] [Google Scholar]
- Culotta V. C., Klomp L. W. J., Strain J., Casareno R. L. B., Krems B., et al. , 1997. The copper chaperone for superoxide dismutase. J. Biol. Chem. 272: 23469–23472. 10.1074/jbc.272.38.23469 [DOI] [PubMed] [Google Scholar]
- Cunningham F., Allen J. E., Allen J., Alvarez-Jarreta J., Amode M. R., et al. , 2022. Ensembl 2022. Nucleic Acids Res. 50: D988–D995. 10.1093/nar/gkab1049 [DOI] [PMC free article] [PubMed] [Google Scholar]
- Daborn P. J., Lumb C., Boey A., Wong W., ffrench-Constant R. H., et al. , 2007. Evaluating the insecticide resistance potential of eight Drosophila melanogaster cytochrome P450 genes by transgenic over-expression. Insect Biochem. Mol. Biol. 37: 512–519. 10.1016/j.ibmb.2007.02.008 [DOI] [PubMed] [Google Scholar]
- Darling N. J., and Cook S. J., 1843. The role of MAPK signalling pathways in the response to endoplasmic reticulum stress. Biochim. Biophys. Acta. [DOI] [PubMed] [Google Scholar]
- De Koning D.-J., and Haley C. S., 2005. Genetical genomics in humans and model organisms. Trends Genet. 21: 377–381. 10.1016/j.tig.2005.05.004 [DOI] [PubMed] [Google Scholar]
- Denecke S., Fusetto R., and Batterham P., 2017. Describing the role of Drosophila melanogaster ABC transporters in insecticide biology using CRISPR-Cas9 knockouts. Insect Biochem. Mol. Biol. 91: 1–9. 10.1016/j.ibmb.2017.09.017 [DOI] [PubMed] [Google Scholar]
- Dimas A. S., Deutsch S., Stranger B. E., Montgomery S. B., Borel C., et al. , 2009. Common regulatory variation impacts gene expression in a cell type–dependent manner. Science 325: 1246–1250. 10.1126/science.1174148 [DOI] [PMC free article] [PubMed] [Google Scholar]
- Dixon A. L., Liang L., Moffatt M. F., Chen W., Heath S., et al. , 2007. A genome-wide association study of global gene expression. Nat. Genet. 39: 1202–1207. 10.1038/ng2109 [DOI] [PubMed] [Google Scholar]
- Dubreuil R. R., 2004. Copper cells and stomach acid secretion in the Drosophila midgut. Int. J. Biochem. Cell Biol. 36: 742–752. 10.1016/j.biocel.2003.07.004 [DOI] [PubMed] [Google Scholar]
- Durinck S., Moreau Y., Kasprzyk A., Davis S., De Moor B., et al. , 2005. BioMart and Bioconductor: a powerful link between biological databases and microarray data analysis. Bioinformatics 21: 3439–3440. 10.1093/bioinformatics/bti525 [DOI] [PubMed] [Google Scholar]
- Duveau F., and Félix M.-A., 2012. Role of pleiotropy in the evolution of a cryptic developmental variation in Caenorhabditis elegans, (Noor M. A. F., Ed.). PLoS Biol. 10: e1001230. 10.1371/journal.pbio.1001230 [DOI] [PMC free article] [PubMed] [Google Scholar]
- Egli D., Selvaraj A., Yepiskoposyan H., Zhang B., Hafen E., et al. , 2003. Knockout of ‘metal-responsive transcription factor’ MTF-1 in Drosophila by homologous recombination reveals its central role in heavy metal homeostasis. EMBO J. 22: 100–108. 10.1093/emboj/cdg012 [DOI] [PMC free article] [PubMed] [Google Scholar]
- Egli D., Yepiskoposyan H., Selvaraj A., Balamurugan K., Rajaram R., et al. , 2006a. A family knockout of all four Drosophila metallothioneins reveals a central role in copper homeostasis and detoxification. Mol. Cell. Biol. 26: 2286–2296. 10.1128/MCB.26.6.2286-2296.2006 [DOI] [PMC free article] [PubMed] [Google Scholar]
- Egli D., Domènech J., Selvaraj A., Balamurugan K., Hua H., et al. , 2006b. The four members of the Drosophila metallothionein family exhibit distinct yet overlapping roles in heavy metal homeostasis and detoxification. Genes Cells 11: 647–658. 10.1111/j.1365-2443.2006.00971.x [DOI] [PubMed] [Google Scholar]
- Ehrenreich I. M., Bloom J., Torabi N., Wang X., Jia Y., et al. , 2012. Genetic architecture of highly complex chemical resistance traits across four yeast strains, (Gasch A. P., Ed.). PLoS Genet. 8: e1002570. 10.1371/journal.pgen.1002570 [DOI] [PMC free article] [PubMed] [Google Scholar]
- Emilsson V., Thorleifsson G., Zhang B., Leonardson A. S., Zink F., et al. , 2008. Genetics of gene expression and its effect on disease. Nature 452: 423–428. 10.1038/nature06758 [DOI] [PubMed] [Google Scholar]
- Ercal N., Gurer-Orhan H., and Aykin-Burns N., 2001. Toxic metals and oxidative stress part I: Mechanisms involved in metal induced oxidative damage. Curr. Top. Med. Chem. 1: 529–539. [DOI] [PubMed] [Google Scholar]
- Esteves F., Rueff J., and Kranendonk M., 2021. The central role of cytochrome P450 in xenobiotic metabolism—a brief review on a fascinating enzyme family. J. Xenobiotics 11: 94–114. 10.3390/jox11030007 [DOI] [PMC free article] [PubMed] [Google Scholar]
- Evans K. S., Brady S. C., Bloom J. S., Tanny R. E., Cook D. E., et al. , 2018. Shared genomic regions underlie natural variation in diverse toxin responses. Genetics 210: 1509–1525. 10.1534/genetics.118.301311 [DOI] [PMC free article] [PubMed] [Google Scholar]
- Everman E. R., and Morgan T. J., 2017. Evolution of age-specific decline in stress phenotypes is driven by both antagonistic pleiotropy and mutation accumulation. bioRxiv 115931. [DOI] [PubMed] [Google Scholar]
- Everman E. R., McNeil C. L., Hackett J. L., Bain C. L., and Macdonald S. J., 2019. Dissection of complex, fitness-related traits in multiple Drosophila mapping populations offers insight into the genetic control of stress resistance. Genetics 211: 19. 10.1534/genetics.119.301930 [DOI] [PMC free article] [PubMed] [Google Scholar]
- Everman E. R., Cloud-Richardson K. M., and Macdonald S. J., 2021. Characterizing the genetic basis of copper toxicity in Drosophila reveals a complex pattern of allelic, regulatory, and behavioral variation. Genetics 217: 1–20. 10.1093/genetics/iyaa020 [DOI] [PMC free article] [PubMed] [Google Scholar]
- Everman E. R., Macdonald S. J., and Kelly J. K., 2023. The genetic basis of adaptation to copper pollution in Drosophila melanogaster. Front. Genet. 14: 1144221. 10.3389/fgene.2023.1144221 [DOI] [PMC free article] [PubMed] [Google Scholar]
- Fairfax B. P., Makino S., Radhakrishnan J., Plant K., Leslie S., et al. , 2012. Genetics of gene expression in primary immune cells identifies cell type–specific master regulators and roles of HLA alleles. Nat. Genet. 44: 502–510. 10.1038/ng.2205 [DOI] [PMC free article] [PubMed] [Google Scholar]
- Falcon S., and Gentleman R., 2007. Using GOstats to test gene lists for GO term association. Bioinformatics 23: 257–258. 10.18129/B9.bioc.GOstats [DOI] [PubMed] [Google Scholar]
- Fasae K. D., and Abolaji A. O., 2022. Interactions and toxicity of non-essential heavy metals (Cd, Pb and Hg): lessons from Drosophila melanogaster. Curr. Opin. Insect Sci. 51: 100900. 10.1016/j.cois.2022.100900 [DOI] [PubMed] [Google Scholar]
- Felmlee K. R., Macdonald S. J., and Everman E. R., 2022. Pre-adult exposure to three heavy metals leads to changes in the head transcriptome of adult flies. MicroPublication Biol. 1–8. [DOI] [PMC free article] [PubMed] [Google Scholar]
- Findley A. S., Monziani A., Richards A. L., Rhodes K., Ward M. C., et al. , 2021. Functional dynamic genetic effects on gene regulation are specific to particular cell types and environmental conditions. eLife 10: e67077. 10.7554/eLife.67077 [DOI] [PMC free article] [PubMed] [Google Scholar]
- Fournier T., and Schacherer J., 2017. Genetic backgrounds and hidden trait complexity in natural populations. Curr. Opin. Genet. Dev. 47: 48–53. 10.1016/j.gde.2017.08.009 [DOI] [PMC free article] [PubMed] [Google Scholar]
- Gaetke L., 2003. Copper toxicity, oxidative stress, and antioxidant nutrients. Toxicology 189: 147–163. 10.1016/S0300-483X(03)00159-8 [DOI] [PubMed] [Google Scholar]
- Gaffney D. J., Veyrieras J.-B., Degner J. F., Pique-Regi R., Pai A. A., et al. , 2012. Dissecting the regulatory architecture of gene expression QTLs. Genome Biol. 13: R7. 10.1186/gb-2012-13-1-r7 [DOI] [PMC free article] [PubMed] [Google Scholar]
- Gerhardsson L., 2022. Diagnosis and treatment of metal poisoning general aspects, pp. 663–684 in Handbook on the Toxicology of Metals: general considerations, Academic Press. [Google Scholar]
- Gibson G., and Weir B., 2005. The quantitative genetics of transcription. Trends Genet. 21: 616–623. 10.1016/j.tig.2005.08.010 [DOI] [PubMed] [Google Scholar]
- Gilad Y., Rifkin S. A., and Pritchard J. K., 2008. Revealing the architecture of gene regulation: the promise of eQTL studies. Trends Genet. 24: 408–415. 10.1016/j.tig.2008.06.001 [DOI] [PMC free article] [PubMed] [Google Scholar]
- González M., Reyes-Jara A., Suazo M., Jo W. J., and Vulpe C., 2008. Expression of copper-related genes in response to copper load. Am. J. Clin. Nutr. 88: 830S–834S. 10.1093/ajcn/88.3.830S [DOI] [PubMed] [Google Scholar]
- Granhall C., Park H.-B., Fakhrai-Rad H., and Luthman H., 2006. High-resolution quantitative trait locus analysis reveals multiple diabetes susceptibility loci mapped to intervals <800 kb in the species-conserved Niddm1i of the GK rat. Genetics 174: 1565–1572. 10.1534/genetics.106.062208 [DOI] [PMC free article] [PubMed] [Google Scholar]
- Green L., Coronado-Zamora M., Radío S., Rech G. E., Salces-Ortiz J., et al. , 2022. The genomic basis of copper tolerance in Drosophila is shaped by a complex interplay of regulatory and environmental factors. BMC Biol. 20: 275. 10.1186/s12915-022-01479-w [DOI] [PMC free article] [PubMed] [Google Scholar]
- Consortium GTEx, 2017. Genetic effects on gene expression across human tissues. Nature 550: 204–213. 10.1038/nature24277 [DOI] [PMC free article] [PubMed] [Google Scholar]
- Consortium GTEx, Gamazon E. R.,Segrè A. V., Bunt M. van de, Wen X., et al. , 2018. Using an atlas of gene regulation across 44 human tissues to inform complex disease- and trait-associated variation. Nat. Genet. 50: 956–967. 10.1038/s41588-018-0154-4 [DOI] [PMC free article] [PubMed] [Google Scholar]
- Gunderson J. T., Peppriell A. E., Vorojeikina D., and Rand M. D., 2020. Tissue-specific Nrf2 signaling protects against methylmercury toxicity in Drosophila neuromuscular development. Arch. Toxicol. 94: 4007–4022. 10.1007/s00204-020-02879-z [DOI] [PMC free article] [PubMed] [Google Scholar]
- Hardy C. M., Burke M. K., Everett L. J., Han M. V., Lantz K. M., et al. , 2018. Genome-wide analysis of starvation-selected Drosophila melanogaster—a genetic model of obesity. Mol. Biol. Evol. 35: 50–65. 10.1093/molbev/msx254 [DOI] [PMC free article] [PubMed] [Google Scholar]
- Hatori Y., and Lutsenko S., 2013. An expanding range of functions for the copper chaperone/antioxidant protein Atox1. Antioxid. Redox Signal. 19: 945–957. 10.1089/ars.2012.5086 [DOI] [PMC free article] [PubMed] [Google Scholar]
- He Z., Shentu J., Yang X., Baligar V. C., Zhang T., et al. , 2015. Heavy metal contamination of soils: sources, indicators, and assessment. J. Environ. Indic. 9: 17–18. [Google Scholar]
- Hill M. S., Vande Zande P., and Wittkopp P. J., 2021. Molecular and evolutionary processes generating variation in gene expression. Nat. Rev. Genet. 22: 203–215. 10.1038/s41576-020-00304-w [DOI] [PMC free article] [PubMed] [Google Scholar]
- Hindorff L. A., Sethupathy P., Junkins H. A., Ramos E. M., Mehta J. P., et al. , 2009. Potential etiologic and functional implications of genome-wide association loci for human diseases and traits. Proc. Natl. Acad. Sci. 106: 9362–9367. 10.1073/pnas.0903103106 [DOI] [PMC free article] [PubMed] [Google Scholar]
- Hsueh Y.-M., Lee C.-Y., Chien S.-N., Chen W.-J., Shiue H.-S., et al. , 2017. Association of blood heavy metals with developmental delays and health status in children. Sci. Rep. 7: 43608. 10.1038/srep43608 [DOI] [PMC free article] [PubMed] [Google Scholar]
- Hua H., Günther V., Georgiev O., and Schaffner W., 2011. Distorted copper homeostasis with decreased sensitivity to cisplatin upon chaperone Atox1 deletion in Drosophila. BioMetals 24: 445–453. 10.1007/s10534-011-9438-1 [DOI] [PubMed] [Google Scholar]
- Huang W., Campbell T., Carbone M. A., Jones W. E., Unselt D., et al. , 2020. Context-dependent genetic architecture of Drosophila life span, (Barton N. H., Ed.). PLOS Biol. 18: e3000645. 10.1371/journal.pbio.3000645 [DOI] [PMC free article] [PubMed] [Google Scholar]
- Itoh S., Ozumi K., Kim H., Nakagawa O., Mckinney R., et al. , 2009. Novel mechanism for regulation of extracellular SOD transcription and activity by copper: Role of antioxidant-1. Free Radic. Biol. Med. 46: 95–104. 10.1016/j.freeradbiomed.2008.09.039 [DOI] [PMC free article] [PubMed] [Google Scholar]
- Jansen R., 2001. Genetical genomics: the added value from segregation. Trends Genet. 17: 388–391. 10.1016/S0168-9525(01)02310-1 [DOI] [PubMed] [Google Scholar]
- Jomova K., Vondrakova D., Lawson M., and Valko M., 2010. Metals, oxidative stress and neurodegenerative disorders. Mol. Cell. Biochem. 345: 91–104. 10.1007/s11010-010-0563-x [DOI] [PubMed] [Google Scholar]
- Jones L. C., McCarthy K. A., Beard J. L., Keen C. L., and Jones B. C., 2006. Quantitative genetic analysis of brain copper and zinc in BXD recombinant inbred mice. Nutr. Neurosci. 9: 81–92. 10.1080/00268970600691365 [DOI] [PubMed] [Google Scholar]
- Kamiya T., Takeuchi K., Fukudome S., Hara H., and Adachi T., 2018. Copper chaperone antioxidant-1, Atox-1, is involved in the induction of SOD3 in THP-1 cells. BioMetals 31: 61–68. 10.1007/s10534-017-0067-1 [DOI] [PubMed] [Google Scholar]
- Karnchanawong S., and Limpiteeprakan P., 2009. Evaluation of heavy metal leaching from spent household batteries disposed in municipal solid waste. Waste Manag. 29: 550–558. 10.1016/j.wasman.2008.03.018 [DOI] [PubMed] [Google Scholar]
- Keele G. R., Quach B. C., Israel J. W., Chappell G. A., Lewis L., et al. , 2020. Integrative QTL analysis of gene expression and chromatin accessibility identifies multi-tissue patterns of genetic regulation, (Barsh G. S., Ed.). PLOS Genet. 16: e1008537. 10.1371/journal.pgen.1008537 [DOI] [PMC free article] [PubMed] [Google Scholar]
- Kefaloyianni E., Gourgou E., Ferle V., Kotsakis E., Gaitanaki C., et al. , 2005. Acute thermal stress and various heavy metals induce tissue-specific pro-or anti-apoptotic events via the p38-MAPK signal transduction pathway in Mytilus galloprovincialis (Lam.). J. Exp. Biol. 208: 4427–4436. 10.1242/jeb.01924 [DOI] [PubMed] [Google Scholar]
- Khan S., Cao Q., Zheng Y. M., Huang Y. Z., and Zhu Y. G., 2008. Health risks of heavy metals in contaminated soils and food crops irrigated with wastewater in Beijing, China. Environ. Pollut. 152: 686–692. 10.1016/j.envpol.2007.06.056 [DOI] [PubMed] [Google Scholar]
- Kim K., and Yim J., 2013. The diverse biological functions of glutathione S-transferase omega in Drosophila. Pteridines 24: 117–120. 10.1515/pterid-2013-0017 [DOI] [Google Scholar]
- Kim D., Paggi J. M., Park C., Bennett C., and Salzberg S. L., 2019. Graph-based genome alignment and genotyping with HISAT2 and HISAT-genotype. Nat. Biotechnol. 37: 907–915. 10.1038/s41587-019-0201-4 [DOI] [PMC free article] [PubMed] [Google Scholar]
- King E. G., Macdonald S. J., and Long A. D., 2012a. Properties and power of the Drosophila Synthetic Population Resource for the routine dissection of complex traits. Genetics 191: 935–949. 10.1534/genetics.112.138537 [DOI] [PMC free article] [PubMed] [Google Scholar]
- King E. G., Merkes C. M., McNeil C. L., Hoofer S. R., Sen S., et al. , 2012b. Genetic dissection of a model complex trait using the Drosophila Synthetic Population Resource. Genome Res. 22: 1558–1566. 10.1101/gr.134031.111 [DOI] [PMC free article] [PubMed] [Google Scholar]
- King E. G., Sanderson B. J., McNeil C. L., Long A. D., and Macdonald S. J., 2014. Genetic dissection of the Drosophila melanogaster female head transcriptome reveals widespread allelic heterogeneity, (Gibson G., Ed.). PLoS Genet. 10: e1004322. 10.1371/journal.pgen.1004322 [DOI] [PMC free article] [PubMed] [Google Scholar]
- King E. G., and Long A. D., 2017. The Beavis effect in next-generation mapping panels in Drosophila melanogaster. G3 Genes Genomes Genet. 7: 1643–1652. [DOI] [PMC free article] [PubMed] [Google Scholar]
- Knoblauch A., Divall M., Owuor M., Archer C., Nduna K., et al. , 2017. Monitoring of selected health indicators in children living in a copper mine development area in northwestern Zambia. Int. J. Environ. Res. Public. Health 14: 315. 10.3390/ijerph14030315 [DOI] [PMC free article] [PubMed] [Google Scholar]
- Kumar K., Mhetre A., Ratnaparkhi G. S., and Kamat S. S., 2021. A superfamily-wide activity atlas of serine hydrolases in Drosophila melanogaster. Biochemistry 60: 1312–1324. 10.1021/acs.biochem.1c00171 [DOI] [PMC free article] [PubMed] [Google Scholar]
- Lang M., Braun C. L., Kanost M. R., and Gorman M. J., 2012. Multicopper oxidase-1 is a ferroxidase essential for iron homeostasis in Drosophila melanogaster. Proc. Natl. Acad. Sci. 109: 13337–13342. 10.1073/pnas.1208703109 [DOI] [PMC free article] [PubMed] [Google Scholar]
- Lea A. J., Peng J., and Ayroles J. F., 2022. Diverse environmental perturbations reveal the evolution and context-dependency of genetic effects on gene expression levels. Genome Res. genome;gr.276430.121v1. 10.1101/gr.276430.121 [DOI] [PMC free article] [PubMed] [Google Scholar]
- Lee M.-J., Chou M.-C., Chou W.-J., Huang C.-W., Kuo H.-C., et al. , 2018. Heavy metals’ effect on susceptibility to Attention-Deficit/Hyperactivity Disorder: Implication of lead, cadmium, and antimony. Int. J. Environ. Res. Public. Health 15: 1221. 10.3390/ijerph15061221 [DOI] [PMC free article] [PubMed] [Google Scholar]
- Leek J. T., and Storey J. D., 2007. Capturing heterogeneity in gene expression studies by surrogate variable analysis. PLOS Genet. 3: e161. 10.1371/journal.pgen.0030161 [DOI] [PMC free article] [PubMed] [Google Scholar]
- Li Y., Hazendonk E., Prins P., Plasterk R. H. A., Jansen R. C., et al. , 2006. Mapping determinants of gene expression plasticity by genetical genomics in C. elegans. PLoS Genet. 2. [DOI] [PMC free article] [PubMed] [Google Scholar]
- Li H., Handsaker B., Wysoker A., Fennell T., Ruan J., et al. , 2009. The Sequence Alignment/Map format and SAMtools. Bioinformatics 25: 2078–2079. 10.1093/bioinformatics/btp352 [DOI] [PMC free article] [PubMed] [Google Scholar]
- Liao Y., Smyth G. K., and Shi W., 2014. featureCounts: an efficient general purpose program for assigning sequence reads to genomic features. Bioinformatics 30: 923–930. 10.1093/bioinformatics/btt656 [DOI] [PubMed] [Google Scholar]
- Liddell J. R., and White A. R., 2018. Nexus between mitochondrial function, iron, copper and glutathione in Parkinson’s disease. Neurochem. Int. 117: 126–138. 10.1016/j.neuint.2017.05.016 [DOI] [PubMed] [Google Scholar]
- Lyne R., Smith R., Rutherford K., Wakeling M., Varley A., et al. , 2007. FlyMine: an integrated database for Drosophila and Anopheles genomics. Genome Biol. 8: R129. 10.1186/gb-2007-8-7-r129 [DOI] [PMC free article] [PubMed] [Google Scholar]
- MacNair M. R., 1983. The genetic control of copper tolerance in the yellow monkey flower, Mimulus guttatus. Heredity 53: 283–293. [DOI] [PMC free article] [PubMed] [Google Scholar]
- Miguel-Aliaga I., Jasper H., and Lemaitre B., 2018. Anatomy and physiology of the digestive tract of Drosophila melanogaster. Genetics 210: 357–396. 10.1534/genetics.118.300224 [DOI] [PMC free article] [PubMed] [Google Scholar]
- Moyerbrailean G. A., Richards A. L., Kurtz D., Kalita C. A., Davis G. O., et al. , 2016. High-throughput allele-specific expression across 250 environmental conditions. Genome Res. 26: 1627–1638. 10.1101/gr.209759.116 [DOI] [PMC free article] [PubMed] [Google Scholar]
- Munro D., Wang T., Chitre A. S., Polesskaya O., Ehsan N., et al. , 2022. The regulatory landscape of multiple brain regions in outbred heterogeneous stock rats. Nucleic Acids Res. 50: 10882–10895. 10.1093/nar/gkac912 [DOI] [PMC free article] [PubMed] [Google Scholar]
- Neuberger J. S., Mulhall M., Pomatto M. C., Sheverbush J., and Hassanein R. S., 1990. Health problems in Galena, Kansas: a heavy metal superfund site. Sci. Total Environ. 94: 261–272. [DOI] [PubMed] [Google Scholar]
- Nica A. C., Parts L., Glass D., Nisbet J., Barrett A., et al. , 2011. The architecture of gene regulatory variation across multiple human tissues: The MuTHER Study, (Barsh G., Ed.). PLoS Genet. −7: e1002003. 10.1371/journal.pgen.1002003 [DOI] [PMC free article] [PubMed] [Google Scholar]
- Norgate M., Southon A., Greenough M., Cater M., Farlow A., et al. , 2010. Syntaxin 5 is required for copper homeostasis in Drosophila and mammals, (Bridger J. M., Ed.). PLoS ONE 5: e14303. 10.1371/journal.pone.0014303 [DOI] [PMC free article] [PubMed] [Google Scholar]
- Peters J. E., Lyons P. A., Lee J. C., Richard A. C., Fortune M. D., et al. , 2016. Insight into genotype-phenotype associations through eQTL mapping in multiple cell types in health and immune-mediated disease, (Plagnol V., Ed.). PLOS Genet. 12: e1005908. 10.1371/journal.pgen.1005908 [DOI] [PMC free article] [PubMed] [Google Scholar]
- Pickrell J. K., Marioni J. C., Pai A. A., Degner J. F., Engelhardt B. E., et al. , 2010. Understanding mechanisms underlying human gene expression variation with RNA sequencing. Nature 464: 768–772. 10.1038/nature08872 [DOI] [PMC free article] [PubMed] [Google Scholar]
- Pickrell J. K., 2014. Joint analysis of functional genomic data and genome-wide association studies of 18 human traits. Am. J. Hum. Genet. 94: 559–573. 10.1016/j.ajhg.2014.03.004 [DOI] [PMC free article] [PubMed] [Google Scholar]
- Plomin R., Haworth C. M. A., and Davis O. S. P., 2009. Common disorders are quantitative traits. Nat. Rev. Genet. 10: 872–878. 10.1038/nrg2670 [DOI] [PubMed] [Google Scholar]
- Qu W., Gurdziel K., Pique-Regi R., and Ruden D. M., 2018. Lead modulates trans- and cis-expression quantitative trait loci (eQTLs) in Drosophila melanogaster heads. Front. Genet. 9: 395. 10.3389/fgene.2018.00395 [DOI] [PMC free article] [PubMed] [Google Scholar]
- R Core Team, 2017. R: A language and environment for statistical computing [Google Scholar]
- Ritchie M. E., Phipson B., Wu D., Hu Y., Law C. W., et al. , 2015. limma powers differential expression analyses for RNA-sequencing and microarray studies. Nucleic Acids Res. 43: e47–e47. 10.1093/nar/gkv007 [DOI] [PMC free article] [PubMed] [Google Scholar]
- Robinson M. D., and Oshlack A., 2010. A scaling normalization method for differential expression analysis of RNA-seq data. Genome Biol. 11: R25. 10.1186/gb-2010-11-3-r25 [DOI] [PMC free article] [PubMed] [Google Scholar]
- Ruden D. M., Chen L., Possidente D., Possidente B., Rasouli P., et al. , 2009. Genetical toxicogenomics in Drosophila identifies master-modulatory loci that are regulated by developmental exposure to lead. NeuroToxicology 30: 898–914. 10.1016/j.neuro.2009.08.011 [DOI] [PMC free article] [PubMed] [Google Scholar]
- Savinkova L. K., Ponomarenko M. P., Ponomarenko P. M., Drachkova I. A., Lysova M. V., et al. , 2009. TATA box polymorphisms in human gene promoters and associated hereditary pathologies. Biochem. Mosc. 74: 117–129. 10.1134/S0006297909020011 [DOI] [PubMed] [Google Scholar]
- Seong C.-S., Varela-Ramirez A., Tang X., Anchondo B., Magallanes D., et al. , 2014. Cloning and characterization of a novel Drosophila stress induced DNase, (Cotterill S.., Ed.). PLoS ONE 9: e103564. 10.1371/journal.pone.0103564 [DOI] [PMC free article] [PubMed] [Google Scholar]
- Snoek B. L., Sterken M. G., Bevers R. P. J., Volkers R. J. M., van’t Hof A., et al. , 2017. Contribution of trans regulatory eQTL to cryptic genetic variation in C. elegans. BMC Genomics 18: 500. 10.1186/s12864-017-3899-8 [DOI] [PMC free article] [PubMed] [Google Scholar]
- Sterken M. G., Bevers R. P. J., Volkers R. J. M., Riksen J. A. G., Kammenga J. E., et al. , 2020. Dissecting the eQTL micro-architecture in Caenorhabditis elegans. Front. Genet. 11: 501376. 10.3389/fgene.2020.501376 [DOI] [PMC free article] [PubMed] [Google Scholar]
- Stohs S. J., and Bagchi D., 1995. Oxidative mechanisms in the toxicity of metal ions. Free Radic. Biol. Med. 18: 321–336. [DOI] [PubMed] [Google Scholar]
- Sun H., Buchon N., and Scott J. G., 2017. Mdr65 decreases toxicity of multiple insecticides in Drosophila melanogaster. Insect Biochem. Mol. Biol. 89: 11–16. 10.1016/j.ibmb.2017.08.002 [DOI] [PubMed] [Google Scholar]
- Szklarczyk D., Kirsch R., Koutrouli M., Nastou K., Mehryary F., et al. , 2023. The STRING database in 2023: protein–protein association networks and functional enrichment analyses for any sequenced genome of interest. Nucleic Acids Res. 51: D638–D646. 10.1093/nar/gkac1000 [DOI] [PMC free article] [PubMed] [Google Scholar]
- Taylor A. A., Tsuji J. S., Garry M. R., McArdle M. E., Goodfellow W. L., et al. , 2020. Critical review of exposure and effects: implications for setting regulatory health criteria for ingested copper. Environ. Manage. 65: 131–159. 10.1007/s00267-019-01234-y [DOI] [PMC free article] [PubMed] [Google Scholar]
- Tchounwou P. B., Newsome C., Williams J., and Glass K., 2008. Copper-induced cytotoxicity and transcriptional activation of stress genes in human liver carcinoma (HepG2) cells. Met. Ions Biol. Med. 10: 285–290. [PMC free article] [PubMed] [Google Scholar]
- The UniProt Consortium, Bateman A., Martin M.-J., Orchard S., Magrane M., et al. , 2021 UniProt: the universal protein knowledgebase in 2021. Nucleic Acids Res. 49: D480–D489. 10.1093/nar/gkaa1100 [DOI] [PMC free article] [PubMed] [Google Scholar]
- Thurmond J., Goodman J. L., Strelets V. B., Attrill H., Gramates L. S., et al. , 2019. FlyBase 2.0: the next generation. Nucleic Acids Res. 47: D759–D765. 10.1093/nar/gky1003 [DOI] [PMC free article] [PubMed] [Google Scholar]
- Turgut S., Polat A., Turgut G., Emmungil G., Bican M., et al. , 2007. Interaction betwen anemia and blood leves of iron, zinc, copper, cadmium and lead in children. Indian J. Pediatr. 74: 827–830. 10.1007/s12098-007-0147-2 [DOI] [PubMed] [Google Scholar]
- Turski M. L., and Thiele D. J., 2007. Drosophila Ctr1A functions as a copper transporter essential for development. J. Biol. Chem. 282: 24017–24026. 10.1074/jbc.M703792200 [DOI] [PubMed] [Google Scholar]
- Umans B. D., Battle A., and Gilad Y., 2021. Where are the disease-associated eQTLs? Trends Genet. 37: 109–124. 10.1016/j.tig.2020.08.009 [DOI] [PMC free article] [PubMed] [Google Scholar]
- Uriu-Adams J. Y., and Keen C. L., 2005. Copper, oxidative stress, and human health. Mol. Aspects Med. 26: 268–298. 10.1016/j.mam.2005.07.015 [DOI] [PubMed] [Google Scholar]
- Whitehead A., and Crawford D. L., 2005. Variation in tissue-specific gene expression among natural populations. Genome Biol. 6:R13. [DOI] [PMC free article] [PubMed] [Google Scholar]
- Wittkopp P. J., and Kalay G., 2011. Cis-regulatory elements: molecular mechanisms and evolutionary processes underlying divergence. Nat. Rev. Genet. 13: 59–69. 10.1038/nrg3095 [DOI] [PubMed] [Google Scholar]
- World Health Organization, Food and Agriculture Organization of the United Nations, and International Atomic Energy Agency (Eds.), 1996. Trace elements in human nutrition and health. World Health Organization, Geneva. [Google Scholar]
- Wray G. A., 2007. The evolutionary significance of cis-regulatory mutations. Nat. Rev. Genet. 8: 206–216. 10.1038/nrg2063 [DOI] [PubMed] [Google Scholar]
- Zhang F., and Lupski J. R., 2015. Non-coding genetic variants in human disease. Hum. Mol. Genet. 24: R102–R110. 10.1093/hmg/ddv259 [DOI] [PMC free article] [PubMed] [Google Scholar]
- Zhou H., Cadigan K. M., and Thiele D. J., 2003. A copper-regulated transporter required for copper acquisition, pigmentation, and specific stages of development in Drosophila melanogaster. J. Biol. Chem. 278: 48210–48218. 10.1074/jbc.M309820200 [DOI] [PubMed] [Google Scholar]
- Zhou S., Morozova T. V., Hussain Y. N., Luoma S. E., McCoy L., et al. , 2016. The genetic basis for variation in sensitivity to lead toxicity in Drosophila melanogaster. Environ. Health Perspect. 124: 1062–1070. 10.1289/ehp.1510513 [DOI] [PMC free article] [PubMed] [Google Scholar]
- Zhou S., Luoma S. E., Armour G. E. St., Thakkar E., Mackay T. F. C., et al. , 2017. A Drosophila model for toxicogenomics: Genetic variation in susceptibility to heavy metal exposure, (Copenhaver G. P., Ed.). PLOS Genet. 13: e1006907. 10.1371/journal.pgen.1006907 [DOI] [PMC free article] [PubMed] [Google Scholar]
Associated Data
This section collects any data citations, data availability statements, or supplementary materials included in this article.
Supplementary Materials
Figure S1. Adult copper resistance of B panel RILs used in the current study. We randomly sampled 48 resistant and 48 sensitive DSPR B panel RILs from the top and bottom 25% of the distribution of adult copper survival response following 48-hour exposure to 50mM CuSO4 reported in (Everman et al. 2021).
Figure S2. Distributions of raw read pair counts by library pool. Each tissue-specific pool included copper and control sample pairs, and an even representation of resistant and sensitive RILs. HO stands for “high-output” NextSeq500 flowcell, MO stands for “mid-output” flowcell. Raw reads from the two sequencing runs of the 96-plex Heads library (green shading) were combined prior to read processing.
Figure S3. Comparisons of the number of raw read pairs, the number retained following trimming, the percentage aligned, and the percentage assigned to genes following the HISAT2 pipeline from the high-output (HO) and mid-output (MO) sequencing runs for the 96-plex Head library. Apart from raw pair count, which varies due to under-clustering of the 96-plex Head library, data are consistent between the HO and MO sequencing of the same 96-plex library and are comparable to the separate 94-plex Head library that was only sequenced on one HO flowcell.
Figure S4. Variation in read length across all 379 samples. After trimming low quality bases and filtering short reads, only read pairs with >15 bp per read were retained.
Figure S5. Gene expression estimates from the HISAT2 and kallisto pipelines were consistent. After alignment and filtering out of lowly-expressed genes, expression estimates for 9842 and 9913 genes from the HISAT2 and kallisto pipelines, respectively, were retained. Gene-wise correlations in read counts across all samples for shared retained genes (9434) were highly correlated (mean R = 98.2%).
Figure S6. Correcting for known and unknown sources of technical variation reduced noise in eQTL mapping. Head-Control (top row) and Head-Copper (middle row) eQTL maps for Sod1 are noisy when technical variation is not accounted for (left column). Correcting for 2% (middle column) and 1% PCs (right column) along with those associated with known technical factors appears to limit noise. Head-Response data (bottom row) were less sensitive to data correction. In each plot, orange vertical lines indicate the location of the gene. Horizontal lines indicate the gene- and dataset-specific significance threshold.
Figure S7. Correcting for PCs that explained 2% or 1% of the variation in gene expression resulted in similar numbers of eQTL. Head samples are shown in A; Gut samples are shown in B. In both panels, the left column shows the 2% correction, the right column shows the 1% correction.
Figure S8. Genome-wide LOD scores were similar between the 1% and 2% corrected datasets for each tissue and treatment. Head-Copper, -Control, and -Response correlations are shown in A-C. Gut-Copper, -Control, and -Response correlations are shown in D-F. In each panel, orange highlights genome-wide LOD score correlations for genes that are associated with at least one eQTL in the 2% corrected data; grey highlights genes that were not associated with eQTL. Vertical color-coded lines indicate mean correlations for each group of genes.
Figure S9. For most genes (>80%), mapping yielded a single eQTL. Data shown are counts of distinct eQTL peaks per gene for each of the 6 datasets. Gut tissue is shown in orange, head tissue is shown in red. Numbers above bars provide the actual number of genes in each category.
Figure S10. Percent variance explained by mapped cis and trans eQTL. cis eQTL (blue) tended to have higher estimates compared to trans eQTL (red). Estimates were slightly lower in both response datasets for both cis and trans eQTL. Numbers at the base of each plot report the total number of cis and trans eQTL detected per dataset.
Figure S11. Many eQTL were detected in multiple datasets. Overlap was highest within tissue between treatments (A and B) but was still substantial in comparisons between tissues within treatment (C, D). Comparisons between the Head- and Gut-Response datasets revealed that most eQTL were distinct between the tissue-specific characterization of copper response. Overlap was also high in comparisons of the Response datasets against the tissue- and treatment-specific datasets (F – I). The majority (64 – 81%) of cis Response eQTL were shared with either the Control or Copper datasets for the corresponding tissue. For Head tissue, all but 9 cis Response eQTL were shared amongst Head-Control or Head-Copper cis eQTL; for gut tissue, all but 14 cis Response eQTL were shared amongst Gut-Control or Gut-Copper cis eQTL (data not shown).
Figure S12. Founder haplotype effects at cis eQTL peak positions that were detected in Response, Copper, and Control datasets for a given tissue ranged in strength of correlation for each comparison: A. Head-Response vs Head-Control, B. Head-Response vs Head-Copper, C. Gut-Response vs Gut-Control, D. Gut-Response vs Gut-Copper. Founder effect estimates are impacted by low replication per DSPR strain and should be interpreted with care; however, patterns suggest the detection of Response eQTL in our study may be influenced by a combination of genetic variants with different magnitude effects and treatment-specific additive effects.
Figure S13. Enrichment of GO categories for genes with eQTL in Head-Copper, Gut-Copper, or both datasets.
Figure S14. Correlations of estimated founder haplotype effects at peak positions of eQTL detected in both the Head-Copper and Gut-Copper datasets skewed positive for the majority of eQTL. A. Estimated founder haplotype effect correlations at eQTL associated with genes with functions unrelated to metal response based on FlyBase annotations were generally continuous and ranged from a small number of strong negative correlations to strong positive correlations. B. Estimated founder haplotype effect correlations at eQTL associated with genes with functions that are related to metal response (oxidative stress response, response to copper, response to xenobiotics, detoxification) generally fell into two groups with a small number of strong negative correlations and a larger number of strong positive correlations.
Figure S15. Gene ontology enrichment for potential genotype by environment eQTL that were detected in both control and copper conditions. A. Genes with eQTL that were detected in head tissue under copper and control conditions were enriched for categories related to metal ion transport and stress. B. Genes with eQTL that were detected in gut tissue under copper and control conditions were also enriched for metal-related processes. The size of plotted circles represents the relative number of genes per category. Z-score represents the relative proportion of genes with normalized expression higher or lower than the average (0) under copper conditions.
Figure S16. Gene ontology enrichment for potential genotype by environment eQTL. A. Genes with eQTL that were detected in head tissue only under copper conditions were enriched for categories related to metal ion transport and stress. B. Genes with eQTL that were detected in head tissue only under control conditions were enriched for categories related to cellular processes, response to stimulus, and biological regulation. The size of plotted circles represents the relative number of genes per category. Z-score represents the relative proportion of genes with normalized expression higher or lower than the average (0).
Figure S17. Gene ontology enrichment for potential genotype by environment eQTL. A. Genes with eQTL that were detected in gut tissue only under copper conditions were enriched for categories related to lipid metabolism. B. Genes with eQTL that were detected in gut tissue only under control conditions were enriched for categories related localization and transport. The size of plotted circles represents the relative number of genes per category. Z-score represents the relative proportion of genes with normalized expression higher or lower than the average (0).
Figure S18. Pairwise correlations of gene expression or expression response of trans eQTL genes detected in the three Head datasets. The bottom lollipop plot summarizes mean absolute Pearson correlations for each set of trans eQTL genes.
Figure S19. Pairwise correlations of gene expression or expression response of trans eQTL genes detected in the three Gut datasets. The bottom lollipop plot summarizes mean absolute Pearson correlations for each set of trans eQTL genes.
Figure S20. Loadings for gene included in each trans eQTL hotspot that were highly correlated loaded evenly on PC1, which was used as a composite variable in assessment of potential mediators of trans eQTL hotspots.
Figure S21. Mediation analysis of Head hotspots implicated between zero and three potential candidate genes that may influence the expression or response of the trans eQTL genes corresponding to most hotspots. In all QTL maps above, the peak associated with variation in the composite variable representing the trans eQTL genes is shown in black. Genes that fell within hotspot intervals are highlighted in green; genes with partial or complete mediating effects on the composite QTL are shown in purple. In the regression plots, estimated haplotype effects for the composite peak and for the cis eQTL associated with the potential candidate genes are shown. The purple lines represent the best fit based on a linear model with 95% confidence intervals shaded in grey; statistics provide Pearson correlations and p values are presented without multiple test correction. The DSPR has eight founder strains. Haplotype estimates based on low representation of a founder strain at a given position were not included in the correlation analyses.
Figure S22. Mediation analysis of Gut hotspots implicated between one and five potential candidate genes that may influence the expression or response of the trans eQTL genes corresponding to most hotspots. In all QTL maps above, the peak associated with variation in the composite variable representing the trans eQTL genes is shown in black. Genes that fell within hotspot intervals are highlighted in green; genes with partial or complete mediating effects on the composite QTL are shown in purple. In the regression plots, estimated haplotype effects for the composite peak and for the cis eQTL associated with the potential candidate genes are shown. The purple lines represent the best fit based on a linear model with 95% confidence intervals shaded in grey; statistics provide Pearson correlations and p values are presented without multiple test correction. The DSPR has eight founder strains. Haplotype estimates based on low representation of a founder strain at a given position were not included in the correlation analyses.
Table S1. Samples from head and gut tissue were arrayed across four 96-well plates. Sample names are written as “AB_00000_CC” where “A” is tissue (H = head, G = gut), “B” is the level of resistance exhibited by the RIL in Everman et al. (2021) (R = resistant, S = susceptible), “00000” is the five digit RIL ID and “CC” is the treatment (Cu = exposed to copper sulfate, NA = water control). Plates 1 and 2 contained only head samples; plates 3 and 4 contained only gut samples. Copper and control-treated RIL pairs were kept together on tissue-specific plates. Each plate had an even representation of resistant and sensitive RILs. Copper samples (Cu) are shaded in blue; control samples (NA) are not shaded. Black text indicates resistant RILs; red text indicates sensitive RILs. Samples for which library prep failed are indicated with strikethrough text (HR_21180_Cu, HR_21180_NA, GR_21180_Cu, GR_21232_NA, GS_21281_NA).
Table S2. Principal components used in correction of datasets in preparation for eQTL mapping.
Data Availability Statement
RNAseq reads are available from NCBI SRA BioProject PRJNA993605. All data including DE results, quantile-normalized expression data used for eQTL analyses, and code used to perform eQTL analyses are available from FigShare. Supplementary material contains Supplementary Methods that provide more detail on the isolation of head tissue as well as the alignment pipeline, code to carry out eQTL mapping analysis, and all input and output data generated for each analytical step.