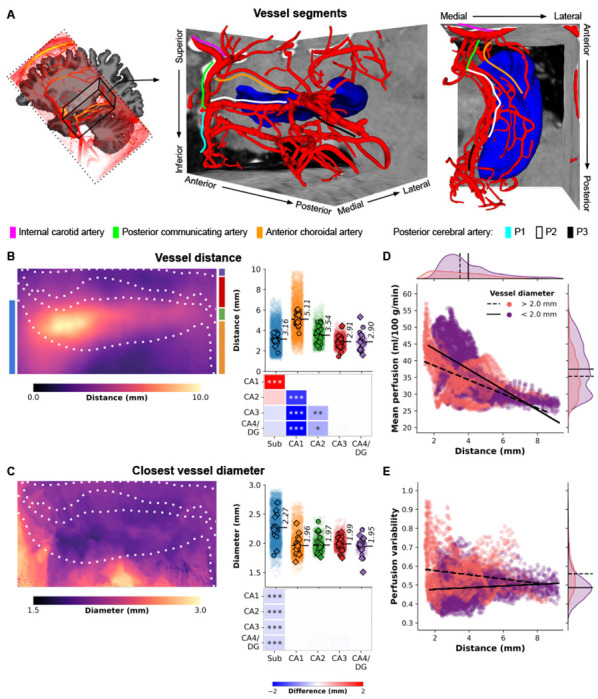
Figure 3.

Hippocampal vasculature and perfusion relationship. (A) Three-dimensional reconstruction of a subject’s macrovasculature in close proximity to the right hippocampus, showcasing delineated vessel segments. (B) Hippocampal vessel distance (mm) depicted on an unfolded hippocampal surface. Strip plots display color-coded subfield averages for each subject, including left hemisphere (circles) and right hemisphere (diamonds), along with per vertex values (i.e., averages across subjects and hemispheres shown as semi-transparent dots). Heatmaps illustrate pairwise comparisons between subfield averages, with FDRBH-corrected p-values indicated by asterisks: *p < .05, **p < .01, ***p < .005. (C) Similar to (B), but representing vessel diameter (mm) of the nearest vessel. (D) Scatter plot illustrating the relationship between vertex-wise mean perfusion (ml/100 g/min) and the shortest distance to a vessel (mm), stratified by respective vessel diameter (color-coded as thinner or thicker than 2 mm). Linear fits for each group are depicted by solid and dashed black lines. (E) Similar to (D), but contrasting with perfusion variability determined by the coefficient of variation across all maps (i.e., across runs and subjects).
