

SUMMARY
Research aimed at characterizing and studying regulatory quantitative trait loci (QTLs) also shed light on phenotypic variation between individuals, including differences in disease risk and drug response. Regulatory QTL effects are highly context-dependent and may only manifest under a particular set of conditions. In principle, induced pluripotent stem cells (iPSCs) can differentiate into any cell type in the body, and when combined with single-cell RNA sequencing, iPSCs enable large-scale mapping of regulatory QTLs across different contexts. The challenge is to find a way to rapidly expand the dimensionality of cell types and cell states we can characterize. To address this, we developed a guided iPSC differentiation protocol that rapidly generates a temporally and functionally diverse range of cardiac-relevant cell types. In just 8-10 days, we consistently reproduce cardiac progenitors seen in laborious directed differentiation time-course studies, as well as terminal cell types that exist in mature cardiac organoids. Using guided differentiation, one can rapidly characterize regulatory variation and gene by environment interactions in spatially and temporally diverse cardiac cell types.
INTRODUCTION
Induced pluripotent stem cells (iPSCs) are readily derived from somatic cells1 and can be differentiated into specialized cell types, including cardiomyocytes, neurons, hepatocytes, and many others. Through differentiation, iPSCs enable controlled in vitro experimentation in specific cell types and can be used to identify genetic variants that regulate gene expression levels (expression quantitative trait loci, or eQTLs) and other molecular phenotypes, which are useful for understanding the regulatory mechanisms that modulate disease risk.2 iPSCs are particularly well-suited for studies of dynamic gene regulation, which can be exclusive to specific developmental stages,3–5 specific cell types,6 or under certain environmental conditions.7,8 For example, Knowles et al. used iPSC-derived cardiomyocytes (iPSC-CMs) to demonstrate that inter-individual gene regulatory variation can explain differences between individuals in sensitivity to the cardiotoxic side effects of the chemotherapeutic drug doxorubicin.7 However, regulatory QTL studies utilizing iPSCs have historically been limited in scope by the approach used to measure gene regulation, namely, standard bulk sequencing analysis, which precludes characterizing multiple cell types simultaneously. The limitations of bulk analysis favor differentiation of iPSCs into homogenous monocultures. Coupled with the technical challenges of iPSC directed differentiation9, many cell types thus remain understudied.
One approach to increase the cell-type diversity that can be characterized using bulk analysis is to use time-course sampling of directed differentiating cultures. In this study design, cells are periodically collected as iPSCs differentiate towards a terminal cell type. Time-course differentiation studies have provided valuable insights into transient gene regulation and its impact on human health. For example, a time-course study of cardiomyocyte differentiation discovered that even fleeting gene regulatory effects that occur at intermediate developmental stages can be associated with cardiovascular disease-related outcomes in adults.4 However, differentiation time-course experiments are highly laborious and costly. Moreover, time-course studies are limited to examining a discrete number of collection time points, which are only snapshots of a highly dynamic process.
Unlike bulk RNA-sequencing, single-cell RNA-sequencing (scRNA-seq) can capture information about cellular heterogeneity and cell-type-specific gene expression, facilitating experimentation with more complex iPSC-derived cultures, such as organoids. Organoids comprise multiple cell types that self-organize and recapitulate major features of in vivo organs, including basic function, structural resemblance and constituent cell types. For instance, Lewis-Israeli et al. developed heart organoids that autonomously contract, exhibit a chamber-like morphology, and harbor various cardiac-relevant cell types such as cardiomyocytes, fibroblasts, and endothelial cells.10 Such properties make organoids very useful as disease models, and one can also use them to characterize gene regulation in multiple cell types. Yet, because organoid generation typically involves long-term (many weeks or months) cell culture and differentiation procedures tailored to individual iPSC lines, organoids are not well-suited for population-level studies such as regulatory QTL mapping efforts, which necessitate data collection from many (dozens or hundreds) individuals. Expediting the functional characterization of disease-associated genetic variation requires models that support population-level studies across a broader spectrum of disease-relevant contexts.
In order to study cell-type-specific gene regulation at the population level, we developed a ‘guided’ iPSC differentiation approach that offers the high cellular diversity seen in organoids, but with fast (and relatively inexpensive) experimental throughput, and reproducibility across cell lines. Guided differentiation, as opposed to ‘directed’ differentiation, gently biases iPSCs towards the cardiac mesoderm lineage, while maintaining the greatest degree of cellular diversity possible. Within guided cultures, individual cells differentiate at dissimilar rates, permitting maximum diversity with respect to function (cell type and cell state) and time (cell differentiation or developmental stage). The inclusion of early progenitor cells, in addition to differentiated cells, provides continuous developmental trajectories for detecting transient genetic effects that typically can only be captured by using a time-course experimental design.4 In what follows, we demonstrate that guided cultures contain functionally diverse cell types, which represent multiple stages of cardiac differentiation, and show that the transcriptional profiles of single cells in our cultures are comparable to that of single cells from mature cardiac organoids. In the methods section, we provide a detailed protocol to establish cardiac cultures using guided differentiation. We anticipate that guided cultures will be particularly useful for functionally characterizing genetic associations with cardiovascular traits, studying cell-type-specific responses to drugs and treatments, and exploring gene-by-environment interactions across many cell types and cell states.
RESULTS
This is a report of a new iPSC culturing approach. Our goal is to provide sufficient details to demonstrate that our approach results in a useful new type of differentiating culture. Accordingly, we did not seek novel biological insight, but rather insight that is consistent with previous observations, thus indicating that biological properties of our culture are similar to those of previously established models.
We performed guided differentiation (Figure 1A) using three iPSC lines to generate three-dimensional cardiac cell cultures. First, we formed iPSCs into three-dimensional aggregates measuring ~300μM in diameter (the optimal size for inducing pluripotent stem cells towards cardiac lineage11,12). We cultured iPSC aggregates in the formation plate using Essential 8™ medium (E8) with 10μM CEPT13 for 24 hours and transferred the aggregates to ultra-low attachment plates for an additional 48 hours. We then biased iPSC aggregates towards cardiac lineage using temporal Wnt modulation.14,15 We exchanged E8 for ‘heart medium’ (RPMI-1640 with a 2% v/v concentration of B-27 supplement, sans insulin) plus the Wnt activator CHIR99021 (“Chiron”) at a final concentration of 4μM. After 24 hours, we exchanged Chiron+ heart medium for base heart medium. We refreshed the heart medium 48 hours later, this time adding IWP4, a Wnt inhibitor, at a final concentration of 2μM. After 48 hours, we replaced IWP4+ heart medium with base heart medium for 48 hours before harvest. Contraction became visible 5 days after Wnt activation, or 8 days overall. We collected cells at day 10 (Figure S1) using the 10x Genomics platform for sequencing on an Illumina NovaSeq 6000.
Figure 1. Guided differentiation and characterization.
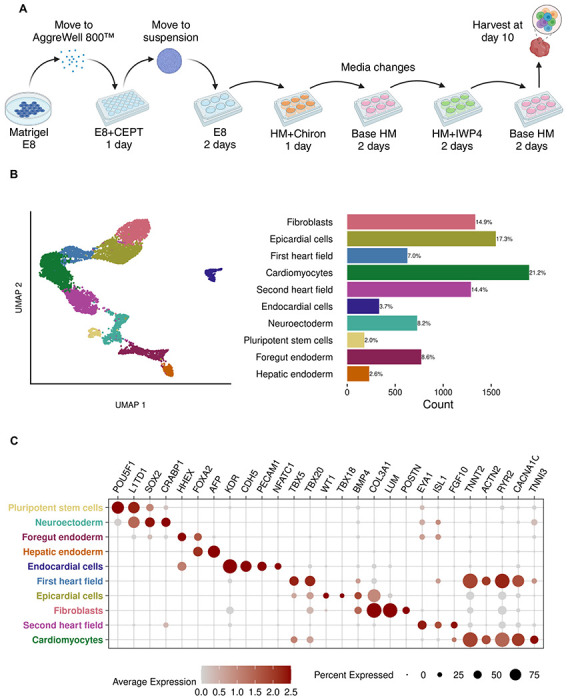
(A) Overview of the 10-day guided differentiation protocol. CEPT: Chroman 1, emricasan, polyamines, and trans-ISRIB. HM: heart medium. Chiron: CHIR99021.
(B) UMAP of 8,936 sequenced cells, manually annotated, alongside cell type proportions.
(C) Expression of canonical marker genes for each cell cluster.
After filtering and normalizing the data, we performed principal component analysis with 5,000 highly variable features and used the top 50 principal components for graph-based unsupervised clustering. Guided differentiation cultures include a diversity of cell types from all three germ layers. We annotated cells using marker gene expression and differential expression analysis (Figures 1B and 1C) and identified a high diversity of cell types reproducibly generated across all three cell lines (Figure S2). Early development cell types included pluripotent cells marked by POU5F1 and L1TD1 expression, as well as neural ectoderm expressing marker genes SOX2 and CRABP1. We classified two FOXA2-expressing endoderm populations: foregut endoderm based on expression of HHEX, and a hepatic endoderm population wherein HHEX was downregulated but the liver-specific marker AFP showed high expression. Subcluster analysis of foregut endoderm revealed posterior and anterior foregut populations (Figure S3), which have been reported previously in cardiac organoids.16
We annotated an endothelial cell cluster using expression of KDR, CDH5, and PECAM1, and further specified this population as endocardial cells based on expression of the endocardial cell-specific marker NFATC1. We also identified a cluster of epicardial cells based on expression of BMP4, WT1, and TBX18. We classified cardiomyocytes per expression of sarcomere genes (TNNT2 and ACTN2) and ion channel genes (RYR2 and CACNA1C). Although the guided cell culture was only given 7 days to differentiate, cardiomyocytes showed robust expression of TNNI3, indicative of maturing myofibrils. In addition to cardiomyocytes, we identified two progenitor populations consistent with the first heart field (FHF) and second heart field (SHF). We classified the FHF based on expression of TBX5 and TBX20. This FHF population appeared to be transitioning out of a progenitor state and into immature cardiomyocytes given the upregulation of cardiomyocyte marker genes. We annotated the SHF based expression of EYA1, ISL1, and FGF10.
Guided differentiation permits individual cells within the culture to differentiate asynchronously; therefore, as demonstrated by our manual cell type classification, the culture can harbor coexisting cell populations from multiple stages of cardiomyogenesis. As guided differentiation yields both terminal and progenitor cell types, it can potentially recapitulate data from a more standard directed differentiation time-course experiment. To demonstrate this, we performed Seurat integration17 of our scRNA-seq data with data from a previous 16-day time-course study of iPSC-CM differentiation performed by Elorbany et al. (2022).5 Elorbany et al. collected cells undergoing directed differentiation at 7 discrete timepoints; specifically, cells were collected on days 0 (as iPSCs, before initiating differentiation), 1, 3, 5, 7, 11, and 15. Sub-setting the time-course study cells by their collection day illustrates progression through iPSC-CM differentiation. While, as expected, cell states were rather specific to certain days in the time-course study, the ‘single time-point’ guided differentiation culture harbored cells throughout the entire UMAP space (Figure 2), suggesting that guided differentiation produced cells that are transcriptionally similar to those collected during the entire time-course study. Further, comparative analysis of gene expression showed conservation of marker genes throughout cardiomyogenesis (Figure S4).
Figure 2. UMAP plots of cells from Seurat integration of a 16-day iPSC-CM differentiation time-course dataset and the guided differentiation dataset.
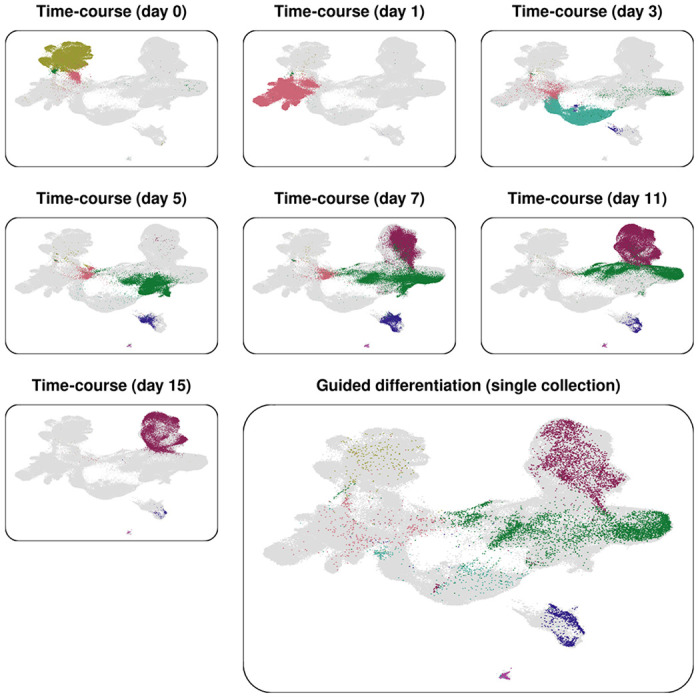
Cells are colored according to cluster and dataset; grey cells are those present in the entire integrated dataset but not present in the selected dataset. The small plots represent cells from the differentiation time-course (n = 230,849), plotted according to their day of collection. The large plot represents cells from a single collection of guided differentiation culture cells (n = 8,936).
We next investigated similarity between the transcriptional profiles of cells from guided cultures and their in vivo counterparts; to that end, we used automated cell classification. For a cell reference, we leveraged a dataset of annotated healthy fetal heart cells published by Miao et al. (2020),18 which consists of 11 different primary cell types (Figure 3A). We utilized this reference to train the scPred19 prediction model for automated cell annotation (Figure 3B). Individual cells from our guided differentiation culture were assigned probabilities of belonging to each of the 11 reference cell types. As the guided differentiation culture harbors cell types that are not present in fetal heart tissue (e.g., foregut endoderm), we set the probability threshold to 0.9; cells below the threshold were classified as unassigned and not included in the UMAP plots.
Figure 3. Automated annotation using scPred trained on a fetal heart reference.

(A) UMAP of fetal heart cells (n = 13,569) with 11 cell types annotated by Miao et al. (2020).18
(B) Overview of automated annotation process using scPred. Model was trained using the cell reference and applied to three datasets, including peripheral blood mononuclear cells (PBMCs) used here as a non-cardiac control (Figure S5).
(C) UMAP of classified cell types from the guided differentiation culture (n = 1,114).
(D) UMAP of classified cell types from multi-lineage organoid published by Silva et al. (2021)20 (n = 2,016).
Based on this analysis, our guided differentiation culture putatively harbored all cell types except red blood cells and pericytes (Figure 3C). These included cardiomyocytes, fibroblasts, endothelial and endocardial cells, epicardial cells, and nervous system cells, consistent with the manual cell annotation. Additionally, scPred cell type predictions included immune cells and conduction system cells, which were not detected by manual annotation. ScPred classifies cells individually, without clustering, and is capable of identifying small cell populations that would otherwise be masked by clustering. To benchmark our guided differentiation culture against more established in vitro models, we applied the scPred prediction model to scRNA-seq data from mature multi-lineage organoids (100-day culture) published by Silva, et al. (2021)20 (Figure 3D). Both iPSC-based cultures showed comparable levels of cell diversity and transcriptional similarity relative to the fetal heart tissue, demonstrating that our guided differentiation culture method can generate diverse, transcriptionally relevant cell types in just 10 days.
DISCUSSION
We introduce a new method for the guided differentiation of iPSCs to generate a broad spectrum of cardiac-relevant cell types within the short period of 8-10 days, while recapitulating the cellular complexity seen in mature cardiac organoids. Guided differentiation gently nudges iPSCs towards a cardiac lineage while preserving a high degree of cellular diversity. This method facilitates differentiation of individual cells at varying (asynchronous) rates, thereby producing a rich array of cardiac cell types and developmental stages. In addition to the differentiated cardiac cell types of cardiomyocytes, fibroblasts, epicardial cells, and endocardial cells, the guided differentiation cultures harbor progenitor populations including the first and second heart field. Guided differentiation also generates endoderm, which is supportive of cardiac cell differentiation.21
To demonstrate that cardiac differentiation can generate a continuous cardiac developmental trajectory, we integrated our data with an scRNA-seq dataset produced by a 16-day iPSC-CM differentiation time-course study. Our results demonstrate that a single collection from a guided differentiation culture can effectively capture the entire range of cell states collected from several timepoints over the more extended period. Despite the inclusion of early development cell types, automated cell classification performed by scPred showed that guided differentiation culture also harbors cells transcriptionally akin to those from in vivo heart tissue. Further, based on an 83-day fetal heart reference, scPred-classified cells from 10-day guided differentiation and 100-day multi-lineage organoids at comparable levels of cell type diversity.
The ability to grow multiple cardiovascular cell types in the same dish obviates the need for complex differentiation protocols and allows for greater control over confounding variables that might mask genetic effects on gene expression. Guided differentiation therefore circumvents many of the challenges associated with directed iPSC differentiation, while providing a multi-cellular model for high-throughput testing such as drug screening. Additionally, guided differentiation harbors continuous developmental trajectories for detecting transient genetic effects in a single collection, which simplifies study design, eases logistical challenges, and reduces cost. Transient genetic effects exclusive to early development can go undetected in terminal cell types,3,4 which may partially explain the lack of disease-associated eQTLs.22 Guided differentiation is uniquely suited as a model to investigate this hypothesis. The reduced time and labor needed for guided differentiation (relative to standard organoids and differentiation time-course studies) will enable dynamic population-level studies at scale, including regulatory QTL mapping studies at cell type resolution. Moreover, the transcriptional similarity between guided cardiac cell types and their in vivo counterparts suggests that dynamic functional patterns identified using guided cultures will be functionally relevant to human tissues.
Limitations of the study
We focus on demonstrating guided differentiation as a methodological advancement using exploratory analyses; data generated herein is insufficient to infer causality. Guided differentiation does not recapitulate the structure or physiology of the heart and lacks in vivo functional fidelity in those respects; instead, the model fills a niche for functional genomics by rapidly generating a diversity of cardiac-relevant cell types and cell states, to investigate inter-individual variation at scale. Finally, the in vivo reference used in automated cell classification was derived from human fetal heart at a gestational age of 83 days; heart cells from this in vivo reference are more mature than those generated by guided differentiation.
STAR METHODS
RESOURCE AVAILABILITY
Lead contact
Further information and requests for resources should be directed to and will be fulfilled by the lead contact, Dr. Yoav Gilad (gilad@uchicago.edu).
Materials availability
This study did not generate new unique reagents.
Data and code availability
Code for data analysis available at: https://erikmcintire.github.io/Guided_differentiation/
Sequencing data have been deposited in GEO and will be made public concurrent with publication.
METHOD DETAILS
Samples
We used 3 iPSC lines from unrelated Yoruba individuals from Ibadan, Nigeria (YRI): 19114 (female), 19130 (male), and 19152 (female). These iPSC lines were reprogrammed from lymphoblastoid cell lines (LCLs) and were characterized and validated previously.23 We confirmed cell line identities using genotype data generated by the HapMap project from the original LCL lines.24
IPSC maintenance
We maintained the 3 iPSC lines using Matrigel Growth Factor Reduced (GFR) Basement Membrane Matrix with Essential 8™ (E8) medium and Penicillin-Streptomycin in an incubator at 37°C and 5% CO2. At roughly 80% confluency (approximately every 3-5 days), we passaged cell cultures using a dissociation reagent (0.5 mM EDTA, 300 mM NaCl in PBS) and seeded iPSCs with 10μM ROCK inhibitor Y-27632.
Guided differentiation
Similar to directed differentiation, guided differentiation primarily generates cardiac-relevant cell types. However, it also yields cell types representative of all three germ layers and includes cell stages throughout cardiomyogenic lineage, resulting in a greater diversity of cell types. We performed guided differentiation of the 3 iPSC lines by forming three-dimensional aggregates and performing temporal Wnt modulation.14,15 We formed iPSC aggregates using an AggreWell™800 24-well plate. We coated each well with Anti-Adherence Rinsing Solution. On day 0, we dissociated iPSCs seeded them onto the plate using E8 medium with 10μM CEPT,13 i.e., chroman 1, emricasan, polyamines, and trans-ISRIB. Cell aggregates were formed at approximately 300μm diameter using 2 million cells per well (i.e., 1 million cells per mL) of the AggreWell™800 plate, as described previously.12 We centrifuged the plate at 100g for 3 min to aggregate cells together. Cells remained in the plate for 24h. After 24h, we transferred fully-formed iPSC aggregates to a suspension culture using an ultra-low adherent plate with E8 medium for 48h. On day 3, we changed the cell medium to “heart medium” plus 4μM CHIR99021. Heart medium is comprised of RPMI 1640 Medium, GlutaMAX™ Supplement, HEPES, 2% v/v B-27 Supplement, minus insulin, and Penicillin-Streptomycin. After 24h, on day 4, we changed medium to base heart medium for 48h. On day 6, we changed medium to heart medium plus 2μM IWP4 for 48h. Contraction became visible on day 8 for all three lines. Lastly, on day 8, we changed medium to base heart medium for 48h and collected cells on day 10.
Aggregate dissociation
We collected day 10 aggregates from the 3 iPSC lines and dissociated them by treating with room temperature AccuMax™ followed by incubation at 37°C for 10 min. Following incubation, we pipetted aggregates up-and-down for 30 sec with a p1000 wide bore pipette tip. Aggregates were then incubated for an additional 5 min at 37°C. We repeated the pipetting every 5 minutes until aggregates were dissociated, at which point we added 5mL of 4°C Bovine Serum Albumin (BSA) solution and centrifuged cells for 100g for 3 min. We resuspended cells in 1mL 4°C BSA solution and strained cells through a 40μm cell strainer. We combined cells from each iPSC line in even proportions (500,000 cells per line) and centrifuged cells at 100g for 3 min. We then resuspended cells in 4°C BSA solution at a concentration of approximately 2 million cells per mL. Finally, we strained the cell suspension using a 40μm cell strainer.
ScRNA-seq analysis
We collected cells from the 3 iPSC lines for scRNA-seq using the 10x Genomics Chromium Next GEM Single Cell 3′ Reagent Kits v3.1 (Dual Index). We targeted 10,000 cells total in one lane of a 10x chip and sequenced the library using an Illumina NovaSeq 6000 at the University of Chicago Functional Genomics Core Facility. We obtained 20,755 mean reads per cell. We aligned samples to the human genome (GRCh38) using Cell Ranger25 and assigned cells to individuals using Vireo.26 We then analyzed count data in R / RStudio using Seurat17 with Tidyverse.27 For cell filtering, we removed cells classified as doublets or unassigned by Vireo. Additionally, we filtered out cells expressing less than 1,500 unique genes. We performed sctransform-based normalization28 (sctransform function) using 5,000 variable features, performed dimensionality reduction (RunPCA function) and used 50 dimensions for uniform manifold approximation and projection (UMAP) embedding (RunUMAP function). We computed nearest neighbors using 50 dimensions (FindNeighbors function) and performed unsupervised clustering at a resolution of 0.3 (FindClusters function) to yield 10 cell clusters for differential expression analysis using the Wilcoxon Rank Sum test. We annotated cell clusters based on canonical marker gene expression. We used color schemes adapted from Paul Tol29 and RColorBrewer30.
Foregut endoderm subcluster analysis
We subset the foregut endoderm cluster cells as their own Seurat object and re-normalized using the same approach described above. We performed unsupervised clustering at a resolution of 0.1 to yield 2 clusters for differential expression analysis. We annotated cell clusters based on canonical marker gene expression.
Seurat integration
In order to compare cells from our guided differentiation and cells from a 16-day iPSC-CM differentiation time-course published by Elorbany et al. (2022),5 we performed Seurat integration of the two scRNA-seq datasets. First, we filtered the iPSC-CM time-course dataset using the same parameters as in the original study; that is, 1) genes must be detected in at least 10 cells, 2) cells must contain at least 300 unique genes, 3) cells must have no more than 25% mitochondrial reads, 4) cells must have a doublet probability of 0.3 or less, 5) cell assignment must be unambiguous, 6) cells with feature or read counts more than 4 standard deviations away from the median are excluded. We filtered cells from the guided differentiation dataset using the criteria described in the scRNA-seq analysis section above. Using sctransform, we normalized each dataset individually using 5,000 variable features and selected 5,000 anchor features for integration (SelectIntegrationFeatures function). We then prepared the datasets for integration (PrepSCTIntegration function), determined a set of anchor features (FindIntegrationAnchors function), and integrated the datasets (IntegrateData function). Following integration, we performed dimensionality reduction, UMAP embedding, and computed nearest neighbors as described above. We performed unsupervised clustering at a resolution of 0.1 to yield 7 cell clusters. We subset cells by dataset (and for the time-course dataset, by day of collection) for visualization with UMAP. Prior to comparing gene expression between the two datasets, we corrected counts (PrepSCTFindMarkers).
Automated cell classification
We used scPred19 to create a prediction classifier model trained on annotated healthy fetal heart cells published by Miao et al. (2020).18 The fetal heart dataset comprised 11 annotated cell types: endocardium, endothelium, lymphatic endothelial cell, cardiomyocyte, epicardium, smooth muscle cell, fibroblast, immune cell, nervous system, conduction system, and red blood cells. We normalized the fetal heart dataset using the same approach described above and then trained the classifier (getFeatureSpace and trainModel functions) using default parameters. For the multi-lineage organoid dataset, we filtered out cells expressing less than 1,500 unique genes, per the original study.20 The multi-lineage organoid dataset, guided differentiation dataset, and peripheral blood mononuclear cells (PBMC) dataset31 were all normalized using the same approach described above. We classified cells from each dataset (scPredict function) using a threshold of 0.9.
Supplementary Material
Key resources table
| REAGENT or RESOURCE | SOURCE | IDENTIFIER |
|---|---|---|
| Chemicals, peptides, and recombinant proteins | ||
| Matrigel Growth Factor Reduced (GFR) Basement Membrane Matrix | Corning | Cat.# 354230 |
| Essential 8™ (E8) medium | Thermo Fisher Scientific | Cat.# A1517001 |
| Penicillin-Streptomycin | Lonza | Cat.# 17-602F |
| 10μM ROCK inhibitor Y-27632 | Abcam | Cat.# ab120129 |
| Chroman 1 | Torcis | Cat.# 7163 |
| Emricasan | MedKoo Biosciences | Cat.# 510230 |
| Polyamines | Sigma-Aldrich | Cat.# P8483 |
| Trans-ISRIB | Torcis | Cat.# 5284 |
| CHIR99021 | STEMCELL Technologies | Cat.# 72052 |
| IWP4 | STEMCELL Technologies | Cat.# 72552 |
| RPMI 1640 Medium, GlutaMAX™ Supplement, HEPES | Thermo Fisher Scientific | Cat.# 72400047 |
| B-27 Supplement, minus insulin | Thermo Fisher Scientific | Cat.# A1895601 |
| AccuMax™ | STEMCELL Technologies | Cat.# 07921 |
| Bovine Serum Albumin (BSA) solution | Sigma-Aldrich | Cat.# A8412 |
| Critical commercial assays | ||
| 10x Genomics Chromium Next GEM Single Cell 3′ Reagent Kits v3.1 (Dual Index) | 10x Genomics | Single Cell 3′ v3.1 |
| Deposited data | ||
| Guided differentiation scRNA-seq | This paper | GEO: GSE230587 |
| 16-day differentiation time-course scRNA-seq | Elorbany, et al., 2022 | GEO: GSE175634 |
| Healthy fetal heart tissue scRNA-seq | Miao et al., 2020 | GEO: GSE138979 |
| Day-100 multi-lineage organoid scRNA-seq | Silva et al., 2021 | GEO: GSE153075 |
| Human peripheral blood mononuclear cells (PBMCs) | 10x Genomics | 20k Human PBMCs, 3′ HT v3.1, Chromium X |
| Experimental models: Cell lines | ||
| Human iPSC line | Banovich, et al., 2018 | 19114 |
| Human iPSC line | Banovich, et al., 2018 | 19130 |
| Human iPSC line | Banovich, et al., 2018 | 19152 |
| Software and algorithms | ||
| Cell Ranger v6.1.2 | Zheng, et al., 2017 | https://support.10xgenomics.com/single-cell-gene-expression/software/overview/welcome |
| Vireo v0.5.6 | Huang, et al., 2019 | https://github.com/single-cell-genetics/vireo |
| Seurat v4.3.0 | Stuart, et al., 2019 | https://satijalab.org/seurat/ |
| Tidyverse v2.0.0 | Wickham, et al., 2019 | https://www.tidyverse.org/ |
| scPred v1.9.2 | Alquicira-Hernandez, et al., 2019 | https://github.com/powellgenomicslab/scPred |
| RColorBrewer v1.1-3 | Neuwirth, 2022 | https://cran.r-project.org/web/packages/RColorBrewer/index.html |
| Other | ||
| AggreWell™800 24-well plate | STEMCELL Technologies | Cat.# 34811 |
| Anti-Adherence Rinsing Solution | STEMCELL Technologies | Cat.# 07010 |
| Ultra-low adherent plate | STEMCELL Technologies | Cat.# 100-0083 |
| Wide bore pipette tip | Thermo Fisher Scientific | Cat.# 2079GPK |
| 40μm cell strainer | Bel-Art | Cat.# H136800040 |
| Color schemes | Tol, 2021 | https://personal.sron.nl/~pault/ |
Acknowledgements.
We thank all members of the Gilad lab for their support. This work was completed in part with resources provided by the University of Chicago’s Research Computing Center. We thank the University of Chicago Functional Genomics Core Facility for their assistance with sequencing the libraries. Figures 1A and 3B were created using BioRender.com.
Funding.
This work was funded by a MIRA award (R35GM131726) to Y.G. E.M. was supported by grants from the NIH (T32GM139782, T32HL007381, and F31HL168912).
Footnotes
Declaration of interests. Y.G. and E.M. are named as inventors with the University of Chicago on a patent application related to cardiac guided differentiation.
REFERENCES
- 1.Takahashi K. et al. Induction of Pluripotent Stem Cells from Adult Human Fibroblasts by Defined Factors. Cell 131, 861–872 (2007). [DOI] [PubMed] [Google Scholar]
- 2.Chen Z., Su S. & Cowan C. A. Chapter 2 - hiPSCs for population genetics. in Current Topics in iPSCs Technology (ed. Birbrair A.) vol. 17 19–44 (Academic Press, 2022). [Google Scholar]
- 3.Cuomo A. S. E. Single-cell RNA-sequencing of differentiating iPS cells reveals dynamic genetic effects on gene expression. 14 (2020). [DOI] [PMC free article] [PubMed] [Google Scholar]
- 4.Strober B. J. et al. Dynamic genetic regulation of gene expression during cellular differentiation. 5 (2019). [DOI] [PMC free article] [PubMed] [Google Scholar]
- 5.Elorbany R. et al. Single-cell sequencing reveals lineage-specific dynamic genetic regulation of gene expression during human cardiomyocyte differentiation. PLOS Genet. 18, e1009666 (2022). [DOI] [PMC free article] [PubMed] [Google Scholar]
- 6.GTEx Consortium. Genetic effects on gene expression across human tissues. Nature 550, 204–213 (2017). [DOI] [PMC free article] [PubMed] [Google Scholar]
- 7.Knowles D. A. et al. Determining the genetic basis of anthracycline-cardiotoxicity by molecular response QTL mapping in induced cardiomyocytes. eLife 7, e33480 (2018). [DOI] [PMC free article] [PubMed] [Google Scholar]
- 8.Ward M. C., Banovich N. E., Abhishek Sarkar, Stephens M. & Gilad Y. Dynamic effects of genetic variation on gene expression revealed following hypoxic stress in cardiomyocytes. eLife 10, e57345 (2021). [DOI] [PMC free article] [PubMed] [Google Scholar]
- 9.Fowler J. L., Ang L. T. & Loh K. M. A critical look: Challenges in differentiating human pluripotent stem cells into desired cell types and organoids. WIREs Dev. Biol. 9, (2020). [DOI] [PMC free article] [PubMed] [Google Scholar]
- 10.Lewis-Israeli Y. R. et al. Self-assembling human heart organoids for the modeling of cardiac development and congenital heart disease. Nat. Commun. 12, 5142 (2021). [DOI] [PMC free article] [PubMed] [Google Scholar]
- 11.Bauwens C. L. et al. Geometric Control of Cardiomyogenic Induction in Human Pluripotent Stem Cells. Tissue Eng. Part A 17, 1901–1909 (2011). [DOI] [PubMed] [Google Scholar]
- 12.Branco M. A. et al. Transcriptomic analysis of 3D Cardiac Differentiation of Human Induced Pluripotent Stem Cells Reveals Faster Cardiomyocyte Maturation Compared to 2D Culture. Sci. Rep. 9, 9229 (2019). [DOI] [PMC free article] [PubMed] [Google Scholar]
- 13.Chen Y. et al. A versatile polypharmacology platform promotes cytoprotection and viability of human pluripotent and differentiated cells. Nat. Methods 18, 528–541 (2021). [DOI] [PMC free article] [PubMed] [Google Scholar]
- 14.Lian X. et al. Directed cardiomyocyte differentiation from human pluripotent stem cells by modulating Wnt/β-catenin signaling under fully defined conditions. Nat. Protoc. 8, 162–175 (2012). [DOI] [PMC free article] [PubMed] [Google Scholar]
- 15.Burridge P. W. et al. Chemically defined generation of human cardiomyocytes. Nat. Methods 11, 855–860 (2014). [DOI] [PMC free article] [PubMed] [Google Scholar]
- 16.Drakhlis L. et al. Human heart-forming organoids recapitulate early heart and foregut development. Nat. Biotechnol. 39, 737–746 (2021). [DOI] [PMC free article] [PubMed] [Google Scholar]
- 17.Stuart T. et al. Comprehensive Integration of Single-Cell Data. Cell 177, 1888–1902.e21 (2019). [DOI] [PMC free article] [PubMed] [Google Scholar]
- 18.Miao Y. et al. Intrinsic Endocardial Defects Contribute to Hypoplastic Left Heart Syndrome. Cell Stem Cell 27, 574–589.e8 (2020). [DOI] [PMC free article] [PubMed] [Google Scholar]
- 19.Alquicira-Hernandez J., Sathe A., Ji H. P., Nguyen Q. & Powell J. E. scPred: accurate supervised method for cell-type classification from single-cell RNA-seq data. Genome Biol. 20, 264 (2019). [DOI] [PMC free article] [PubMed] [Google Scholar]
- 20.Silva A. C. et al. Co-emergence of cardiac and gut tissues promotes cardiomyocyte maturation within human iPSC-derived organoids. Cell Stem Cell 28, 2137–2152.e6 (2021). [DOI] [PubMed] [Google Scholar]
- 21.Mummery C. et al. Differentiation of Human Embryonic Stem Cells to Cardiomyocytes: Role of Coculture With Visceral Endoderm-Like Cells. Circulation 107, 2733–2740 (2003). [DOI] [PubMed] [Google Scholar]
- 22.Umans B. D., Battle A. & Gilad Y. Where Are the Disease-Associated eQTLs? Trends Genet. TIG 37, 109–124 (2021). [DOI] [PMC free article] [PubMed] [Google Scholar]
- 23.Banovich N. E. et al. Impact of regulatory variation across human iPSCs and differentiated cells. Genome Res. 28, 122–131 (2018). [DOI] [PMC free article] [PubMed] [Google Scholar]
- 24.The International HapMap Consortium. The International HapMap Project. Nature 426, 789–796 (2003). [DOI] [PubMed] [Google Scholar]
- 25.Zheng G. X. Y. et al. Massively parallel digital transcriptional profiling of single cells. Nat. Commun. 8, 14049 (2017). [DOI] [PMC free article] [PubMed] [Google Scholar]
- 26.Huang Y., McCarthy D. J. & Stegle O. Vireo: Bayesian demultiplexing of pooled single-cell RNA-seq data without genotype reference. Genome Biol. 20, 273 (2019). [DOI] [PMC free article] [PubMed] [Google Scholar]
- 27.Wickham H. et al. Welcome to the Tidyverse. J. Open Source Softw. 4, 1686 (2019). [Google Scholar]
- 28.Hafemeister C. & Satija R. Normalization and variance stabilization of single-cell RNA-seq data using regularized negative binomial regression. Genome Biol. 20, 296 (2019). [DOI] [PMC free article] [PubMed] [Google Scholar]
- 29.Tol P. Colour Schemes. https://personal.sron.nl/~pault/ (2021).
- 30.Neuwirth E. ColorBrewer Palettes [R package RColorBrewer version 1.1-3]. (2022).
- 31.20k Human PBMCs, 3’ HT v3.1, Chromium X Single Cell Gene Expression Dataset by Cell Ranger (2021).
Associated Data
This section collects any data citations, data availability statements, or supplementary materials included in this article.
Supplementary Materials
Data Availability Statement
Code for data analysis available at: https://erikmcintire.github.io/Guided_differentiation/
Sequencing data have been deposited in GEO and will be made public concurrent with publication.