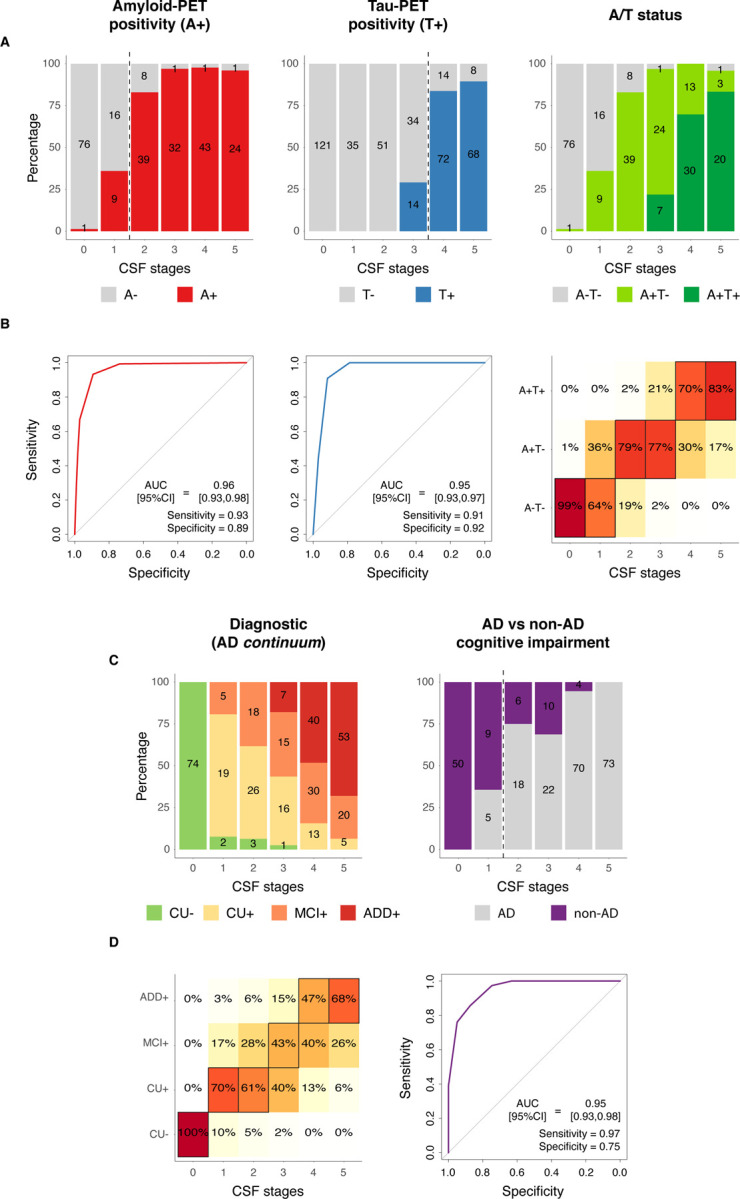
Fig 3: CSF stages for predicting A/T status and cognitive stages.

CSF stages for predicting pathological status as measured with PET is shown in A-B, and for predicting cognitive stages and diagnostic groups in C-D. Barplots represent the number of participants in each category per CSF stage. Numbers of participants in each category per CSF stage are shown within the barplots (A and C). In B and D, ROC curves were used to assess the classification into dichotomic categories (Aβ-PET, tau-PET and AD vs non-AD cognitive impairment), whereas ordinal logistic regressions were used for ordinal categories (A/T status and diagnosis). Heatmaps represent the predicted percentage of participants in each outcome category (A/T or diagnosis) by CSF stage. The most probable (highest percentage) category by CSF stage is framed in black. For ROC analyses, AUCs, sensitivity and specificity measures from these analyses are shown in the plot. The optimal cut-off in each case is shown as a vertical dashed line in A or C. An A−T+ participant (n=1) was excluded from the A/T status analysis. Non-AD dementia cases were excluded from the cognitive stages analysis. And, only patients with objective impairment (MCI or dementia) were included in the analyses of AD vs. non-AD. Aβ- and tau-PET were assessed as positive based on previously validated cut-offs (Aβ: SUVR>1.03, tau: SUVR>1.36). Abbreviations: Aβ, amyloid-β; AD, Alzheimer’s disease; ADD+, Alzheimer’s disease dementia amyloid-positive; A−T−, amyloid-negative tau-negative; A−T+, amyloid-negative tau-positive; A+T−, amyloid-positive tau-negative; A+T+, amyloid-positive tau-positive; CSF, cerebrospinal fluid; CU−, cognitively unimpaired amyloid-negative; CU+, cognitively unimpaired amyloid-positive; MCI+, mild cognitive impairment amyloid-positive; PET, positron emission tomography; ROC, receiver operating characteristic; ROI, region of interest; SUVR, standardized uptake value ratio.
