

Abstract
Background:
Research suggests that up to one-third of children who reunify re-enter care because of continued maltreatment. For young children, this is particularly detrimental due to rapid brain development during the first years of life.
Objective:
This study examined family- and state child welfare system predictors of successful reunification, or reunification with no reentries into foster care.
Methods:
A sample of N=53,789 from the 2012 Adoption and Foster Care Analysis and Reporting System of children ages zero-to-five who reunified was utilized. Children were tracked over the following three years and a multilevel model was run to compare family- and state system-factors among those that successfully and unsuccessfully reunified.
Results:
Only 4.6 % of the variance in successful reunification was at the state child welfare system level. After adjusting for family-factors, state average time-to-reunify (OR=1.04, p < .05) and violent crime rates (OR=1.00, p < .01) were associated with successful reunification. A random effect for race and ethnicity and parental drug use suggests that the relationship between race and ethnicity and successful reunification, and parental drug use and successful reunification, varies significantly by state child welfare system.
Conclusions:
Given these findings, practitioners and child welfare agencies should prioritize family-centered interventions. Future research could identify which state child welfare systems have successfully improved outcomes for families of color and families with histories of drug abuse.
Keywords: Successful reunification, Infants and young children, Families first and prevention act, Permanence
1. Introduction
For children in the foster care system, reunification with their families of origin has been considered the priority for the past several decades. With the passage of the Adoption Assistance and Child Welfare Act of 1980 (Public Law 96–272) and the Adoption and Safe Families Act (ASFA) of 1997 (Public Law 105–89), caseworkers have had to demonstrate that they have made “reasonable efforts” to reunify children and youth in care (O’Neill & Gesiriech, 2004). For the 270,000 children and youth who enter foster care annually, the majority are discharged to reunify with a biological parent (U.S. Department of Health & Human Services [USDHHS], 2017). Furthermore, the majority of children and youth in foster care consistently voice their desire to return to their birth parents (Geenen & Powers, 2007; Mallon & McCartt Hess, 2005). Moreover, this desire to connect with the birth family impacts children who were placed at all ages for adoption; in fact, children placed for adoption as infants constitute the largest group of people searching for birth relatives as they reach adulthood (Child Welfare Information Gateway, 2011). In fact, the recently enacted Families First and Prevention Services Act of 2018 recognizes the importance of family connections and prioritizes preventive services so that children do not enter foster care systems. Yet, up to one-third of those that reunify re-enter foster care because of continued abuse or neglect in their biological families (Lee, Jonson-Reid, & Drake, 2012; Wulczyn, 2004). Therefore, the time constraints under federal legislation have been questioned, in that they might lead to rushed reunifications, reuniting the family before all needs are addressed (Streff, 2016).
1.1. Successful family reunification
The concept of reunification as “safe and lasting” (Wulczyn, 2004, p. 95) is defined as successful reunification, or post-reunification success in this paper, and builds upon the traditional definition of reunification as “the process of returning children in temporary out-of-home care to their families of origin” (Child Welfare Information Gateway, 2011, p. 2). Successful family reunification emphasizes permanence and long-term wellbeing after biological families reunify from child welfare systems. Other forms of permanence for children in foster care, such as adoption, have been viewed as a lifelong process or journey for decades (Silverstein & Kaplan, 1982). Yet, while reunification poses additional challenges for families as they address the child’s trauma as well as their own risk factors that led to the child’s removal, fewer services are offered post-permanence via reunification than via adoption or guardianship (Child Trends, 2013). This fails to meet the families’ ongoing needs and also fails to address the large proportion of families that experience a subsequent removal.
1.1.1. Successful reunification for families
Through successful reunification, families achieve permanence, safety, and wellbeing, all of which constitute the three main pillars of child welfare (DePanfilis & Salus, 2003). Families achieve permanence because successful reunification entails a lasting relationship (Barth & Chintapalli, 2009). This lasting relationship, or relational permanence, focuses on post-permanence experiences and lifelong connections instead of the physical act of discharge (Cushing, Samuels, & Kerman, 2014; Jones & LaLiberte, 2013; Perez, 2017). Successful reunification also includes safety, because children are not re-exposed to the factors that led to the initial removal. Finally, successful reunification includes family wellbeing, in that the family is able to meet the children’s needs (Mallon & McCartt Hess, 2005).
1.1.2. Successful reunification for infants and young children
In contrast to older children and youth who might enter or re-enter foster care because of their own behavior problems or their parents’ inability to cope with the youth’s behavior, infants and young children primarily enter foster care when their biological parents or family have exposed them to abuse or neglect (Wulczyn, Hislop, & Harden, 2002). Furthermore, there has been a recent increase in the proportion of infants and young children entering child welfare systems; the proportion of children under age 1 entering care has become the highest by age group (National Conference of State Legislatures (NCSL), 2018) and children under five constitute 41 % of all children in care (U.S. Department of Health & Human Services [USDHHS], 2017). This increase has largely been attributed to the increase in infants exposed to substances in-utero (Patrick, Davis, Lehmann, & Cooper, 2015), and infants with a diagnosis of substance exposure are placed in foster care at 11 times the rate of those without a diagnosis (Prindle, Hammond, & Putnam-Hornstein, 2018). In some areas particularly hard-hit by the current opioid crisis, over 60 % of foster care entries are due to parental drug use (Substance Abuse & Mental Health Services Administration (SAMHSA), 2016).
In addition to possible substance exposure in utero, exposure to trauma and parental separation has a particularly detrimental effect on infants and young children, who are in a critical stage for brain development and attachment (Brandt, Perry, Seligman, & Tronick, 2014; Frame, Berrick, & Brodowski, 2000; Perry & Szalavitz, 2017; Perry, 2014; Vig, Chinitz, & Shulman, 2005). Traumatic attachments in infancy and early childhood have been linked to maladaptive infant and adult mental health (Schore, 2016). Thus, removals and subsequent re-entries into care could be particularly detrimental for infants and young children, who are in “critical periods of psychosocial maturation” (Schore, 2016, p. 30).
In addition to the critical period of brain development during infancy, prenatal exposure to drugs and alcohol can also pose challenges for families as they reunify. Notably, the incidence of neonatal abstinence syndrome (NAS), a withdrawal syndrome present in many infants who were exposed to opioids prenatally, increased 300 % between 1999 and 2013 (Williams & Devooght, 2017). While experts agree that the impact of prenatal exposure varies greatly among children and depends on many factors, prenatal exposure to illicit drugs has been linked to behavioral problems, cognitive difficulties, and increased risk of attention deficit disorder (ADHD) (Thompson, Levitt, & Stanwood, 2009). For infants and young children who were exposed to alcohol prenatally, they are at risk for Fetal Alcohol Spectrum Disorders (FASD). FASD have been found to impair functioning, cause birth defects, and are linked with long-term neurobehavioral problems (Peadon, Rhys-Jones, Bower, & Elliott, 2009). Therefore, families whose children were exposed to substances prenatally may require extra support post-permanence.
1.1.3. Successful reunification from a state system perspective
Within state systems, reunification with biological parents remains the priority case goal for children in foster care and guides both federal and state policy (Noble & Ausbrooks, 2008). State systems have flexibility and autonomy to determine which services to provide and how to implement them (Child Welfare Information Gateway, 2012). In recent years, many state systems have shifted towards privatization of child welfare services, in which the responsibility for certain child welfare functions is contracted out to private non-profit or for-profit agencies (McBeath, Collins-Camargo, & Chuang, 2012). This has the potential to impact reunification and successful reunification because some states have started to contract out case management services, including assessments and interventions with biological families, to the private sector. Despite over half of state systems implementing small- or large-scale privatization of some child welfare services (McCullough & Schmitt, 2000), little research has examined its impact on reunification and successful reunification over time. Another difference in the administration of child welfare between state systems is the type of administration. The majority of states have a centralized administrative system, but some states have switched to county-level administration or hybrid (Child Welfare Information Gateway, 2018). However, as with privatization, little research has examined the impact of type of administration on reunification outcomes.
Finally, when state child welfare workers make recommendations in the court systems about reunification, they must balance the pillars of timely permanence with issues related to safety and wellbeing. Therefore, regardless of the scale of privatization or type of administration, it is ultimately the responsibility of the state system to coordinate or oversee contracts with agencies that provide services to meet families’ needs and facilitate post-reunification success.
1.2. Correlates of re-entry among the general foster care population
Few prior studies have focused specifically on correlates of successful reunification among families with infants and young children (Frame et al., 2000). Furthermore, most literature has focused on reunification as a discharge outcome, with fewer measures of post-reunification success. One prior study that examined post-reunification wellbeing concluded that we need to address issues that stem from continued exposure to family risk factors such as continued parental substance use (Bellamy, 2008). Other studies presented below have examined correlates of re-entry among reunified families with children of all ages; findings on child-, family-, and state system-level correlates from these general studies are presented below.
1.2.1. Child-level correlates
Some studies have found that younger children experience higher rates of re-entry (Lee et al., 2012; Shaw, 2006), while others have found that older children have higher rates of re-entry (Barth, Weigensberg, Fisher, Fetrow, & Green, 2008; Yampolskaya, Armstrong, & King-Miller, 2011). It is important to differentiate reasons why reunifications may not be successful for young children when compared to older children and adolescents by examining their unique correlates of successful reunification. As stated in the introduction, older children and youth may re-enter care because of their own behavior problems, whereas younger children and infants tend to re-enter care because of continued family risk factors such as parental drug abuse or mental health disorders (Wulczyn et al., 2002). Therefore, for younger children, it is necessary to understand family-level risk and protective factors for post-reunification success.
1.2.2. Family-level correlates
Multiple studies have found a relationship between parental substance use and re-entry (Brook & McDonald, 2009; Frame et al., 2000; Shaw, 2006). Other family-level factors include parental criminal background (Frame et al., 2000), family stress post-reunification (Jones, 1998), and the continued presence of parental risk-factors at reunification (Lee et al., 2012). There have been mixed findings on rates of re-entry and the family’s race or ethnicity; Shaw (2006) reported slightly higher rates of re-entry among African American and Native American children than Caucasians, but Lee et al. (2012) found no significant differences on re-entry rates for children by racial group after controlling for other factors. Therefore, it is not clear if child or family race and ethnicity impact successful reunification.
Notably, only one of these articles that examine family-level correlates of re-entry focused exclusively on families of infants and young children (Frame et al., 2000). Yet, Frame and colleagues only used a sample of 88 infants and young children, and only found one factor, maternal substance use, that was significantly correlated with re-entry. Therefore, little is known about how these risk factors might impact successful reunification for infants and young children. Furthermore, little is known about the impact of family factors on successful reunification after controlling for contextual factors at the state- or agency- level.
1.2.3. State system-level correlates
Few studies have examined the contextual impact of state system- factors on successful reunification and re-entries. Three studies examined lengths of stay in care, with all three concluding that longer lengths of stay in care were associated with fewer re-entries (Barth et al., 2008; Wells & Correia, 2012: Yampolskaya, Armstrong, & Vargo, 2007). These findings are consistent with Streff’s (2016) concern of rushed reunifications. However, these three studies examined time-to-reunify at the family-level, without examining state averages or rates.
Yampolskaya et al. (2011) examined contextual factors in Florida’s child welfare system that included expenditure per child at each individual agency, number of counties served by each agency, retention of case management, and presence of a parent organization. This study found that lower agency expenditures per child and contracting out case management services were both associated with faster reentry into foster care. Notably, although state systems have flexibility in determining the proportion of expenditures on reunification services, little research has examined the correlation between the proportion of the child welfare budget spent on reunification and post-reunification success. Furthermore, little is understood about state-wide drug rates or overdose deaths and how they impact successful reunification.
Although few prior studies beyond Yampolskaya et al.’s (2011) have examined contextual factors that may impact successful reunifications, some prior research has examined the impact of state-level factors on similar phenomena such as child maltreatment. Since re-entry into foster care, especially for infants and young children, often involves recurrences of child maltreatment, these variables could potentially impact successful reunification rates as well. For example, prior studies have found that factors such as higher state-level income (Freisthler, Gruenewald, Remer, Lery, & Needell, 2007), state-level poverty (Farrell et al., 2017) and community violence rates (Daley et al., 2016) were correlated with aggregated child maltreatment rates. However, little research has examined the interaction between contextual- and family-level factors, and its impact on successful reunification. Furthermore, little has focused on between-system differences among child welfare systems in the U.S., and how these variables might increase the odds of successful reunification for families with infants and young children in care. Given the relative autonomy and flexibility in implementing child welfare policy at the state-level, it is important to examine how, if at all, these differences impact outcomes such as successful reunification for families involved in child welfare systems across the United States. In consideration of the increase in infants and young children in foster care (National Conference of State Legislatures (NCSL), 2018) and the particularly detrimental impact removals and disruptions in attachment have in this group of children (Schore, 2016), it is crucial to identify factors that can increase the odds of achieving successful reunification for these families.
1.2.4. Overview and critique of prior research
Up to one-third of children who reunify with biological parents from child welfare systems re-enter foster care, but there is a dearth of research on factors that promote successful reunification. Despite experts identifying infants and young children as particularly susceptible to negative developmental impacts from early exposure to abuse and neglect, little research has been conducted specifically with families involved in child welfare systems who have young children. Moreover, prior studies have largely focused on one dimension of re-entry, such as child- or family-factors, without controlling for contextual effects from the state systems in which families reside. Experts have recognized the need for specific analytic techniques that can adequately measure and evaluate multi-level theoretical constructs (Duncan, Jones, & Moon, 1998; Luke, 2004), but few prior studies have examined the influence of both family- and state-level variables on successful reunification rates.
1.3. The present study
The present study addresses gaps in prior literature by examining the following research questions across state systems: 1a) What is the prevalence of successful reunifications for families with infants and young children involved in child welfare systems; 1b) Do these rates differ among state child welfare systems; and 2) What state-level factors are associated with successful reunifications for these families after controlling for family-characteristics?
2. Methods
The current study uses data from the Adoption and Foster Care Analysis and Reporting System (AFCARS), a federally-mandated data collection system that provides information on all children in foster care across the United States. Under this mandate, states are required to collect case specific data on all children in foster care for whom the state child welfare agency has responsibility for placement, care, or supervision, regardless of eligibility for federal Title IV-E funds. States are required to submit all of their adoption and foster care data electronically to the Children’s Bureau on a semiannual basis. The Children’s Bureau combines the state files from the two periods into a single annual database (U.S. Department of Health & Human Services [USDHHS], 2017).
This specific sample consists of families whose children were between 0 and 5 years of age and who exited foster care to reunify with at least one biological parent during the fiscal year (FY) 2012. The FY 2012 is comprised of data from 10/1/2011 to 9/30/2012. This resulted in 54,720 cases. Overall, less than .01 % of the data were missing. Therefore, as consistent with other research using AFCARS data, missing data were treated as random (Wildeman & Emanuel, 2014), resulting in 53,789 cases. This study was reviewed and approved by the Institutional Review Board at the author’s institution.
2.1. Successful reunification
The dependent variable in this analysis was successful reunification. This was conceptualized as cases that had reunified in 2012 and had not re-entered care by the end of 2015. Overall, 83.2 % of families experienced successful reunification, compared to 16.8 % that had unsuccessful reunification, or at least one subsequent entry into the child welfare system post-reunification.
2.2. Family-level measures
Consistent with prior literature on re-entries into foster care systems, family-level predictors selected for this analysis included: removal cause; previous re-entries into care; and family demographics.
2.2.1. Removal cause
Removal causes were dummy coded and not mutually exclusive; therefore, some families had more than one removal cause. These included: physical abuse, sexual abuse, neglect, parental alcohol abuse, parental drug abuse, parental incarceration, and parental inability to cope.
2.2.2. Previous removals
This was measured by the total number of removals the child had experienced. Families whose children were in foster care for the first time received a “1,” while families whose children had re-entered care received the number of separate times their children had entered care. This variable ranged from 1 to 7, representing families that had experienced anywhere from no previous removals to seven previous removals into foster care. The average number of removals was 1.11 (SD=.36). The total number of removals was recoded so that families whose children had entered care for the first time received a “0,” while all other families received a number that represented the total frequency of removals into the foster care system.
2.2.3. Child and family demographic information
These measures included child gender, race, and age at last removal. Child gender was dummy-coded with males as the reference group. Child race included categories of Non-Hispanic African American, Hispanic, American Indian or Alaska Native, two or more races, Asian, and Hawaiian or Pacific Islander. The reference group for race and ethnicity was non-Hispanic White. Child age was measured in years at the last removal (M=2.2 years, SD = 2.7).
2.3. State system-level measures
Based on findings from prior literature on structural correlates of child maltreatment and contextual factors of re-entry into foster care, state system-level variables selected for this study included: state, scale of privatization, type of child welfare administration (state-, hybrid-,or county-level), state-wide violent crime rates, poverty rates, proportion of child welfare budget spent on reunification services, proportion of drug overdose deaths per state, and average time to reunify.
2.3.1. Scale of privatization
The scale of privatization measured how widespread, if at all, states privatized case management services, since case management involves services and interventions for the biological families of children in care. States were grouped into the following categories: Those that had fully-privatized case management, those with large-scale privatization initiatives, those with small-scale privatization initiatives, and those with no privatization. This information came from the National Conference of State Legislatures (NCSL) (2018). Dummy-variables were created for each type of privatization, with the reference group of states with no privatization.
2.3.2. Type of child welfare administration
The type of child welfare administration was based on the Child Welfare Information Gateway report (2018) and consisted of two dummy coded variables for states that were administered at the county-level and those that had hybrid systems. The reference group was states that had a centralized administrative system (i.e., state-administered). The centralized-, hybrid-, and county-level child welfare systems were determined by how centralized administration of child welfare funding, policymaking, licensing, and training was among child welfare systems across the U.S. (Child Welfare Information Gateway, 2018).
2.3.3. State-wide violent crime rates
Violent crime rates by state were reported as the proportion of offenses per 100,000 inhabitants during 2013. These statistics were reported by Statista (n.d.) and added as a variable based on each state’s average of crimes including murder, manslaughter, homicide, rape, sexual assault, robbery, aggravated assault, and mass shootings. The average across states was 407 violent crimes per 100,00 habitants (SD=111.4).
2.3.4. Poverty rates
A variable was created with the average poverty rate per state, as reported by the American Community Survey Briefs. Poverty rates were calculated by comparing annual household income to the household size, number of children, and age of the head of household (Bishaw & Fontenot, 2014). The average statewide poverty rate was 16.1 (SD=2.82).
2.3.5. Proportion of child welfare budget spent on reunification
The proportion of Promoting Safe and Stable Families Program funding that was spent on family reunification in 2013 services was created as a variable by state expenditure (U.S. Department of Health & Human Services [USDHHS], 2014). Funding could also be allocated to prevention and support services, crisis intervention, or adoption promotion. The average proportion of funds spent on reunification services was 21 % (SD=5.71).
2.3.6. Proportion of drug overdose deaths by state
This variable measured the proportion of people per 100,000 habitants that died of drug overdoses in each state in 2016. This information was computed from the Centers for Disease Control and Prevention (CDC) 2019 report on rates of drug overdose deaths by state. The average proportion of drug overdose deaths across states per 100,000 habitants was 16.0 (SD=5.16).
2.3.7. Time to reunification
The average time to reunify by state was calculated by estimating the number of months between the child’s last removal and the discharge from foster care. These variables were available in the AFCARS dataset. The average time to reunify across states was 9.2 months (SD = 2.47).
2.4. Data analysis
All analyses were conducted using SAS 9.4. Univariate statistics were run first to determine prevalence rates of successful reunifications, and then these rates were compared across states. All continuous variables were grand mean centered prior to multivariate analyses. SAS PROC GLIMMIX was used to estimate the intra-class coefficient (ICC) to determine the amount of variance between-states in successful reunifications, and then examine contextual and family-level factors (Cubbin, Pickle, & Fingerhut, 2000; Wolfinger & O’Connell, 1993). Then, family- and state-level factors hypothesized to be associated with successful reunification were added to the model building process. The PROC GLIMMIX function was used for all multi-level models with the estimation method of LaPlace (Ene, Leighton, Blue, & Bell, 2015). For the final random and fixed effect model, variables were only included that had been associated with successful reunification in the fixed effect models.
3. Results
3.1. Descriptive statistics
Table 1 below presents demographic information for the final 53,789 cases used in the current study.
Table 1.
Characteristics of Reunified Families with Small Children (N=53,789).
| N (%) |
|||
|---|---|---|---|
| Successful | Unsuccessful | Total | |
|
| |||
| Removal causea | |||
| Physical abuse | 7987 (17.8) | 1137 (12.5) | 9124 (17.0) |
| Sexual abuse | 1285 (2.8) | 167 (1.8) | 1452 (2.7) |
| Neglect | 29089 (65.0) | 5845 (64.5) | 34934 (64.9) |
| Parental drug abuse | 12623 (28.2) | 3165 (34.9) | 15788 (29.4) |
| Parental alcohol abuse | 3018 (6.7) | 736 (8.1) | 3754 (6.9) |
| Parental incarceration | 3882 (8.6) | 821 (9.0) | 4703 (8.7) |
| Parental inability to cope | 7265 (16.2) | 1632 (18.0) | 8907 (16.5) |
| Child gender | |||
| Male | 22923 (51.2) | 4800 (52.9) | 27723 (51.5) |
| Female | 21805 (48.8) | 4261 (47.1) | 26066 (48.5) |
| Race/Ethnicity | |||
| Non-Hispanic Caucasian | 19240 (43.0) | 4083 (45.1) | 23323 (43.4) |
| Non-Hispanic African American | 9532 (21.3) | 1738 (19.2) | 11270 (21.0) |
| Hispanic | 10402 (23.3) | 1954 (21.6) | 12356 (23.0) |
| American Indian | 942 (2.1) | 281 (3.1) | 1223 (2.3) |
| Asian | 349 (0.8) | 31 (0.3) | 380 (.7) |
| Native Hawaiian | 104 (0.2) | 13 (0.1) | 117 (.2) |
| Two or more races or unknown | 4159 (9.3) | 961 (10.6) | 6020 (9.4) |
| Privatization of case management | |||
| Full | 3985 (8.9) | 1098 (12.1) | 5083 (9.4) |
| Large-scale | 2250 (5.0) | 399 (4.4) | 2649 (4.9) |
| Small-scale | 7378 (16.5) | 1527 (16.9) | 8905 (16.6) |
| None | 31115 (69.6) | 6037 (66.6) | 37152 (69.1) |
| Type of administration | |||
| State | 29517 (66.0) | 5813 (64.2) | 35330 (65.7) |
| County | 13123 (29.3) | 2846 (31.4) | 15969 (29.7) |
| Hybrid | 2088 (4.7) | 402 (4.4) | 2490 (4.6) |
The removal cause categories are not mutually exclusive.
The first objective of this study was to determine the prevalence rates of successful reunification for families with infants and young children in foster care. Overall, 83.2 % of the families in this sample had successful reunifications. Fig. 1 below shows the prevalence of successful reunifications by state. There were significant differences in rates of successful reunification across states (X2(51) = 735.4, p < .001). Illinois had the highest rate of successful reunifications (98 %) while New York had the lowest rate (75.1 %).
Fig. 1.
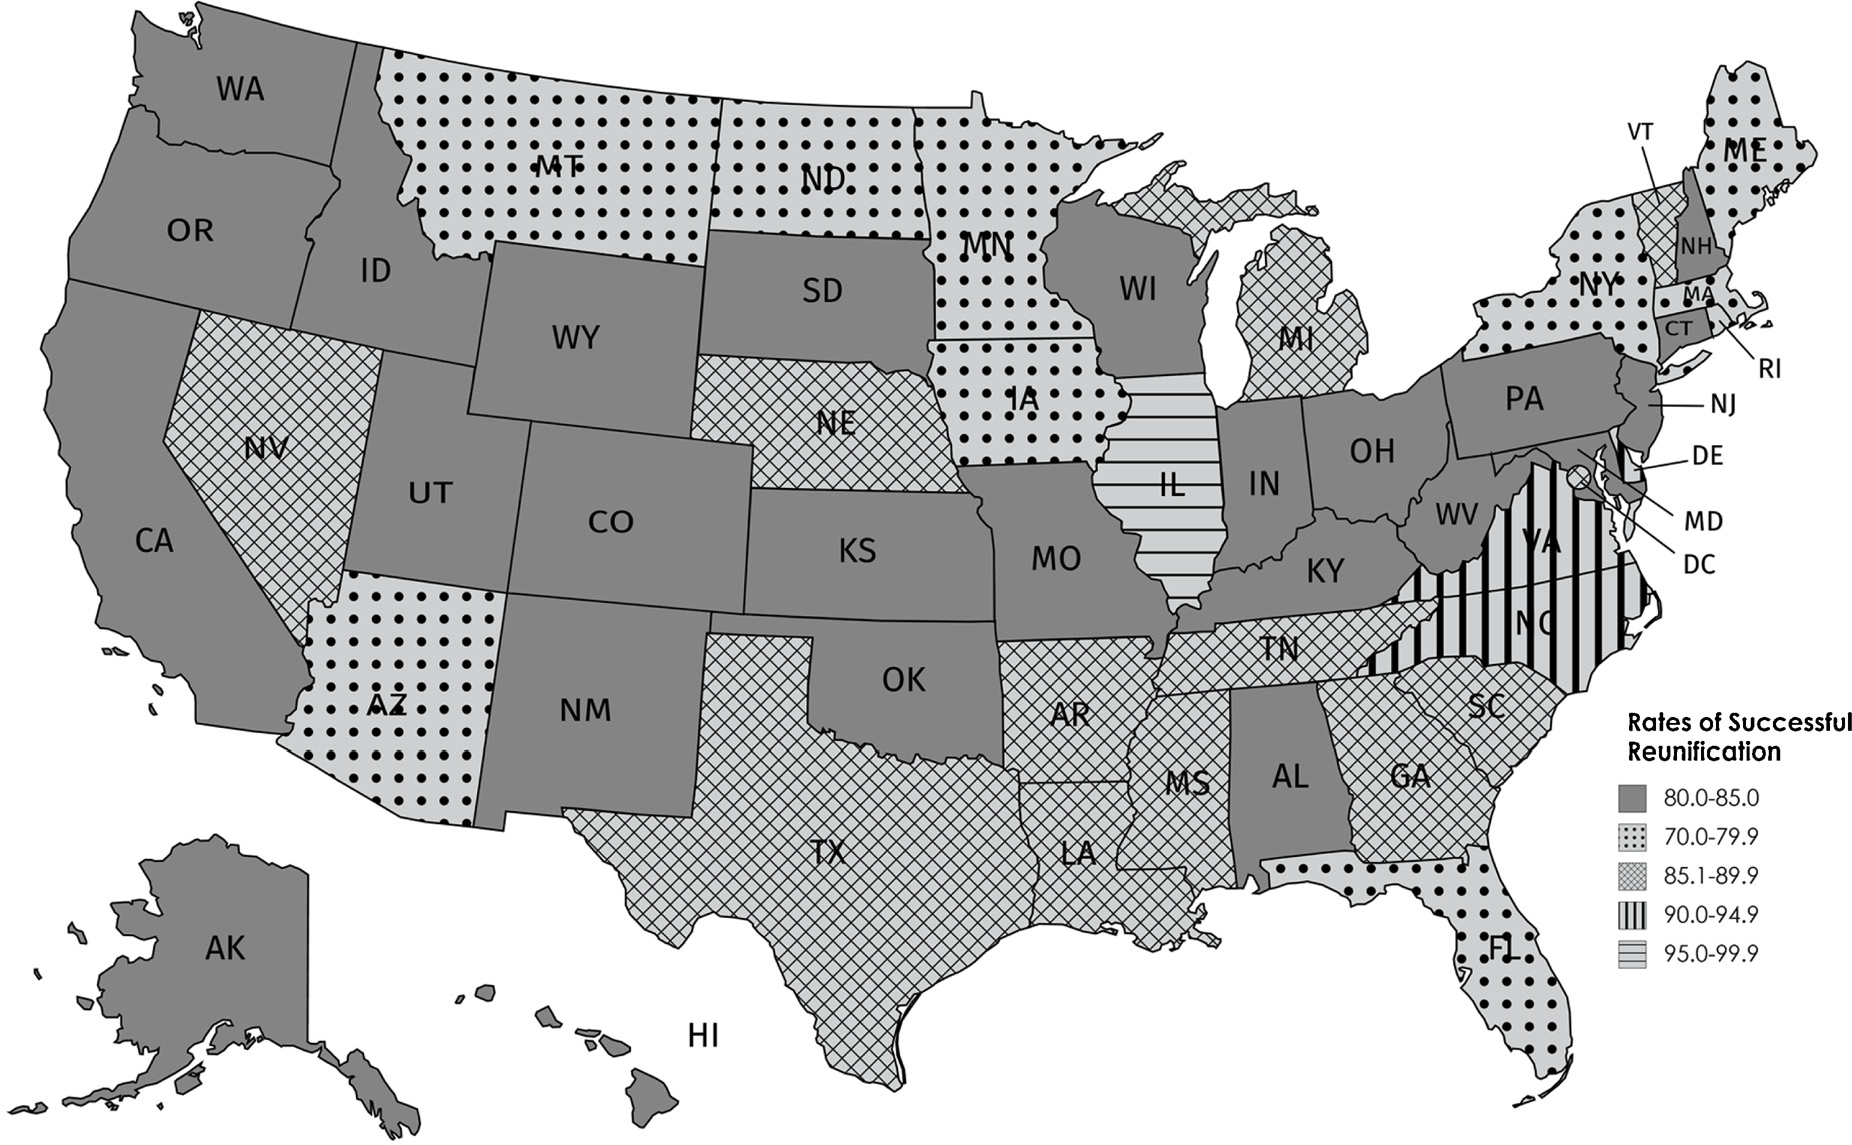
Rates of Successful Reunification by State Child Welfare System, N=53,789.
3.2. Model-building process
The second part of the first research question addressed possible differences among state systems. To answer this question, an unconditional two-level binary model was run. The intra-class coefficient (ICC) for the unconditional model was .046; this indicates that that 4.6 % of the variance in rates of successful reunification could be attributed to the states in the study, with the remaining 95.4 % of the variance attributed to family-level or other factors.
To examine state-level factors that predicted successful reunification after controlling for family-level factors, we built upon the unconditional model to examine the impact of family- and state-level factors on the odds of successful reunification. Following a bottom-up model building procedure, we first entered each variable into a model by itself to examine the unadjusted odds ratios. Next, we ran a model with only family-level predictors. Then, the model was run with only state-level predictors. Finally, a model was run with all family- and state-level predictors that were statistically significant and both fixed and random effects were examined.
3.3. Family-level fixed effects model
The first model process included a step-by-step addition of family-level predictors. Table 2 presents the fit statistics and odds ratios for each for the unadjusted models, the final level-one fixed effect model, the final level-two fixed effect model, the combined fixed effect model, and the random and fixed effects model.
Table 2.
Family- and State- Predictors of Successful Reunification from the Adoption and Foster Care Analysis and Reporting System (AFCARS), N = 53,789.
| Characteristics | Model 1 (unadjusted) |
Model 2 (level-1 model) |
Model 3 (level-2 model) |
Model 4 (combined fixed effect) |
Model 5 (combined random effect) |
||||||||||
|---|---|---|---|---|---|---|---|---|---|---|---|---|---|---|---|
| OR | 95% CI | OR | 95% CI | OR | 95% CI | OR | 95% CI | OR | 95% CI | ||||||
|
| |||||||||||||||
| Fixed Effects | |||||||||||||||
| Level-One | |||||||||||||||
| Removal cause | |||||||||||||||
| Physical abuse | 1.34*** | 1.25 | −1.44 | 1.30*** | 1.21 | −1.40 | 1.30*** | 1.21 | −1.40 | 1.32*** | 1.21 | −1.40 | |||
| Sexual abuse | 1.42*** | 1.20 | −1.67 | 1.28** | 1.08 | −1.51 | 1.29** | 1.09 | −1.53 | 1.27** | 1.07 | −1.50 | |||
| Neglect | 0.93* | 0.88 | −0.99 | 0.91** | 0.86 | −0.97 | 0.91** | 0.86 | −0.96 | 0.91** | 0.86 | −0.96 | |||
| Parental alcohol abuse | 0.89** | 0.81 | −0.97 | 0.90* | 0.82 | −0.98 | 0.90* | 0.82 | −0.98 | 0.89* | 0.81 | −0.97 | |||
| Parental drug abuse | 0.76*** | 0.72 | −0.80 | 0.77*** | 0.73 | −0.81 | 0.77*** | 0.73 | −0.81 | 0.77*** | 0.71 | −0.83 | |||
| Parental incarceration | 1.01 | 0.93 | −1.10 | 0.99 | 0.91 | −1.08 | 0.99 | 0.91 | −1.08 | ||||||
| Parental inability to cope | 0.89*** | 0.84 | −0.95 | 0.89*** | 0.84 | −0.95 | 0.89** | 0.84 | −0.95 | 0.89*** | 0.81 | −0.97 | |||
| Child’s race | |||||||||||||||
| Non-Hispanic, White | 1.00 | 1.00 | 1.00 | ||||||||||||
| Non-Hispanic, Black | 1.11*** | 1.05 | −1.18 | 1.08** | 1.02 | −1.16 | 1.08* | 1.01 | −1.15 | 1.20** | 1.05 | −1.38 | |||
| Hispanic | 1.15*** | 1.08 | −1.23 | 1.12*** | 1.05 | −1.19 | 1.17*** | 1.04 | −1.19 | 1.13* | 1.00 | −1.27 | |||
| American Indian | 0.72*** | 0.62 | −0.84 | 0.74*** | 0.64 | −0.87 | 0.73*** | 0.63 | −0.86 | 0.74*** | 0.63 | −0.86 | |||
| Asian | 2.64*** | 1.82 | −3.83 | 2.45*** | 1.69 | −3.56 | 2.48*** | 1.71 | −3.62 | 2.37*** | 1.64 | −3.43 | |||
| Native Hawaiian | 1.73 | 0.96 | −3.13 | 1.58 | 0.88 | −2.84 | 1.62 | 0.90 | −2.92 | 1.64 | 0.90 | −2.97 | |||
| More than one race | 0.93 | 0.85 | −1.02 | 0.94 | 0.85 | −1.03 | 0.93 | 0.85 | −1.03 | 0.95 | 0.86 | −1.04 | |||
| Female child | 1.07*** | 1.02 | −1.12 | 1.07** | 1.02 | −1.12 | 1.07** | 1.02 | −1.12 | 1.07** | 1.02 | −1.12 | |||
| Previous removals | 0.70*** | 0.66 | −0.74 | 0.67*** | 0.63 | −0.71 | 0.67*** | 0.63 | −0.71 | 0.67*** | 0.63 | −0.71 | |||
| Child age | 1.06*** | 1.05 | −1.07 | 1.07*** | 1.06 | −1.08 | 1.07*** | 1.06 | −1.08 | 1.07*** | 1.06 | −1.09 | |||
| Level-Two | |||||||||||||||
| State poverty rate | 1.02* | 1.00 | −1.05 | 1.02 | 0.99 | 1.04 | 1.01 | 0.98 | −1.03 | ||||||
| State average time to reunify | 1.06** | 1.02 | −1.11 | 1.04* | 1.00 | 1.09 | 1.04 | 0.99 | −1.08 | 1.04* | 1.00 | −1.08 | |||
| State opioid overdose rate | 1.00 | 0.97 | −1.02 | 1.00 | 0.98 | 1.02 | 1.00 | 0.97 | −1.02 | ||||||
| State violent crime rate | 1.00 | 1.00 | −1.01 | 1.00 | 1.00 | 1.00 | 1.00* | 1.00 | −1.00 | 1.00** | 1.00 | −1.00 | |||
| State reunification budget | 0.99 | 0.98 | −1.01 | 1.00 | 0.98 | 1.02 | 1.00 | 0.98 | −1.01 | ||||||
| Scale of privatization | |||||||||||||||
| Fully privatized | 0.79 | 0.46 | −1.38 | 0.75 | .46 | 1.23 | 0.70 | 0.43 | −1.14 | ||||||
| Large-scale privatization | 1.69* | 1.05 | −2.70 | 1.36 | .83 | 2.24 | 1.21 | 0.73 | −1.99 | ||||||
| Small-scale privatization | 0.96 | 0.71 | −1.30 | 0.99 | .74 | 1.32 | 0.97 | 0.72 | −1.29 | ||||||
| No privatization | 1.00 | 1.00 | 1.00 | ||||||||||||
| Administration type | |||||||||||||||
| State-administered | 1.00 | 1.00 | 1.00 | ||||||||||||
| Hybrid | 0.95 | 0.58 | −1.54 | 0.99 | .65 | 1.52 | 0.88 | 0.57 | −1.36 | ||||||
| County-administered | 0.92 | 0.68 | −1.25 | 1.01 | .77 | 1.33 | 1.00 | 0.76 | −1.31 | ||||||
| Random Effects | |||||||||||||||
| Level-2 Intercept | 0.15*** | 0.11*** | 0.10*** | .10*** | |||||||||||
| Parental drug abuse | .02* | ||||||||||||||
| Non-Hispanic Black | .10** | ||||||||||||||
| Hispanic | .05* | ||||||||||||||
| Model fit | |||||||||||||||
| −2LL | 47,501 | 49,170 | 47,483 | 47,421 | |||||||||||
| AIC | 47,537 | 49,194 | 47,539 | 47.465 | |||||||||||
| BIC | 47,572 | 49,217 | 47,594 | 47,508 | |||||||||||
OR = Odds ratio; CI = Confidence interval.
p < .05
p < .01
p < .001.
The level-one fixed effect model examined associations of child- and family- factors with successful reunification. This model included removal cause, race and ethnicity, child sex, previous removals, and child age. All family-level factors were significant predictors of successful reunification except parental incarceration at removal, and families classified as Native Hawaiian or Pacific Islander, or more than one race. Since race was dummy coded, all race and ethnicity categories were included in the second step of the model-building process.
3.4. State-system-Level fixed model
The next step in the model-building process examined associations of state-level factors with successful reunification. The level-two model included statewide poverty rate, statewide average time to reunify, opioid overdose rate, violent crime rate, reunification budget, scale of privatization, and administration type. In the level-two fixed effects model, only the state average time-to-reunify was associated with successful reunification
3.5. Combined fixed effects model
The next step in the model-building process examined the combined fixed effects of family- and state-level factors. In this model, all variables that were included in the level-one and level-two fixed effects models were entered. In the combined model, all removal causes except parental incarceration were associated with successful reunification, all racial and ethnic groups except Native Hawaiian and more than one race were correlated with successful reunification, and child sex, child age, and previous removals were associated with successful reunification. Furthermore, statewide violent crime rate was associated with successful reunification.
3.6. Random slopes and interaction models
In the final part of the modeling process, we tested race and ethnicity and removal cause as random factors in the model to examine any possible differences in slopes across state child welfare systems. Table 2 presents the results from the final model.
Based on the change in degrees of freedom and – 2 log likelihood tests, the final model did not fit better than the family-factors fixed effects model. However, since the AIC, BIC, and proportion of state-level variance explained by the model did improve from the family-factors fixed effect model, this was selected as the final model and coefficients are presented below.
Overall, compared to the level-one fixed effects model, 22.2 % of the level-2 between-state variance was explained by the final model. In the final model, five family-level variables and two state-level variables were significant predictors of successful reunification.
3.6.1. Family-level predictors
At the family level, child age, child sex, child race and ethnicity, previous removals, and removal cause were significant predictors. After controlling for all factors in Table 2, Black families had 1.20 higher odds (95 % CI = 1.05, 1.38; p < .01), Hispanics had 1.13 higher odds (95 % CI = 1.00, 1.27; p < .05), and Asian American families had 2.37 higher odds (95 % CI = 1.64, 3.43) of achieving successful reunification than their non-Hispanic White counterparts. Families that were identified as American Indian had 0.73 lower odds (95 % CI = 0.63, 0.86; p < .001) of achieving successful reunification than their non-Hispanic White counterparts. Moreover, there was a random effect for families who were identified as Black (estimate = .10; p < .01), or Hispanic (estimate = .05; p < .05). This suggests that the relationship between race and ethnicity and successful reunification varies significantly across state systems for families who are African American or Hispanic.
For removal cause, physical abuse, sexual abuse, neglect, parental alcohol abuse, parental drug abuse, and parental inability to cope were correlated with successful reunification. On the one hand, families whose children were initially removed because of physical abuse had 1.31 higher odds of achieving successful reunification (95 % CI = 1.21, 1.40; p < .001) than those who had no history of physical abuse. Families whose children were initially removed because of sexual abuse had 1.27 higher odds of achieving successful reunification (95 % CI = 1.07, 1.50; p < .01) than those with no history of sexual abuse. On the other hand, families whose children were initially removed because of parental drug abuse had 0.77 lower odds of achieving successful reunification (95 % CI = 0.71, 0.83; p < .001) than those with no history of drug abuse. Parents with a history of alcohol abuse had 0.90 lower odds of achieving successful reunification than those without (95 % CI = 0.81, 0.97). Parents with histories of neglecting their children had 0.91 lower odds of successful reunification than those without (95 % CI = 0.86, 0.96). Parents whose children removed because of an inability to cope with their parental roles had 0.89 lower odds of achieving successful reunification than those without (95 % CI = 0.81, 0.97). Parental drug abuse was also significant as a random factor. This suggests that the relationship between this removal cause and successful reunification differs significantly across state systems for families with histories of parental drug abuse.
Families with girls had 1.07 higher odds of successful reunification (95 % CI = 1.06, 1.09; p < .001) than those with boys. For each additional prior removal, families had .67 lower odds of achieving successful reunification (95 % CI = 0.63, .71; p < .001). Finally, for each year older a child was, the odds of successful reunification increased by 1.07 (95 % CI = 1.06, 1.09; p < .001).
3.6.2. State-level predictors
In the final model, the only state-level predictors of successful reunification were the average time to reunify and state-level violent crime rates. For each month longer that it took each state on average to reunify families, the odds of successful reunification increased by 1.04 (95 % CI = 1.00, 1.08; p < .05). For each one-unit increase in the state violent crime rate, odds of successful reunification increased by 1.00 (95 % CI = 1.00, 1.00; p < .01).
4. Discussion
This study examined the prevalence of successful reunification across state child welfare systems and analyzed family- and state system- factors that impacted the odds of achieving successful reunification. The results from this study suggest that there are significant differences in rates of successful reunification between state child welfare systems, with a range from 98.0 % of reunifications that are successful in Illinois to 75.1 % of reunifications that are successful in New York. Despite these differences in prevalence rates, these results suggest that the majority of variation in successful reunification remains at the individual family-level. Therefore, individual family-level factors such as parental drug use and prior experience with child welfare systems (measured by prior entries into foster care), are stronger predictors of successful reunification than state-factors.
Consistent with prior literature (Brook & McDonald, 2009; Frame et al., 2000; Shaw, 2006), families with a history of drug abuse had lower odds of achieving successful reunification. An additional factor that impeded successful reunification was prior removals. Families whose children initially entered care because of physical or sexual abuse had higher odds of achieving successful reunification, as did those with female children. The random effects found for successful reunification rates for Black and Hispanic families might explain the mixed findings reported in prior studies on the role of family race and ethnicity on re-entries (see Lee et al., 2012; Shaw, 2006). The random effects in this study suggest that the odds of achieving successful reunification for Black and Latino families vary significantly across state systems. Therefore, in some states there may be no differences, while in others Black and Latino families might have higher or lower odds of achieving successful reunification than White families.
In contrast to prior literature that linked child maltreatment rates to community violence rates (Daley et al., 2016), the results from the present study suggest that these state-system factors are not predictive of successful reunification. Notably, the only state system-level factors that remained significant after controlling for family-level factors were the state-wide average time to reunify and state violent crime rates. This builds upon prior studies that examined time-to-reunification as a family-level factor (Barth et al., 2008; Wells & Correia, 2012; Yampolskaya et al., 2007), which concluded that longer time-to-reunification increased the odds of successful reunification. Notably, the current study found that the odds of successful reunification slightly increased as the state violent crime rate increased, although the effect size was small. Nonetheless, it should be noted that the effect was very small, and the result bordered on significance. The strength of time-to-reunify was stronger in this study and could indicate that this is an important factor to evaluate at the child welfare-system level. Indeed, the findings from this study could provide further support for Streff’s (2016) concern of rushed reunifications. This could be an important factor for state child welfare systems to consider, especially in light of the time constraints set by ASFA.
4.1. Limitations
While this study contributes to our understanding of factors associated with successful reunification for infants and young children across state systems, it does have some limitations. First, successful reunification was operationalized in this study as no recurrences of the unique AFCARS identifier within 36 months of discharge from foster care to reunification with a biological parent. Therefore, it does not capture re-entries that might have occurred after this time frame, or other dimensions of successful reunification such as re-referrals to child protective services that did not result in a re-entry into care. Furthermore, while re-entries should be assigned the same unique AFCARS identifier, it is possible that in some cases a new identifier was assigned. To address this possible limitation, the rates of re-entry into care in prior studies were compared with the rates found in this study; these prior prevalence rates were similar. Another limitation was that the level-two unit of analysis in this study was state child welfare systems; however, some states administer child welfare services at the county-level, which could increase the between-county variation and increase heterogeneity within each specific state system. This limitation was addressed by controlling for the type of administration—with county-administered and hybrid dummy-coded variables, and state-administered as the reference group. None of these were significant, which suggests that this was not a significant predictor of successful reunification.
4.2. Implications for practice
The results from this study suggest that family-level factors remain the strongest predictors of successful reunification among families with children ages zero-to-five. Therefore, practitioners and child welfare systems should reinforce family-centered practices to support biological parents as they reunify with their children from foster care. The correlation between time-to-reunify and successful reunification could suggest that practitioners need to continue to balance the desire to achieve timely permanency with the other child welfare pillars of safety and wellbeing. The results from this study indicate that families tend to be more successful in maintaining reunification when they are given more time to reunify. Furthermore, these findings are consistent with prior literature that calls for services and interventions that can address the wide range of family problems such as substance use and mental health issues, to ensure these problems are resolved as they reunify (Marsh, Ryan, Choi, & Testa, 2006).
In parallel to this, the finding that the proportion of funds targeting reunification services was not associated with successful reunification might reflect the “time sensitive” nature of these services. These funds were specifically designated for time-sensitive reunification services, provided before or immediately after reunification. Therefore, long-term supports or services offered post-reunification might be more effective in increasing post-reunification permanence and success.
4.3. Implications for policy
The findings from this study suggest that family-factors remain the strongest predictors of successful reunification. Therefore, federal, state, and individual agency-level policies should center on families and supporting them through reunification processes. Furthermore, the findings from this study are consistent with prior literature that has concluded that longer stays in care result in more successful reunifications (Barth et al., 2008; Wells & Correia, 2012; Yampolskaya et al., 2007). This might also explain why the proportion of funds spent on reunification services was not a significant predictor of successful reunification; the measure of reunification funds only considered short-term services that were time-sensitive. Thus, the lack of relationship between the proportion of funds state systems spend on time-sensitive reunification services and successful reunification might reflect the need for longer, ongoing services. These findings also support Streff’s (2016) concern that time constraints under ASFA might result in rushed reunifications. Indeed, this finding coincides with other literature that has called for a case-by-cases analysis of family circumstances instead of a rigid time limit to achieve reunification (Sherry, 2010). Rushed reunifications could be particularly detrimental for families with a history of drug abuse, given that drug rehabilitation can take a long time (Substance Abuse & Mental Health Services Administration (SAMHSA), 2004). This is of particular relevance to families of infants and young children, given the disproportionate impact of the opioid crisis on infants and young children (Smith, 2017). Therefore, while it is important to achieve timely permanency, it is also important for state child welfare systems and their policies to prioritize safety and family wellbeing, so that they ensure a reunification can be permanent. At the federal level, this could include reassessing the time constraints in ASFA and adjusting them in cases where families are complying with treatment plans so that the reunification can occur when the family is ready and not when the allotted time is up.
Another possible response could include policies that allow more flexibility for intensive in-home services after reunification, especially for families with histories of drug abuse. The recent Families First Act has the potential to improve reunification services by eliminating time limit constraints (First Focus Campaign for Children, 2018). Furthermore, in the event of a drug relapse post-reunification, state-level policies could allow in-home services and support instead of subsequent removals of the child. By centering policies around families’ needs and partnering with families to address challenges before they become risk factors, families could be better-supported post-reunification to meet their children’s needs. This is also particularly important for families with infants and young children as evidenced in the 2013 report by Child Trends. Given the ongoing challenges and needs that infants and young children present post-permanency, many states offer post-permanency services for adoptive and guardianship families; however, these services are offered much less frequently to families who have reunified (Child Trends, 2013). Therefore, state-wide policies could be adapted to allow mental health services, early learning and development programs, support groups, and other community-based services that offer post-permanency support for adoptive or guardianship families to offer these same services for families who have reunified.
4.4. Implications for research
Of the family-level factors in this study, three varied significantly across state systems. Therefore, future research could explore these factors more in-depth along with other state system-factors that might explain some of the variance. For parental drug abuse, state-wide overdose rates did not explain any of the between-state variation in odds of successful reunification; however, it is possible that other state-system factors might impact reunification outcomes for families with histories of drug abuse. This is particularly relevant for families with infants and young children, because the opioid crisis is disproportionately impacting these families (Smith, 2017).
In addition to the variation in successful reunification for families with a history of drug abuse across state systems, the odds of successful reunification also varied significantly between states for Hispanic and Black families. This could explain, in part, some of the mixed findings in prior literature on the role of race and ethnicity in reunification outcomes (Akin, 2011; Lu et al., 2004; Putnam-Hornstein & Shaw, 2011). Future research could delve into possible reasons that could explain these between-state differences. Future research could also focus on other state-system factors that might influence these odds of successful reunification for all families of infants and young children and explain more of the variation between states.
Finally, given the heterogeneity in types of privatization and their implementation, future research could do a more in-depth case study or comparison of specific states. This could guide our understanding of the impact of specific types of privatization and specific modes of implementation on child welfare outcomes, including reunification. This is particularly relevant as more states systems adopt privatization measures, many of which will require private agencies to work with biological families and support them as they reunify.
4.5. Conclusion
For families of infants and young children who have reunified from child welfare systems, family-level factors remain the strongest predictors of successful reunifications or post-reunification success. Nonetheless, there does appear to be significant variation across state systems, and the odds of successful reunification for some families, such as those who are Hispanic or Black, or those with histories of drug abuse, vary significantly across state systems. Thus, it is important to consider these factors when planning for reunification. Furthermore, as evidenced in this study and prior literature, sufficient time is needed for families to address the original risk factors that led to their children’s removal before reunification. As more is understood about these family- and state system-factors and their impact on successful reunification, interventions can be better targeted to those families most at-risk of disruption so that they can increase safety and wellbeing on their road to reunification and achieve permanence.
Acknowledgments
The data used in this publication were made available by the National Data Archive on Child Abuse and Neglect, Cornell University, Ithaca, NY, and have been used with permission. Data from the Adoption and Foster Care Analysis and Reporting System (AFCARS) were originally collected by the Children’s Bureau. The collector of the original data, NDACAN, Cornell University and their agents or employees bear no responsibility for the analyses or interpretations presented here.
References
- Akin BA (2011). Predictors of foster care exits to permanency: A competing risks analysis of reunification, guardianship, and adoption. Children and Youth Services Review, 33, 999–1011. 10.1016/j.childyouth.2011.01.008. [DOI] [Google Scholar]
- Barth RP, & Chintapalli LK (2009). Permanence and impermanence for youth in out-of-home care. In Kerman B, Freundlich M, & Maluccio AN (Eds.). Achieving permanence for older youth in foster care (pp. 88–108). New York: Columbia University Press. [Google Scholar]
- Barth RP, Weigensberg EC, Fisher PA, Fetrow B, & Green RL (2008). Reentry of elementary aged children following reunification from foster care. Children and Youth Services Review, 30, 353–364. [DOI] [PMC free article] [PubMed] [Google Scholar]
- Bellamy JL (2008). Behavioral problems following reunification of children in long-term foster care. Children and Youth Services Review, 30, 216–228. 10.1016/j.childyouth.2007.09.008. [DOI] [PMC free article] [PubMed] [Google Scholar]
- Bishaw A, & Fontenot K (2014). Poverty: 2012 and 2013: American community survey briefs. Washington, DC: U.S. Department of Commerce, Economics and Statistics Administration, U.S. Census Bureau. [Google Scholar]
- Brandt K, Perry BD, Seligman S, & Tronick E (2014). Infant and early childhood mental health: Core concepts and clinical practice. Arlington, VA: American Psychiatric Publishing. [Google Scholar]
- Brook J, & McDonald TP (2009). The impact of parental substance abuse on the stability of family reunifications from foster care. Children and Youth Services Review, 31, 193–198. [Google Scholar]
- Centers for Disease Control and Prevention (CDC) (2019). Drug overdose death data. Atlanta, GA: Centers for Disease Control and Prevention. [Google Scholar]
- Trends Child (2013). Changing the course for infants and toddlers: A survey of state child welfare policies and initiatives. Bethesda, MD: Child Trends. [Google Scholar]
- Child Welfare Information Gateway (2011). Family reunification: What the evidence shows. Washington, DC: U.S. Department of Health and Human Services, Children’s Bureau. [Google Scholar]
- Child Welfare Information Gateway (2012). State vs. county administration of child welfare services. Washington, DC: U.S. Department of Health and Human Services, Children’s Bureau. [Google Scholar]
- Child Welfare Information Gateway (2018). State vs. county administration of child welfare services. Washington, DC: U.S. Department of Health and Human Services, Children’s Bureau. [Google Scholar]
- Cubbin C, Pickle LW, & Fingerhut L (2000). Social context and geographic patterns of homicide among US Black and White males. American Journal of Public Health, 90, 579–587. [DOI] [PMC free article] [PubMed] [Google Scholar]
- Cushing G, Samuels GM, & Kerman B (2014). Profiles of relational permanence at 22: Variability in parental supports and outcomes among young adults with foster care histories. Children and Youth Services Review, 39, 73–83. 10.1016/j.childyouth.2014.01.001. [DOI] [Google Scholar]
- Daley D, Bachmann M, Bachmann BA, Pedigo C, Bui MT, & Coffman J (2016). Risk terrain modeling predicts child maltreatment. Child Abuse & Neglect, 62, 29–38 10.1.16/j.chiabu.2016.09.014. [DOI] [PubMed] [Google Scholar]
- DePanfilis D, & Salus MK (2003). Child protective services: A guide for caseworkers. Washington, D.C: U.S. Department of Health and Human Services, Administration for Children and Families, Administration on Children, Youth and Families, Children’s Bureau, Office on Child Abuse and Neglect. [Google Scholar]
- Duncan C, Jones K, & Moon G (1998). Context, composition and heterogeneity: Using multilevel models in health research. Social Science & Medicine, 46(1), 97–117. [DOI] [PubMed] [Google Scholar]
- Ene M, Leighton EA, Blue GL, & Bell BA (2015). Multilevel models for categorical data using SAS ® PROC GLIMIX: The basics. SAS Global Forum 2015 Proceedings, 3430–3442. [Google Scholar]
- Farrell CA, Fleegler EW, Monuteaux MC, Wilson CR, Christian CW, & Lee LK (2017). Community poverty and child abuse fatalities in the United States. Pediatrics, 139(5), e20161616. 10.1542/peds.2016-1616. [DOI] [PubMed] [Google Scholar]
- First Focus Campaign for Children (2018). Family first prevention services act: Bill summary. Retrieved fromhttps://campaignforchildren.org/wp-content-uploads/sites/2/2016/06/FFCC_Short-Summary-FFPSA.pdf.
- Frame L, Berrick JD, & Brodowski ML (2000). Understanding re-entry to out-of-home care for reunified infants. Child Welfare, 74(4), 339–369. [PubMed] [Google Scholar]
- Freisthler B, Gruenewald PJ, Remer LG, Lery B, & Needell B (2007). Exploring the spatial dynamics of alcohol outlets and child protective services referrals, substantiations, and foster care entries. Child Maltreatment, 12, 114–124. [DOI] [PubMed] [Google Scholar]
- Geenen S, & Powers LE (2007). Tomorrow is another problem: The experiences of youth in foster care during their transition into adulthood. Children and Youth Services Review, 29(8), 1085–1101. [Google Scholar]
- Jones AS, & LaLiberte T (2013). Measuring youth connections: A component of relational permanence for foster youth. Children and Youth Services Review, 35, 509–517. 10.1016/j.childyouth.2012.12.006. [DOI] [Google Scholar]
- Jones L (1998). The social and family correlates of successful reunification of children in foster care. Children and Youth Services Review, 20(4), 305–323. [Google Scholar]
- Lee S, Jonson-Reid M, & Drake B (2012). Foster care re-entry: Exploring the role of foster care characteristics, in-home child welfare services and cross-sector services. Children and Youth Services Review, 34, 1825–1833. [DOI] [PMC free article] [PubMed] [Google Scholar]
- Lu Y, Landsverk J, Ellis-MacLeod E, Newton R, Ganger W, & Johnson I (2004). Race, ethnicity, and case outcomes in child protective services. Children and Youth Services Review, 26, 447–461. [Google Scholar]
- Luke DA (2004). Multilevel modeling. Thousand Oaks, CA: Sage. [Google Scholar]
- Mallon GP, & McCartt Hess P (2005). Child welfare for the twenty-first century: A handbook of practices, policies, and programs. New York: Columbia University Press. [Google Scholar]
- Marsh JC, Ryan JP, Choi S, & Testa MF (2006). Integrated services for families with multiple problems: Obstacles to family reunification. Children and Youth Services Review, 28, 1074–1087. 10.1016/j.childyouth.2005.10.012. [DOI] [Google Scholar]
- McBeath B, Collins-Camargo C, & Chuang E (2012). The role of the private sector in the field of child welfare: Historical reflections and a contemporary snapshot based on the National Survey of Private Child and Family Serving Agencies. Journal of Public Child Welfare, 6, 459–481. [Google Scholar]
- McCullough C, & Schmitt B (2000). Managed care and privatization: Results of a national survey. Children and Youth Services Review, 22(2), 117–130. 10.1016/S0190-7409(00)00069-4. [DOI] [Google Scholar]
- National Conference of State Legislatures (NCSL) (2018). Privatization in child welfare Retrieved fromhttp://leg.mt.gov/content/Committees/Interim/2017-2018/Children-Family/Meetings/Mar-2018/march2018-ncsl-cps-privatization-report.pdf.
- Noble DN, & Ausbrooks A (2008). Social work with children and their families. In DiNitto DM, & McNeece CA (Eds.). Social work issues and opportunities (pp. 239–260). Chicago, IL: Lyceum Books. [Google Scholar]
- O’Neill MK, & Gesiriech S (2004). A brief legislative history of the child welfare system Retrieved from: https://www.pewtrusts.org/en/research-and-analysis/reports/2004/11/01/a-brief-legislative-history-of-the-child-welfare-system.
- Patrick SW, Davis MM, Lehmann CU, & Cooper WO (2015). Increasing incidence and geographic distribution of neonatal abstinence syndrome: United States 2009–2012. Journal of Perinatology, 35(8), 650–655. [DOI] [PMC free article] [PubMed] [Google Scholar]
- Peadon E, Rhys-Jones B, Bower C, & Elliott EJ (2009). Systematic review of interventions for children with Fetal Alcohol Spectrum disorders. BMC Pediatrics, 9, 35–44. 10.1186/1471-2431-9-35. [DOI] [PMC free article] [PubMed] [Google Scholar]
- Perez A (2017). Classifying relational permanence among young adults who exited foster care through legal permanence as adolescents. Families in Society the Journal of Contemporary Social Services, 98(3), 179–189. 10.1606/1044-3894.2017.98.31. [DOI] [Google Scholar]
- Perry BD (2014). Creative interventions with traumatized children. New York, NY: Guilford Press. [Google Scholar]
- Perry BD, & Szalavitz M (2017). The boy who was raised as a dog: And other stories from a child psychiatrist’s notebook—What traumatized children can teach us about loss, love, and healing. New York, NY: Basic Books. [Google Scholar]
- Prindle JJ, Hammond I, & Putnam-Hornstein E (2018). Prenatal substance exposure diagnosed at birth and infant involvement with child protective services. Child Abuse & Neglect, 76, 75–83. 10.1016/j.chiabu.2017.10.002. [DOI] [PubMed] [Google Scholar]
- Putnam-Hornstein E, & Shaw TV (2011). Foster care reunification: An exploration of non-linear hierarchical modeling. Children and Youth Services Review, 33, 705–714. 10.1016/j.childyouth.2011.11.010. [DOI] [Google Scholar]
- Schore AN (2016). Affect regulation and the origin of the self: The neurobiology of emotional development. New York, NY: Routledge. [Google Scholar]
- Shaw TV (2006). Reentry into the foster care system after reunification. Children and Youth Services Review, 28, 1375–1390. [Google Scholar]
- Sherry S (2010). When jail fails: Amending the ASFA to reduce its negative impact on children of incarcerated parents. Family Court Review: An Interdisciplinary Journal, 48(2), 380–397. 10.1111/j.1744-1617.2010.01316.x. [DOI] [Google Scholar]
- Silverstein DN, & Kaplan S (1982). Lifelong issues in adoption. Retrieved fromhttp://www.fairfamilies.org/2012/1999/99LifelongIssues.htm.
- Smith F (2017). Babies fall victim to the opioid crisis. September Retrieved fromNational Geographic www.nationalgeographic.com/magazine/2017/09/science-of-addiction-babies-opioids/. [Google Scholar]
- Statista (2019). Reported violent crime rate in the U.S. In 2016, by state(n.d.). Retrieved fromhttps://www.statista.com/statistics/200445/reported-violent-crime-rate-in-the-us-states/.
- Streff NL (2016). When systems collide…Collaboration experiences between child protection workers and substance abuse counselors. Retrieved fromSt. Cloud State University Dissertations, Culminating Projects in Social Work (10–2016). [Google Scholar]
- Substance Abuse and Mental Health Services Administration (SAMHSA) (2016). Child welfare and treatment statistics. Rockville, MD: U.S. Department of Health and Human Services, Substance Abuse and Mental Health Services Administration, Center for Substance Abuse Treatment. [Google Scholar]
- Substance Abuse and Mental Health Services Administration (SAMHSA) (2004). What is substance abuse treatment? A booklet for families. Rockville, MD: U.S. Department of Health and Human Services, Substance Abuse and Mental Health Services Administration, Center for Substance Abuse Treatment. [Google Scholar]
- Thompson BL, Levitt P, & Stanwood GD (2009). Prenatal exposure to drugs: Effects on brain development and implications for policy and education. Nature Reviews Neuroscience, 10(4), 303–312. 10.1038/nrn2598. [DOI] [PMC free article] [PubMed] [Google Scholar]
- U.S. Department of Health and Human Services [USDHHS] (2014). Report to congress on state child welfare expenditures Washington, DC: Children’s Bureau, Administration on Children, Youth, and Families, Administration for Children and Families, U.S. Department of Health and Human Service; s. [Google Scholar]
- U.S. Department of Health and Human Services [USDHHS] (2017). Adoption and foster care analysis and reporting system (AFCARS) annual file: User’s guide for fiscal years 2000 to present Washington, DC: U.S. Department of Health and Human Services, Children’s Bureau, Administration on Children, Youth and Families. [Google Scholar]
- Vig S, Chinitz S, & Shulman L (2005). Young children in foster care: Multiple vulnerabilities and complex service needs. Infants and Young Children, 18(2), 147–160. [Google Scholar]
- Wells M, & Correia M (2012). Reentry into out-of-home care: Implications of child welfare workers’ assessments of risk and safety. Social Work Research, 36(3), 181–195. [Google Scholar]
- Wildeman C, & Emanuel N (2014). Cumulative risks of foster care placement by age 18 for U.S. children, 2000–2011. PloS One, 9(3), e92785. 10.1371/journal.pone.0092785. [DOI] [PMC free article] [PubMed] [Google Scholar]
- Williams SC, & Devooght K (2017). 5 things to know about the opioid epidemic and its effect on children. June 2nd, Retrieved from Child Trends; https://www.childtrends.org/child-trends-5/5-things-know-opioid-epidemic-effect-children. [Google Scholar]
- Wolfinger RC, & O’Connell OM (1993). Generalized linear mixed models: A pseudo-likelihood approach. Journal of Statistical Computation and Simulation, 48(3–4), 233–243. 10.1080/00949659308811554. [DOI] [Google Scholar]
- Wulczyn F (2004). Family reunification in law, policy, and practice. The Future of Children, 14(1), 95–113. [PubMed] [Google Scholar]
- Wulczyn F, Hislop KB, & Harden BJ (2002). The placement of infants in foster care. Infant Mental Health Journal, 23(5), 454–475. [Google Scholar]
- Yampolskaya S, Armstrong MI, & King-Miller T (2011). Contextual and individual-level predictors of abused children’s reentry into out-of-home care: A multilevel mixture survival analysis. Child Abuse & Neglect, 35, 670–679. [DOI] [PubMed] [Google Scholar]
- Yampolskaya S, Armstrong MI, & Vargo AC (2007). Factors associated with exiting and reentry into out-of-home care under Community-Based Care in Florida. Children and Youth Services Review, 29, 1352–1367. [Google Scholar]