

Abstract
Preclinical in vitro and in vivo methods to study bacterial interactions with dermal fillers and infection pathogenesis are lacking. In this work, first in vitro methods to assess protein biofouling and effective pore size of commercial dermal fillers, including degradable hyaluronic acid (HA)-based fillers and other semi-degradable or permanent fillers (non-HA), were developed. The results were then related to Staphylococcus aureus (S. aureus) adhesion rates in vitro. HA fillers had less protein sorption than non-HA fillers and overall had smaller effective pore sizes. The properties correlated with levels of bacterial adhesion, where the control glass surface had the most rapid increase in bacterial cell adhesion, with a slope of 0.29 cm−2 min−1, three unique non-HA fillers had intermediate adhesion with slopes of 0.11 and 0.06 cm−2 min−1, and three unique HA fillers had the least adhesion with slopes of 0.02, 0.02, and 0.01 cm−2 min−1. S. aureus had greater motility on the HA fillers than on non-HA fillers. Next, a mouse model for dermal filler biofilm and infection was developed. Mice were inoculated with a controlled amount of bioluminescent bacteria (Xen36 S. aureus) and polyacrylamide hydrogels of different stiffness were injected. In vivo bioluminescence was monitored longitudinally for 35 days to ensure that lasting colonization was established. The inoculum was optimized to achieve adequate bioluminescent signal, and bacterial bioburden over time and inter-animal variability in bioburden were determined. These in vitro and in vivo approaches can be used for future studies of antimicrobial interventions for dermal fillers.
Keywords: animal model, bacterial colonization, biofouling, dermal filler, in vitro, in vivo, staphylococci
1 |. INTRODUCTION
Hyaluronic acid (HA)-based dermal filler injections are the second most popular nonsurgical cosmetic procedure (~0.8 million procedures in 2018) and their use to address contour defects due to aging, disease and trauma is increasing (e.g., HA acid injections are up 58% since 2014).1 As injectable implants, dermal fillers are subject to infection risk. Implant associated infections are difficult to eradicate because of the foreign body response which compromises normal immune function and allows for foreign materials to form a niche that can harbor biofilm. In the presence of a foreign material, the minimum infectious dose for bacteria is reduced by 100- to 10,000-fold, with as little as 10–100 bacteria able to elicit infection.2 While, in general, the infection rate associated with degradable dermal filler injections is low (0.04 to 0.2%),3 it increases with increased time after implantation, reaching up to 20% in immunocompromised patients.4 Some permanent dermal filler materials, for example, polyacrylamide hydrogels have a higher risk of infection and have subsequently been banned in many countries. An expert consensus to help reduce complications has recently been published.5
Biofilms are increasingly linked with common dermatological conditions, including dermal filler reactions.6 Dermal fillers are primarily contaminated by microbes from patients’ own skin flora7 during injection, and less often by hematogenous spreading from remote infections. Bacteria in dermal fillers form biofilm communities8–10 where they can acquire nutrients, share signals, and genetic information, and shield against harmful conditions such as the host immune system or antimicrobials. Due to the challenges of characterizing biofilm development on medical devices in the clinic, most of our current understanding is from explants of medical devices or early stage interactions through in vitro studies.11 The development of an in vivo model will help elucidate long-term infection pathogenesis and help assess promising approaches to reduce risk of infection. A search of “dermal filler” and “infection” yielded 101 publications in Web of Science on dermal filler infections (May 3, 2021), but no animal models were found. Further search of the keywords “hydrogel” and “infection” with “mouse model” yielded mostly studies on wound dressings but no animal models for injectable hydrogels. An animal infection model for injectable hydrogels would fulfill an important gap for dermal fillers, as well as other ultrasoft medical devices that are injected, such as drug delivery devices for cartilage and bone tissue engineering, cardiac tissue engineering, probiotic delivery, an urethral bulking injections.12
The purpose of this study was to investigate how dermal filler properties affect key biological interactions in vitro, and then use our findings to aid in development of a mouse model for dermal filler biofilm and infection. Biofouling refers to accumulation of biological materials on surfaces (e.g., protein and microorganisms). For medical devices, biofouling may impact the device performance and result in adverse events such as infection.13 Previous studies on protein–hydrogel interactions of medical devices have shown the importance of biofouling for bacterial interactions.14,15 It has also been found that elastic properties of dermal filler hydrogels may play a role in biofilm colonization when injected, due to lack of self-sealing.10 In this work, we first quantified interstitial fluid protein interactions with several dermal filler materials using spectroscopic detection of fluorescently labeled proteins, and then characterized the effective pore size of those materials using bead penetration. We studied the rate of adhesion of a common human pathogen, Staphylococcus aureus (S. aureus), to the fillers. Finally, we inoculated skin patches on mice with a controlled amount of bioluminescent bacteria (Xen36 S. aureus) and injected polyacrylamide hydrogel through the inoculated skin segments. In vivo bioluminescence was monitored longitudinally for 35 days to ensure that lasting colonization was established. The inoculum was optimized to achieve adequate bioluminescent signal, and then the bacterial bioburden over time and inter-animal bioburden variability were studied.
2 |. EXPERIMENTAL
2.1 |. Materials
2.1.1 |. Protein sorption
Phosphate buffered saline (PBS) (137 mM NaCl, 2.7 mM KCl, and 10 mM phosphate) was prepared from 10× stock solution purchased from VWR (Philadelphia, PA). Fibronectin (FN, lyophilized powder), bovine serum albumin (BSA, lyophilized powder), and Immunoglobulin G (IGG, lyophilized powder) were obtained from Sigma-Aldrich (St. Louis, MO). Fibrinogen (FIB, 10 mg/mL in 20 mM sodium citrate-HCL, PH 7.4) was purchased from Cell Sciences (Newburyport, MA). Hilyte Fluor 488 SE Protein Labeling Kit including desalting columns (MWCO: 6 k) was obtained from AnaSpec (Fremont, CA). HiLyte 488 SE (HiLyte) has similar spectra to that of fluorescein and forms stable carboxamide bonds in proteins via a succinimidyl ester with an extinction coefficient of 68,000 M−1 cm−1. It is similar to fluorescein isothiocyanate (FITC) but more resistant to photobleaching.16 Spin desalting columns (MWCO: 7k) and Slide-ALyzer Dialysis Cassettes (MWCO: 20k) were purchased from Thermo Scientific (Waltham, MA). Dialysis membrane (MWCO: 3.5k) was obtained from Spectrum Labs (Rancho Dominguez, CA). White, 96-well plates were purchased from Fisher Scientific (nonbinding, Pittsburgh, PA). Six dermal filler materials were tested, including three HA fillers (Belotero Balance, Juvederm Ultra, Juvederm Ultra Plus XC) and three non-HA fillers composed of polymer microparticles and carrier gels (Radiesse, ArteFill and Macroplastique). Silicone oil from Dow Corning Corporation (200® fluid, viscosity 60,000 cSt [25° C], Midland, MI) was used as control material. The FDA has not approved silicone oil for any aesthetic procedure including facial and body contouring or enhancement.17
2.1.2 |. Effective pore size evaluation
Fluorescent polystyrene microspheres were purchased from Phosphorex (Hopkinton, MA). The 1 μm beads (red) have excitation/emission maximums of 652/668 nm and the 10 μm beads (blue) have excitation/emission maximums of 337/392 nm.
2.1.3 |. Bacterial interaction with dermal fillers
Green fluorescent protein tagged Staphylococcus aureus (S. aureus) AH2547 were provided by Dr. Alexander Horswill.18 Microcentrifuge tube (2 mL, Eppendorf™, Hauppauge, NY). Tryptic Soy Broth (TSB, Remel, Thermo Scientific) petri dish (Falcon™, Corning, Tewksbury, MA). Agar plates (TSB with 5% sheep blood, Becton, Dickinson and Company). Blocks of nylon mesh (300 μm, Spectra Mesh®, Thomas Scientific, Swedeboro, NJ) #0 cover slip (Ted Pella Inc., Redding, CA). Flow chamber system (BioSurface Technologies Corp., Bozeman, MT).
3 |. METHODS
3.1 |. Quantifying protein sorption in fillers
3.1.1 |. Preparation of labeled protein solution
A simulated interstitial fluid (SIF) was prepared based on key components from published work,19 including the ions potassium (3.17 mmol/L), sodium (134.6 mmol/L), calcium (1.551 mmol/L), and magnesium (0.666 mmol/L). Protein solutions were prepared to contain one fluorescently labeled protein (BSA, FN, FIB, IGG) and the three other proteins in unlabeled form. This was achieved by preparing fluorescently labeled protein solutions and adding the appropriate mass of unlabeled protein to attain the desired concentrations for each protein. To prepare fluorescently labeled protein, the solid powder was dissolved at high concentrations near the limits of solubility in the SIF, and then reacted at a molar ratio of 12:1 with AnaTag™ HiLyte Fluor™ 488 dissolved in DMSO (14 mM) in darkness for 1 h with gentle shaking. Following conjugation, free fluorophore was removed with a desalting column. The final concentrations of labeled stock protein solutions after purification were: BSA (0.76 mg/mL), FN (0.4 mg/mL), FIB (0.6 mg/mL), and IGG (0.81 mg/mL).
3.1.2 |. Calibration
A calibration curve for the proteins in the dermal filler materials was obtained by adapting a previously described method for contact lens hydrogels.14 Briefly, a serial dilution of labeled stock protein solutions was prepared at several known concentrations in SIF (0.01×, 0.1×, 0.2×, 0.5×, and 1×). Next 5 μL of each calibrant was placed directly onto the surfaces of dermal filler materials (5 mg) and allowed to absorb into the samples until no visible droplet could be observed (20 min). At the end of this time, SIF (20 μL) was deposited over each sample to ensure uniform hydration. Native protein fluorescence (excitation: 290 ± 5 nm, emission: 335 ± 10 nm) and HiLyte fluorescence (excitation: 490 ± 5 nm, emission: 520 ± 10 nm) were then measured using a Tecan m1000 microplate reader. The linear response (y = mx + b) and detection limitations for the four proteins were determined.
3.1.3 |. Competitive protein sorption
Silicone oil (10 μL) and dermal filler samples (5 mg) were placed into a white 96-well microplate and incubated with 15 μL labeled protein soil solutions. For competitive sorption, the protein soil solution was prepared by adding concentrated stock unlabeled protein solution and/or appropriate mass of dry protein powder to the labeled protein solution. To mimic physiological conditions,20,21 an approximate protein concentration ratio was used as follows: FN/FIB/BSA/IGG = 1:10:10:10. For each solution one protein was labeled and the three remaining proteins were unlabeled. The final labeled protein concentrations in the protein mixture solution were: FN (0.04 mg/mL), FIB (0.3 mg/mL), BSA (0.4 mg/mL), and IGG (0.4 mg/mL). The plate was covered and incubated overnight (~18 h) in a humidity chamber at 37 °C. The samples were then rinsed 4× with SIF (40 μL). SIF (20 μL) was then deposited over each sample and fluorescence was measured.
3.2 |. Effective pore size evaluation
As shown in Figure 1, a silicone sheet (medical grade, −500 μm thickness) with 2 mm circular punches was placed on a glass cover slip (100 μm thickness), and ~3 mg of fillers were placed in each well by mimicking the injection through the needle from the product packaging. A section of silicone tube (15 mm length, 4 mm ID) was glued over each well. The tubes were filled with PBS to prevent fillers from drying. Beads (1%, 5 μL) were incubated in the wells and the fillers were monitored for particle penetration using confocal microscopy. Each filler material was tested three times and each time with four parallel samples on one cover slip. A confocal microscope (Leica Microsystems, SP8 Inverted, Wetzlar, Germany) was used to obtain the overlaid fluorescence and reflected light images (Figure 4A,D); confocal fluorescence images (Figure 4G,H); reflected light confocal images (Figure 4B,C); and widefield fluorescence images (Figure 4E,F).
FIGURE 1.

Schematic of the experimental setup to evaluate bead penetration
FIGURE 4.

Penetration of 1 and 10 μm fluorescent beads in different dermal fillers (bar denotes 50 μm). A confocal microscope (Leica Microsystems, SP8 Inverted, Wetzlar, Germany) was used to obtain the overlaid fluorescence and reflected light images (A,D); confocal fluorescence images (G,H); reflected light confocal images (B, C); and widefield fluorescence images (E,F)
3.3 |. Bacterial interaction with dermal fillers
3.3.1 |. Bacterial preparation
A colony of S. aureus was removed from the source agar plate using an inoculating loop. The colony was placed in a 2 mL microcentrifuge tube with 200 μL Tryptic Soy Broth and vortexed for 30 s. The solution (50 μL) was pipetted into a petri dish along with 20 mL of TSB and incubated at 37 °C for 16–18 h. Culture medium was then removed from the petri dish and rinsed with PBS three times. PBS (3 mL) was added to the washed dish and a cell scraper was used to remove the film of S. aureus from the bottom of the dish. The solution was pipetted into a 5 mL centrifuge tube and vortexed for 30 s, and followed by 5 min sonication. Using a syringe, the solution was pushed through a 5 mm filter to remove large clumps of S. aureus to get a single or double cell solution. The concentration was determined to be 109 cfu/mL by plating on agar plates. The solution was then resuspended to a concentration of 107 cfu/mL in PBS.
3.3.2 |. Insert fabrication
A two-layer polydimethylsiloxane (PDMS) insert was fabricated to hold the filler materials in a flow chamber during the investigation of bacterial interaction. As shown in Figure 2, several blocks of stickers (~200 μm) were placed on an empty petri dish. A PDMS monomer was spread over the surface of petri dish. After the PDMS became sticky, the stickers were peeled off, and blocks of nylon mesh were placed on top of the openings in the PDMS. The substrate was then cured for another 30 min at 150 °C. The PDMS-nylon mesh insert was then cut to fit a #0 cover slip. The insert was then adhered to the coverslip after oxygen plasma treatment.
FIGURE 2.

Fabrication of PDMS–nylon mesh insert for use in a flow chamber system
3.3.3 |. Bacterial adhesion
The PDMS–nylon mesh insert was placed into a flow chamber system to visualize the bacterial interactions with dermal fillers in situ. Time-lapse images were taken with confocal fluorescent microscopy (Figure 5, with 485 nm excitation/535 nm emission). The fillers were injected through the mesh openings and settled for 30 min to reach equilibrium. The S.aureus suspension was then perfused through the chamber (shear rate of 0.2 s−1) for around 200 min at room temperature. Bacterial deposition on glass surface was used as reference.
FIGURE 5.

Bacterial adhesion to dermal filler materials in a flow system (A) confocal images. Scales for glass and fillers are 200 μm × 200 μm (x × y, two-dimensional) and 200 μm × 200 μm × 200 μm (x × y × z, three-dimensional) respectively. (B) Quantification of the number of S. aureus adhering at filler material interface
3.4 |. In vivo model of bacterial colonization of a hydrogel dermal filler
To establish a soft tissue dermal filler infection, dermal filler was injected by fanning the needle through the inoculated skin three times. Based on a previously published skin infection model, we established the optimal inoculating dose of S. aureus Xen36 bioluminescent bacteria to be 5 × 10⁷ suspended in 2 μL saline.22 Nine mice were divided into two experimental groups: eight mice with dermal filler plus bacteria, and one sterile control mouse with dermal filler only.
3.4.1 |. Dermal filler preparation
Sterile gel discs (1.5 mL) in Falcon tubes were homogenized at high speed before being preloaded into sterile 27 G 1 mL syringes. Filler was transferred into the back of the syringes using 1 mL sterile pipet tips.
3.4.2 |. Skin inoculation and dermal filler injection procedure
Mice were anesthetized per protocol and a 1.5 cm square area overlying C7 (7th cervical vertebra) was shaved. Using two pairs of forceps and pinching the skin with the index finger and thumb distally, the skin of the shaved region of the neck was lifted to create a triangular pocket (~0.5 mm in depth). This was devised to keep the inoculum in place prior to injection of the dermal filler. Bacterial inoculum was pipetted onto the surface of the skin directly into the triangular pocket space. Using the syringe preloaded with 0.3 mL of homogenized PAAm-100-dermal filler (polyacrylamide filler with a high level of crosslinking, synthesized in our lab) each mouse was injected subcutaneously (driving the needle directly through the bacterial inoculum and fanning it back and forth three times). The skin was wiped using 70% alcohol wipes post injection to prevent the development of a superficial skin infection. Control mice underwent the exact same procedure with saline control instead of bacterial inoculum.
3.4.3 |. In vivo bioluminescence imaging
In order to quantify bacterial burden longitudinally, in vivo bioluminescence imaging was conducted using the Lumina II IVIS imaging System (Perkin Elmer, Waltham, MA). Measurements were taken on post operation days (POD) 1, 3, 5, 7, 10, 14, 18, 21, 25, 28, and 35 as previously described.23 On POD 35, mice were euthanized per protocol.
4 |. RESULTS
4.1 |. Protein sorption
Medical devices interact with body fluids immediately when implanted. Bacteria have adhesins and receptors specific for certain proteins and colonize materials differently when they are fouled by proteins.24,25 We studied biofouling of several proteins that are known to be bacterial adhesion targets: fibronectin (FN), fibrinogen (FIB), albumin (BSA), and immunoglobulin (IGG). To mimic the effect of competitive biofouling, we prepared four SIF solutions, each with three of the proteins in the unlabeled form and one in the fluorescently labeled form. This enabled measurement of a specific signal from a single protein in the presence of competitors. To maximize the response and stay within dynamic range of the method, we used concentrations that are below the physiological concentration, but maintained a similar ratio of concentrations of the four proteins that are found in interstitial fluid. The fluorescent signal after incubation and rinsing of fillers (Figure 3) was calibrated to determine the mass of each protein sorbed in the filler. The calibration process also enabled correction of response for autofluorescence and absorbance, which varied significantly between the different hydrogel materials due to translucence or particles. There was a tradeoff between maintaining a concentration in a similar range to the physiological concentration and maintaining the response in the linear dynamic range, resulting in a number of responses that were above the dynamic range. Responses above the dynamic range are indicated by dashed upward arrows on the bars. These values set a minimum for sorption and represent the maximum amount of protein that could be quantified in the linear range of the calibration. The upper bounds were as follows: FN (1.1 μg/mL), FIB (3.9 μg/mL), BSA (1.8 μg/mL), and IGG (2.7 μg/mL). Of all the materials, HA-2 had the least overall protein sorption with less than 2 μg/mL filler for all proteins. Silicone oil had the second lowest sorption, with less than 1 μg/mL for BSA and FN, but higher levels for FIB and IGG. The HA fillers had lower levels of FN and IGG sorption than the non-HA materials, with the exception of non-HA-1 which had extremely low levels of interaction with IGG. Non-HA-2 and non-HA-3 had the highest overall sorption of proteins.
FIGURE 3.

Competitive protein sorption on dermal fillers. The FDA has not approved silicone oil for any aesthetic procedure including facial and body contouring or enhancement.17 Error bars represent the standard deviation over three different filler samples. Responses above the dynamic range of the calibrated method are indicated by dashed upward arrows on the bars
4.2 |. Effective pore size evaluation
The competition between bacteria and immune cells is a research topic of great interest.26,27 To better understand how living bacterial and human immune cells might penetrate the fillers, we used 1 μm polystyrene microspheres beads with carboxyl functionalized surface groups as surrogates for bacteria (e.g., Staphylococci) and 10 μm beads as surrogates for macrophages (immune response). Since we did not measure the entire range of possible pore sizes, we termed this an “effective” pore size evaluation. In particular, we hypothesized that fillers penetrated by smaller particles like bacteria, but not easily penetrated by larger immune cells, might be more easily colonized and become infected. In previous work, it was found that injection of stiffer hydrogels could result in small cracks just wide enough for bacteria to grow sheets of biofilm, which would likely be difficult for macrophages to access.10
Within the testing time at 4 and 24 h (Table 1), the silicone oil control was the most easily penetrated by both bead sizes. Among the HA fillers, HA-1 was not penetrated by either bead size, while the HA-2 and HA-3 fillers were not penetrated at 4 h but were penetrated by both bead sizes at 24 h. For all three of the non-HA fillers, the 1 μm beads penetrated at 4 h, while the 10 μm beads were observed to have penetrated the gels by the 24 h timepoint. Microscopically, the penetration of microspheres (Figure 4) was observed to vary by time (Figure 4A,B), size (Figure 4C,D), locations in the filler (Figure 4E,F), and different filler materials (Figure 4G,H).
TABLE 1.
Fluorescent bead penetration in filler materials
| Control (silicone oil) | HA-1 | HA-2 | HA-3 | Non-HA-1 | Non-HA-2 | Nan-HA-3 | ||||||||
|---|---|---|---|---|---|---|---|---|---|---|---|---|---|---|
|
|
|
|
|
|
|
|
||||||||
| Fillers | 4 h | 24 h | 4 h | 24 h | 4 h | 24 h | 4 h | 24 h | 4 h | 24 h | 4 h | 24 h | 4 h | 24 h |
| 1 μm | + | + | − | − | − | + | − | + | + | + | + | + | + | + |
| 10 μm | + | + | − | − | − | + | − | + | − | + | − | + | − | + |
4.3 |. S. aureus interactions with dermal fillers
We used GFP-tagged S.aureus to visualize bacterial interaction with filler materials because Staphylococci bacteria have been isolated from many dermal filler infections.8,9 The setup for studying bacterial interactions with ultrasoft materials was previously reported10 and involves the use of a custom-fabricated PDMS insert in a commercially available flow cell. A suspension of S. aureus in PBS is injected into the flow cell with a syringe pump at a shear rate of 0.2 s−1 to simulate relatively slow perfusion of interstitial fluid in the dermal filler site. A confocal fluorescence microscope with long working distance objective is used to image three dimensional volumes of the hydrogel at different time points (Figure 5A). The images can be used to quantify the rate of cell adhesion over time (Figure 5B) which provides additional sensitivity to material-driven differences.10 All of the slopes were linear within the first 200 min of testing, suggesting that there was adequate surface area for bacteria to attach to without competition.
4.4 |. Mouse model development
To facilitate study of these dermal filler materials in vivo, we developed a mouse infection model using bioluminescent imaging. Because infection is more prevalent with permanent dermal fillers and polyacrylamide materials in particular,28 we chose a polyacrylamide filler (PAAm-100) with a high level of crosslinking, which we have previously found to have a high level of bacterial colonization in vitro.10 While softer filler materials can self-seal, the high degree of crosslinking in PAAm-100 may create discontinuities that provide a niche for bacterial colonization and growth. The results of the animal model are shown quantitatively in Figure 6A, and images are provided in Figure 6B.
FIGURE 6.
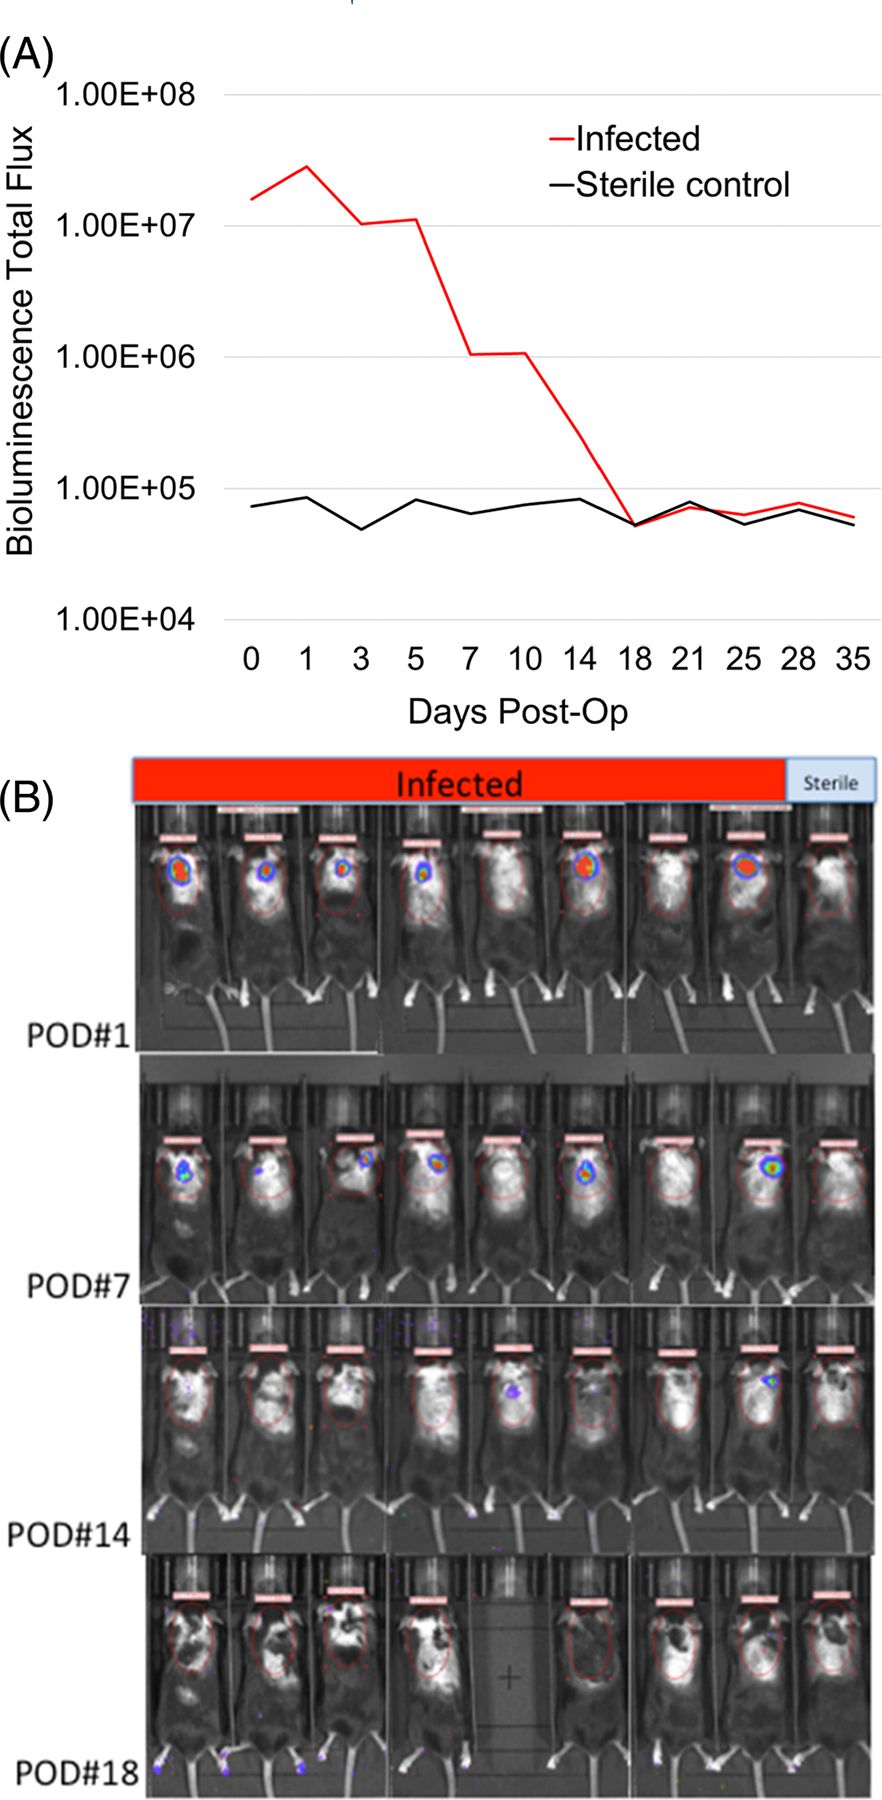
(A) Bioluminescence imaging data obtained in the initial postinjection period showed that mice in the treatment group had established a robust infection based on bioluminescence intensity when compared to the sterile control mouse. By postoperation day (POD) 5, the intensity of signal in the infected group began to subside and by POD 14, the signal had diminished to the same level as the sterile control, demonstrating that the immune system of the treated mice had contained the infection. (B) Selected bioluminescence images of mice on POD# 1, 7, 14, and 18 demonstrating initial robust signal in the treatment groups gradually diminishing and disappearing by POD# 18
5 |. DISCUSSION
5.1 |. Protein sorption
There is considerable interest in FN and FIB sorption in materials because extensive evidence has linked FN and FIB to bacterial colonization.25,29,30 FN sorption is less than sorption of other proteins because at physiologically relevant concentrations, FN is ~10-fold lower than the other three proteins.21 FIB is a very large protein (340 kDa) and therefore tends to have higher sorption than other proteins. FIB from buffer or simulated fluid had similar sorption to other proteins. It is also widely reported that FIB adsorption from more complex protein mixtures such as simulated plasma can be strongly dependent on the total protein concentrations.31 Compared to FN and FIB, no specific adhesins or receptors were reported to link BSA and IGG to bacterial colonization. Among the studies that discuss how these two proteins affect bacterial deposits onto surfaces, non-specific hydrophobic and steric interactions are noted. BSA is recognized as a model biofouling protein and preadsorption of BSA usually results in a reduction of bacterial adhesion.32 While IGG facilitates recognition and phagocytosis of neutrophils, it is reported to reduce bacterial adhesion to surfaces via both steric mechanisms and direct blockage of attachment factors.33
While adsorption is driven primarily by hydrophobic and electrostatic interactions, sorption can be impacted by diffusion. Diffusion in hydrogels can be related to rheological properties, where elastic modulus (G’) is used to quantitively measure gel stiffness and complex viscosity (Ƞ*) is used to measure the ability to resist shear force. Clinically, it is known that higher G’ is a predictor of better tissue-lifting and higher Ƞ* results in less spreading.34 Although dermal fillers usually have high water content (>95%), the steric hinderance of the hyaluronan network retards the diffusion of other molecules including proteins. Overall protein sorption in unmodified HA hydrogels is minimal, and higher G’ and Ƞ* are more restrictive of protein diffusion. This could explain why HA-3 has the lowest FN sorption since among the three HA fillers, G′HA-1 < G′HA-2 < G′HA-3 (ranging from around 39 to 135 Pa) and η*HA-1 < η*HA-2 < η*HA-3 (ranging from around 10,453 to 36,384 Cp).35 Overall, the three HA fillers have similar HA concentrations (22.5–24, mg/mL).34,35 HA fillers consist of homogeneous masses of cross-linked HA although the crosslinking within the bulk gels is generally nonuniform. Non-HA fillers are usually more slowly degraded and were developed to meet the increasing need for long lasting treatment. The polymeric particles in the carrier gels range from around 20 to 1000 μm.36 Non-HA filler materials usually have much larger G’ than HA fillers, and both the polymeric particles and the carrier gels are expected to absorb more protein.34
5.2 |. Effective pore size evaluation
Staphylococci bacteria penetration/translocation through bulk materials is observed to be governed by gravity with random motion patterns similar to microspheres.37 Therefore, differences in penetration of the fillers in vivo are likely to be influenced primarily by the filler material properties. HA fillers are temporary and usually last up to 1 year. In general, longer lasting HA materials are stiffer and thus more highly crosslinked. To make injection easier, some crosslinked HA fillers are pushed through a sized screen to make particles ranging from 20–1000 μm. Although HA-1 is sized, it was the only HA filler that did not have bead penetration. This suggests that the sizing process can produce a highly cohesive polydensified matrix and does not necessarily alter the effective porosity for cells to get inside the filler. The non-HA fillers are all fillers consisting of an easily degradable carrier gel and slow or non-degradable microparticles. The non-HA-1 is a semi-permanent filler that could last a few years in the tissue.28 The non-HA-2 and non-HA-3 consist of nondegradable particles. The particles in the non-HA fillers could vary roughly from 20 to 200 μm. One possible risk factor for the non-HA fillers could be penetration between 4 and 24 h where only smaller particles the size of bacteria could enter, creating a temporary niche for biofilm formation without the possibilty for immune clearance.
5.3 |. S. aureus interaction with dermal fillers
Glass had the most rapid increase in bacterial cell adhesion, with a slope of 0.29 cm−2 min−1. The non-HA materials non-HA-3 (0.11 cm−2 min−1) and non-HA-2 (0.06 cm−2 min−1) had an intermediate slope. The other three materials, HA-1 (0.02 cm−2 min−1), HA-2 (0.02 cm−2 min−1), and HA-3 (0.01 cm−2 min−1) had much lower slopes. We also observed that bacteria attached to the non-HA-2 and non-HA-3 materials had less movement than those attached to HA, suggesting that they had stronger adhesion to these materials in the first few hours of colonization. This may be related to the viscoelastic properties of HA. The high water content HA gels swell significantly, making it more difficult for bacteria to attach to the surface. The HA materials are very hydrophilic in general and may not promote as much protein or bacterial biofouling. Unexpectedly, the slope of non-HA-1 was the lowest (~0) despite the fact that non-HA-1 did not have particularly low protein sorption of key binding proteins. This may be due to optical interference by the dense paste of carrier particles for this material. It is also possible that the shear stress generated enough force to make bacteria slide or slip off from the non-HA-1 surface.
5.4 |. Overall in vitro results analysis
The HA materials not only had lower protein sorption in general, but also had the least amount of bead penetration at 4 h. As discussed in Section 1, diffusion into the gels contributes significantly to the amount of protein sorption. Therefore, it is reasonable that the materials with the least amount of diffusion of proteins would also have less penetration of much larger 1 and 10 μm beads. Likewise, the materials with the greatest amount of overall protein sorption (non-HA) also had penetration of 1 μm beads at 4 h. Diffusion of larger 10 μm beads may have been slowed by surface tension forces or electrostatic interactions, but did eventually take place by 24 h. The only contradiction to this overall trend was the silicone oil control, which had lower levels of protein sorption but had the most bead penetration. This may be due to the fact that the silicone oil is a viscous fluid which allows for large objects to penetrate and become entrapped, whereas proteins in aqueous solution may not mix efficiently without mechanical stimulus.
The same properties that allowed for increased protein sorption and bead penetration in non-HA materials likely also played a role in the increased bacterial adhesion rates observed for non-HA-3 and non-HA-2 when compared with the HA materials. However, non-HA-1 was an exception to this trend, having the least bacterial adhesion of any material in the study. This could be due to the unique composition of non-HA-1, a particulate filler in a sterile carrier gel. Some of the components of the carrier gel listed on the label (e.g., glycerin and carboxymethyl cellulose) are known to inhibit bacteria. The significantly higher adhesion rates for glass were due to the fact that it is a solid material whereas all of the dermal filler materials tested were highly hydrated gels. While the particulates inside some of the non-HA gels are solids, the fraction percent of the surface area (where bacteria interact with the carrier gel) composed of these particulates is small.
In summary, the combination of these three in vitro tests is able to provide both overall trends and also pinpoint material-specific exceptions to expected trends. No one test alone could be used to predict the outcomes of the other two. The results show that when interpreting the results of these tests, it is essential to consider the material composition including the viscosity, the hydrophobicity, and the type of intermolecular interactions (e.g., crosslinking vs. electrostatic or van der Waals forces). There can be significant differences among even the same type of material such as HA, depending on the unique formulation and crosslinking density. For particulate fillers with carrier gels, the carrier gel is not simply a passive component that can be neglected with regard to overall performance, but plays an important role in protein sorption, bacterial adhesion and penetration.
5.5 |. Mouse model development
Although we compared a number of different hydrogel materials to develop the in vitro test methods, we sought to minimize use of animals for the in vivo test method development by using a worst-case material. Previous in vitro studies of bacterial interactions with polyacrylamide hydrogels (PAAm) showed that those in the stiffest range of elasticity (PAAm-100) are susceptible to discontinuities which result in pockets of bacterial biofilm.10 Polyacrylamide formulations from products marketed outside of the United States have been used in aesthetic plastic and reconstructive procedures. There have concerns on the use of PAAm formulations due to their long-term stability and the potential for infections with serious consequences.9,38 In this work, initial experiments with a single injection and lower bacterial inoculum were unable to establish a sustained infection in the mice. However, an inoculum of 5×10⁷ and fanning injections (found to increase the risk of skin translocation39) were found to establish a sustained infection based on bioluminescence data tracked over 35 days (Figure 5A). The bioluminescence did eventually decrease to that of the sterile control around day 18, suggesting that the mouse immune system was able to contain the infection. While it is possible that bioluminescence produced by these colonies may decrease over time, previous studies have shown a measurable difference in bioluminescence of Xen36 S. aureus in active infection groups relative to sterile control groups up to at least 56 days after surgery and inoculation.40 Since those experiments showed stability out to 56 days, it is more likely that the decrease in bioluminescence seen here on day 18 is due to control of the infection rather than a reduction in bioluminescence production. Additionally, there were no wound complications or abscess formations that could have complicated interpretation of these results. The absence of luminescence does not rule out the possibility that some dormant biofilm bacteria (which are metabolically less active and may produce little or no bioluminescence) may remain in the fillers. Bioluminescence images from treated and sterile control mice on PODs 1, 7, 14, and 18 are shown in Figure 5B. Total flux bioluminescence was calculated for each mouse using a standardized region of interest (ROI), defined by the red ellipse. The initial robust bioluminescent signal seen in the infected group on POD1 gradually diminished and disappeared by POD18. Further investigation of this model might study how such an infection progresses in vivo at longer time periods (2–6 months).
6 |. CONCLUSIONS
The differences in material properties of commercially available dermal fillers resulted in significant variability in how they interacted with biological molecules and cells. As expected, more hydrophilic materials such as HA have less overall protein sorption and also have the least amount of bacterial adhesion in general when compared with non-HA materials. Penetration by microspheres at the size scale of bacteria and macrophage also differed between materials. In most cases, both the 1 μm and 10 μm spheres penetrated the gels by 24 h. However, non-HA fillers allowed penetration of 1 μm spheres at 4 h, which could provide a niche for bacterial colonization. Future work might focus on how macrophages interact with the materials to determine if behavior such as macrophage frustration occurs due to differences in biocompatibility, and if the macrophages are capable of entering the hydrogel matrices to clear bacteria that have sorbed in the fillers.
It was also demonstrated that a mouse model can be used to initiate and sustain significant levels of bacterial bioluminescence associated with colonized dermal fillers for up to 2 weeks before containment by the animals’ immune system. This model can be used to further study how the material properties of dermal fillers studied here relate to the risk for infection in vivo, as well as how potential interventions—such as improved aseptic skin preparation, probiotics or antimicrobial materials—can be used as prophylaxis. In addition to measuring bioluminescence over time, confocal fluorescence, SEM, colony forming unit (CFU) quantitative analysis, and histopathology of the fillers and surrounding tissues at various timepoints could be used to study the presence of biofilm and other biological molecules (such as inflammatory markers and immune cells).
ACKNOWLEDGMENT
This work was supported by the FDA Office of Women’s Health.
Funding information
FDA Office of Women’s Health
Footnotes
CONFLICT OF INTEREST
The mention of commercial products, their sources, or their use in connection with material reported herein is not to be construed as either an actual or implied endorsement of such products by the Department of Health and Human Services. The findings and conclusions in this article have not been formally disseminated by the US Food and Drug Administration and should not be construed to represent any agency determination or policy.
DATA AVAILABILITY STATEMENT
The data that support the findings of this study are available from the corresponding author upon reasonable request.
REFERENCES
- 1.ASAPS. 2019. Cosmetic (Aesthetic) Surgery National Data Bank Statistics 2018, American Society of Plastic Surgeons. https://www.surgery.org/sites/default/files/ASAPS-Stats2018_0.pdf. [DOI] [PubMed] [Google Scholar]
- 2.Moriarty TF, Grainger DW, Richards RG. Challenges in linking preclinical anti-microbial research strategies with clinical outcomes for device-associated infections. Eur Cell Mater. 2014;28:112–128. discussion 28. [DOI] [PubMed] [Google Scholar]
- 3.Ferneini EM, Beauvais D, Aronin SI. An overview of infections associated with soft tissue facial fillers: identification, prevention, and treatment. J Oral Maxillofac Surg. 2017;75:160–166. [DOI] [PubMed] [Google Scholar]
- 4.Nadarajah JT, Collins M, Raboud J, et al. Infectious complications of bio-Alcamid filler used for HIV-related facial lipoatrophy. Clin Infect Dis. 2012;55:1568–1574. [DOI] [PubMed] [Google Scholar]
- 5.Blanco Souza TA, Colome LM, Bender EA, Lemperle G. Brazilian consensus recommendation on the use of Polymethylmethacrylate filler in facial and corporal aesthetics. Aesthetic Plast Surg. 2018;42:1244–1251. [DOI] [PubMed] [Google Scholar]
- 6.Bachour Y, Kadouch JA, Niessen FB. The Aetiopathogenesis of late inflammatory reactions (LIRs) after soft tissue filler use: a systematic review of the literature. Aesthetic Plast Surg. 2021;45:1748–1759. [DOI] [PMC free article] [PubMed] [Google Scholar]
- 7.Netsvyetayeva I, Marusza W, Olszanski R, et al. Skin bacterial flora as a potential risk factor predisposing to late bacterial infection after cross-linked hyaluronic acid gel augmentation. Infect Drug Resist. 2018;11:213–222. [DOI] [PMC free article] [PubMed] [Google Scholar]
- 8.Alhede M, Er O, Eickhardt S, et al. Bacterial biofilm formation and treatment in soft tissue fillers. Pathog Dis. 2014;70:339–346. [DOI] [PubMed] [Google Scholar]
- 9.Christensen L, Breiting V, Bjarnsholt T, et al. Bacterial infection as a likely cause of adverse reactions to polyacrylamide hydrogel fillers in cosmetic surgery. Clin Infect Dis. 2013;56:1438–1444. [DOI] [PubMed] [Google Scholar]
- 10.Wang Y, Guan A, Isayeva I, et al. Interactions of Staphylococcus aureus with ultrasoft hydrogel biomaterials. Biomaterials. 2016;95:74–85. [DOI] [PubMed] [Google Scholar]
- 11.Vertes A, Hitchins V, Phillips KS. Analytical challenges of microbial biofilms on medical devices. Anal Chem. 2012;84:3858–3866. [DOI] [PubMed] [Google Scholar]
- 12.Mellati A, Akhtari J. Injectable Hydrogels: A Review of Injectability Mechanisms and Biomedical Applications. Research in Molecular Medicine; 2018:6. [Google Scholar]
- 13.Harding JL, Reynolds MM. Combating medical device fouling. Trends Biotechnol. 2014;32:140–146. [DOI] [PubMed] [Google Scholar]
- 14.Guan A, Li Z, Phillips KS. The effect of fluorescent labels on protein sorption in polymer hydrogels. J Fluoresc. 2014;24:1639–1650. [DOI] [PubMed] [Google Scholar]
- 15.Tworkoski E, Dorris E, Shin D, Scott Phillips K. A high-throughput method for testing biofouling and cleaning of polymer hydrogel materials used in medical devices. Anal Methods. 2014;6:4521–4529. [Google Scholar]
- 16.HiLyte™ Fluor 488 acid, SE. https://www.anaspec.com/products/product.asp?id=28843.
- 17.US Food and Drug Administration, FDA. 2020. Dermal Fillers (Soft Tissue Fillers). https://www.fda.gov/medical-devices/aesthetic-cosmetic-devices/dermal-fillers-soft-tissue-fillers.
- 18.Pang YY, Schwartz J, Thoendel M, Ackermann LW, Horswill AR, Nauseef WM. Agr-dependent interactions of Staphylococcus aureus USA300 with human polymorphonuclear neutrophils. J Innate Immun. 2010;2:546–559. [DOI] [PMC free article] [PubMed] [Google Scholar]
- 19.Fogh-Andersen N, Altura BM, Altura BT, Siggaard-Andersen O. Composition of interstitial fluid. Clin Chem. 1995;41:1522–1525. [PubMed] [Google Scholar]
- 20.Barbosa LR, Ortore MG, Spinozzi F, Mariani P, Bernstorff S, Itri R. The importance of protein-protein interactions on the pH-induced conformational changes of bovine serum albumin: a small-angle X-ray scattering study. Biophys J. 2010;98:147–157. [DOI] [PMC free article] [PubMed] [Google Scholar]
- 21.Mosher DF. Physiology of fibronectin. Annu Rev Med. 1984;35:561–575. [DOI] [PubMed] [Google Scholar]
- 22.Romero Pastrana F, Thompson JM, Heuker M, et al. Noninvasive optical and nuclear imaging of staphylococcus-specific infection with a human monoclonal antibody-based probe. Virulence. 2018;9:262–272. [DOI] [PMC free article] [PubMed] [Google Scholar]
- 23.Bernthal NM, Stavrakis AI, Billi F, et al. A mouse model of post-arthroplasty Staphylococcus aureus joint infection to evaluate in vivo the efficacy of antimicrobial implant coatings. PLoS One. 2010;5:e12580. [DOI] [PMC free article] [PubMed] [Google Scholar]
- 24.Joo HS, Otto M. Molecular basis of in vivo biofilm formation by bacterial pathogens. Chem Biol. 2012;19:1503–1513. [DOI] [PMC free article] [PubMed] [Google Scholar]
- 25.Lower SK, Lamlertthon S, Casillas-Ituarte NN, et al. Polymorphisms in fibronectin binding protein a of Staphylococcus aureus are associated with infection of cardiovascular devices. Proc Natl Acad Sci U S A. 2011;108:18372–18377. [DOI] [PMC free article] [PubMed] [Google Scholar]
- 26.Busscher HJ, van der Mei HC, Subbiahdoss G, et al. Biomaterial-associated infection: locating the finish line in the race for the surface. Sci Transl Med. 2012;4:153rv10. [DOI] [PubMed] [Google Scholar]
- 27.da Silva JF, Domingues SR, Wang Y, et al. Macrophage phagocytic activity toward adhering staphylococci on cationic and patterned hydrogel coatings versus common biomaterials. Acta Biomater. 2015; 18:1–8. [DOI] [PubMed] [Google Scholar]
- 28.Haneke E. Managing complications of fillers: rare and not-so-rare. J Cutan Aesthet Surg. 2015;8:198–210. [DOI] [PMC free article] [PubMed] [Google Scholar]
- 29.Cho SH, Strickland I, Boguniewicz M, Leung DY. Fibronectin and fibrinogen contribute to the enhanced binding of Staphylococcus aureus to atopic skin. J Allergy Clin Immunol. 2001;108:269–274. [DOI] [PubMed] [Google Scholar]
- 30.Herman-Bausier P, Labate C, Towell AM, Derclaye S, Geoghegan JA, Dufrene YF. Staphylococcus aureus clumping factor a is a force-sensitive molecular switch that activates bacterial adhesion. Proc Natl Acad Sci U S A. 2018;115:5564–5569. [DOI] [PMC free article] [PubMed] [Google Scholar]
- 31.Horbett TA. Mass action effects on competitive adsorption of fibrinogen from hemoglobin solutions and from plasma. Thromb Haemost. 1984;51:174–181. [PubMed] [Google Scholar]
- 32.Bulard E, Fontaine-Aupart MP, Dubost H, et al. Competition of bovine serum albumin adsorption and bacterial adhesion onto surface-grafted ODT: in situ study by vibrational SFG and fluorescence confocal microscopy. Langmuir. 2012;28:17001–17010. [DOI] [PubMed] [Google Scholar]
- 33.Hemming VG. Use of intravenous immunoglobulins for prophylaxis or treatment of infectious diseases. Clin Diagn Lab Immunol. 2001;8:859–863. [DOI] [PMC free article] [PubMed] [Google Scholar]
- 34.Sundaram H, Voigts B, Beer K, Meland M. Comparison of the rheological properties of viscosity and elasticity in two categories of soft tissue fillers: calcium hydroxylapatite and hyaluronic acid. Dermatol Surg. 2010;36(Suppl 3):1859–1865. [DOI] [PubMed] [Google Scholar]
- 35.Sundaram H, Cassuto D. Biophysical characteristics of hyaluronic acid soft-tissue fillers and their relevance to aesthetic applications. Plast Reconstr Surg. 2013;132:5S–21S. [DOI] [PubMed] [Google Scholar]
- 36.Lemperle G. Biocompatibility of injectable Microspheres, journal of Scientific & Technical. Research. 2018;2:2296–2306. [Google Scholar]
- 37.Samad T, Billings N, Birjiniuk A, Crouzier T, Doyle PS, Ribbeck K. Swimming bacteria promote dispersal of non-motile staphylococcal species. ISME J. 2017;11:1933–1937. [DOI] [PMC free article] [PubMed] [Google Scholar]
- 38.Manafi A, Emami AH, Pooli AH, Habibi M, Saidian L. Unacceptable results with an accepted soft tissue filler: polyacrylamide hydrogel. Aesthetic Plast Surg. 2010;34:413–422. [DOI] [PubMed] [Google Scholar]
- 39.Wang Y, Leng V, Viraj Patel K, Phillips S. Injections through skin colonized with Staphylococcus aureus biofilm introduce contamination despite standard antimicrobial preparation procedures. Sci Rep. 2017; 7:45070. [DOI] [PMC free article] [PubMed] [Google Scholar]
- 40.Zoller SD, Hegde V, Burke ZDC, et al. Evading the host response: staphylococcus “hiding” in cortical bone canalicular system causes increased bacterial burden. Bone Res. 2020;8:43. [DOI] [PMC free article] [PubMed] [Google Scholar]
Associated Data
This section collects any data citations, data availability statements, or supplementary materials included in this article.
Data Availability Statement
The data that support the findings of this study are available from the corresponding author upon reasonable request.