

Abstract
Background:
Previous studies indicate that the benefit of short-term androgen deprivation therapy (ADT) with radiotherapy (RT) for prostate cancer depends on competing risks.
Objective:
To determine whether a quantitative method to stratify patients by risk for competing events (omega score) could identify subgroups that selectively benefit from ADT.
Design, setting, and participants:
An ancillary analysis of NRG/RTOG 9408 phase 3 trial (NCT00002597) involving 1945 prostate cancer patients was conducted.
Intervention:
Short-term ADT.
Outcome measurements and statistical analysis:
We applied generalised competing event regression models incorporating age, performance status, comorbidity, T category, Gleason score (GS), and prostate-specific antigen (PSA), to stratify patients according to relative hazards for primary cancer-related events (distant metastasis or prostate cancer death) versus competing noncancer mortality. We tested interactions between ADT and subgroups defined by standard risk criteria versus relative risk (RR) using the omega score.
Results and limitations:
T2b, higher GS, and higher PSA were associated with an increased RR for cancer-related versus competing mortality events (a higher omega score); increased age and comorbidity were associated with a decreased omega score. Of 996 patients with low-risk/favourable intermediate-risk (FIR) disease, 286 (28.7%) had a high omega score (≥0.314). Of 768 patients with unfavourable intermediate-risk disease, 175 (22.8%) had a low omega score. The overall discordance in risk classification was 26.1%. Both standard criteria and omega score identified significant interactions for the effect of ADT on cancer-related events and late mortality in low- versus high-risk subgroups. Within the low-risk/FIR subgroup, a higher omega score identified patients in whom ADT significantly reduced cancer events and improved event-free survival. Limitations are the need for external/prospective validation and lower RT doses than contemporary standards.
Conclusions:
Stratification based on competing event risk is useful for identifying prostate cancer patients who selectively benefit from ADT.
Patient summary:
We analysed the effectiveness of androgen deprivation therapy (ADT) for localised prostate cancer among patients, defined by the relative risk (RR) for cancer versus noncancer events. Among patients with traditional low-risk/favourable intermediate-risk disease, those with a higher RR benefitted from short-term ADT.
Keywords: Prostate cancer, Hormone therapy, Short-term androgen deprivation therapy, Risk stratification, Generalised competing event model
1. Introduction
The management of localised prostate cancer presents unique challenges, due to patients’ varying risk for competing events [1]. In particular, the benefit of more intensive prostate cancer treatment is expected to diminish in older patients with competing medical conditions. Some patients can effectively be managed with radiotherapy (RT) alone, due to their lower risk of cancer progression and mortality, attributable to disease indolence, competing health risks, or both [2-4]. Other patients are at risk of developing distant metastasis, with reduced survival duration and quality of life, and benefit from the addition of androgen deprivation therapy (ADT) [5-7].
For patients with intermediate-risk disease, short-term ADT is frequently recommended, based on findings from several randomised trials [1,5-7]. However, the best method to identify patients with intermediate-risk disease most likely to benefit from ADT remains controversial [8,9]. A problem with conventional risk-stratification approaches is that patients with an identical survival (or recurrence) prognosis may have differing risks for competing events and thus a different propensity to benefit from cancer therapy. In particular, patients at a high risk for competing noncancer health events, whether such events are due to comorbid diseases or directly caused by ADT, would be expected to benefit less from ADT for the same set of cancer-related risk factors [1,10]. Current guidelines recommend taking life expectancy into account in estimating the benefit of ADT [11], but it is unclear how this information should be weighed in the context of patients’ cancer risk factors. Consequently, clinicians in practice often rely on subjective interpretation of risk to gauge the relative importance of competing events [12].
An alternative, direct method would be to quantify the risk ratio for cancer events versus competing mortality events, using evidence from population-based studies and clinical trials. This ratio varies significantly among prostate cancer patients [13] and is directly related to the expected benefit of a cancer therapy [14]. Risk-stratification schemes based on this ratio are thus likely to be useful for determining which patients are likely to benefit from additional therapy [15]. Generalised competing event (GCE) modelling is a novel approach that has been used in various competing risk populations to optimise risk stratification, by quantifying the effects of risk factors on the relative hazard for primary (cancer-related) versus competing events [13,16,17]. Patients with intermediate-risk prostate cancer represent an ideal population to apply this approach, due to variation in prognostic factors for competing events.
The phase 3 NRG/RTOG 9408 randomised controlled trial previously reported that ADT increased overall survival (OS) and decreased disease-specific mortality, biochemical failure, and distant metastases in men with localised prostate cancer [6,18,19]. We sought to determine whether alternative risk-stratification methods would be useful in identifying patients most likely to benefit from ADT, using findings from this trial.
2. Patients and methods
There were 2028 patients registered and randomised to the NRG/RTOG 9408 trial (NCT00002597); details were published previously [6]. Patients with histologically confirmed prostate adenocarcinoma, stages T1b-T2b (1992 American Joint Committee on Cancer classification), and serum prostate-specific antigen (PSA) level ≤20 ng/ml were eligible. After stratification, patients were randomised to RT (66.6 Gy) alone or with ADT (flutamide 250 mg orally three times a day, and either monthly subcutaneous goserelin [3.6 mg] or intramuscular leuprolide [7.5 mg] for 4 mo, with RT starting 2 mo after the initiation of ADT). The study was conducted according to ethical guidelines and approved by the institutional review boards at all institutions. Written informed consent was obtained for all patients. There were 1974 eligible and analysable patients (Supplementary Fig. 1). We excluded 29 patients with missing Gleason score (GS) and Karnofsky performance status (KPS), resulting in 1945 patients for this analysis.
OS time was defined as the time from randomisation to death from any cause. Time to a primary (cancer-related) event was defined as the time from randomisation to the first occurrence of distant metastasis or death from prostate cancer. Time to competing mortality was defined as the time from randomisation to death from any cause in the absence of a cancer-related event. Event-free survival (EFS) time was defined as the time from randomisation to either cancer-related or competing mortality event. Event times were censored at the last follow-up for patients without an event.
The study followed the TRIPOD and PATH guidelines [20,21]. For standard risk stratification, “low risk” was defined as GS ≤6 and PSA ≤10 ng/ml and ≤T2a; “favourable intermediate risk (FIR)” was defined as having one intermediate risk factor (GS 3 + 4 or T2b or PSA 10–20 ng/ml) and <50% of biopsy cores containing cancer; “unfavourable intermediate risk (UIR)” was defined as having more than one intermediate risk factor or GS 4 + 3 or ≥50% of biopsy cores containing cancer; and “high risk” was defined as GS ≥8 [22]. Patients with any Gleason 5 component and GS <8 were categorised as having a UIR.
For the alternative approach, we used GCE modelling to create groups stratified by the relative risk for cancer-related events versus competing mortality (omega score). This model is described in detail elsewhere [17,23,24]; briefly, it entails fitting multivariable Cox proportional hazard models for both cancer-related and competing mortality events, and netting the resulting parameter vectors to estimate the effects of covariates on the baseline relative hazard for cancer-related versus competing mortality (Supplementary material). Another way to describe the approach is that instead of estimating the effects of covariates on the sum of the cancer-related event and competing mortality baseline cause-specific hazards (ie, EFS), the GCE model estimates the effects on the ratio of these hazards, which are quantified as a relative hazard ratio (rHR). In theory, patients with higher omega scores would have a higher propensity to benefit from additional cancer treatments, such as ADT. For comparison with standard risk categories, omega score cut-offs were selected to match the number of patients in standard risk groups.
Kaplan-Meier and cumulative incidence functions were used to plot OS, EFS, and competing events according to the standard risk or relative risk group, and treatment. The basehaz function (R version 3.6.4; R Foundation for Statistical Computing, Vienna, Austria) was used to estimate cumulative hazards. Fine-Gray regression was used to test differences in cumulative incidences (subdistribution hazards). Proportional hazard assumptions were tested using the Grambsch-Therneau method (cox.zph function); this assumption held for cancer-related events but not for OS, EFS, or competing mortality. For nonproportional hazards, time-dependent models were used [19], with effect estimates stratified by time period before versus after 10 yr (R survSplit function). The 10-yr cut-off was determined from the largest log (partial) likelihood of the Cox model [25]. Categorical differences were compared using Fisher’s exact tests. Means were compared using two-sample t tests. All p values are two sided.
3. Results
Sample characteristics have been described previously [6] and are summarised in Supplementary Table 1. Table 1 shows the effects of key covariates on the baseline hazard for cancer-related events, competing mortality events, EFS, and relative event hazards. Decreasing age, diabetes, T2b, increasing GS, and increasing PSA were associated with a significantly higher risk of cancer-related events, whereas increasing age, KPS ≤80, and comorbidities were associated with a significantly higher risk of competing mortality.
Table 1 –
Effects of risk factors on the baseline risk for competing events
| Characteristic | Outcome | |||
|---|---|---|---|---|
| Cancer-related event (metastasis or cancer death) HR a (95% CI) |
Competing mortality HR a (95% CI) |
Event-free survival (cancer event or competing mortality) HR a (95% CI) |
Ratio of cancer event to competing mortality rHR a (95% CI) |
|
| Age | ||||
| Age, per yr | 1.01 (0.97, 1.06) | 1.06 (1.03, 1.09) | 1.05 (1.02, 1.07) | 0.95 (0.90, 0.99) |
| Age (ns) b | 0.86 (0.63, 1.19) | 0.87 (0.72, 1.05) | 0.85 (0.72, 1.01) | 0.98 (0.68, 1.43) |
| Age (ns) c | 0.73 (0.63, 0.85) | 0.86 (0.76, 0.98) | 0.80 (0.73, 0.88) | 0.85 (0.70, 1.04) |
| KPS | ||||
| 70–80 | – | 1.90 (1.36, 2.64) | 1.75 (1.32, 2.31) | – |
| 90–100 | – | Reference | Reference | – |
| Comorbidity | ||||
| Any | – | 1.63 (1.27, 2.10) | 1.31 (1.07, 1.60) | 0.51 (0.35, 0.74) |
| Cardiovascular | – | 1.24 (1.01, 1.53) | 1.19 (1.01, 1.42) | – |
| Diabetes | 1.51 (1.06, 2.16) | 1.57 (1.24, 1.98) | 1.59 (1.30, 1.94) | – |
| Hypertension | – | – | – | – |
| Cumulative (no.) | – | – | – | – |
| T category | ||||
| T1–2a | Reference | – | – | – |
| T2b | 1.46 (1.08, 1.98) | – | – | 1.50 (1.02, 2.21) |
| Gleason score | ||||
| ≤6 | Reference | – | Reference | Reference |
| 3 + 4 | 1.64 (1.17, 2.29) | – | 1.33 (1.10, 1.61) | 1.36 (0.90, 2.04) |
| 4 + 3 | 1.94 (1.26, 2.97) | – | 1.26 (0.96, 1.64) | 1.97 (1.14, 3.40) |
| ≥8 | 2.16 (1.44, 3.25) | – | 1.19 (0.92, 1.54) | 2.50 (1.47, 4.25) |
| PSA, per ng/ml | 1.08 (1.05, 1.12) | – | 1.04 (1.02, 1.06) | 1.06 (1.02, 1.10) |
| ≥50% positive cores | – | – | – | – |
CI = confidence interval; HR = hazard ratio; ns = natural splines; KPS = Karnofsky performance status; PSA = prostate-specific antigen; rHR = relative hazard ratio.
Values in bold are statistically significant (p < 0.05).
Adjusted hazard ratio estimates are presented.
Second basis vector (normalised).
When considering effects of covariates on the relative hazard for cancer-related events versus competing mortality, increasing age (normalised rHR: 0.76 [95% confidence interval {CI}: 0.64–0.91]) and any comorbidity (rHR: 0.75 [95% CI: 0.63–0.88]) were associated with significantly lower relative hazard, while T2b (rHR: 1.19 [95% CI: 1.02–1.38]), GS 4 + 3 (rHR: 1.18 [95% CI: 1.01–1.38]), GS ≥8 (rHR: 1.28 [95% CI: 1.10–1.48]), and increasing PSA (rHR: 1.28 [95% CI: 1.09–1.51]) were associated with significantly higher relative hazard (Table 1). Increasing omega scores were associated with a higher baseline relative risk for cancer-related events versus competing mortality overall, and among low-risk/FIR and UIR/high-risk subsets (Fig. 1). Age, KPS, cardiovascular disease, diabetes, any comorbidity, T2b, GS, and PSA were retained in the final regression model used to create the omega score, which was validated in the test cohort (Supplementary Table 2 and Supplementary Fig. 2).
Fig. 1 –
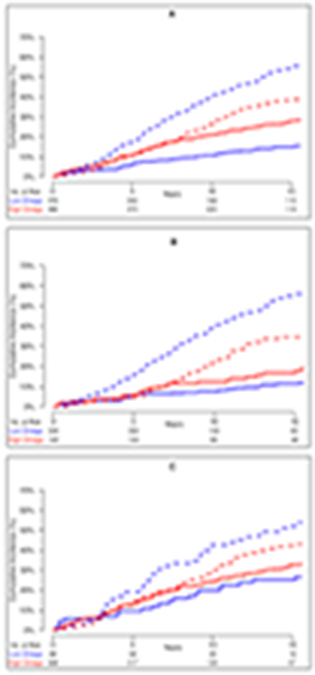
Comparison of baseline cumulative incidences of cancer-related events (metastasis or cancer death) versus competing mortality for patient groups defined by omega score in the RT-alone arm: (A) all controls, (B) low risk or favourable intermediate risk, and (C) unfavourable intermediate or high risk. Solid lines represent cancer-related events and dashed lines represent competing mortality. Blue indicates low omega score (<0.314) and red indicates high omega score (≥0.314).
RT = radiotherapy.
Overall, 687 (35.3%), 309 (15.9%), 583 (30.0%), and 185 (9.5%) patients were classified into standard low-risk, FIR, UIR, and high-risk groups, respectively. An additional 181 patients (9.3%) were classified as having intermediate risk not otherwise specified because of unknown status; this group was ranked between FIR and UIR. As the omega score is continuous, we identified cut points of the score to match the number of patients in standard risk groups (<0.277, 0.277–0.313, 0.314–0.339, 0.340–0.485, and ≥0.486, respectively), with low and high omega scores defined as <0.314 and ≥0.314, respectively.
Compared with standard risk strata (rHR 1.36 [95% CI: 1.20–1.54]), the omega score more effectively separated patients according to the relative risk of cancer-related versus competing events (rHR 1.61 [95% CI: 1.44–1.82]). While standard risk strata effectively stratified patients according to cancer-related events (normalised subdistribution hazard ratio [sdHR] 1.40 [95% CI: 1.26–1.55]), competing mortality was similar (sdHR 0.97 [95% CI: 0.92–1.04]). In contrast, increasing omega scores effectively stratified patients according to both cancer-related events (sdHR 1.33 [95% CI: 1.22–1.545) and competing mortality (sdHR 0.74 [95% CI: 0.69–0.80]). Thus, the key difference in the models was in the ability of the omega score to effectively separate patients simultaneously according to both cancer-related and competing mortality event risk.
When comparing risk models, 710 patients were considered to have a low or favourable-intermediate risk by both standard criteria and low omega scores, 593 patients were considered to have an unfavourable or a high risk by both models, 286 patients were considered to have a low/favourable risk only by standard criteria, and 175 patients were considered to have low/favourable risk only by the omega score (Supplementary Table 3). Thus, of the 1764 patients who could be compared, 461 (26.1%) could have different risk assessments and treatment recommendations based on which risk model was applied.
Among patients in the standard low-risk or FIR group, patients with higher omega scores tended to be younger, with better KPS, less comorbidity, and higher T stage, GS, and PSA (Table 2). Similarly, among patients in the standard UIR or high-risk group, patients with higher omega scores also tended to be younger, with better KPS, less comorbidity, and higher PSA, due to the Will Rogers effect [26]. UIR/high-risk patients with higher omega scores also had higher T stage and GS, but lower rates of ≥50% positive cores, likely due to a correlation with other intermediate-risk factors among the UIR group.
Table 2 –
Characteristics of concordant versus discordant risk groups according to standard risk criteria versus omega scorea
| Characteristic | Standard: low/FIR Omega score: low |
Standard: low/FIR Omega score: high |
p value | Standard: UIR/high Omega score: low |
Standard: UIR/high Omega score: high |
p value |
|---|---|---|---|---|---|---|
| Sample size | 710 | 286 | 175 | 593 | ||
| Age (yr), mean (SD) | 71.0 (4.8) | 64.9 (7.4) | <0.001 | 73.0 (4.3) | 69.7 (6.3) | <0.001 |
| Karnofsky performance status | ||||||
| 70–80 | 66 (9.3) | 12 (4.2) | 0.01 | 31 (17.7) | 29 (4.9) | <0.001 |
| 80–90 | 644 (90.7) | 274 (95.8) | 144 (82.3) | 563 (95.1) | ||
| Comorbidity | ||||||
| Any | 627 (88.3) | 102 (35.6) | <0.001 | 176 (100.0) | 393 (66.3) | <0.001 |
| Cardiovascular | 306 (43.1) | 30 (10.5) | <0.001 | 110 (62.9) | 120 (20.2) | <0.001 |
| Diabetes | 149 (21.0) | 18 (6.3) | <0.001 | 55 (31.4) | 80 (13.5) | <0.001 |
| T category | ||||||
| T1–T2a | 678 (95.5) | 261 (91.3) | 134 (76.6) | 349 (58.9) | <0.001 | |
| T2b | 32 (4.5) | 25 (8.7) | 0.014 | 41 (23.4) | 244 (41.1) | |
| Gleason score | ||||||
| ≤6 | 661 (93.1) | 255 (89.2) | 0.052 | 66 (37.7) | 109 (18.4) | <0.001 |
| 3 + 4 | 49 (6.9) | 31 (10.8) | 59 (33.7) | 169 (28.5) | ||
| 4 + 3 | 0 | 0 (0) | – | 46 (26.3) | 134 (22.6) | |
| ≥8 | 0 | 0 (0) | – | 4 (2.3) | 181 (30.5) | |
| PSA (ng/ml), mean (SD) | 6.9 (3.5) | 8.7 (4.1) | <0.001 | 8.7 (3.9) | 10.8 (4.4) | <0.001 |
| ≥50% positive cores | 0 (0) | 0 (0) | – | 107 (76.4) b | 184 (57.9) b | <0.001 |
FIR = favourable intermediate risk; PSA = prostate-specific antigen; SD = standard deviation; UIR = unfavourable intermediate risk.
Data are presented as n (%) unless otherwise indicated.
Percentage is of nonmissing. Two-sided p values are from t test (continuous variables), Pearson's chi-square test with Yates' continuity correction (categorical variables), or Fisher’s exact test (for categorical variables with fewer than five counts in any category).
Table 3 shows the effects of ADT on cancer-related, competing events, EFS, and OS within subgroups defined by both models. We observed significant interactions between low-risk/FIR versus UIR/high-risk status and the effect of ADT on cancer-related events (p = 0.019), consistent with previous reports [22]. Similarly, we observed significant interactions (p = 0.046) between the effects of ADT on cancer-related events in low versus high omega score subgroups, indicating that this model was also effective in selecting patients who benefit from ADT.
Table 3 –
Effects of short-term androgen deprivation therapy by risk group
| N | Cancer- related event (metastasis or cancer death) |
Competing mortality | Event-free survival (Cancer-related event or competing mortality) |
Overall survival | ||||
|---|---|---|---|---|---|---|---|---|
| <10 yr | ≥10 yr | <10 yr | ≥10 yr | <10 yr | ≥10 yr | |||
| All patients | 1945 | 0.61 (0.49, 0.76) | 0.90 (0.77, 1.05) | 1.49 (1.21, 1.84) | 0.80 (0.70, 0.92) | 1.24 (1.04, 1.49) | 0.82 (0.71, 0.94) | 1.20 (1.02, 1.43) |
| Standard risk group a | ||||||||
| Low risk/FIR | 996 | 0.82 (0.58, 1.15) | 0.84 (0.67, 1.05) | 1.65 (1.25, 2.19) | 0.85 (0.70, 1.04) | 1.41 (1.09, 1.81) | 0.85 (0.69, 1.05) | 1.37 (1.08, 1.74) |
| UIR/high risk | 768 | 0.47 (0.34, 0.64) | 0.96 (0.75, 1.23) | 1.22 (0.86, 1.73) | 0.75 (0.61, 0.92) | 0.97 (0.72, 1.29) | 0.79 (0.64, 0.98) | 0.94 (0.72, 1.24) |
| Interaction p value | ||||||||
| Low/FIR vs UIR/high | 0.019 | 0.43 | 0.21 | 0.36 | 0.06 | 0.64 | 0.044 | |
| All strata | 0.062 | 0.44 | 0.23 | 0.50 | 0.08 | 0.71 | 0.058 | |
| Relative risk group | ||||||||
| Low omega score (<0.314) | 996 | 0.81 (0.58, 1.11) | 0.84 (0.69, 1.04) | 1.46 (1.11, 1.93) | 0.84 (0.70, 1.01) | 1.33 (1.03, 1.72) | 0.80 (0.66, 0.97) | 1.35 (1.06, 1.71) |
| High omega score (≥0.314) | 949 | 0.52 (0.39, 0.69) | 0.93 (0.73, 1.19) | 1.53 (1.11, 2.09) | 0.75 (0.61, 0.91) | 1.15 (0.89, 1.49) | 0.80 (0.65, 0.99) | 1.06 (0.84, 1.35) |
| Interaction p value | ||||||||
| Low vs high | 0.046 | 0.55 | 0.79 | 0.42 | 0.44 | 0.96 | 0.17 | |
| All strata | 0.057 | 0.87 | 0.78 | 0.23 | 0.42 | 0.74 | 0.13 | |
| Continuous | 0.040 | 0.81 | 0.68 | 0.16 | 0.26 | 0.67 | 0.043 | |
| Concordant vs. discordant groups a | ||||||||
| Standard: low/FIR Omega score: low |
710 | 1.02 (0.66, 1.57) | 0.89 (0.70, 1.13) | 1.64 (1.18, 2.29) | 0.92 (0.74, 1.15) | 1.49 (1.10, 2.02) | 0.89 (0.71, 1.12) | 1.48 (1.11, 1.97) |
| Standard: low/FIR Omega score: high |
286 | 0.55 (0.30, 0.99) | 0.57 (0.32, 1.01) | 1.77 (1.03, 3.03) | 0.57 (0.36, 0.90) | 1.30 (0.83, 2.04) | 0.60 (0.36, 1.00) | 1.16 (0.76, 1.77) |
| Standard: UIR/high Omega score: low |
175 | 0.35 (0.17, 0.74) | 0.86 (0.54, 1.39) | 0.84 (0.41, 1.72) | 0.68 (0.44, 1.03) | 0.73 (0.39, 1.33) | 0.68 (0.44, 1.05) | 0.81 (0.45, 1.43) |
| Standard: UIR/high Omega score: high |
593 | 0.50 (0.36, 0.71) | 0.99 (0.74, 1.32) | 1.37 (0.92, 2.05) | 0.77 (0.61, 0.97) | 1.05 (0.75, 1.46) | 0.83 (0.65, 1.06) | 0.99 (0.73, 1.35) |
FIR = favourable intermediate risk; UIR = unfavourable intermediate risk.
Note that 181 patients with missing FIR/UIR status were omitted. All p values are two sided from Cox proportional hazard models (Wald test).
We also observed significant interactions for the effect of ADT on late (≥10-yr) mortality, with a higher risk in the low-risk/FIR versus UIR/high-risk subgroup (HR 1.37 vs 0.94; p = 0.044; Table 3). A similar interaction was observed for omega score: HR 1.35 versus 1.06 (continuous p = 0.043). We observed no significant interactions, however, between standard risk group or low versus high omega score for the effect of ADT on under 10-yr mortality.
We then analysed the outcomes by treatment in concordant versus discordant groups defined by standard criteria versus omega score (Table 3, and Fig. 2 and 3). Overall, we observed a lack of benefit of ADT in patients defined as having a low risk by both models, but marked reductions in the risk for primary events in patients defined to have a higher risk by either model. In the low-risk/FIR and low omega score group, ADT was associated with significantly worse mortality after 10 yr (HR 1.48 [95% CI: 1.11, 1.97]), in contrast to the other groups (Table 3).
Fig. 2 –

Effects of short-term androgen deprivation therapy (ADT) on cancer-related events versus competing mortality within risk groups defined by standard criteria versus omega score. (A) Concordant: low risk/FIR, low omega score. (B) Discordant: low risk/FIR, high omega score. (C) Discordant: UIR/high risk, low omega score. (D) Concordant: UIR/high risk, high omega score. Solid lines represent cancer-related event (metastasis or cancer death) and dashed lines represent competing mortality event.
FIR = favourable intermediate risk; RT = radiotherapy; UIR = unfavourable intermediate risk.
Fig. 3 –

Effects of short-term androgen deprivation therapy (ADT) on overall survival within risk groups defined by standard criteria versus omega score. (A) Concordant: low risk/FIR, low omega score. (B) Discordant: low risk/FIR, high omega score. (C) Discordant: UIR/high risk, low omega score. (D) Concordant: UIR/high risk, high omega score.
FIR = favourable intermediate risk; RT = radiotherapy; UIR = unfavourable intermediate risk.
Among patients with discordant risk assessments, there was considerable variation in the incidence of competing events (Fig. 2B and 2C), but both subgroups appeared to benefit from short-term ADT (Table 3, and Fig. 3B and 3C). Among patients with low-risk/FIR disease and a high omega score, ADT decreased the risk of cancer-related events (HR 0.55 [95% CI: 0.30–0.99]) and was associated with improved EFS (HR 0.57 [95% CI: 0.36–0.90]) and OS (HR 0.60 [95% CI: 0.36–1.00]). In the UIR/high-risk, low omega score subgroup, ADT also decreased the risk of cancer-related events (HR 0.35 [95% CI: 0.17–0.74]) and was associated with improved EFS (HR 0.68 [95% CI: 0.44–1.03]) and OS (HR 0.68 [95% CI: 0.44–1.05]). These results suggest that both models missed sets of patients who benefit from ADT, but together identified a category of patients with a low risk of cancer-related events and a high relative risk for competing mortality who were unlikely to benefit from ADT.
4. Discussion
A limitation of standard risk-stratification approaches is that groups with the same probability of a given outcome, such as survival, may still have different prognoses, due to differing relative hazards for competing events. GCE models are designed to stratify patients according to this latter metric, which has advantages for selecting patients for treatment when competing risks are present [14,23]. Some studies have found that older patients with comorbidities are less likely to benefit from ADT [1,27,28], indicating a potential role for the quantitative assessment of competing risks, such as using risk scores. Since conventional models do not directly balance the impact of age and comorbidity against cancer-specific risk factors, we sought to determine whether GCE models could help identify patients who selectively benefit from short-term ADT with RT.
Overall, we found that the omega score was more effective than standard criteria for separating patients according to the relative risk of cancer-related events versus competing mortality, due to the nature of the underlying approach. Although we did not find strong evidence to support our primary hypothesis that ADT would selectively benefit patients with higher omega scores overall, we found that mortality after 10 yr was increased in patients with lower omega scores. Interestingly, our findings with respect to treatment effects were similar to grouping patients according to standard criteria, even though >25% of patients were classified differently using the different approaches. Exploratory analyses also suggest that patients with higher omega scores in the low-risk/FIR subgroup selectively benefitted from ADT (Supplementary Fig. 3).
For practical clinical decision-making, the omega score appears to have the most utility for identifying patients in the low-risk/FIR subgroup who still benefit from short-term ADT. In our analysis, this applied to 29% of the sample (286/996). In conjunction with standard risk criteria, the model appeared especially effective for isolating a group of patients who appeared not to benefit from ADT and may be harmed over the long term. Given certain limitations of the analysis and the RTOG 9408 data, with use of lower RT doses, and the complexity of the relationship between treatment and competing risks over long time periods, it is not clear yet whether our findings should affect practice in this way. In addition, it is not clear what value of the omega score represents the optimal cut-off for clinical decision-making regarding the recommendation for short-term ADT; future studies could examine that question. Rather, the study exemplifies the potential utility of this novel risk stratification paradigm. To facilitate further analysis, a nomogram to compute the omega score will be posted at http://comogram.org.
When viewed solely a prognostic model, the omega score has clear utility for differentiating patients with different competing risk probabilities. We observed strong associations between advanced age, poor PS, and comorbidity, especially cardiovascular disease and diabetes, and a reduced relative hazard for cancer-related events. In this study, “comorbidity” was defined broadly to include any chronic comorbid medical condition, but largely consisted of three conditions (cardiovascular disease, hypertension, and diabetes). We did not find that having multiple conditions was more strongly associated with outcomes; however, other studies have found that refined comorbidity indices (eg, ACE-27) are useful [29]. Future studies incorporating such measures could augment this risk-stratification approach.
Strengths of this study include the use of a novel methodology applied to a large, multicentre cohort with ample variation in both explanatory variables and event incidences, prospective data collection, randomised intervention, and central review of the cause of death data. Although treatment standards have evolved since the RTOG 9408 study was designed, we would still expect the essential conclusions to be valid, to the extent that ADT is effective. Other risk factors, such as PSA velocity and imaging features, have been associated with outcomes [30-33] and would likely improve the model, but we lacked access to these data. Some patients were missing percentage of positive core biopsies, which may have attenuated our ability to detect its effects when controlling for other covariates. Lastly, we did not analyse biochemical failure as a primary event; future research could interrogate this endpoint.
5. Conclusions
We found that the omega score, a quantitative measure of the relative risk for cancer-related versus competing mortality events, resulted in an alternative assessment of the benefit of ADT for many patients with low-risk/FIR prostate cancer. As a prognostic tool, the omega score has clear advantages in stratifying patients according to competing risks. When applied to future trials or incorporated prospectively, this approach may prove beneficial for guiding treatment decisions.
Supplementary Material
We used a novel method (omega score) to analyse the effects of short-term androgen deprivation therapy (ADT) for prostate cancer according to the relative risk of competing events. Among patients with low-risk or favourable intermediate-risk disease, those with higher omega scores selectively benefitted from ADT.
Funding/Support and role of the sponsor:
This project was supported by grants U10CA180868 (NRG Oncology Operations), U10CA180822 (NRG Oncology SDMC), UG1CA189867 (NCORP), and U24CA180803 (IROC) from the National Cancer Institute (NCI).
Footnotes
Publisher's Disclaimer: This is a PDF file of an unedited manuscript that has been accepted for publication. As a service to our customers we are providing this early version of the manuscript. The manuscript will undergo copyediting, typesetting, and review of the resulting proof before it is published in its final form. Please note that during the production process errors may be discovered which could affect the content, and all legal disclaimers that apply to the journal pertain.
Financial disclosures: Loren K. Mell certifies that all conflicts of interest, including specific financial interests and relationships and affiliations relevant to the subject matter or materials discussed in the manuscript (eg, employment/affiliation, grants or funding, consultancies, honoraria, stock ownership or options, expert testimony, royalties, or patents filed, received, or pending), are the following: L.K. Mell, Bahary, Choi, Gore, Hartford, Husain, Horwitz, Jones, Michalski, Nelson, Parliament, Pisansky, Roach, Rose, Zakeri, and Zeitzer have no conflicts of interest to declare. F. Feng reports advisory board personal fees from Janssen Oncology, Sanofi, Celgene, and Blue Earth Diagnostics; being a consultant for Bayer and Genentech; and being a founding member or having ownership interests in PFS Genomics. S.C. Malone reports honoraria from Amgen, Abbvie, Janssen, Astellas, AstraZeneca, Knight Therapeutics, and Bayer; and travel expenses from Sanofi and TerSera. M.V. Mishra reports honorarium and travel fees from Varian Medical Systems outside the submitted work. S.L. Pugh reports salary support paid to institution from Pfizer and Millennium outside the submitted work. L. Souhami reports travel support from Varian Medical Systems and being a member of the advisory board for Abbvie.
References
- [1].D'Amico AV, Chen MH, Renshaw AA, Loffredo M, Kantoff PW. Androgen suppression and radiation vs radiation alone for prostate cancer: a randomized trial. JAMA 2008;299:289–95. [DOI] [PubMed] [Google Scholar]
- [2].Mahal BA, Butler S, Franco I, et al. Use of active surveillance or watchful waiting for low-risk prostate cancer and management trends across risk groups in the United States, 2010–2015. JAMA 2019;321:704–6. [DOI] [PMC free article] [PubMed] [Google Scholar]
- [3].Ganz PA, Barry JM, Burke W, et al. National Institutes of Health State-of-the-Science Conference: role of active surveillance in the management of men with localized prostate cancer. Ann Intern Med 2012;156:591–5. [DOI] [PMC free article] [PubMed] [Google Scholar]
- [4].Raldow AC, Presley CJ, Yu JB, et al. The relationship between clinical benefit and receipt of curative therapy for prostate cancer. Arch Intern Med 2012;172:362–3. [DOI] [PMC free article] [PubMed] [Google Scholar]
- [5].D'Amico AV, Manola J, Loffredo M, Renshaw AA, DellaCroce A, Kantoff PW. 6-Month androgen suppression plus radiation therapy vs radiation therapy alone for patients with clinically localized prostate cancer: a randomized controlled trial. JAMA 2004;292:821–7. [DOI] [PubMed] [Google Scholar]
- [6].Jones CU, Hunt D, McGowan DG, et al. Radiotherapy and short-term androgen deprivation for localized prostate cancer. N Engl J Med 2011;365:107–18. [DOI] [PubMed] [Google Scholar]
- [7].Denham JW, Steigler A, Lamb DS, et al. Short-term androgen deprivation and radiotherapy for locally advanced prostate cancer: results from the Trans-Tasman Radiation Oncology Group 96.01 randomised controlled trial. Lancet Oncol 2005;6:841–50. [DOI] [PubMed] [Google Scholar]
- [8].Preisser F, Cooperberg MR, Crook J, et al. Intermediate-risk prostate cancer: stratification and management. Eur Urol Oncol 2020;3:270–80. [DOI] [PubMed] [Google Scholar]
- [9].Berlin A, Moraes FY, Sanmamed N, et al. International multicenter validation of an intermediate risk subclassification of prostate cancer managed with radical treatment without hormone therapy. J Urol 2019;201:284–91. [DOI] [PubMed] [Google Scholar]
- [10].D'Amico AV, Denham JW, Crook J, et al. Influence of androgen suppression therapy for prostate cancer on the frequency and timing of fatal myocardial infarctions. J Clin Oncol 2007;25:2420–5. [DOI] [PubMed] [Google Scholar]
- [11].Carroll PH, Mohler JL. NCCN guidelines updates: prostate cancer and prostate cancer early detection. J Natl Compr Canc Netw 2018;16:620–3. [DOI] [PubMed] [Google Scholar]
- [12].Daskivich TJ, Chamie K, Kwan L, et al. Comorbidity and competing risks for mortality in men with prostate cancer. Cancer 2011;117:4642–50. [DOI] [PubMed] [Google Scholar]
- [13].Carmona R, Zakeri K, Green G, et al. Improved method to stratify elderly patients with cancer at risk for competing events. J Clin Oncol 2016;34:1270–7. [DOI] [PMC free article] [PubMed] [Google Scholar]
- [14].Mell LK, Jeong JH. Pitfalls of using composite primary end points in the presence of competing risks. J Clin Oncol 2010;28:4297–9. [DOI] [PubMed] [Google Scholar]
- [15].Zakeri K, Rose BS, Gulaya S, D'Amico AV, Mell LK. Competing event risk stratification may improve the design and efficiency of clinical trials: secondary analysis of SWOG 8794. Contemp Clin Trials 2013;34:74–9. [DOI] [PMC free article] [PubMed] [Google Scholar]
- [16].Carmona R, Gulaya S, Murphy JD, et al. Validated competing event model for the stage I-II endometrial cancer population. Int J Radiat Oncol Biol Phys 2014;89:888–98. [DOI] [PMC free article] [PubMed] [Google Scholar]
- [17].Mell LK, Shen H, Nguyen-Tân PF, et al. Nomogram to predict the benefit of intensive treatment for locoregionally advanced head and neck cancer. Clin Cancer Res 2019;25:7078–88. [DOI] [PMC free article] [PubMed] [Google Scholar]
- [18].Voog JC, Paulus R, Shipley WU, et al. Cardiovascular mortality following short-term androgen deprivation in clinically localized prostate cancer: an analysis of RTOG 94-08. Eur Urol 2016;69:204–10. [DOI] [PMC free article] [PubMed] [Google Scholar]
- [19].Jones CU, Pugh SL, Sandler HM, et al. Adding short-term androgen deprivation therapy to radiation therapy in men with localized prostate cancer: long-term update of the NRG/RTOG 9408 randomized clinical trial. Int J Radiat Oncol Biol Phys 2022;112:294–303. [DOI] [PMC free article] [PubMed] [Google Scholar]
- [20].Kent DM, Paulus JK, van Klaveren D, et al. Transparent Reporting of a multivariable prediction model for Individual Prognosis or Diagnosis (TRIPOD): the TRIPOD statement. Ann Intern Med 2020;172:35–45.31711134 [Google Scholar]
- [21].Collins GS, Reitsma JB, Altman DG, Moons KG. The Predictive Approaches to Treatment effect Heterogeneity (PATH) statement. Ann Intern Med 2015;162:55–63.25560714 [Google Scholar]
- [22].Zumsteg ZS, Spratt DE, Daskivich TJ, et al. Effect of androgen deprivation on long-term outcomes of intermediate-risk prostate cancer stratified as favorable or unfavorable: a secondary analysis of the RTOG 9408 randomized clinical trial. JAMA Netw Open 2020;3:e2015083. [DOI] [PMC free article] [PubMed] [Google Scholar]
- [23].Zakeri K, Rotolo F, Lacas B, et al. Predictive classifier for intensive treatment of head and neck cancer. Cancer 2020;126:5263–73. [DOI] [PubMed] [Google Scholar]
- [24].Williamson CW, Nelson TJ, Thompson CA, et al. Bias reduction through analysis of competing events (BRACE) correction to address cancer treatment selection bias in observational data. Clin Cancer Res 2022;28:1832–40. [DOI] [PubMed] [Google Scholar]
- [25].Schemper M Cox analysis of survival data with non-proportional hazard functions. Statistician 1992;41:455–65. [Google Scholar]
- [26].Feinstein AR, Sosin DM, Wells CK. The Will Rogers phenomenon. Stage migration and new diagnostic techniques as a source of misleading statistics for survival in cancer. N Engl J Med 1985;312:1604–8. [DOI] [PubMed] [Google Scholar]
- [27].Daskivich TJ, Chamie K, Kwan L, et al. Overtreatment of men with low-risk prostate cancer and significant comorbidity. Cancer 2011;117: 2058–66. [DOI] [PubMed] [Google Scholar]
- [28].Daskivich TJ, Fan KH, Koyama T, et al. Effect of age, tumor risk, and comorbidity on competing risks for survival in a U.S. population–based cohort of men with prostate cancer. Ann Intern Med 2013;158:709–17. [DOI] [PMC free article] [PubMed] [Google Scholar]
- [29].Ng SP, Duchesne G, Tai KH, Foroudi F, Gargi K, Williams S. Support for the use of objective comorbidity indices in the assessment of noncancer death risk in prostate cancer patients. Prostate Int 2017;5:8–12. [DOI] [PMC free article] [PubMed] [Google Scholar]
- [30].D’Amico AV, Whittington R, Malkowicz SB, et al. Role of percent positive biopsies and endorectal coil MRI in predicting prognosis in intermediate-risk prostate cancer patients. Cancer J Sci Am 1996;2:343–50. [PubMed] [Google Scholar]
- [31].Liauw SL, Kropp LM, Dess RT, Oto A. Endorectal MRI for risk classification of localized prostate cancer: radiographic findings and influence on treatment decisions. Urol Oncol 2016;34:416.e15–21. [DOI] [PubMed] [Google Scholar]
- [32].Soto DE, Andridge RR, Pan CC, Williams SG, Taylor JM, Sandler HM. In patients experiencing biochemical failure after radiotherapy, pretreatment risk group and PSA velocity predict differences in overall survival and biochemical failure-free interval. Int J Radiat Oncol Biol Phys 2008;71:1295–301. [DOI] [PubMed] [Google Scholar]
- [33].Spalding AC, Daignault S, Sandler HM, et al. Percent positive biopsy cores as a prognostic factor for prostate cancer treated with external beam radiation. Urology 2007;69: 936–10. [DOI] [PubMed] [Google Scholar]
Associated Data
This section collects any data citations, data availability statements, or supplementary materials included in this article.