

Abstract
Objective:
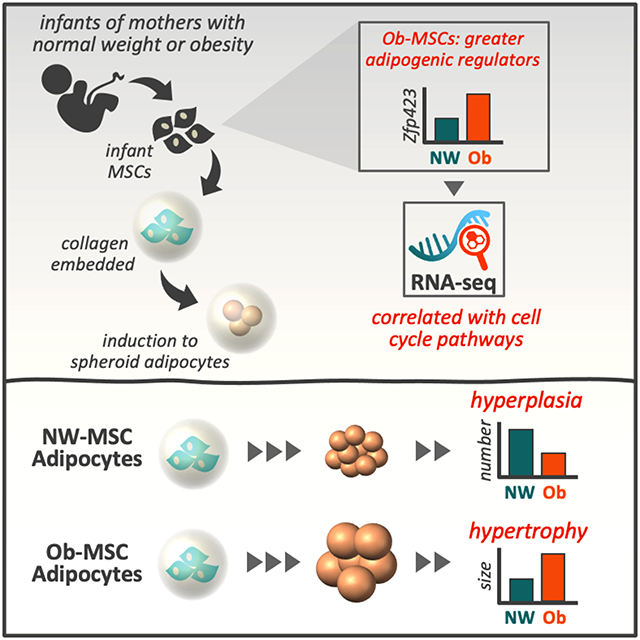
Fat content of adipocytes derived from infant, umbilical cord mesenchymal stem cells (MSCs) predicts adiposity in children through 4-6 years of age. We tested the hypothesis that MSCs from infants born to mothers with obesity (Ob-MSCs) exhibit adipocyte hypertrophy and perturbations in genes regulating adipogenesis compared with MSCs from infants of mothers with normal-weight (NW-MSCs).
Methods:
We induced adipogenesis in MSCs embedded in 3-dimensional hydrogel structures and measured cell size and number by 3-dimensional imaging. We measured proliferation as well as protein markers of proliferation and adipogenesis in undifferentiated and adipocyte differentiating cells. We performed RNA sequencing to determine pathways linked to adipogenesis phenotype.
Results:
In undifferentiated MSCs, we observed greater zinc finger protein (Zfp)423 protein content in Ob- vs. NW-MSCs. Adipocytes from Ob-MSCs were larger, but fewer than adipocytes from NW-MSCs. RNA-seq analysis showed Zfp423 protein correlated with mRNA expression of genes enriched for cell cycle, MSC lineage specification, inflammation, and metabolism pathways. MSC proliferation was not different before differentiation but declined faster in Ob-MSCs upon adipogenic induction.
Conclusion:
Ob-MSCs have an intrinsic propensity for adipocyte hypertrophy and reduced hyperplasia during adipogenesis in vitro, perhaps linked to greater Zfp423 content and changes in cell cycle pathway gene expression.
Keywords: Adipogenesis, maternal obesity, fetal programming
Graphical Abstract
INTRODUCTION
It is well-accepted that obesity during gestation increases the risk of fetal overgrowth,(1) as well as risk for obesity and cardiometabolic disease in childhood.(2) Infants exposed to obesity in utero have greater adiposity at birth.(3, 4) However, the underlying mechanisms for how this may contribute to future disease risk are not well understood.
Fetal mesodermal tissues, such as adipose and skeletal muscle, are developed from multipotent fetal mesenchymal stem cells (MSCs). Progenitor cells from this same MSC niche are retained in the developed tissues throughout life, such as adipose-resident preadipocytes or skeletal muscle satellite cells. Both animal models(5, 6) and human studies(7) indicate that intrauterine exposures influence offspring preadipocyte phenotype, which is linked to impaired metabolic health into adulthood. We and others have reported that MSCs from umbilical cord or amniotic fluid of infants born to mothers with obesity have greater protein and lipid markers of adipogenesis in vitro when compared with cells from infants born to individuals of normal weight.(3, 8, 9)
In rodents, white adipose tissue from offspring of high-fat-fed dams exhibits greater expression of adipogenic drivers such as zinc finger protein (Zfp)423 and peroxisome proliferator-activated receptor (PPAR)γ,(5, 10) as well as adipocyte hypertrophy.(11, 12) Perturbation to Zfp423 in adipose tissue from offspring of high-fat-fed dams is linked to impaired adipose progenitor cell proliferation, adipocyte hypertrophy, and a hypoxia/pro-inflammatory profile.(13, 14) This is consistent with observations in larger mammals exposed to intrauterine obesity such as sheep and non-human primates (15, 16) and in human adults with established obesity.(12, 17, 18) Thus, perturbation of offspring adipose tissue progenitor cells may contribute to altered adipogenesis (i.e., hyperplasia and hypertrophy), resulting in greater adiposity and persistent metabolic consequences in offspring exposed to obesity in utero, recently reviewed by Scheidl et al.(19)
We have reported that fat content of adipocytes derived from umbilical cord MSCs predicts adiposity through 4-6 years of age in 70 children, more robustly than birth weight or birth adiposity,(20) supporting the clinical relevance of assessing child obesity-related phenotypes in infant MSCs. However, explicit interrogation of human infant adipocyte size, which may contribute to health outcomes such as inflammation and insulin resistance,(21, 22) is prohibitively invasive. To investigate adipocyte morphology in the context of gestational obesity in humans, we have developed a novel, we have developed a three-dimensional (3D) cell culture model of MSC adipogenesis. Coupled with temporal proliferation assessment and bulk RNA sequencing, we tested the hypothesis that MSCs from infants exposed to gestational obesity (Ob-MSCs) exhibit adipocyte hypertrophy and perturbations in genes regulating adipogenesis when compared with MSCs from infants exposed to normal weight (NW-MSCs).
METHODS
Participants
Maternal measures
The Healthy Start cohort study enrolled 1,410 pregnant women aged ≥16y at <23wks of gestation, from obstetrics clinics at the University of Colorado Hospital from 2009-2014. We excluded women with prior diabetes, premature birth, serious psychiatric illness, or current multiple pregnancy, as described.(23) We cultured umbilical cord MSCs from a convenience sample of 165 infants. For this study, we included all mothers with pregravid obesity (n=19) and normal-weight mothers frequency matched for age, gestational age at delivery, and infant sex (n=20).
Infant and child measures
At birth, we measured insulin, glucose, and triglycerides from umbilical cord blood. We obtained birth weight from medical records and measured weight, length, and body composition (fat mass [FM], fat-free mass [FFM]) by whole body air displacement plethysmography (PEA POD, COSMED, Inc., n=37) 24-48h after birth. At 4-6 years we measured body composition (n=9 NW, n=8 Ob; BOD POD, COSMED, Inc.,) and fasted venous blood insulin, adiponectin, glucose, cholesterol, and triglycerides.
MSC isolation and culture
MSC culture and isolation procedures have been described.(3) Briefly, plastic adherent progenitor cells were cultured from fresh umbilical cord explants (Wharton’s Jelly) in low-glucose Dulbecco’s Modified Eagle Medium supplemented with MSC-qualified fetal bovine serum. Cells were characterized as >98% for standard MSC markers(24) CD74, CD105, and CD90 and negative for other cell types (CD34, CD45, CD19).(3) We demonstrated multi-lineage differentiation potential for adipogenesis and myogenesis.(3) Cells were cryopreserved and passaged and were within passages 3-7 for these experiments with no difference between groups.
We harvested MSCs in growth medium (undifferentiated cells) or after 14d of adipogenic induction. We induced adipogenesis with a standard cocktail(3, 25) in collagen hydrogels for 3D culture. We have demonstrated this cocktail progressively increases markers of adipogenesis in both NW- and Ob-MSCs (CCAAT/enhancer-binding protein-β, fatty acid binding protein 4, and PPARγ proteins; and neutral lipids by BODIPY493/503 and Oil Red O stain) in traditional adherent culture.(3) We observed no difference between NW- and Ob-MSCs for percentage of cells undergoing adipogenesis.(3)
Adipogenesis in three-dimensional cell culture
We measured adipocyte morphology with 3D cell culture, which allows adipocytes to form a more natural spheroid shape, store more lipid, and elicits gene expression more similar to in vivo adipocytes than cells in monolayer.(26, 27) We embedded 80,000 undifferentiated MSCs into 40μL of medium stiffness Col-T gel hydrogels (~14-20kPa, 101Bio) and plated them onto non-tissue culture treated plastic. Col-T hydrogel uses a cross-linked collagen matrix without growth factors found in other gel substances that may impact results. We incubated cells for 24h in regular growth medium, followed by adipogenic induction. After 14d adipogenesis, we washed the hydrogels twice with Dulbecco’s Phosphate Buffered Saline (DPBS), fixed them in 10% formalin for 15 min, washed twice more with DPBS, then stored them in DPBS at 4°C until staining and imaging.
3D culture hydrogel staining and imaging
To measure cell sizing, we stained hydrogels for 45 min in a mixture of: wheat germ agglutinin (WGA) Alexa Fluor™ 555 cell membrane stain (12μ;g/mL, Invitrogen), DAPI nuclear stain (30μ;g/mL, Invitrogen), and BODIPY 493/503 neutral lipid stain (11μ;g/mL, Life Technologies). To measure PPARγ expression as verification of adipogenesis, we permeabilized cells with 0.1% triton at 37°C for 15 min, blocked with 10% normal goat serum (15min), then washed with PBS (2x15 min). We incubated hydrogels with PPARγ antibody (1:100 dilution; Cell Signaling #2435) at 37°C for 1h, washed with PBS (3x15min), then incubated with anti-rabbit Alexa Flour™ 488 (1:500 dilution, 1h; Invitrogen). We then stained hydrogels for 45min in WGA Alexa Fluor™ 555 (15μ;g/mL) and DAPI (30μ;g/mL), washed hydrogels in PBS (2x30min), then immediately imaged using a 3I Marianas spinning disk confocal microscope (Intelligent Imaging Innovations, Inc. CO, US) with an air objective Zeiss Plan-Apochromat 20X/0.75 (Carl Zeiss GmBH, Jena, Germany). Per subject, we acquired 3-5 z-stacks of 200 images each with a 1μ;m step size using SlideBook 6.0 imaging software (Intelligent Imaging Innovations, Inc.).
We used the 3D Objects Counter Plugin in Fiji(28) to determine total area (μ;m3) of WGA and BODIPY and the total number of DAPI-stained nuclei. Three researchers double-measured one complete z-stack per hydrogel (three z-stacks per hydrogel, ≥100 cells/subject), with an average repeatability of 88.1% (Table S1). We then calculated the total area of WGA/number of nuclei (mean cell size) and total area of BODIPY/number of nuclei (mean lipid droplet size).
For individual cell sizing, we manually traced cells at the largest cross section using Fiji to obtain cross-sectional area (CSA, μ;m2), cell roundness, and BODIPY fluorescence intensity. Manual measures allowed us to quantify individual, rather than mean, cell size and BODIPY fluorescence intensity. We measured at least one complete z-stack per subject, with additional z-stacks measured if necessary to achieve at least 70 cells/infant.
Proliferation
We quantified proliferation rates in undifferentiated MSCs, and over the first 7 days of adipogenesis by measuring 5-Bromo-2'-deoxyuridine (BrdU) incorporation into newly synthesized DNA. We plated 5,000 undifferentiated MSCs/well in traditional adherent culture on 96-well plates, then induced adipogenesis 24h later. We performed experiments in adherent culture rather than hydrogels for ease of measurement, though results were identical in 3D hydrogel comparison tests (Figure S1). We incubated cells with BrdU for 24h before each measurement point (d0 [undifferentiated], d1, d2, d7). BrdU incubation time was determined in-house for optimal sensitivity through later, low proliferation timepoints. We measured BrdU in triplicate using an immunoassay (Millipore, Burlington, MA) with cell-only (no BrdU) and no-cell (with BrdU) controls. We measured in triplicate and normalized to cell-only controls within each cell line.
Simple Western protein quantification of undifferentiated cells
We harvested undifferentiated MSCs in ice-cold lysis buffer (CelLytic™ MT, Sigma-Aldrich, St. Louis, MO) supplemented with protease and phosphatase inhibitors (Sigma-Aldrich), as described.(3) We determined total protein by bicinchoninic acid (BCA) assay. We used Simple Western (WES, ProteinSimple, Santa Clara, CA) to measure total protein and abundance of Zfp423, preadipocyte factor (Pref)1, histone-lysine N-methyltransferase enhancer of zeste homolog 2 (Ezh2), wingless-type family member 10B (Wnt10b), NAD-dependent protein deacetylase sirtuin 1 (Sirt1), and cleaved and total Poly [ADP-ribose] polymerase (PARP) in undifferentiated MSCs (Table S2). Representative and group mean tracings of WES Spectra Plots are shown in Figure S2.
RNA sequencing
We harvested and flash froze cell pellets from undifferentiated MSCs in liquid nitrogen, then stored at −80C until analysis. We isolated RNA using the Qiagen AllPrep kit and assessed RNA quantity by Qubit (Thermo Fisher Scientific) and quality by bioanalyzer (Agilent, Santa Clara, CA). We performed polyA tail selection with the Nugen mRNA kit and performed RNA-seq in two batches, the first on Illumina HiSeq4000 with 1x150bp reads and the second with 2x150bp flow cell runs on Illumina NovaSEQ 6000, with 40 million reads/sample.
Statistics
We used R for statistical testing. We tested normality using Shapiro-Wilk tests and Box-Cox (Table S3) or quantile transformed non-normal variables, though we present raw data. We used Fligner-Killeen tests to verify homogeneity of variance between NW-MSC vs. Ob-MSC groups. We set significance at p<0.05 for all data except RNA sequencing, where we considered a Benjamini and Hochberg FDR<0.1 significant for single genes.
Group comparisons
We tested differences between groups with t tests. For individual cell size measures, we adjusted for multiple testing by FDR. For repeated BrdU measures during adipogenesis, we used a mixed model to test for MSC phenotype differences over time. MSC phenotype and time were set as fixed factors and subjects as random factor with Bonferroni-corrected post-hoc analysis.
Association of cell size measures with offspring outcomes
To test for association of adipocyte phenotype with child adiposity-related outcomes, we used multivariate analysis of variance (MANOVA). We tested for the effect of multiple cell size measures (minimum, average, and maximum CSA) on multiple, related dependent variables: 1) newborn body composition (%FM, birth weight), 2) child body composition (%FM, weight at age 4-6 years), and 3) cardiometabolic serum measures (insulin, adiponectin at age 4-6 years). We performed analyses with and without maternal pre-pregnancy BMI and offspring age as covariates because these measures were associated with body composition (offspring sex was not). We did not include all child serum measures due to high collinearity and sample missingness at age 4-6 years. We chose to analyze adiponectin because it is secreted from adipose tissue, and insulin because it promotes adipogenesis and is a marker of insulin resistance.
RNA-seq analysis
We used FastQC (Babraham Institute) to assess the quality of RNAseq FASTQ files. We used cutadapt(29) to remove Illumina sequencing adapters and low-quality base calls. We then mapped FASTQ files to the GRCh38 human transcriptome assembly using RSEM(30) and extracted raw gene expression counts with the RSEM algorithm. We performed batch correction using RUVg (R, RUVseq). We filtered out genes with an average of <10 counts/subject and used a Variance Stabilizing Transformation (R, DESeq2) on raw count data. We then fit Zfp423 protein content as a predictor for normalized gene expression using linear models, with infant sex and gestational age as covariates (n=18/group). We corrected for multiple testing using FDR. We performed overrepresentation analyses (ORA) for Gene Ontology (GO) Biological Processes (R, clusterProfiler) and Reactome pathways (R, ReactomePA) using enrichGO and enrichPathway functions, respectively. We used ranked gene lists by correlation with Zfp423 protein for Gene Set Enrichment Analysis (GSEA) for Reactome pathways using ReactomePA. We visualized GSEA pathways using the EnrichmentMap plugin for Cytoscape.(31, 32)
Study Approval
This study used umbilical cord tissue samples and data collected as part of the Healthy Start Study (ClinicalTrials.gov; NCT02273297). The study was approved by the Colorado Multiple Institutional Review Board at the University of Colorado Hospital. At enrollment, we obtained written, informed consent from all participants.
RESULTS
Maternal, infant, and child characteristics
Participant characteristics are listed in Table 1. By design, mothers with obesity had higher pre-pregnancy BMI, but similar maternal age, gestational age at delivery, infant sex, and MSC time to confluence for initial culture than mothers of normal weight. Two women with obesity were diagnosed with gestational diabetes mellitus (GDM). Removal did not alter results or interpretation, so we retained but flagged them in the results. Infants born to mothers with obesity had similar birth weight, but greater adiposity at birth than those born to mothers of normal weight. There were no group differences at 4-6 years.
Table 1.
Participant characteristics.
| Maternal Characteristics | NW (n=20) | Obese (n=19) | t-test p |
|---|---|---|---|
| Age, y | 29.6 ± 1.4 | 26.9 ± 1.5 | 0.21 |
| Pre-pregnancy BMI, kg/m2 | 21.7 ± 0.1 | 34.6 ± 0.9 | <0.0001* |
| Primiparous, n (%) | 9 (45) | 12 (63) | 0.27 |
| Glucose, mg/dL | 76.7 ± 1.1 | 77.6 ± 1.7 | 0.64 |
| Insulin, uIU/mL | 7.2 ± 0.4 | 15.7 ± 2.8 | 0.008* |
| HOMA-IR | 1.4 ± 0.1 | 3.1 ± 0.6 | 0.009* |
| Triglycerides, mmol/L | 97.3 ± 7.9 | 134.9 ± 10.8 | 0.008* |
| Free fatty acids, mmol/L | 343.8 ± 26.6 | 428.0 ± 35.0 | 0.07 |
| Total Cholesterol | 171.7 ± 6.8 | 179.7 ± 5.6 | 0.37 |
| HDL Cholesterol | 62.7 ± 3.2 | 58.0 ± 2.8 | 0.28 |
| Gestational weight gain, kg | 14.2 ± 0.9 | 10.4 ± 2.1 | 0.10 |
| Gestational age at delivery, wks | 39.5 ± 0.3 | 39.4 ± 0.3 | 0.84 |
| Cesarean delivery, n (%) | 1 (5) | 2 (11) | 0.53 |
| Gestational diabetes mellitus, n (%) | 0 (0) | 2 (11) | 0.14 |
| Infant Characteristics (Birth) | NW (n=20) | Obese (n=19) | t-test p |
| Sex, n (f/m) | 9/11 | 8/11 | NA |
| Birth weight, g | 3200 ± 81 | 3278 ± 86 | 0.52 |
| Fat mass, g | 0.27 ± 0.03 | 0.35 ± 0.03 | 0.06 |
| Fat mass, % | 8.3 ± 0.8 | 11.0 ± 0.8 | 0.02* |
| Fat free mass, g | 2.81 ± 0.06 | 2.80 ± 0.07 | 0.94 |
| Fat free mass, % | 91.7 ± 0.8 | 89.0 ± 0.8 | 0.02* |
| Cord blood glucose, mg/dL | 85.6 ± 5.7 | 80.4 ± 5.1 | 0.57 |
| Cord blood insulin, uIU/mL | 6.4 ± 0.8 | 11.9 ± 2.2 | 0.05* |
| Cord blood triglycerides, mmol/L | 49.8 ± 5.5 | 46.6 ± 5.6 | 0.74 |
| Ever breastfed, n (%) | 19 (95) | 18 (95) | 0.97 |
| Exclusive breastfed 6mo, n (%) | 10 (50) | 5 (26) | 0.13 |
| MSC time to confluence, d | 29.7 ± 1.8 | 26.2 ± 1.6 | 0.17 |
| Child Characteristics (4-6 y) | NW | Obese | t-test p |
| Age, mo. | 57.4 ± 1.3 (n=9) | 53.7 ± 0.3 (n=8) | 0.09 |
| Weight, kg | 16.2 ± 0.3 (n=9) | 16.7 ± 0.4 (n=8) | 0.52 |
| BMI, kg/m2 | 14.7 ± 0.3 (n=9) | 15.3 ± 0.1 (n=8) | 0.15 |
| Fat mass, g | 2.9 ± 0.2 (n=9) | 3.6 ± 0.3 (n=8) | 0.25 |
| Fat mass, % | 18.1 ± 1.2 (n=9) | 21.7 ± 1.7 (n=8) | 0.30 |
| Fat free mass, g | 13.3 ± 0.2 (n=9) | 13.1 ± 0.4 (n=8) | 0.74 |
| Fat free mass, % | 81.9 ± 1.2 (n=9) | 78.3 ± 1.7 (n=8) | 0.30 |
| Glucose, mg/dL | 83.2 ± 0.4 (n=6) | 82.0 ± 1.6 (n=4) | 0.77 |
| Insulin, uIU/mL | 9.6 ± 2.5 (n=7) | 6.0 ± 0.6 (n=5) | 0.45 |
| Triglycerides, mmol/L | 59.3 ± 8.6 (n=7) | 65.4 ± 4.4 (n=5) | 0.72 |
| Leptin, ng/mL | 6.3 ± 0.6 (n=7) | 7.2 ± 0.8 (n=5) | 0.63 |
| Adiponectin, ug/mL | 18.8 ± 1.9 (n=5) | 16.9 ± 1.1 (n=5) | 0.67 |
| Total Cholesterol, mg/dL | 152.4 ± 5.6 (n=7) | 134.0 ± 4.2 (n=5) | 0.17 |
| HDL Cholesterol, mg/dL | 47.7 ± 1.2 (n=7) | 46.2 ± 1.9 (n=5) | 0.73 |
Data are mean ± SEM, unless otherwise stated.
Significant independent t-test P<0.05.
3D culture in hydrogels produces round, lipid filled adipocytes
MSCs undergoing adipogenesis in hydrogels differentiated to round, lipid-filled cells of classic adipocyte morphology (Figure S3). Videos of 3D composite images are shown in Figure S4. Cells had an average CSA of 700mm2, diameter of 29.9mm, and volume of 15,495mm3. Adipocytes from MSCs, though small, were within the size range observed in adult human white adipose tissue (diameter 20-130mm).(33)
Ob-MSC adipocytes are larger, but fewer in number
We quantified cell size in two ways. First, we measured mean cell size (WGA) and mean lipid droplet size (BODIPY) in full z-stacks (Figure 1). On average, adipocytes from Ob-MSCs were 73% larger (t=3.48, p=0.002; Figure 1c), with enlarged lipid droplets (72% larger; t=3.21, p=0.004; Figure 1d), compared with NW-MSCs. Adipocytes from Ob-MSCs were 36% fewer compared to NW-MSCs, which we quantified as number of nuclei/area (t=−3.51, p=0.001; Figure 1e). Mean cell size was inversely correlated with cell number (r=−0.63, p<0.001; Figure 1f). Second, we measured individual adipocyte CSA (Figure 2). When binned by size, adipocytes from NW-MSCs had a greater frequency of smaller cells (≤450mm2 CSA), while Ob-MSCs had more larger adipocytes (≥900mm2; Figure 2a). We observed a similar pattern when binned by total cell count (Figure S5). Average CSA was higher in adipocytes from Ob-MSCs, (t=3.42, p=0.002; Figure 2b), with the smallest adipocytes being larger than the smallest NW-MSC adipocytes (t=3.57, p=0.002; Figure 2c). There was no difference in maximum CSA (t=1.09, p=0.281; Figure 2d). Together, these data indicate that adipocytes differentiated from Ob-MSCs are larger and, while adipocytes from NW-MSCs are capable of growing as large, they are less prone to do so.
Figure 1. Ob-MSCs demonstrate adipocyte hypertrophy in 3D culture.

After 14 days of adipogenesis in hydrogels, cells were stained for WGA (cell membrane, red), BODIPY (neutral lipids, green), and DAPI (nucleus, blue), then imaged with confocal microscopy, and measured with Fiji. Representative 3-dimensional composite images from partial z-stacks (50 images) are shown from adipogenic differentiated NW-MSCs (A) and Ob-MSCs (B). Data are mean cell size (C), mean lipid droplet size (D), and average number of cells per z-stack (E) as determined by total area of stain (WGA and BODIPY) normalized by cell number using the 3D Objects Counter Plugin for Fiji. Data are mean ± SEM. *indicates significant difference between NW- and Ob-MSC, determined by t test (P<0.05). Cells from infants of mothers with GDM are indicated in red.
Figure 2. Ob-MSC adipocytes are larger, but fewer in number.

Cells were individually sized and characterized by manual tracing at the largest cross-sectional area (CSA) within single z-stack slices in Fiji. Cells were binned by size based on frequency distribution in 150 μm2 increments, then percent of cells in each size bin was calculated (A). Data binned by total cell count are shown in Figure S5. Inlay shows distribution of cells below 150 μm2 (A) Average (B), minimum (C), and maximum (D) CSA are reported. The mean fluorescence intensity of BODIPY stain per cell area was determined (E). Cell roundness, where 100% is a perfect circle, was recorded from the CSA (F). Mean fluorescence intensity per cell area of PPARγ protein were determined (G), with representative images shown (H-I). Data are shown as mean ± SEM. # indicates significant difference determined by t test with FDR multiple testing correction (P<0.05). *indicates significant difference in NW- vs. Ob-MSC, determined by t test (P<0.05). Cells from infants of mothers with GDM are indicated in red.
To determine whether the density of stored lipids differed between groups, we measured BODIPY fluorescence intensity and found no difference (t=1.30, p=0.202; Figure 2e). Lastly, we measured cell shape and found that both groups of adipocytes obtain a shape of ~70% circular (t=−0.34, p=0.734; Figure 2f), indicating similar and appropriate adipocyte morphology. We also quantified PPARγ protein content (t=1.57, p=0.129; Figure 2g-i). Table S4 lists p-values for all cell size analyses, with corresponding ANCOVA results showing no effect of infant sex or gestational age on the adipocyte measures.
Ob-MSCs have faster decline in proliferation during adipogenesis
We measured cleaved and total PARP as markers of apoptosis but found no differences (Figure S6). We found no difference between groups for proliferation assessed by BrdU incorporation in undifferentiated MSCs (t=−0.86, p=0.399; Figure 3a). Likewise, there were no differences in proliferation proteins, Wnt10b or Sirt1, between groups (Figure 3b-c). Given that cells necessarily exit the cell cycle to begin differentiation, we hypothesized that differences in cell number may be due to differences in the proliferative window at the start of adipogenesis, before cells exit the cell cycle and stop proliferating (within ~48 hours of adipogenic induction).(34) We found a group by time interaction with repeated measures over 7 days of adipogenesis (F=2.65, p=0.047), where Ob-MSC proliferation was 62% lower at d2 of adipogenic induction (F=2.71, p=0.008; Figure 3d). The decline in proliferation, calculated as d2/d0 measures, was inversely correlated with adipocyte CSA (r=0.42, p=0.02; Figure 3e).
Figure 3. Ob-MSCs have faster decline in proliferation during adipogenesis.

MSC proliferation rates were determined by BrdU incorporation in undifferentiated MSCs over the 24h ‘rest’ period before adipogenic induction (A). Protein content of Wnt10b (B) and Sirt1 (C) were measured in undifferentiated MSCS. BrdU incorporation was then measured during the course of adipogenesis (D). Data are shown as mean ± SEM. *indicates significant difference between NW- and Ob-MSC, determined by mixed model with repeated measures analysis (P<0.05). Cells from infants of mothers with GDM are indicated in red.
Zfp423 and Pref1 are elevated in MSCs from infants born to mothers with obesity
To assess regulators of the observed adipocyte phenotypes, in undifferentiated cells we measured Zfp423 (a robust driver of adipogenesis),(35) Ezh2 (which epigenetically regulates Zfp423),(14) and Pref1 (a pre-adipocyte marker downregulated in stromovascular cells from animal models of maternal obesity).(5, 17) Ob-MSCs had higher Zfp423 (t=3.83, p=0.0006) and Pref1 (t=3.53, p=0.001), but Ezh2 (p=0.478) was not different between groups (Figure 4).
Figure 4. Zfp423 and Pref1 are elevated in MSCs from infants born to mothers with obesity.

ZFP423 (A), Pref1 (B), and Ezh2 (C) adipogenesis regulators were measured by ProteinSimple Simple Western in undifferentiated MSCs. Data are mean ± SEM. *indicates significant difference between NW- and Ob-MSC (P<0.05). Cells from infants of mothers with GDM are indicated in red.
Zfp423 protein is associated with cell cycle, inflammatory, metabolism, and differentiation pathways
We first performed RNAseq analysis comparing mRNA abundance in undifferentiated NW- vs. Ob-MSCs to identify genes associated with maternal obesity but observed no difference. Given variation within groups, it is likely that obesity alone is not a primary driver of MSC adipogenesis phenotype. Therefore, we tested association of Zfp423 protein with gene expression in undifferentiated MSCs to identify genes related to adipogenesis phenotype (Figure 5). Linear regression models revealed Zfp423 protein content was associated with expression of 564 genes (FDR<0.1, Figure 5b, Table S5).
Figure 5. Zfp423 protein is associated with cell cycle, inflammatory, metabolism, and differentiation pathways.

MSC Zfp423 protein content was associated with gene expression measured by RNA-seq (A). The volcano plot shows significant (FDR<0.1) genes in green (B), gene names are in Table S5. Top pathways are shown from the enrichment analysis for Reactome pathways (C). All Reactome pathways associated with Zfp423 are shown in (D), with red indicating positive association and blue indicating negative association. Full results and gene IDs are shown in Tables S6-S8.
ORA for genes with signficant positive association with Zfp423 protein revealed enrichment of mitosis and cell cycle pathways in GO Biological Processes (Table S6) and Reactome Pathways (Figure 5c, Table S7). GSEA of Reactome Pathways revealed similar patterns of mitosis pathway upregulation (Figure 5d, Table S8), where Zfp423 protein was positively associated with cell cycle and immunoregulatory pathways and negatively associated with inflammatory (toll-like receptor signaling and major histocompatibility complex-mediated antigen processing), metabolism (molecular target of rapamycin and protein kinase B/Akt signaling), and differentiation pathways (β-catenin cascade).
MSC adipogenesis phenotype is associated with offspring adiponectin
Adipocyte size traits (i.e., minimum, maximum, and average CSA) were not associated with infant or child body composition (Table S9). However, these CSA traits were associated with child serum measures, which was consistent across cell traits: minimum CSA (F=140.4, p=0.001), maximum CSA (F=226.1, p=0.0005), and average CSA (F=233.8, p=0.0005). This was driven by CSA associations with adiponectin: minimum CSA (F=10.26, p=0.033, Figure 6a), maximum CSA (F=33.06, p=0.005, Figure 6b), and average CSA (F=47.41, p=0.002, Figure 6c).
Figure 6. MSC adipogenesis phenotype is associated with offspring adiponectin.

Individual cell size measures were used to determine association with offspring adiposity at birth and age 4-6 years or child blood traits insulin and adiponectin. Data are scatter plots for the association of child adiponectin with minimum (A), maximum (B) and mean (C) cell CSA. Though F statistics for the MANOVA are reported in the text, scatterplots display Pearson correlation statistics. Full analyses are shown in Table S9. Cells from infants of mothers with GDM are indicated in red.
DISCUSSION
Previously, we and others have shown greater protein markers of adipogenesis and lipid content during in vitro adipogenesis in MSCs from human infants exposed to intrauterine obesity.(3, 8, 9) Here, we developed a 3D cell culture model to study adipocyte morphology in stem cells from human infants. For the first time, we show this ‘greater adipogenic propensity’ is characterized by hypertrophy and reduced proliferation in Ob-MSCs. RNAseq analysis revealed Zfp423 protein abundance was associated with gene expression for cell cycle, MSC lineage specification, and metabolism pathways. Across all MSC lines, several adipocyte size measures were associated with serum cardiometabolic measures in early childhood, which could indicate long-term health consequences.
In vivo, adipose expansion occurs by hyperplasia through recruitment of tissue-resident progenitor cells, and by hypertrophy of existing adipocytes. During fetal development, adipose tissue and most adipose-resident progenitors develop from fetal MSCs. Thus, early developmental perturbations to the MSC niche could have substantial long-term impacts on adipose and other mesodermal tissues.(19) In rodent models of maternal obesity, offspring adipocyte hypertrophy is accompanied by increased pro-inflammatory gene expression in fetal(12) and adult(10) offspring adipose tissue. Liang et al.(10) showed weanlings of high fat-fed dams had early accelerated adipocyte hyperplasia compared to control-fed offspring, but reduced progenitor density and greater hypertrophy when re-challenged with postnatal high fat diet. Similarly, we did not observe differences in proliferation in undifferentiated MSCs, but when challenged with adipogenesis in vitro, proliferation rates declined faster and cells were larger in Ob- vs. NW-MSCs. Though our results demonstrate perturbations to fetal MSCs that may impact developmental adipogenesis, we can only speculate how these changes may impact adipogenesis of tissue-resident progenitors later in life.
We did not observe group differences in our RNA-seq analysis that would explain adipocyte phenotypic differences. However, gestational obesity only approximates intrauterine metabolic stress; we did not explicitly address circulating factors biologically impacting fetal development, such as glucose or lipids. Variation in metabolic exposure likely contributes to variation in MSC adipocyte phenotype, which may explain our success exploring associations of gene expression with Zfp423—a key transcription factor regulating adipogenesis.(35) In animal models, greater adipogenesis in offspring of obese dams has been attributed to promoter hypomethylation and increased expression of Zfp423,(5, 10, 14); our results are the first to demonstrate elevated Zfp423 protein in samples from human infants exposed to intrauterine obesity. Moreover, Zfp423 was associated with the expression of over 500 genes—particularly in cell cycle pathways, which may indicate Zpf423-linked perturbation to proliferation and mitosis. Though Zfp423 is well-known in the metabolic field for regulation of adipogenesis,(35) it is also linked to regulation of cell cycle progression and proliferation in other tissues.(36, 37) Of note, Zfp423 regulates proliferation of skeletal muscle satellite cells.(36) We did not observe differences in proliferation or proteins regulating proliferation (Wnt10b, Sirt1) in undifferentiated cells, though proliferation rates declined faster in Ob- vs. NW-MSCs during early adipogenesis. Zhao et al.(34) describe this ‘proliferative window’ as the 24-72h after adipogenic induction when cells stop proliferating, committing to both cell cycle exit and terminal adipogenesis. Even in the OP9 immortalized cell line there is heterogeneity in the proliferative window, where a shorter window results in fewer differentiated cells.(34) Though all of our cell lines are >98% positive for MSC markers, it is possible that differences in the heterogeneous MSC pool may partially account for differences in adipogenesis. Overall, we interpret our results to mean that cell lines with higher levels of Zfp423 (Ob-MSCs) have a shorter proliferative window upon experimental adipogenesis, which may partly explain the reduced cell numbers in Ob-MSCs. However, it is also possible that expansion of the entire hydrogel may have contributed to smaller cell count/area measured. Nevertheless, our proliferation results may indicate Ob-MSCs are exiting the cell cycle and entering adipogenesis earlier, which suggests early preadipocyte senescence and reduced progenitor density like that observed in animal models of maternal obesity.(8, 13) In fact, Zfp423 has been shown to regulate earlier adipogenesis in fetal progenitor cells.(14) Moreover, in adults with established obesity, adipocyte hypertrophy is associated with induction of cell cycle genes in adipocytes, and obesity complicated by hyperinsulinemia is linked to adipocyte senescence.(18)
Pref1 inhibits adipogenesis to maintain the preadipocyte state,(38) and was elevated in undifferentiated Ob- vs. NW-MSCs. Pref1 is typically reduced in adipose-derived progenitors in animal models of maternal obesity.(5, 17) Borengasser et al.(5) showed reduced Pref1 in adipose-derived progenitors from weanlings exposed to maternal high fat diet, but elevated Pref1 in adult offspring. Nevertheless, progenitors from both weanlings and adults elicited greater adipogenesis in vitro, compared to controls. Thus, cell or tissue maturity may affect Pref1 function. Indeed, although Pref1 inhibits adipogenesis in 3T3-L1 preadipocytes, in MSC-like C3H10T1/2 cells Pref1 induces adipogenesis.(39) Therefore, discrepancies between adipose progenitors from animal models and our MSC data may be explained by stemness or cell origin.
Adipocyte size was inversely associated with child adiponectin levels, consistent with inverse relationships between adiponectin and obesity in children(40-42) and adults.(43, 44) Our findings suggest this relationship may manifest early in life. Contrary to our previous report demonstrating correlation of Oil-red O staining during adipogenesis with neonatal adiposity,(3) we did not observe similar correlation of BODIPY with offspring adiposity. Methodological differences, such as duration of adipogenesis, may account for these discrepancies (21 vs. 14 days). This may also explain why PPARγ differences did not reach statistical significance here, though we previously reported differences.(3) Nevertheless, our lack of association between adipocyte size or lipid content and child adiposity tempers our conclusions and additional studies with a larger sample size are warranted.
In conclusion, MSCs from infants of exposed to gestational obesity have an intrinsic propensity for adipocyte hypertrophy and reduced hyperplasia when undergoing 3-dimensional adipogenesis in vitro. This extends our previous report demonstrating elevated lipid content during 2-dimensional adipogenesis.(3) Such disruption to infant MSC progenitors may contribute to childhood obesity and metabolic disease risk. Further investigation in larger sample sizes is warranted to identify specific gestational exposures contributing to infant MSC adipocyte hypertrophy. Furthermore, investigating the metabolic consequences of MSC adipocyte hypertrophy on insulin resistance and pro-inflammatory pathway induction in vitro is an important area of future research to elucidate how gestational metabolic stress impacts child susceptibility to metabolic disease.
Supplementary Material
What is known about this subject?
Exposure to obesity in utero increases risk for fetal overgrowth and childhood obesity and related metabolic disease.
Fetal mesenchymal stem cells (MSCs) develop into mesodermal tissues, such as adipose and skeletal muscle.
When differentiated to adipocytes in vitro, fat content of infant, umbilical cord-derived MSCs predicts adiposity in children through 4–6 years of age.
What are new findings in this manuscript?
MSCs from infants exposed to obesity in utero (Ob-MSCs) develop into larger, yet fewer adipocytes in vitro, compared with MSCs from infants exposed to normal weight (NW-MSCs).
Ob-MSCs have a shorter proliferative window than NW-MSCs during adipogenesis, which may account for some difference in cell numbers.
Adipogenesis regulator zinc finger protein 423 is elevated in Ob-MSCs and correlated with cell cycle, MSC lineage specification, and inflammation pathways in RNA sequencing analysis.
How might your results change the direction of research or the focus of clinical practice?
Understanding the metabolic consequences of infant progenitor cell perturbations, including adipocyte hypertrophy and related insulin resistance and pro-inflammatory pathway induction, is important for future research that will elucidate how metabolic stress during pregnancy increases child susceptibility to metabolic disease.
ACKNOWLEDGEMENTS
The authors thank the Healthy Start Study team at the Colorado School of Public Health, University of Colorado and the Healthy Start participants for their hard work and dedication to this study. We thank Cheyret Wood for coding assistance for the gene expression analysis.
Funding:
This study is supported by NIH R01DK117168 to KEB, the American Diabetes Association (1-18-ITCS-016 to KEB) and the Environmental Influences on Child Health Outcomes (ECHO) Program (NIH 1UG3OD023248 to DD). The Healthy Start BabyBUMP Project is supported by grants from the American Heart Association (predoctoral fellowship 14PRE18230008) and by the parent Healthy Start Study (NIH R01 DK076648 to DD), and the Colorado Clinical and Translational Sciences Institute (UL1 TR001082) for maternal visits and collection of birth measures. The Advanced Light Microscopy Core ALMC, for confocal imaging is supported in part by Rocky Mountain Neurological Disorders Core Grant Number P30 NS048154 and by Diabetes Research Center Grant Number P30 DK116073. The CU Anschutz Genomics Shared Resource that analyzed the RNA sequencing is supported by CU Anschutz Cancer Center (P30CA046934). The funders had no influence on the results of the study.
Footnotes
Conflict of Interest: No potential conflicts of interest relevant to this article were reported.
Clinical Trials Registration: NCT02273297
REFERENCES
- 1.Gaudet L, Ferraro ZM, Wen SW, Walker M. Maternal Obesity and Occurrence of Fetal Macrosomia: A Systematic Review and Meta-Analysis. Biomed Res Int 2014;2014:640291. [DOI] [PMC free article] [PubMed] [Google Scholar]
- 2.Gaillard R, Felix JF, Duijts L, Jaddoe VWV. Childhood consequences of maternal obesity and excessive weight gain during pregnancy. Acta Obstet Gyn Scan 2014;93:1085–1089. [DOI] [PubMed] [Google Scholar]
- 3.Boyle KE, Patinkin ZW, Shapiro ALB, Baker PR, Dabelea D, Friedman JE. Mesenchymal Stem Cells From Infants Born to Obese Mothers Exhibit Greater Potential for Adipogenesis: The Healthy Start BabyBUMP Project. Diabetes 2016;65:647–659. [DOI] [PMC free article] [PubMed] [Google Scholar]
- 4.MODI N, MURGASOVA D, RUAGER-MARTIN R, et al. The Influence of Maternal Body Mass Index on Infant Adiposity and Hepatic Lipid Content. Pediatr Res 2011;70:287–291. [DOI] [PubMed] [Google Scholar]
- 5.Borengasser SJ, Zhong Y, Kang P, et al. Maternal Obesity Enhances White Adipose Tissue Differentiation and Alters Genome-Scale DNA Methylation in Male Rat Offspring. Endocrinology 2013;154:4113–4125. [DOI] [PMC free article] [PubMed] [Google Scholar]
- 6.Fernandez-Twinn DS, Alfaradhi MZ, Martin-Gronert MS, et al. Downregulation of IRS-1 in adipose tissue of offspring of obese mice is programmed cell-autonomously through post-transcriptional mechanisms. Mol Metab 2014;3:325–333. [DOI] [PMC free article] [PubMed] [Google Scholar]
- 7.Schultz NS, Broholm C, Gillberg L, et al. Impaired Leptin Gene Expression and Release in Cultured Preadipocytes Isolated From Individuals Born With Low Birth Weight. Diabetes 2013;63:111–121. [DOI] [PubMed] [Google Scholar]
- 8.Chen J-R, Lazarenko OP, Blackburn ML, et al. Maternal Obesity Programs Senescence Signaling and Glucose Metabolism in Osteo-Progenitors From Rat and Human. Endocrinology 2016;157:4172–4183. [DOI] [PubMed] [Google Scholar]
- 9.Iaffaldano L, Nardelli C, Raia M, et al. High Aminopeptidase N/CD13 Levels Characterize Human Amniotic Mesenchymal Stem Cells and Drive Their Increased Adipogenic Potential in Obese Women. Stem Cells Dev 2013;22:2287–2297. [DOI] [PMC free article] [PubMed] [Google Scholar]
- 10.Liang X, Yang Q, Fu X, et al. Maternal obesity epigenetically alters visceral fat progenitor cell properties in male offspring mice. J Physiology 2016;594:4453–4466. [DOI] [PMC free article] [PubMed] [Google Scholar]
- 11.Sellayah D, Thomas H, Lanham SA, Cagampang FR. Maternal Obesity During Pregnancy and Lactation Influences Offspring Obesogenic Adipogenesis but Not Developmental Adipogenesis in Mice. Nutrients 2019;11:495. [DOI] [PMC free article] [PubMed] [Google Scholar]
- 12.Murabayashi N, Sugiyama T, Zhang L, et al. Maternal high-fat diets cause insulin resistance through inflammatory changes in fetal adipose tissue. Eur J Obstet Gyn R B 2013;169:39–44. [DOI] [PubMed] [Google Scholar]
- 13.Liang X, Yang Q, Fu X, Rogers C, Zhu M, Du M. Maternal obesity reduces adipogenic progenitor density and DNA methylation of Zpf423 promoter in the visceral fat of offspring mice (LB770). Faseb J 2014;28. [Google Scholar]
- 14.Yang Q-Y, Liang J-F, Rogers CJ, Zhao J-X, Zhu M-J, Du M. Maternal Obesity Induces Epigenetic Modifications to Facilitate Zfp423 Expression and Enhance Adipogenic Differentiation in Fetal Mice. Diabetes 2013;62:3727–3735. [DOI] [PMC free article] [PubMed] [Google Scholar]
- 15.Yan X, Huang Y, Zhao J-X, et al. Maternal Obesity-Impaired Insulin Signaling in Sheep and Induced Lipid Accumulation and Fibrosis in Skeletal Muscle of Offspring1. Biol Reprod 2011;85:172–178. [DOI] [PMC free article] [PubMed] [Google Scholar]
- 16.McCurdy CE, Bishop JM, Williams SM, et al. Maternal high-fat diet triggers lipotoxicity in the fetal livers of nonhuman primates. J Clin Invest 2009;119:323–335. [DOI] [PMC free article] [PubMed] [Google Scholar]
- 17.Litzenburger T, Huber E-K, Dinger K, et al. Maternal high-fat diet induces long-term obesity with sex-dependent metabolic programming of adipocyte differentiation, hypertrophy and dysfunction in the offspring. Clin Sci 2020;134:921–939. [DOI] [PubMed] [Google Scholar]
- 18.Li Q, Hagberg CE, Cascales HS, et al. Obesity and hyperinsulinemia drive adipocytes to activate a cell cycle program and senesce. Nat Med 2021;27:1941–1953. [DOI] [PubMed] [Google Scholar]
- 19.Scheidl TB, Brightwell AL, Easson SH, Thompson JA. Maternal obesity and programming of metabolic syndrome in the offspring: searching for mechanisms in the adipocyte progenitor pool. Bmc Med 2023;21:50. [DOI] [PMC free article] [PubMed] [Google Scholar]
- 20.Gyllenhammer LE, Duensing AM, Keleher MR, Kechris K, Dabelea D, Boyle KE. Fat content in infant mesenchymal stem cells prospectively associates with childhood adiposity and fasting glucose. Obesity 2023;31:37–42. [DOI] [PMC free article] [PubMed] [Google Scholar]
- 21.Landgraf K, Rockstroh D, Wagner IV, et al. Evidence of Early Alterations in Adipose Tissue Biology and Function and Its Association With Obesity-Related Inflammation and Insulin Resistance in Children. Diabetes 2014;64:1249–1261. [DOI] [PubMed] [Google Scholar]
- 22.Eriksson-Hogling D, Andersson DP, Bäckdahl J, et al. Adipose tissue morphology predicts improved insulin sensitivity following moderate or pronounced weight loss. Int J Obesity 2015;39:893–898. [DOI] [PubMed] [Google Scholar]
- 23.Starling AP, Brinton JT, Glueck DH, et al. Associations of maternal BMI and gestational weight gain with neonatal adiposity in the Healthy Start study. Am J Clin Nutrition 2014;101:302–309. [DOI] [PMC free article] [PubMed] [Google Scholar]
- 24.Dominici M, Blanc KL, Mueller I, et al. Minimal criteria for defining multipotent mesenchymal stromal cells. The International Society for Cellular Therapy position statement. Cytotherapy 2006;8:315–317. [DOI] [PubMed] [Google Scholar]
- 25.Janderová L, McNeil M, Murrell AN, Mynatt RL, Smith SR. Human Mesenchymal Stem Cells as an in Vitro Model for Human Adipogenesis. Obes Res 2003;11:65–74. [DOI] [PubMed] [Google Scholar]
- 26.Emont MP, Yu H, Jun H, et al. Using a 3D Culture System to Differentiate Visceral Adipocytes In Vitro. Endocrinology 2015;156:4761–4768. [DOI] [PMC free article] [PubMed] [Google Scholar]
- 27.Daquinag AC, Souza GR, Kolonin MG. Adipose Tissue Engineering in Three-Dimensional Levitation Tissue Culture System Based on Magnetic Nanoparticles. Tissue Eng Part C Methods 2013;19:336–344. [DOI] [PMC free article] [PubMed] [Google Scholar]
- 28.Schindelin J, Arganda-Carreras I, Frise E, et al. Fiji: an open-source platform for biological-image analysis. Nat Methods 2012;9:676–682. [DOI] [PMC free article] [PubMed] [Google Scholar]
- 29.Martin M. Cutadapt removes adapter sequences from high-throughput sequencing reads. Embnet J 2011;17:10–12. [Google Scholar]
- 30.Li B, Dewey CN. RSEM: accurate transcript quantification from RNA-Seq data with or without a reference genome. Bmc Bioinformatics 2011;12:323. [DOI] [PMC free article] [PubMed] [Google Scholar]
- 31.Merico D, Isserlin R, Stueker O, Emili A, Bader GD. Enrichment Map: A Network-Based Method for Gene-Set Enrichment Visualization and Interpretation. Plos One 2010;5:e13984. [DOI] [PMC free article] [PubMed] [Google Scholar]
- 32.Shannon P, Markiel A, Ozier O, et al. Cytoscape: A Software Environment for Integrated Models of Biomolecular Interaction Networks. Genome Res 2003;13:2498–2504. [DOI] [PMC free article] [PubMed] [Google Scholar]
- 33.Stenkula KG, Erlanson-Albertsson C. Adipose cell size: importance in health and disease. Am J Physiology-regulatory Integr Comp Physiology 2018;315:R284–R295. [DOI] [PubMed] [Google Scholar]
- 34.Zhao ML, Rabiee A, Kovary KM, Bahrami-Nejad Z, Taylor B, Teruel MN. Molecular Competition in G1 Controls When Cells Simultaneously Commit to Terminally Differentiate and Exit the Cell Cycle. Cell Reports 2020;31:107769. [DOI] [PMC free article] [PubMed] [Google Scholar]
- 35.Gupta RK, Arany Z, Seale P, et al. Transcriptional control of preadipocyte determination by Zfp423. Nature 2010;464:619–623. [DOI] [PMC free article] [PubMed] [Google Scholar]
- 36.Addison WN, Hall KC, Kokabu S, et al. Zfp423 Regulates Skeletal Muscle Regeneration and Proliferation. Mol Cell Biol 2019;39:e00447–18. [DOI] [PMC free article] [PubMed] [Google Scholar]
- 37.Casoni F, Croci L, Bosone C, et al. Zfp423/ZNF423 regulates cell cycle progression, the mode of cell division and the DNA-damage response in Purkinje neuron progenitors. Development 2017;144:3686–3697. [DOI] [PMC free article] [PubMed] [Google Scholar]
- 38.Wang Y, Kim K-A, Kim J-H, Sul HS. Pref-1, a Preadipocyte Secreted Factor That Inhibits Adipogenesis. J Nutrition 2006;136:2953–2956. [DOI] [PubMed] [Google Scholar]
- 39.Nueda M-L, Baladrón V, Sánchez-Solana B, Ballesteros M-Á, Laborda J. The EGF-like Protein dlk1 Inhibits Notch Signaling and Potentiates Adipogenesis of Mesenchymal Cells. J Mol Biol 2007;367:1281–1293. [DOI] [PubMed] [Google Scholar]
- 40.Stefan N, Bunt JC, Salbe AD, Funahashi T, Matsuzawa Y, Tataranni PA. Plasma Adiponectin Concentrations in Children: Relationships with Obesity and Insulinemia. J Clin Endocrinol Metabolism 2002;87:4652–4656. [DOI] [PubMed] [Google Scholar]
- 41.Brambilla P, Antolini L, Street ME, et al. Adiponectin and Hypertension in Normal-Weight and Obese Children. Am J Hypertens 2013;26:257–264. [DOI] [PubMed] [Google Scholar]
- 42.Kardas F, Kendirci M, Kurtoglu S. Cardiometabolic Risk Factors Related to Vitamin D and Adiponectin in Obese Children and Adolescents. Int J Endocrinol 2013;2013:503270. [DOI] [PMC free article] [PubMed] [Google Scholar]
- 43.Monickaraj F, Gokulakrishnan K, Prabu P, et al. Convergence of adipocyte hypertrophy, telomere shortening and hypoadiponectinemia in obese subjects and in patients with type 2 diabetes. Clin Biochem 2012;45:1432–1438. [DOI] [PubMed] [Google Scholar]
- 44.Ryan AS, Berman DM, Nicklas BJ, et al. Plasma Adiponectin and Leptin Levels, Body Composition, and Glucose Utilization in Adult Women With Wide Ranges of Age and Obesity. Diabetes Care 2003;26:2383–2388. [DOI] [PubMed] [Google Scholar]
Associated Data
This section collects any data citations, data availability statements, or supplementary materials included in this article.