

Abstract
Objective:
The purpose of this review was to assess the impact of socioeconomic status (SES) on injury and to evaluate how U.S. injury researchers have measured SES over the past 13 years in observational research studies.
Design & methods:
This systematic review included 119 US injury studies indexed in PubMed between January 1, 2002 and August 31, 2015 that used one or more individual and/or area-level measures of SES as independent variables. Study findings were compared to the results of a previous review published in 2002.
Results:
Findings indicate SES remains an important predictor of injury. SES was inversely related to injury in 78 (66%) of the studies; inverse relationships were more consistently found in studies of fatal injury (77.4%) than in studies of nonfatal injury (58%). Approximately two-thirds of the studies (n = 73, 61%) measured SES along a gradient and 59% used more than one measure of SES (n = 70). Studies that used a gradient measure of SES and/or more than one measure of SES identified significant relationships more often. These findings were essentially equivalent to those of a similar 2002 review (Cubbin & Smith, 2002).
Conclusions:
There remains a need to improve measurement of SES in injury research. Public health training programs should include best practices for measurement of SES, which include: measuring SES along a gradient, selecting SES indicators based on the injury mechanism, using the smallest geographic region possible for area-level measures, using multiple indicators when possible, and using both individual and area-level measures as both contribute independently to injury risk. Area-level indicators of SES are not accurate estimates of individual-level SES.
Practical applications:
Injury researchers should measure SES along a gradient and incorporate individual and area-level SES measures that are appropriate to the injury outcome under study.
Keywords: Measurement of socioeconomic status, Injury research methodology, Injury, Socioeconomic Status, Measurement, Methodology, Systematic Review
1. Introduction
The association between socioeconomic status (SES) and health outcomes has been observed for decades, and continues to be a major area of investigation in many areas of public health (Glymour, Avendano, & Kawachi, 2014). One of the four overarching goals of Healthy People 2020 is to achieve health equity, eliminate disparities, and improve the health of all groups; within this goal, disparities are defined as a type of health difference that is closely linked with social, economic, and/or environmental disadvantage (U.S. Department of Health and Human Services Office of Disease Prevention and Health Promotion, 2015). Despite research and prevention efforts, injuries continue to disproportionately affect individuals and neighborhoods with lower SES (Centers for Disease Control and Prevention [CDC], 2013; Cubbin, LeClere, & Smith, 2000).
1.1. Definition of injury
The World Health Organization defines injury as “the physical damage that results when a human body is suddenly or briefly subjected to intolerable levels of energy” (Holder et al., 2001). In the United States in 2015, injuries were the leading killer of people ages 1 to 44, accounting for 214,008 deaths and 31.8 million emergency room visits (CDC-National Center for Injury Prevention and Control, 2017). Over 3 million of these individuals received further hospital or rehabilitation care; and injuries were responsible for 671 billion dollars of total lifetime medical and work loss costs (Florence, Haegerich, Simon, Zhou, & Luo, 2015).
1.2. Definition of SES
While there is no single definition of SES, and there is no one standard for measurement (Oakes & Rossi, 2003), for the purposes of this review this general definition is used: “SES is an indicator of an individual’s social and economic standing in society and often is determined by a combination of ratings on occupational status, income level, and education (Cralley, 2007).” SES is considered an important predictor of health and wellbeing across public health disciplines (Glymour et al., 2014). Individuals with high SES are likely to have more advanced education, work in prestigious positions, and earn higher salaries than individuals with low SES. These individuals have greater access to resources that can contribute to their success and to the perpetuation of similar benefits for their families (Cralley, 2007, p. 928).
SES shows a consistent inverse relationship with many types of injury (Bell, Arrington, & Adams, 2015; Denney & He, 2014). The pathways between SES and injury, as well as other health outcomes, may be causal, can indicate reverse causation (e.g., greater exposure to injury lessens one’s ability to earn money or advance one’s education), and can be confounded by third variables (Glymour et al., 2014). For example, individuals with lower educational attainment and family wealth are more likely to work in jobs with higher injury risk, such as construction, production, and mining than individuals from higher SES backgrounds (Krieger, 2010); these jobs also pay less, and during times when workers are injured, they may earn nothing at all. Children from families with lower SES are less likely to be restrained in child safety seats than children from families with higher indicators of SES (Macy & Freed, 2012). Lower safety seat utilization among families with fewer financial resources is attributable to a multitude of socioeconomic factors, including: income, which can affect the family’s ability to purchase a seat (Winston, Chen, Smith, & Elliott, 2006); education, which can impact both using the seat correctly and access to the recommendations for child passenger safety (Bilston, Finch, Hatfield, & Brown, 2008; Wegner & Girasek, 2003; Winston et al., 2006); and sociocultural norms about use of child safety seats in the community (Johnston et al., 2008; Macy & Freed, 2012), among other factors. In other words, there is not always a clear causal link between particular measures of SES and injury, rather there is a “web of causation” between SES and injury.
1.3. Methodological considerations for the measurement of SES
A number of individual- and household-level variables have been used to assess SES in injury research (Cubbin et al., 2000), including income, educational attainment, occupational or employment status, health insurance status, and wealth. Studies also employ area-level measures of SES such as poverty, concentrated poverty, income inequality, unemployment rates, and educational attainment. Each of these factors varies in terms of their ease of measurement, usefulness, meaning and relationship to health status overall and injury risk specifically.
Use of inadequate measures of SES in health and injury research is widespread (Braveman et al., 2005; Cubbin et al., 2000; Shavers, 2007). This occurs for many reasons, but commonly this is due to a lack of available data or insufficient inclusion of appropriate measures (or conceptualization of the measures) for the causal pathway under investigation (Braveman et al., 2005; Shavers, 2007). Additionally, while SES is often operationalized in a binary way that compares individuals considered to be poor to those who are not, it is important to note that SES generally has a graded association to health outcomes (Adler et al., 1994).
Studies of racial/ethnic disparities in injury require accounting for the role of SES. Severe socioeconomic disparities between racial/ethnic groups persist, causing potential confounding by socioeconomic variables in studies comparing injury and health outcomes between racial groups (Kaufman, Cooper, & McGee, 1997). As SES is often inadequately measured and/or poorly conceptualized in studies of health, racial/ethnic differences in health often persist after ‘controlling’ for socioeconomic variables (Cubbin & Smith, 2002). As stated by Oakes and Rossi (2003, p. 770), in the absence of appropriate measurement of SES, “racial/ethnic disparities may continue to be construed as signs of genetic differences or behavioral choices rather than powerful clues about how forms of racial discrimination and structural constraints, past and present, harm health.”
1.4. Purpose statement
Cubbin and Smith (2002) reviewed epidemiological, population-based studies investigating the link between SES and injury from 1960 to 2001. This review was intended to provide a critical examination of the methods and measures of SES in studies of injury; the results elucidated important methodological concerns. The purpose of the current study is to update this review to assess whether the U.S. injury research field has improved along the lines recommended by Cubbin and Smith in terms of accounting for the effects of SES. The topic remains important to the field, as there is evidence that SES disparities persist and may be widening across many health outcomes and across racial lines (Braveman, Cubbin, Egerter, Williams, & Pamuk, 2010; Laflamme, Hasselberg, & Burrows, 2010; Singh & Kogan, 2007).
2. Methods
2.1. Locating articles for review
On September 15, 2015 a search of the PubMed database (National Library of Medicine, 2012) was conducted using the following key injury Medical Subject Heading (MeSH) terms: “wounds and injuries,” “suicide,” “homicide,” “violence,” and “poisoning” and these SES terms: “socioeconomic factors,” “wealth,” “deprivation,” “crowding,” “housing,” “occupation,” and “rent.” Within PubMed the MeSH term “wounds and injuries” encompasses all types of bodily injury, as well as burns, submersions and drownings, asphyxia (suffocation) and a number of additional terms. Similarly, the MeSH term “socioeconomic factors” includes: employment and employment characteristics (e.g., career mobility, unemployment), family characteristics, education, income, poverty, and social class and conditions, among other relevant terms. The search terms “US, USA or United States” were added to eliminate many of the studies from other countries. This search returned 4172 studies. Study abstracts, and the full studies when necessary, were reviewed to determine whether they met the inclusion criteria.
2.2. Inclusion criteria
Original, peer-reviewed studies from the United States were retained for analysis if they were: indexed in PubMed between January 1, 2002 and August 31, 2015, focused on predictors/correlates of an injury outcome, and included one or more individual or area-level measures of SES as independent, mediating, moderating, or control variables. Articles were eliminated if they were intervention studies, case reports, comments, controlled trials, reviews or meta-analyses. Studies with an outcome variable such as violence, crime, abuse/maltreatment, suicide attempt, or collision (as opposed to actual injuries) were eliminated because injuries did not necessarily occur during these events. Studies of alcohol or drug overdose with no physical injury were not included. Studies where there could be no or very little variation in SES, including studies of institutionalized populations (e.g., prisoners) or occupational studies of a single occupation, and studies which only conducted descriptive analyses of the SES variables, were not included. Studies from the military were retained if rank and/or another measure of SES was utilized. Similarly, in studies of occupational injury, the studies were retained if there was a hierarchical assessment of the occupations (as opposed to a listing of occupations) or another measure of SES. Studies of poisoning were included as the prevention of poisoning often falls within the purview of injury prevention professionals, and are included in the scope of the CDC’s National Center for Injury Prevention and Control (CDC - NCIPC, 2015). As the primary focus was individual and area measures of SES, studies that only examined large macro-level SES, such as gross domestic product or state/national unemployment rates, were eliminated. Studies of injuries secondary to a medical condition, such as cancer or osteoporosis, were eliminated.
2.3. Categorization, definitions, and analysis strategy
Studies were grouped into studies of fatal injury, studies of non-fatal injury, or studies that included both fatal and non-fatal injury. The results of the review were then categorized according to level of analysis (individual or ecological). Individual-level studies examined the injury and SES variables among individuals, including those that use area-based SES measures as a proxy for individual-level SES. Ecological studies examined the injury and SES variables at the area-level (e.g., county, zip code, Census tract). There were two multilevel studies that did not employ SES variables at both levels; these were reviewed as ecological studies (Frye et al., 2008; Hemenway, Barber, & Miller, 2010), as the SES variables of interest were used at the ecological level.
Studies were then assessed according to multiple criteria, and the individual, and area-level measures of SES were coded and tallied. Individual-level SES measures included: income, poverty, education, employment status, health insurance status, housing status (e.g., own a home, rent, homeless), job class, composite or ratio measures (e.g., income to needs ratio), and net worth or wealth. Area measures included income, poverty, education, employment, insurance status, property value/rent, housing status, and composite measures or indices of deprivation or inequality, measured at the block group, tract, ZIP code, city or county level. Study samples were categorized by age group (e.g., child, adult, all ages). The data source and sample size were identified. Geographic coverage of the data set was coded (e.g., national, state, county, hospital). Injury intent was classified as intentional, unintentional or all intents, which includes studies that did not specify an intent. National Health Interview Survey data do not specify an intent, but the injuries reported are most often unintentional injuries, so these studies were classified as studies of unintentional injury.
A study was considered to use income as an SES measure if the study included any measure of income, either by self-report or area-level census measure. If a study used level of income to assess whether an individual, family, or area was in poverty by determining if the income was above or below a poverty designation (e.g., the Federal poverty level), this was recorded as a measure of poverty, not income. Studies were also considered to measure poverty if they assessed whether participants qualified for Medicaid or other government assistance programs. Job titles alone were not considered measures of SES; however, classifications of jobs that could establish a hierarchy in terms of status or earnings were counted as measures of SES. Insurance status refers only to health insurance status, which is considered a measure of SES; however, meeting criteria to qualify for a public insurance program as opposed to actually having that type of insurance (e.g., meeting qualification criteria for Medicaid) was considered a measure of poverty. Index scores refer to ratios or composite measures, such as an individual-level income to needs ratio or an area-level deprivation score incorporating several measures into one.
Each study was reviewed to determine how SES was measured, and measurement strategies were classified in the following ways: whether SES was measured on a gradient; whether multiple measures of SES were used and if so; whether they included indicators of both individual- and area-level SES, and whether area-level measures of SES were used to proxy individual-level SES. Determination of whether the study measured SES along a gradient was determined by use of three or more categories in at least one of the SES measures, or by use of a continuous variable.
Results of each study were reviewed to assess the relationship between the SES measure(s) used as independent variables and the injury dependent variable. Within individual studies, relationships were coded as positive between the SES indicator and injury if as the SES indicator increased, so did the risk of injury. The study was considered to have an inverse association when an increase in the indicator of SES was associated with a decrease in the risk of injury, or vice versa. The association was defined as non-significant if the relationship was not statistically significant. The associations were found to be “mixed” if the findings were only significant (or in the same direction) for some groups in the study and not others (e.g., for males but not females). These relationships for individual indicators within studies are described in Tables 2, 3, and 4.
Table 2.
Studies of fatal injury.
| Author | Year | Data Source | Geography | Sample | Age | Design | Intent | Mechanism | Results | Gradient |
|---|---|---|---|---|---|---|---|---|---|---|
|
| ||||||||||
| Individual-level studies | ||||||||||
| Jain et al. | 2001 | National Center for Health Statistics, 1989–91 | National | 3218 | Infants | Cross-sectional | All | Injury death | Parental Education (—) | Yes |
| Putnam-Hornstein | 2011 | California CPS records and vital records for children born 1999–2006 | State | 1917 | Children | Cohort, prospective | All | Injury death | Public health insurance (+) vs. private health insurance Maternal Education (—) | No |
| Steege et al. | 2014 | Bureau ofLabor Statistics Census ofFatal Occupational Injuries, 2005–2009 | National | 26,996 | Adolescents and adults | Cross-sectional | All | Occupational related fatalities | Education (—) Wages (—) | No |
| Schnitzer & Ewigman | 2005 | Missouri Child Fatality Review, 1992–1999 | State | 447 | Children | Case-control | Intentional | Homicide, Inflicted injury fatality | Education (—) Poverty (—) | No |
| Stiffman et al. | 2002 | Missouri Child Fatality Review, 1992–1994 | State | 471 | Children | Case-control | Intentional | Homicide | Education (—) Poverty (n.s.)a | No |
| Chang et al. | 2005 | Pregnancy Mortality Surveillance System, 1991–1999 | National | 7342 | Adults | Cross-sectional | Intentional | Homicide during or within 1 year of pregnancy | Education (—) | Yes |
| Duberstein et al. | 2004 | Medical examiner’s office of 2 New York counties, 1996–2001 | Multi-county | 172 | Older Adults | Case-control | Intentional | Suicide | Income (—) Financial trouble (+) Employment (—) Education (n.s.) | No |
| Harris et al. | 2012 | National Trauma Data Bank, 2005–2008 | National | 137,658 | Adults | Cross-sectional | Intentional | Homicide | Health insurance coverage (—) | No |
| Kposowa | 2001 | US National Longitudinal Mortality Study 1979–89 | National | 471,922 | Adults | Cohort, prospective | Intentional | Suicide | Employment (—) Among men: education (—) and income (—) | Yes |
| Phillips et al. | 2010 | National Center for Health Statistics, 1979–2005 | National | US pop. | Adults | Cross-sectional time series | Intentional | Suicide | Education (—) | Yes |
| Purselle et al. | 2009 | Medical Examiner's Office, Fulton County, Georgia, 1988–2003 | County | 1377 | Adults | Cross-sectional | Intentional | Suicide | Mixed by age & racial group. Incomeb (—) among whites; Incomeb (+) among adolescents: Incomeb (—) among elderly | Yes |
| Wexler et al. | 2008 | Tribal Health Organization, Suicide Reporting Forms, 1990–2001 | Region | 254 | Adults | Cross-sectional | Intentional | Suicide, suicide attempt | Employment (—) Education (—) | No |
| Wiebe | 2003 | National Mortality Followback Survey, 1993; Controls from National Health Interview Survey, 1994 | National | 9804-homicide, 15,494- suicide | Adults | Case-control | Intentional | Homicide and suicide fatalities | For homicide: Income (—) Education (—) For suicide: Income (—) | Yes |
| Willis et al. | 2003 | National Mortality Followback Survey, 1993 | National | 1338 | Adults | Cross-sectional | Intentional | Suicide (African Americans) | Education (—) | No |
| Lo et al. | 2015 | National Mortality Followback Survey, 1993 | National | 1409 | Adolescents, adults and older adults | Cross-sectional | Intentional | Homicide (younger age at death) | Homeownership (—) Employment (+) among White victims, Employment (—) among Hispanic and Black victims | No |
| Carlberg et al. | 2012 | Linked birth and death certificates, 2000–2002 | National | 11.57 M | Infants | Cohort, retrospective | Unintentional | Death due to suffocation, asphyxiation or strangulation in bed (ASSB) | Education (—) | Yes |
| Johnson, Wilson, et al. | 2009 | Pennsylvania Dept. ofHealth Death Certificates, 1993 | State | 118 | All ages | Cross-sectional | Unintentional | Heat-related death | Educationb (n.s.) Povertyb (n.s.) | No |
| Saluja et al. | 2006 | Death certificates, medical examiner reports, newspaper clippings from CPSC, 1995–1998 | National | 678 | Children and Young Adults | Cross-sectional | Unintentional | Drowning death | Incomeb (—) when race not included in regression model; when race included incomeb (n.s.) | Yes |
| Ecological studies | ||||||||||
| Votruba & Kling | 2009 | National Death Index, fatalities among (Chicago) Gautreaux Assisted Housing Residents placed through 1994 | Neighborhood | Tracts, not specified | Children, Adolescents, Young Adults | Cohort, prospective | All | Injury fatality | Tract: Education (—) Poverty (n.s.) % households receiving government assistance (n.s.) | No |
| Cerdá et al. | 2010 | Office of the ChiefMedical Examiner, NYC, 1990–1999 | City | 74 police precincts | Adults | Cross-sectional time series | Intentional | Homicides, gun-related | Tract: Education (n.s.) | No |
| Clouston, et al. | 2014 | National Center for Health Statistics, 1968–2009 | National | 3110 | Adults | Cross-sectional time series | Intentional | Suicide | County: 5 indicators of SES as an aggregate measure (—) | Yes |
| Frye et al. | 2008 | Office of the Medical Examiner, NYC, 1990–1999 | City | 1042 | Adults | Cross-sectional | Intentional | Homicide (IPV) | Community districts: Income (—) Education (n.s.) Job Status (n.s.) Unemployment (n.s.) | Yes |
| Gibbons et al. | 2005 | National Vital Statistics, CDC, 1996–1998 | National | All US counties | Adults | Cross-sectional | Intentional | Suicide | County: Median income (—) | Yes |
| Johnson, Gruenewald, et al. | 2009 | California Death Public Use Files, 1995–2000 | State | 581 ZIP codes | Adults | Cross-sectional time series | Intentional | Suicide | ZIP Code: Income (—) in rural, more White areas, (n.s.) for other groups | No |
| McCall et al. | 2008 | FBI’s Uniform Crime Reports and Supplemental Homicide Reports (1970–2000) | National | 83 cities | Adults | Cross-sectional time series | Intentional | Homicide | City: Deprivation (+), Employment (n.s.) Income (—) Poverty (+) | Yes |
| Miller et al. | 2005 | Office of the Chief Medical Examiner, NYC, 1996 | City | 827 | Adults | Case-control | Intentional | Suicide | Community districts: Income inequality (+) for ages <35 Mean income (n.s.) | Yes |
| Robinson et al. | 2009 | Los Angeles County Dept. ofHealth Svcs. Mortality Database, 1994–2002 | County | 255 ZIP codes | Adults | Cross-sectional | Intentional | Homicide | ZIP code: Employment (—) High school dropout rate (+), Income (n.s.) | No |
| Spriggs Madkour et al. | 2010 | North Carolina Violent Death Reporting System 2004–2006 | State | 100 counties | Adults | Cross-sectional | Intentional | Homicide (IPV) | County: Disadvantage score (+) | No |
| Wu | 2009 | California Vital Statistics and Homicide Data, 1990–99 | State | 32,103 | Adults | Cross-sectional | Intentional | Homicide (IPV) | ZIP code: Social deprivation (+) Median income (—) among non-Asian groups | Yes |
| Branas et al. | 2004 | Firearm injury reporting system in three counties, containing Allentown PA, Youngstown OH, and Cedar Rapids, IH, 1994–1998 | Multi-county | 468 tracts/3 counties | All ages | Cross-sectional | Intentional | Homicide and suicide due to firearms | County: Education (mixed by county), Income (n.s.) Unemployment (mixed by county) | Yes |
| Shai & Lupinacci | 2003 | Office of the Fire Marshal, Philadelphia Fire Department 1989–2000 | City | 324 tracts | Children | Cross-sectional | Unintentional | Fire related death | Tract: Education (n.s.) Employment (n.s.) Income (—) | Yes |
n.s. refers to a non-significant relationship.
Indicates an area-level SES measure used to proxy individual-level SES.
Table 3.
Studies of non-fatal injury.
| Author | Year | Data source | Geography | Sample | Age | Design | Intent | Mechanism | Results | Gradient |
|---|---|---|---|---|---|---|---|---|---|---|
| Individual-level studies | ||||||||||
| Crandall et al. | 2010 | Fragile Families and Child Wellbeing Study, three year follow up of 1998–2000 cohort | National | 3153 | Young children | Cohort, prospective | All | Injury requiring medical attention in the first and third year oflife | Education (—) Poverty (n.s.)a Employment (n.s.) | No |
| Crandall et al. | 2006 | Fragile Families and Child Wellbeing Study, 1998–2000 cohort | National | 3808 | Young children | Cohort, prospective | All | Injury requiring medical attention in the 1st year of life | Employment (n.s.) | No |
| Grunwaldt et al. | 2011 | Emergency Department records, Children’s Hosp. ofPittsburgh, 2000–2005 | Hospital | 772 | Adults | Cross-sectional | All | Facial fracture | Income (—) Poverty (+)for violence-related fractures: | Yes |
| Johnston & Martin-Herz | 2010 | Hospital trauma registry, 2003–2004 | Hospital | 258 | Children | Cohort, prospective | All | Re-injury to index child or sibling | Education (—) Poverty (+) | Yes |
| Lee et al. | 2008 | National Survey of Children’s Health 2003–2004 | National | 15,990 | Children | Case-control | All | Injury requiring medical attention in previous year | Poverty (n.s.) | Yes |
| Leininger et al. | 2009 | National Evaluation of Welfare-to-Work Strategies (NEWWS) Child Outcomes Study, 1992–1999 | Multi-city | 1280 | Children | Cohort, prospective | All | Injury | Education (—) for 1of3 models; Employment (n.s.) Income: poverty ratio (n.s.) Welfare as child (n.s.) Health insurance (n.s.) | Yes |
| Marcin et al. | 2003 | University of California, Davis, Children’s Medical Center (UCDCMC) Trauma Registry 1988–1998 | Hospital | 3855 | Children | Cross-sectional | All | Injury hospitalization | Income (—)b, Poverty (+)b | Yes |
| Mericli et al. | 2011 | Emergency Department records, Children’s Hosp. ofPittsburgh, 2000–2005 | Hospital | 793 | Children | Case-control | All | Craniofacial fracture | Incomeb (—) Povertyb (+), | Yes |
| Schneiderman et al. | 2012 | National Survey of Child and Adolescent Well-being, 1999–2001 | National | 3440 | Children | Cross-sectional | All | Injuries requiring medical attention in 15 months following CPS investigation | Education (n.s.) Health insurance coverage (n.s.) Income (n.s.) | Yes |
| Schwebel & Brezausek | 2007 | National Institute ofChild Health and Human Development (NICHD) Study of Early Child Care | National | 7999 | Young children | Cohort, prospective | All | Injury requiring medical treatment | Income: needs ratio (n.s.) | No |
| Simon et al. | 2008 | National Health Interview Survey, 1997–2003 | National | 2.24 M | Children | Cross-sectional | All | Injury (including poisoning) requiring medical advice or treatment in prior 3 months | Area Povertyb (n.s.) Income: Federal poverty level ratio (n.s.) Poverty (n.s.) | Yes |
| Sridharan and Crandall | 2011 | Fragile Families and Child Wellbeing study, enrollment 1998–2000, followed through 2005 | National | 2397 | Children | Cohort, prospective | All | Injury requiring medical attention in the fifth year of life | Education (n.s.) Income (—) Type ofhealth insurance (n.s.) | Yes |
| Allareddy et al. | 2014 | Nationwide Emergency Department Sample (NEDS), 2008–2010 | National | 336,124 | Children and adolescents | Cross-sectional | All | Facial Fractures | Incomeb (+) for falls & assaults Incomeb (—) for Firearm, motor vehicle | Yes |
| Houston et al. | 2013 | National Survey of Home Health Aides Survey, 2007 | National | 3377 | Adults | Cross-sectional | All | Home health aides work-related injury | Hourly pay rate (+) | No |
| Kaufman et al. | 2007 | Hospital medical records and patient interviews from four burn centers, 1994–2005 | Multi-hospital | 2062 | Adults | Case-control | All | Burn (assault vs. non assault) | Education (n.s.) Employment (—) Housing status (—) | Yes |
| Keough et al. | 2001 | Hospital medical records and patient interview, 1997–1998 | Hospital | 100 | Adults | Cross-sectional | All | Injury recidivism | Education (—) Health insurance coverage (—) | Yes |
| Leff et al. | 2003 | Survey ofColorado residents, 1999–2000 | State | 2713 | Adults | Cross-sectional | All | Injury requiring medical attention in the previous year | Education (n.s.) Poverty (n.s.) | Yes |
| Xiang et al. | 2007 | National Epidemiologic Survey on Alcohol and Related Conditions, 2001–2002 | National | 43,093 | Adults | Cross-sectional | All | Injury requiring hospitalization | Among immigrants, Poverty (+) | Yes |
| Frencher et al. | 2010 | NY State Hospital Discharges, SPARCS, 2000 to 2002 | City | 1.53 M | All ages | Cross-sectional | All | Injury requiring hospital treatment | Housing status (—) | No |
| Sinclair, Smith & Xiang | 2006 | 2000–2003 National Health Interview Survey | National | 384,467 | All ages | Cross-sectional | All | Injury requiring medical attention in past three months | Education (n.s.) Poverty (n.s.) Health insurance coverage (—) among foreign born persons | Yes |
| Xiang et al. | 2012 | Nationwide Emergency Department Sample (NEDS), 2007 | National | 57,909 | All ages | Cross-sectional | All | Drug-related poisoning requiring ED admission | Incomeb (—) | Yes |
| Cheng et al. | 2003 | Injured adolescents in 2 emergency departments, 1997–2000 | Multi-hospital | 478 | Adolescents | Case-control | Intentional | Assault injury | Education (n.s.) | No |
| Faulkner et al. | 2001 | Virginia Dept. of CriminalJustice, police records 1995–1996 | Multi-city | 571 | Adults | Cohort, prospective | Intentional | Injury sustained during robbery | Building value (—) Rent (—) | No |
| Lipsky et al. | 2004 | Patient interview, 2001 | Hospital | 384 | Adults | Cross-sectional | Intentional | Violence-related injury | Education (n.s.) Employment (n.s.) | No |
| Rich & Sullivan | 2001 | Survey | Clinic | 177 | Adults | Cross-sectional | Intentional | Assault Injury | Education (—) | Yes |
| Bishai et al. | 2008 | HealthySteps, 1996–1997 | National | 3449 | Young children | Cohort, prospective | Unintentional | Injury requiring medical attention | Education (—) Income (n.s.) | Yes |
| Garzon et al. | 2008 | Parental self-report in Emergency Department, 2004 | Hospital | 124 | Children | Case-control | Unintentional | Child Injury | Income (n.s.) Education (n.s.) | No |
| Jones et al. | 2009 | NHANES Phase III (Survey 1999–2004 compared to 1988–1991 and 1991–1994) | National | 4817 | Children | Cross-sectional | Unintentional | Elevated blood lead level | Poverty (+) | No |
| Kim et al. | 2002 | Jefferson Co. Lead Poisoning Prevention Program Registry, 1991–2000 | County | 34,798 | Children | Cross-sectional | Unintentional | Elevated blood lead level | HousingValueb (—) | No |
| Malcoe et al. | 2002 | Prospective field data collection | Community | 245 | Children | Cross-sectional | Unintentional | Elevated blood lead level | Education (—) Poverty (+) | No |
| Ni et al. | 2002 | National Health Interview Survey 1997–1998 | National | 38,458 | Children | Cross-sectional | Unintentional | Recreational injury requiring medical attention | Education (+) Poverty (—) | Yes |
| Nriagu et al. | 2011 | Detroit-area WIC clinic medical records and surveys, 2006–2007 | City | 429 | Children | Cross-sectional | Unintentional | Elevated blood lead level | Paternal education (—) Maternal education (n.s.) Home ownership (—) Poverty (n.s.) | No |
| Polivka et al. | 2002 | National Health Interview Survey, 1997–1999 | National | 196 | Children | Cross-sectional | Unintentional | Poisoning | Income (n.s.) | No |
| Schwebel et al. | 2012 | Healthy Passages participants, 2004–2006 | Multi-city | 3218 | Children | Cross-sectional | Unintentional | Injuries requiring medical attention | SES composite (—) Health insurance coverage (n.s.) | No |
| Schwebel, Brezausek, & Belsky | 2006 | National Institute ofChild Health and Human Development (NICHD) Study of Early Child Care | National | 1225 | Children | Cohort, prospective | Unintentional | Injury requiring medical attention | Income to need ratio (n.s.) | Yes |
| Sinclair & Xiang | 2008 | National Health Interview Survey, 1997–2005 | National | 242,796 | Children | Cross-sectional | Unintentional | Injury requiring medical attention | Education (n.s.), Poverty (n.s.) | Yes |
| Vaughan et al. | 2004 | Parent interview | Clinic | 150 | Children | Cross-sectional | Unintentional | Injury | Education (+) | No |
| Xiang et al. | 2005 | National Health Interview Survey, 2000–2002 | National | 57,909 | Children | Cross-sectional | Unintentional | Injury requiring medical attention | Education (+) Health insurance coverage (+) | Yes |
| Rauscher and Myers | 2008 | Survey ofone High School | School | 1430 | Adolescents | Cross-sectional | Unintentional | Occupational eye injury | Education (—) Employment (+) | Yes |
| Schwebel & Brezausek | 2009 | California Health Interview Survey, 2003 | State | 12,536 | Children and Adolescents | Cross-sectional | Unintentional | Injuries requiring medical treatment | Health insurance coverage (—) | No |
| Boyer et al. | 2009 | Workforce rosters and worker’s compensation claims for employees of one hospital in Northeastern Massachusetts. | Hospital | 1483 | Adults | Cross-sectional | Unintentional | Occupational injury resulting in worker’s compensation claim | 5 category SES classification scheme (—) | Yes |
| Brown et al. | 2006 | Behavior Risk Factor Surveillance System, 2003 | National | 207,776 | Adults | Cross-sectional | Unintentional | Sunburn | Education (+) Employment (+) Income (+) | Yes |
| Crandall et al. | 2014 | Study ofWomen’s Health Across the Nation | Multi-city | 2167 | Midlife adults | Cohort, prospective | Unintentional | Incident fracture | Difficulty paying for basics (n.s.) Income (n.s.) Poverty-to-income ratio (n.s.) Education (—) among non-Caucasian women | Yes |
| Dembe, Erickson & Delbos | 2004 | National Longitudinal Survey ofYouth 1998 | National | 7271 | Adults | Cohort, prospective | Unintentional | Occupational injury | Education (—) Homeownership (—) HourlyPay (—) Income (—) | Yes |
| Forrest & Cali | 2009 | National Health Interview Survey, 2002 | National | 28,913 | Adults | Cross-sectional | Unintentional | Occupational eye injury | Education (—) Income (n.s.) | Yes |
| Holman et al. | 2014 | National Health Interview Survey, 2010 | National | 24,970 | Adults | Cross-sectional | Unintentional | Sunburn | College education (+) Private health insurance (+) (vs. other types of insurance) | Yes |
| Hsiao et al. | 2010 | Defense Medical Surveillance System, 1998–2007 | Military | 9299 | Military | Cross-sectional | Unintentional | Patellar dislocation | Rank (—) | No |
| Hsiao et al. | 2012 | Defense Medical Surveillance System, 1999–2008 | Military | 15,514 | Military | Cross-sectional | Unintentional | Clavicle fracture | Rank (—) | No |
| Luo et al. | 2012 | Behavioral Risk Factor Surveillance System (2005–2007) | National | 43,510 | Adults | Cross-sectional | Unintentional | Occupational eye injury | Education (—) Income (—); both among men only | Yes |
| Price et al. | 2012 | National Health Interview Survey, 2006–2010 | National | 183,676 | Adults | Case-control | Unintentional | Injury requiring medical treatment | Education (—) for occupational injuries Health insurance coverage (+) for non-occupational injuries | No |
| Rastogi et al. | 2007 | Hospital medical records, 1999–2005 | Hospital | 6880 | Adults | Cross-sectional | Unintentional | Elevated blood lead level | Education (n.s.) Poverty (n.s.) | No |
| Roy et al. | 2012 | Survey | Hospital | 593 | Military | Cross-sectional | Unintentional | Musculoskeletal injury | Rank (+) | Yes |
| Sprince et al. | 2003 | Agricultural Health Study, 1998 | Multi-state | 552 | Adults | Case-control | Unintentional | Fall-related injury | Education (n.s.) | No |
| Sprince et al. | 2008 | National Health Interview Survey, 1997–2005 | National | 195,282 | Adults | Cross-sectional | Unintentional | Occupational injury requiring medical treatment | Education (n.s.) | No |
| Sprince et al. | 2007 | Agricultural Health Study, Iowa | State | 514 | Adults | Case-control | Unintentional | Back injury | Education (+) | No |
| Strong and Zimmerman | 2005 | National Longitudinal Survey ofYouth (10 survey waves from 1988 to 2000, participants originally surveyed in 1979) | National | 9294 | Adults | Cohort, prospective | Unintentional | Occupational injury | Education (n.s.) Job status (—) Rate/income (n.s.) | Yes |
| Taylor et al. | 2011 | Center for Medicare and Medicaid Services Chronic Condition Warehouse, Claims data, 2000–2005 | National | 1.69 M | Older Adults | Cohort, retrospective | Unintentional | Fracture | Incomeb (—) | Yes |
| Wilson et al. | 2006 | Asset and Health Dynamics Survey, 1993 and 1995 | National | 5630 | Older Adults | Cohort, prospective | Unintentional | Hip fracture | Education (—) Lack of supplemental insurance coverage (+) Income (n.s.) | Yes |
| Wirtz et al. | 2012 | National Health Interview Survey, 2004–2010 | National | 96,915 | Adults | Cross-sectional | Unintentional | Occupational injury | Education (—) | Yes |
| Wolinsky et al. | 2009 | Survey on Asset and Health Dynamics | National | 5511 | Older | Cohort, | Unintentional | Hip fracture following | Education (—) | Yes |
| Among the Oldest Old, linked to Medicare claims, 1993–2005 | Adults | prospective | hospitalization | Income (—) | ||||||
| Zhang et al. | 2009 | National Health Interview Survey, 1997–2005 | National | 401,667 | Adults | Cross-sectional | Unintentional | Occupational injury | Education (—) Health insurance coverage (n.s.) Poverty (n.s.) | Yes |
| Ecological studies | ||||||||||
| Freisthler et al. | 2008 | 0–17 year olds in California Hospital Discharge Data, COSHPD, 2000 | State | 1646 ZIP codes | Children | Cross-sectional | All | Injury due to accident, assault, or child abuse by ZIP code | ZIP code: Education (—) for accidental injuries, (+) for child abuse Poverty (+) for assault injuries | Yes |
| Rewers et al. | 2005 | Colorado Trauma Registry, 1998–2001 | State | 1105 tracts | Children | Cross-sectional | All | Femur fracture | Tract: Income (—) among youngest children Single family housing (—) among 4–12 year olds | No |
| Zarzaur et al. | 2010 | Hospital Trauma Registry, Shelby County, TN, 1996–2005 | Hospital | 214 tracts | Adults | Cross-sectional | All | Crude injury admission rates, mechanism, severity | Tract: Poverty (+) | Yes |
| Edelman et al. | 2010 | Burn victims in five Utah state databases (EMS, ED, Hospital Discharge, Burn Database, HD) 1997–2001 | State | 29 counties | All Ages | Cross-sectional | All | Burn requiring treatment | County area: Education (—) Employment (—) Income (—) Poverty (+) | Yes |
| Krieger et al. | 2003 | Massachusetts Dept. ofPublic Health, 1995–1997 | State | 6500 block groups/1586 tracts/544 ZIP codes | All Ages | Cross-sectional | All | Non-fatal weapons related injury | Block group, tract, and ZIP code: Multiple SES indicators used, Increased risk ofinjury for those with the lowest resources compared to those with the most. | Yes |
| Reed et al. | 2003 | Hospital Trauma Registries, two Sedgewick County, Kansas Trauma Centers, 1990/1–1999 | Multi-hospital | 1 county | All Ages | Cross-sectional time series | All | Penetrating trauma requiring treatment | County: Employment (—) | Yes |
| Pabayo et al. | 2014 | Boston Youth Survey (BYS), 2008; Boston Neighborhood Study (BNS) | City | 1878 | Adolescents | Cross-sectional | Intentional | Assault related injury | Tract: Income inequality (+) | No |
| Boyle & Hassett-Walker | 2008 | Six hopsitals in Newark, New Jersey | Multi-hospital | 262 block groups | All Ages | Cross-sectional | Intentional | Assault related injury | Block group: Poverty + | Yes |
| Chakravarthy et al. | 2012 | California Statewide Integrated Traffic Records System, Orange County, 2000–2004 | County | 577 tracts | All Ages | Cross-sectional | Unintentional | Pedestrian injury | Tract: Income (—) Education (—) | Yes |
| Haley & Talbot | 2004 | New York State Health department Laboratory Reporting System, 1994–1997 | State | 952 ZIP codes | Young children | Cross-sectional | Unintentional | Elevated blood lead level | ZIP code: Education (—) | Yes |
| Kaplowitz et al. | 2010 | Michigan Dept. ofCommunity Health database ofblood lead level tests, 1998–2005 | State | 533,647 | Children | Cross-sectional time series | Unintentional | Elevated blood lead level | ZIP code vs. block group: Education (—) Medicaid insurance status (+) Poverty (+) | Yes |
| Shenassa et al. | 2004 | Hospital discharge data, Illinois, 1990–2000 | State | 11,735 | Children | Cross-sectional | Unintentional | Injury occurring at home | ZIP code: Concentrated poverty (+) | Yes |
| Vivier et al. | 2011 | Rhode Island Department ofHealth, Lead Elimination Surveillance System, 1993–2005 | State | 808 block groups | Children | Cross-sectional | Unintentional | Elevated blood lead level | Block group: Poverty (+) | Yes |
| Chakravarthy et al. | 2010 | California Statewide Integrated Traffic Records System, Orange County, 2000–2004 | County | 577 tracts | All Ages | Cross-sectional | Unintentional | Pedestrian injury | Tract: Education (—) Income (—) | No |
| Istre et al. | 2001 | EMS, Fire Department, ME and Hospital Data, Dallas, 1990–1997 | City | 255 tracts | All Ages | Cross-sectional | Unintentional | Injury related to house fires | Tract: Income (—) | Yes |
| Shai | 2006 | Office of the Fire Marshal, Philadelphia Fire Department (1993–2001) | City | 324 tracts | All Ages | Cross-sectional | Unintentional | Fire injury rates by census tract | Tract: Education (n.s.) Employment (n.s.) Income (—) | Yes |
n.s. refers to a non-significant relationship.
Indicates an area-level SES measure used to proxy individual-level SES.
Table 4.
Studies of fatal and non-fatal injury.
| Author | Year | Data source | Geography | Sample | Age | Design | Intent | Mechanism | Results | Gradient |
|---|---|---|---|---|---|---|---|---|---|---|
|
| ||||||||||
| Individual-level studies | ||||||||||
| Martin et al. | 2012 | Vanderbilt pediatric trauma registry and Davidson Co. Medical Examiner records, 1998–2010 | Hospital/County | 201 | Children | Cross-sectional | All | Firearm injury | Incomeb (n.s.)a | Yes |
| Schecter et al. | 2012 | Trauma center medical records, 2000–2009 | Multi-hospital | 598 | Children | Cross-sectional time series | All | Penetrating injury | Incomeb (—) | No |
| Lee et al. | 2013 | Kid’s Inpatient database, 2006–2009 | National | 19,233 | Children and adolescents | Cross-sectional | All | Firearm injury | Income (—) | Yes |
| Kesler et al. | 2008 | Pennsylvania Department of Public Welfare database, 1996–2002 | State | 327 | Young children | Cross-sectional | Intentional | Abusive head trauma (AHT) | Education (—) | Yes |
| Istre et al. | 2002 | EMS, Fire Department, ME and Hospital Data, Dallas, 1991–1998 | City | 76 | Children | Cross-sectional | Unintentional | Injury related to house fires | Incomeb (—) | Yes |
| Senier et al. | 2002 | Total Army Injury and Health Outcomes Database, 1980–1998 | Military | 28,352 | Adults | Cross-sectional | Unintentional | Fall-related injury | Education (—) Rank (—) | No |
| Ecological studies | ||||||||||
| Pomerantz et al. | 2001 | Hospital Trauma Registry, Hamilton County, Ohio, and County Coroner death records | Hospital/County | 209 tracts | Children | Cross-sectional | All | Injury requiring hospitalization or resulting in death | Tract: Education (—) Employment (—) Median household income (—) Poverty (+) | Yes |
| Williams et al. | 2003 | Medical records at two children’s hospitals, 1995 | City | 988 block groups | Children | Cross-sectional | All | Burn | Blockgroup: Deprivation (+) (spatial analysis) | No |
| Cinat et al. | 2004 | Trauma registries of Los Angeles County and Orange County, 1993–2002 | Multi-county | 2 counties | All Ages | Cohort, retrospective | All | County trauma rates | County: Number unemployed (+) Unemployment rate (+) | No |
| Anderson et al. | 2014 | Ohio Trauma Acute Care Registry, 2003–2011 | State | 984 | Young children | Cross-sectional | Intentional | Contusion, intracranial hemorrhage, skull fracture, femur fracture, burn | County: Income (—) Poverty (+) | Yes |
| Donner | 2007 | John Hart’s Severe Plot v. 2.0, 1950–2000 | National | Tracts, not specified | All ages | Cross-sectional | Unintentional | Tornado - related injury and death | Tract: Deprivation index (n.s.) | Yes |
n.s. refers to a non-significant relationship.
Indicates an area-level SES measure used to proxy individual-level SES.
For analysis of the studies as a group, the study results were coded as demonstrating an inverse, positive, or mixed relationship between SES and injury (for instance, when a study found injury rates were elevated in areas in poverty, the study was coded as demonstrating an inverse relationship between SES and injury). A chi-square test was used to determine whether studies that used more than one measure of SES were significantly more likely to find a measureable difference than those that used only one measure.
3. Results: SES measurement in studies reviewed
3.1. Overview of the studies reviewed
A total of 119 studies met the inclusion criteria (Fig. 1). Study characteristics are presented in Table 1. Thirty-one studies (26.1%) focused on fatal injury outcomes, 77 on non-fatal injury (64.7%), and 11 on both fatal and non-fatal injuries. There were 85 individual-level studies (71.4%) that measured SES and injury at the individual level (or using an area-based SES measure to proxy individual SES), and 34 ecological studies (28.6%) that measured both injury and SES at the area-level. The majority of the fatal injury studies were focused on intentional injuries (n = 23, 74.2%). The non-fatal injury studies, and the studies of both fatal and non-fatal injury, were more focused on unintentional injuries (55.3%) and injuries from all intents (35.2%). In terms of life stage under study, 43.7% of studies focused on children and/or adolescents, 42.0% on adults, and 14.3% on people of all ages.
Fig. 1.
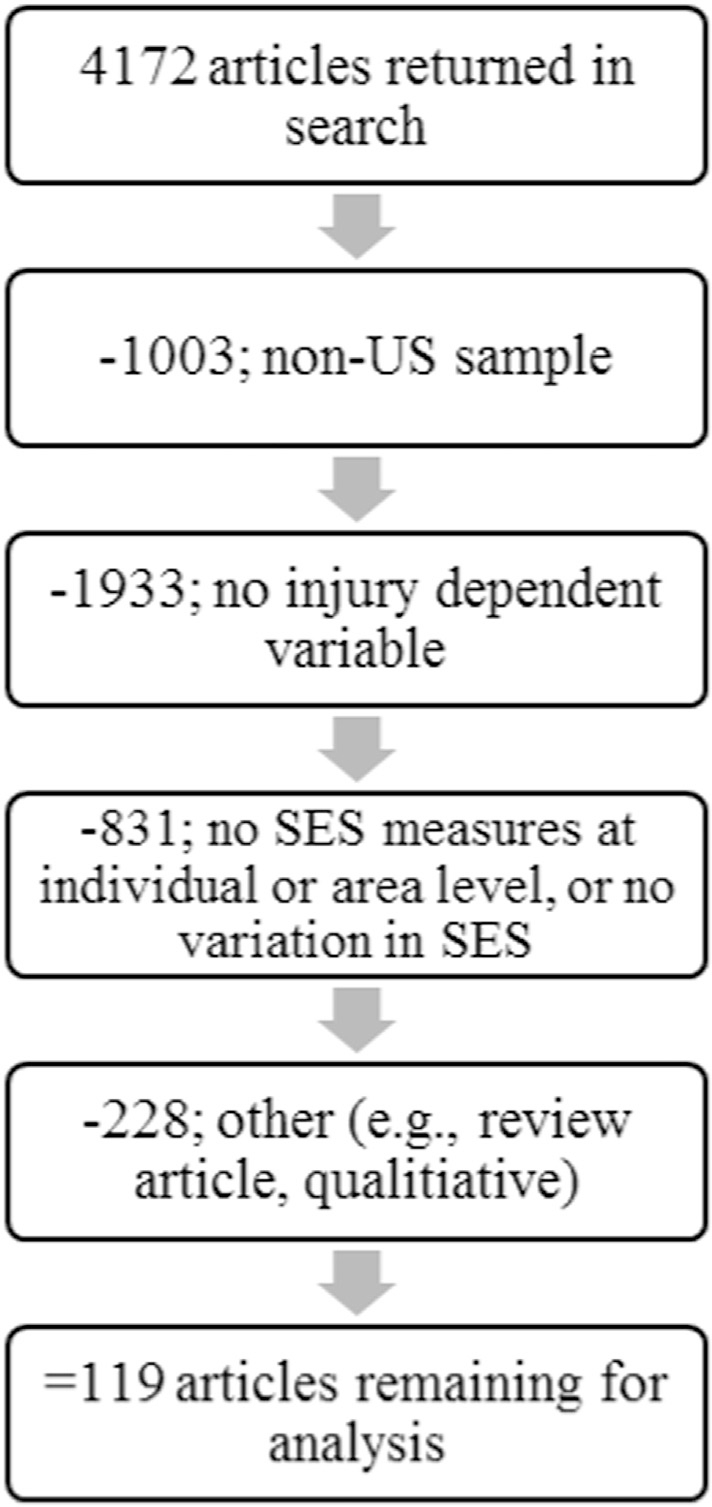
Inclusion of articles in review.
Table 1.
Characteristics of reviewed studies by injury outcome.
| All studies (n = 119) |
Non-fatal (n = 77) |
Fatal (n = 31) |
Both fatal and non-fatal (n = 11) |
||||||
|---|---|---|---|---|---|---|---|---|---|
| n | % | n | % | n | % | n | % | ||
|
| |||||||||
| Study type | Ecological | 34 | 28.6% | 16 | 20.8% | 13 | 41.9% | 5 | 14.7% |
| Individual-Level | 85 | 71.4% | 61 | 79.2% | 18 | 58.1% | 6 | 7.1% | |
| Intent | All Intents | 37 | 31.1% | 27 | 35.1% | 4 | 12.9% | 6 | 16.2% |
| Intentional | 31 | 26.1% | 6 | 7.8% | 23 | 74.2% | 2 | 6.5% | |
| Unintentional | 51 | 42.9% | 44 | 57.1% | 4 | 12.9% | 3 | 5.9% | |
| Age group | Infants | 2 | 1.7% | 0 | 0.0% | 2 | 6.5% | 0 | 0.0% |
| Children | 44 | 37.0% | 32 | 41.6% | 5 | 16.1% | 7 | 15.9% | |
| Adolescents | 6 | 5.0% | 5 | 6.5% | 0 | 0.0% | 1 | 16.7% | |
| Adults | 50 | 42.0% | 30 | 39.0% | 19 | 61.3% | 1 | 2.0% | |
| Multiple Groups/All Ages | 17 | 14.3% | 10 | 13.0% | 5 | 16.1% | 2 | 11.8% | |
| Study design | Cross-sectional | 86 | 72.3% | 54 | 70.1% | 22 | 71.0% | 10 | 11.6% |
| Cohort | 20 | 16.8% | 15 | 19.5% | 4 | 12.9% | 1 | 5.0% | |
| Case-control | 13 | 10.9% | 8 | 10.4% | 5 | 16.1% | 0 | 0.0% | |
| Measures of SES | Single | 49 | 41.2% | 32 | 41.6% | 11 | 35.5% | 6 | 12.2% |
| Multiple | 70 | 58.8% | 45 | 58.4% | 20 | 64.5% | 5 | 7.1% | |
| SES measure | Dichotomous | 46 | 38.7% | 27 | 35.1% | 15 | 48.4% | 4 | 8.7% |
| Gradient (3 + categories) | 73 | 61.3% | 50 | 64.9% | 16 | 51.6% | 7 | 9.6% | |
| Relationship between SES variable(s) and injury outcome | Positive (higher SES = increased injury) | 8 | 6.7% | 8 | 10.4% | 0 | 0.0% | 0 | 0.0% |
| Inverse (higher SES = lower injury) | 78 | 65.5% | 45 | 58.4% | 24 | 77.4% | 9 | 11.5% | |
| Mixed (inverse relationship for some groups) | 14 | 11.8% | 9 | 11.7% | 5 | 16.1% | 0 | 0.0% | |
| Non-significant | 19 | 16.0% | 15 | 19.5% | 2 | 6.5% | 2 | 10.5% | |
The majority of the studies in the current review were cross-sectional in design (n = 86, 72.3%). There were 20 cohort studies (16.8%) and 13 case–control studies (10.9%).
3.2. Sample selection and generalizability
Forty-eight of the studies (40.3%) in the review utilized national samples. Thirty-three (27.7%) drew from single community sampling frames, representing a population of only a single hospital/clinic, community or city. Many of these studies used non-random sampling strategies and had smaller sample sizes, limiting generalizability. Variations in the demographics and cultures of single communities may mean that the effects of SES variables affect injury risk differently. In addition, smaller sample sizes contribute to greater sampling error and should be interpreted with care.
3.3. The measurement of SES
Cubbin and Smith (2002) made four primary recommendations for future injury research, which are used as a framework to analyze studies in the current review. First, studies should measure SES along a gradient. Second, injury research should use multiple measures of SES when possible, and account for the multidimensional nature of SES in both choice of variables and interpretation of the results. Third, Cubbin and Smith argue for the inclusion of area-level measures of SES, as they have been shown to have an independent contribution above and beyond those individual-level variables. Lastly, researchers should define and justify the variables they have chosen, and acknowledge their limitations, so that readers can more easily interpret their findings.
3.3.1. SES gradients
In the current review and in Cubbin and Smith (2002), studies were assessed to determine if the analysis of SES took into account variation along a gradient; if the SES variable was operationalized to include three or more categories or as a continuous measure, the study was coded as accounting for a gradient approach to measurement. Approximately 61% (n = 73) of the studies in our review used gradient measures of SES — nearly the exact same as the 60% found in the Cubbin and Smith review. This finding would suggest that U.S. studies of injury have not improved in the area of accounting for the effects of SES along a gradient since 2001. Studies that measured SES on a gradient found significant relationships between SES indicators and injury outcomes more often than studies that used dichotomous SES variables, χ2(1, n = 119) = 3.5, p = 0.06, 65.0% vs 35.0% respectively.
3.3.2. Multiple SES measures/level of measurement
One of the primary recommendations from the Cubbin and Smith (2002) review included accounting for SES through multiple measures when feasible, as SES is multidimensional in nature. Seventy of the 119 studies did include multiple measures of SES. Measurement at individual and area-levels contributes important information about both people and the places they exist within. However, in the current review, 49 of the 119 studies (41%) reviewed used only one measure of SES (this count does not include composite or ratio measures). Studies that used multiple measures of SES found significant relationships to injury 62.0% of the time, compared to 38.0% of the time for single SES-indicator studies; this difference was not statistically significant in a chi-square test of independence (p = 0.106).
The majority of the 49 studies using only one indicator of SES were individual-level studies (n = 38), 10 of which used area-level measures of SES to proxy individual SES. As Cubbin and Smith (2002) discussed, using area-level assessments in this way can create misclassification, as individual differences cannot be measured accurately with area-based proxies. Two studies compared various area-levels of measurement (Kaplowitz, Perlstadt, & Post, 2010; Krieger, Waterman, Chen, Soobader, & Subramanian, 2003). Both found that substantial measurement error may exist when larger areas (e.g., ZIP codes) are employed to approximate neighborhoods as they may consist of more heterogeneous groups of individuals with greater variety in SES; smaller areas (e.g., census block groups, census tracts) are more sensitive and account for more variance in the injury outcome as the individuals within tend to be more homogenous in terms of SES.
3.3.3. Selection of SES measures
Studies in this review continue to use problematic measures of SES, despite ongoing discussions of their inadequacy (Braveman et al., 2005; Cubbin et al., 2011) or their ill fit to the specific injury issue under study. Substantial misclassification exists with some variables used as measures of SES in our review (e.g., insurance status, enrollment in public assistance), as not all people who are experiencing low SES can be identified with such designations. As in Cubbin and Smith (2002), many of the studies in our review lacked justifications for their selection of SES measure; often, the measure appears to have been selected simply because it was readily available in an existing data set. In individual-level studies, for instance, two studies used only insurance status to approximate SES (Harris, Fisher, & Thomas, 2012; Schwebel & Brezausek, 2009). A total of 15 studies in the review employed insurance status as an independent variable. In another example, in 18 studies of inflicted intentional injuries (homicide, assault, and child maltreatment, not including suicide), five used only individual-level measures of SES, not accounting for the influence of neighborhood conditions.
4. Results: SES–injury relationships
The specific findings of each study are shown in Tables 2, 3, and 4. Overall, 84% of studies (n = 100) demonstrated a significant relationship between SES and the injury outcome variable. Of these, 78 studies found the relationship between at least one indicator of SES and injury to be inverse in nature, meaning as SES increased, injury decreased and vice-versa. An additional 14 of those studies demonstrated mixed results, finding a significant inverse SES–injury relationship for at least some portion of the sample. Eight studies found a positive relationship between SES and injury; of these, three of the injury outcomes were recreational in nature (Brown, Quain, Troxel, & Gelfand, 2006; Holman, Berkowitz, Guy, Hartman, & Perna, 2014; Ni, Barnes, & Hardy, 2002).
4.1. Studies of fatal injury
Over two-thirds (77%, n = 24) of the studies of fatal injury demonstrated a significant, inverse relationship between at least one indicator of SES and the fatal injury outcome (Table 2). An additional five studies (16%) found the relationship was significant for some sub-groups within the sample.
4.1.1. Intentional fatal injury studies
Most of the studies of fatal injury were of intentional injuries (n = 23); 7 of 11 ecological studies found significant inverse relationships between SES and fatal intentional injury, as did 11 of 12 individual-level studies.
4.1.1.1. Children & Adolescents.
Three statewide studies explored intentional injury deaths in children at the individual-level. Two studies examined data from the Missouri Child Fatality Review. One found negative relationships between both parental education and poverty and intentional injury death (Schnitzer & Ewigman, 2005), while one found a significant negative relationship only to parental education (Stiffman, Schnitzer, Adam, Kruse, & Ewigman, 2002).
4.1.1.2. Adults/all ages.
All individual-level studies of homicide found increased risk of homicide for individuals with lower SES indicators using national datasets. Lo, Howell, and Cheng (2015) found homeownership to be negatively associated with early death by homicide; among Hispanic and Black individuals, employment and education were also negatively associated with younger age at homicide. Among Whites in the dataset, employment was positively associated with younger age at homicide. In a study using Pregnancy Mortality Surveillance System data, educational attainment was inversely associated with femicide during or within one year of pregnancy (Chang, Berg, Saltzman, & Herndon, 2005). Homicides in the National Trauma Data Bank were negatively associated with having health insurance coverage (Harris et al., 2012). Homicide victims in the National Mortality Followback Survey had lower income than controls from the National Health Interview Survey (Wiebe, 2003).
Seven ecological studies focused on homicide. A 30-year study of FBI data from 83 cities demonstrated associations between homicide and city-level deprivation, poverty, and lower incomes; there was no significant relationship to employment rates (McCall, Parker, & MacDonald, 2008). In a Los Angeles study, rates of homicide were associated with unemployment and high school dropout rates, but not with median household income (Robinson et al., 2009). A New York City study found no association between gun-related homicides and education by Census tract (Cerdá et al., 2010).
Three of the 7 ecological homicide studies focused on fatalities from intimate partner violence. A study of 100 counties in North Carolina found intimate-partner homicide rates were significantly associated with county-level deprivation (Spriggs Madkour, Martin, Halpern, & Schoenbach, 2010). Wu (2009) found this as well for zip code-level deprivation in California; this study also found an inverse association with income among non-Asian women. Frye et al. (2008) found intimate partner homicides in New York City to be associated with lower neighborhood-level income, but not neighborhood-level education, job status, or unemployment.
Six individual-level studies examined relationships between suicide and SES, four using national datasets. All four national studies found at least one negative relationship to SES indicators. Kposowa (2001) found employment to be negatively related to suicide in the first three years of a longitudinal data from the U.S. National Longitudinal Mortality Study; among men in the study education and income were also negatively associated with suicide. In a longitudinal study of data from the National Center for Health Statistics, education was negatively associated with suicide (Phillips, Robin, Nugent, & Idler, 2010). Wiebe (2003) found lower household income was associated with increased risk of suicide in a national case–control study. Among African Americans, suicide was associated with lower educational attainment in the Willis, Coombs, Drentea, and Cockerham (2003) study of the National Mortality Followback Survey. In the three studies of data sets from smaller geographic regions, suicide was associated with lower income, financial trouble, and unemployment (Duberstein, Conwell, Conner, Eberly, & Caine, 2004; Wexler, Hill, Bertone-Johnson, & Fenaughty, 2008) in two studies, but in the third, income demonstrated mixed results among age and racial groups (Purselle, Heninger, Hanzlick, & Garlow, 2009).
Ecological studies of fatal suicide also found significant relationships to SES, but in some studies results were mixed. Using national, county-level data, Clouston, Rubin, Colen, and Link (2014) found an aggregate measure of SES (combining education, white collar employment, proportion above federal poverty level and access to a telephone) was negatively related to suicide rates after the introduction of selective serotonin reuptake inhibitors, which are protective against suicide but are not equally accessible across socioeconomic classes. In another national county-level study, suicide was negatively associated with county median income (Gibbons, Hur, Bhaumik, & Mann, 2005). In a California based study, Johnson, Gruenewald, and Remer (2009), found income at the zip-code level to be negatively associated with suicide in rural, more White areas but not in other communities. One study examined both suicide and homicide by firearm in three counties; unemployment rates demonstrated mixed associations by county, while income was not significantly related to homicide or suicide (Branas, Richmond, & Schwab, 2004). In New York City, income inequality in community districts was related to increased suicide rates (Miller et al., 2005).
4.1.2. Studies of unintentional fatal injury and fatal injury from all intents
4.1.2.1. Children & adolescents.
There were eight studies of fatal unintentional injuries and injuries from all intents among children. Using linked birth and death records, Carlberg, Shapiro-Mendoza, and Goodman (2012) found parental education was negatively associated with infant death due to suffocation, asphyxiation or strangulation in bed (ASSB). Using data from the National Center for Health Statistics, Jain, Khoshnood, Lee, and Concato (2001) found lower levels of parent’s education to be significantly related to higher risk of injury death from all intents in infants. Using national data, Saluja et al. (2006) found income to be negatively associated with child drowning deaths, but only when controlling for race. A study of whether children with a report of child maltreatment faced heightened risk for injury death from all intents controlled for both insurance status (private vs. public) and maternal education, as both were significant predictors of child injury fatality in the overall sample (Putnam-Hornstein, 2011). Istre, McCoy, Carlin, and McClain (2002) found child deaths in house fires in Dallas to be associated with median census tract income as a proxy for individual-level SES. Similarly, in an ecological study, Shai and Lupinacci (2003) found fire-related deaths in Philadelphia to be related to census tract-level income but not education or employment.
4.1.2.2. Adults/all ages.
Among adults, one national study found increased risk of injury for workers with lower educational attainment and those with lower wages (Steege, Baron, Marsh, Menéndez, & Myers, 2014). A state-level study in Pennsylvania showed SES variables such as poverty and education were not better predictors of heat-related injury death than measures of land surface temperature, but that indicators of poverty were associated with increased risk of death as temperatures increased (Johnson, Wilson, et al., 2009). One ecological study found injury fatalities from all intents among young black males in Chicago, who had been relocated to higher income neighborhoods as children and followed prospectively, were associated with lower census tract-level educational attainment; in this study, rates of poverty and percentage of houses receiving government assistance were not significant (Votruba & Kling, 2009).
4.1.3. Studies of non-fatal injury
Over twice as many studies of non-fatal injury met the inclusion criteria for this review compared to fatal injury (77 vs. 31; Table 3). Within the non-fatal studies, over half (n = 44, 57%) are studies of unintentional injury. The non-fatal studies reported a significant, inverse relationship with SES 58% of the time (n = 45), with an additional 12% finding significant relationships for some of the sample (n = 9). All eight of the studies in the review that showed positive relationships to SES are non-fatal studies, primarily of unintentional injury (7 studies of unintentional injury, 1 study of all intents).
4.1.4. Intentional non-fatal injury studies
4.1.4.1. Children & adolescents.
Only one study examined non-fatal intentional injuries to children at the individual level. In this study, maternal education was not a significant predictor of adolescent assault injuries in data from two hospitals (Cheng et al., 2003). An ecological study demonstrated income inequality at the census tract level was related to higher risk of assault-related injuries to adolescents in Boston (Pabayo, Molnar, & Kawachi, 2014).
4.1.4.2. Adults/all ages.
The three individual level studies of intentional injuries among adults, all conducted with data from a hospital or clinic, found mixed results. Faulkner, Landsittel, and Hendricks (2001) found injuries sustained during robberies were related to lower neighborhood building values and rents. Lipsky, Caetano, Field, and Bazargan (2004) found no significant associations between violence-related injury and education or employment status; however, this study’s sample had overall low educational attainment and high unemployment. Another study of assault injuries in a clinic demonstrated a negative relationship to educational attainment in a sample of young adult males (Rich & Sullivan, 2001). In an ecological study combining data from multiple hospitals, census block-group level poverty was associated with assault-related injury among adolescents (Boyle & Hassett-Walker, 2008).
4.1.5. Unintentional and all intent non-fatal injury studies
4.1.5.1. Children & adolescents.
Twenty-eight of the studies reviewed analyzed individual-level relationships between non-fatal child injury and SES due to unintentional injury or injuries from all intents. Nine of the 28 studies, eight of them with national sampling frames, found relationships between child injury and SES to be non-significant. All but one (Polivka, Elliott, & Wolowich, 2002) of the national studies finding non-significant relationships examined SES predictors of injury requiring medical attention in the past year, including: education and poverty among children with disabilities (Lee, Harrington, Chang, & Connors, 2007; Sinclair & Xiang, 2008), two studies on the influence of child care that also examined income-to-needs ratio to injury (Schwebel & Brezausek, 2007; Schwebel, Brezausek, & Belsky, 2006), parental employment (Crandall, Chiu, & Sheehan, 2006) and education, income and health insurance among high-risk families (Schneiderman, Leslie, Hurlburt, Zhang, & Horwitz, 2012), and measures of poverty (Simon, Emsermann, DiGuiseppi, Davidson, & Hambidge, 2008). Five of the remaining six national studies found at least one significant inverse relationship between the SES independent variable and the injury outcome (Allareddy et al., 2014; Bishai et al., 2008; Crandall, Sridharan, & Schermer, 2010; Jones et al., 2009; Sridharan & Crandall, 2011; Xiang, Zhao, Xiang, & Smith, 2012), the exception being a study of recreational injuries that had a positive relationship to SES (Ni et al., 2002).
The remaining 19 individual-level studies using non-national data varied widely in terms of sample size, with samples ranging from 124 to 34,798. Studies found mixed results in terms of associations between general unintentional injury with SES indicators: one study found no relationship to income or parental education (Garzon, Huang, & Todd, 2008); one study found an inverse relationship to a composite SES score but not to health insurance status among a sample of 5th grade children (Schwebel et al., 2012); a third study found education to be positively related to child injury among a small sample of only lower-income families (Vaughan, Anderson, Agran, & Winn, 2004). A study of eye injuries among adolescents found employment as an adolescent was positively related to injury, and parental education was negatively related (Rauscher & Myers, 2008). Three studies of elevated lead levels all found some association between at least one indicator of lower SES and increased risk of lead exposure (Kim, Staley, Curtis, & Buchanan, 2002; Malcoe, Lynch, Keger, & Skaggs, 2002; Nriagu, Senthamarai-Kannan, Jamil, Fakhori, & Korponic, 2011). Istre et al. (2002) found children in census tracts with lower median incomes were at increased risk of fire-related injury and death. Marcin, Schembri, He, and Romano (2003) found the median income and proportion of households in poverty in patient’s counties of residence indicated increased risk of pediatric injury hospitalization for injuries of all intents.
There were seven ecological studies investigating relationships between area-SES and pediatric injuries, all from individual states. Two looked at injuries from all intents and all found inverse associations between most area measures of SES and rates of injury (Freisthler, Gruenewald, Ring, & LaScala, 2008; Rewers et al., 2005). In the Freisthler et al. (2008) study of California Hospital Discharge Data, there was an inverse relationship between percentage of high school graduates by zip code and both abuse and unintentional injuries. Higher poverty was also related to assault and unintentional injuries in this study. Among the three ecological studies of elevated blood lead levels, one found associations with census block group poverty in Rhode Island (Vivier et al., 2011), one with education, poverty and Medicaid insurance in Michigan (Kaplowitz et al., 2010), and the last with zip code level education in New York state (Haley & Talbot, 2004). Chakravarthy, Anderson, Ludlow, Lotfipour, and Vaca (2012) found census tract income and education to be inversely related to child pedestrian injury rates in Southern California. Rates of unintentional injuries occurring at home were related to zip code concentrated poverty in a study of Illinois hospital discharge data (Shenassa, Stubbendick, & Brown, 2004). Femur fractures from all intents were related to census tract income and single family housing in families with young children in a Colorado study (Rewers et al., 2005).
4.1.5.2. Adults/all ages.
There were 27 individual-level studies of unintentional injuries to adults or persons of all ages. Nine of these studies examined non-fatal unintentional injuries to adults focused on occupational injuries; 8 of them used national data sets. Seven studies found a significant, inverse relationship between risk of occupational injury and at least one indicator of SES (Dembe, Erickson, & Delbos, 2004; Forrest & Cali, 2009; Luo et al., 2012; Price et al., 2012; Strong & Zimmerman, 2005; Wirtz, Lombardi, Willetts, Folkard, & Christiani, 2012; Zhang et al., 2009). A national study of home health aides found hourly pay rate was associated with higher risk of occupational injury (Houston, Young, & Fitzgerald, 2013). Sprince, Pospisil, Peek-Asa, Whitten, and Zwerling (2008) found no association between occupational injury and educational attainment in their multivariate model, although education was independently associated with occupational injury before adjusting for race and other factors. In a study comparing occupational to non-occupational injuries, Price et al. (2012) found education was negatively related to occupational injury, but not to non-occupational injuries. In this study, non-occupational injuries were significantly positively related to heaving health insurance coverage, perhaps due to ability to access care when not under workman’s comp coverage.
Five studies used national datasets to investigate varied injury outcomes; two of these found positive relationships between sunburn and SES indicators (Brown et al., 2006; Holman et al., 2014). Three studies investigated fractures in older adults. One found increased risk of hip fracture in older adults with lower education and lower income (Wolinsky et al., 2009), one found an inverse association between fractures and income (Taylor et al., 2011), and one found lower education and no supplemental health insurance were associated with increased risk of fracture, but income and net worth did not demonstrate significant relationships (Wilson, Chase, Chrischilles, & Wallace, 2006).
There were three studies of non-fatal, unintentional injuries in the military included in the review. In these studies, rank was inversely related to patellar (kneecap) dislocation (Hsiao, Owens, Burks, Sturdivant, & Cameron, 2010) and clavicle fracture (Hsiao et al., 2012). Rank was positively related to musculoskeletal injuries among soldiers deployed to Afghanistan (Roy, Knapik, Ritland, Murphy, & Sharp, 2012).
Individual level studies of adults with unintentional injuries from datasets with smaller geographic coverage found similar results. Boyer et al. (2009) found occupational injury to be negatively related to a measure of SES based on job category in a study of employees at one Massachusetts hospital. Studies of injuries to Iowa farmers found fall-related injuries were not significantly related to education (Sprince et al., 2003), but low back injury was positively related to educational attainment beyond high school (Sprince et al., 2007). Similar to findings in studies of children, Rastogi, Nandlike, and Fenster (2007) found elevated blood lead levels to be inversely related to income among pregnant women.
The seven ecological studies of injuries among adults and persons of all ages demonstrated consistent inverse relationships to SES. In a study of adults, census tract poverty was positively related to injury admission rates and severity in Tennessee (Zarzaur, Croce, Fabian, Fischer, & Magnotti, 2010). In studies of persons of all ages, area level indicators of SES were associated with non-fatal weapons-related injuries (Krieger et al., 2003), penetrating trauma (Reed, Smith, Helmer, Lancaster, & Carman, 2003), pedestrian injury (Chakravarthy, Anderson, Ludlow, Lotfipour, & Vaca, 2010) and fire- & burn-related injuries (Edelman, Cook, & Saffle, 2010; Istre, McCoy, Osborn, Barnard, & Bolton, 2001; Shai, 2006).
4.2. Studies of both fatal and non-fatal injury
Eleven studies examined SES and injury relationships in studies of injuries that were both fatal and non-fatal (Table 4). Seven of these involved pediatric samples. About half of these studies (n = 5) were ecological.
4.2.1. Studies of fatal & non-fatal intentional injury
Only two studies in this review addressed intentional injury with both fatal and non-fatal injury outcomes; both were focused on children. One found parental education to be significantly inversely related to abusive head trauma in young children in Pennsylvania (Kesler et al., 2008). The other, an ecological study, found intentional injuries to children were found to be associated with lower county mean income and higher percentages of children living in poverty in Ohio (Anderson, Pomerantz, & Gittelman, 2014).
4.2.2. Studies of fatal and non-fatal unintentional injuries and injuries from all intents
4.2.2.1. Children & adolescents.
Three of these studies focused on children in individual-level analyses. In two smaller studies using hospital data and zip code median income to estimate individual income, one found income to be inversely related to penetrating injury in children (Schecter, Betts, Schecter, & Victorino, 2012), while a study of firearm injury found no significant association to income (Martin et al., 2012). Lee, Moriarty, Tashjian, and Patterson (2013) found lower income to be related to higher risk of firearm injury death in children using data from the Kids’s Inpatient database.
There were two ecological studies of injuries to children, both demonstrating inverse relationships between SES and injury. A study of 209 census tracts in Ohio showed pediatric injury resulting in hospitalization or death was associated with lower tract-level education, income, employment, and with higher poverty (Pomerantz, Dowd, & Buncher, 2001).
Burn injuries and fatalities were associated with census block group-level deprivation in a spatial analysis of 988 block groups in St. Louis (Williams, Schootman, Quayle, Struthers, & Jaffe, 2003).
4.2.2.2. Adults/all ages.
An individual-level study of the military population demonstrated higher numbers of fall-related injuries and among individuals with lower educational attainment and lower military ranks in descriptive analyses (Senier, Bell, Yore, & Amoroso, 2002). An ecological study of injuries from all intents to people of all ages in two Southern California counties (Cinat, Wilson, Lush, & Atkins, 2004) demonstrated positive relationships between county traumatic injury rates and the county unemployment rate, as well as the number of unemployed individuals in the county. One study investigated injury deaths due to tornado events in a national dataset and found no association to census tract-level deprivation (Donner, 2007).
5. Discussion
The results of this systematic review of injury studies provides an opportunity to compare the methods and results of studies published from 2002 to 2015 to those reviewed by Cubbin and Smith (2002), which were published between 1960 and 2001. While the reviews have some differences (e.g., Cubbin & Smith included all English-language studies; the current review contains only studies from the United States), comparing them allows for consideration of how patterns and methods have changed or remained the same.
5.1. Socioeconomic disparities in injury
The results of this review demonstrate that disparities in injury by socioeconomic status persist, with 78 of 119 studies (66%) finding inverse relationships between at least one SES indicator and the injury outcome under study. Like Cubbin and Smith (2002), this review found that the strength and direction of the SES–injury relationship varies by fatal vs. non-fatal injury, by age of the sample, intentional versus unintentional injury, and by SES indicator.
5.1.1. Fatal injury
In fatal injury research, just over two-thirds of the 31 studies reviewed (77%) demonstrated that lower SES was a significant predictor of the dependent variable, with an additional 16% demonstrating significance for some, but not all, of the sample. Only two studies did not find a significant relationship; one used an area-level measure of SES to proxy individual-level SES in a study of heat-related deaths using a state-level sampling frame (Johnson, Gruenewald, et al., 2009; Johnson, Wilson, et al., 2009); the other found no relationship between tract-level education rates and gun-related deaths by police precinct in New York City (Cerdá et al., 2010). Cubbin and Smith (2002) also found consistent inverse relationships between fatal injury and SES. In their review, associations to suicide demonstrated more mixed results than our review, which found fairly consistent inverse associations for education (Kposowa, 2001; Phillips et al., 2010; Willis et al., 2003) and income (Duberstein et al., 2004; Kposowa, 2001; Wexler et al., 2008; Wiebe, 2003). Note that many of these studies addressed specific populations (e.g., African Americans, males, Native Americans) and that these studies only addressed completed suicides; there may be other important predictors of suicide attempts and suicidality that would not be reflected in either review.
5.1.2. Non-fatal injury
As in the Cubbin and Smith (2002) review, the findings of the current review indicated that the SES injury-relationship is less consistent across the 77 non-fatal injury studies than in fatal injury studies, demonstrating a significant, inverse relationship 58% of the time (n = 45) and mixed results for some sample sub-groups 12% of the time (n = 9).
Eight studies found a significant, positive relationship to SES, indicating that those with a higher status were at increased risk of injury. Three of these studies examined an injury associated with recreation, which would be expected to create higher exposure for individuals with more socioeconomic resources (Brown et al., 2006; Holman et al., 2014; Ni et al., 2002); the other five explored more minor injuries or work-related injuries. In one study, higher pay among home health workers, the only SES measure in the study, was related to higher injury (Houston et al., 2013); this could be problematic measure as it may reflect overtime pay, night-time pay or other conditions where the risk of injury could be higher. The studies all involved non-life threatening injuries (e.g., back injury, musculoskeletal injury, injury in the past year or requiring a medical visit).
Cubbin and Smith (2002) hypothesized that less consistent relationships among studies of non-life threating, non-fatal injuries and SES may be due to the fact that these injuries are often assessed by utilization of medical care. Many studies used the methodology from the National Health Interview Survey, which records self-report of injury requiring medical attention in a preceding period of time (which varied by study). In addition to concerns that accompany any self-report data, chiefly recall bias in this case is the medical care part of this definition. People of lower SES are less likely to have economic resources that allow for acute care. Therefore, some unknown portion of the samples in studies using this methodology are people who likely sustained injuries of similar severity but did not pursue medical care, resulting in selection bias. In other words, this conceptualization of the injury variable may miss occurrences of the dependent variable among low-SES participants, creating a false negative (Type II error) by demonstrating a null finding when there is actually a significant relationship.
5.2. Implications for future research
The findings of this review have implications for the conduct of injury research that involves assessment of SES variables. In summary, there are three primary takeaways for future injury research: (a) measures of SES should have as many categories as is feasible so that changes in injury risk across the SES gradient can be assessed; (b) there is value in utilizing multiple levels of SES assessment, so that relationships between both person and place characteristics and injury risk can be accounted for; and (c) measures of SES should be selected based on their relationship to the injury mechanism and their performance in previous research.
5.2.1. Assessing the gradient
Many studies in our review continued to dichotomize SES variables, which loses important information about the SES gradient. As Adler et al. (1994, p. 16) point out, “the relationship of [SES] to health is not simply a threshold effect in which morbidity and mortality increase only at severe levels of deprivation, but is a graded relationship occurring at all levels within the spectrum of social position.” In other words, it is not only the poorest group that is more likely to experience negative health outcomes; there are varying degrees of effects on health at all levels of SES, and improvements in health status at each step-up in level of SES. Studies in this review that measured SES on a gradient found significant, inverse relationships to SES nearly twice as often than studies that did not (65% vs 35%). Whenever possible, injury studies should allow variation in the measures of SES and look at changes in injury risk by level of SES, and should include samples large enough to allow for these assessments.
5.2.2. Measuring at multiple ecological levels
Ecological models are integral to examining the socioeconomic factors that influence injury outcomes. Individual, interpersonal (household), and area-level (neighborhood, community) socioeconomic factors have all been shown to be significantly related to injury and injury-related death (Cubbin et al., 2000; Cubbin & Smith, 2002) and the results of this review echo those findings. Measures of socioeconomic factors are most meaningful when they are measured at multiple ecological levels (Krieger, Williams, & Moss, 1997), according to the pathways of etiology for the injury outcome under consideration (Braveman et al., 2005). There were no studies in this review that could be considered multiple level studies, which would involve using both individual and area measures of SES in assessing risk for individual injury; in comparison, Cubbin and Smith identified only two. This is an area where injury research has significant room to grow.
5.2.3. Selection of measures
SES measurement is not a one-size-fits-all task (Braveman et al., 2005); various mechanisms of injury are linked more closely to certain SES predictors. The results of this review highlight some of these essential relationships, such as parental education, fatal child injury, area-level deprivation and violence-related injury and death. Other measures perform with less clarity, or only predict injury outcomes in certain groups. For instance, in suicide studies, lower income and education appear to be important predictor variables for older white males, but not among other groups. In Krieger et al. (2003), important differences in the performance of SES measures (in terms of detecting differences along the SES gradient) were found in intentional and unintentional weapons-related injury. In the intentional injury data, measures of deprivation (e.g., poverty, median household income) performed better than measures of wealth or income inequality. In unintentional injury studies, measures of occupational class and educational level were able to detect more detail in the SES gradient (which is less steep for unintentional injuries than intentional). In our review studies that included multiple measures of SES detected a significant relationship 62% of the time, compared to 38% in studies that used only one measure.
Injury researchers should select and conceptualize measures of SES carefully, with an eye to previous research, causal pathways, and context. Additionally, the results of this review do suggest that area-level measures of SES are important variables to include when assessing injury risk, and may predict injury even when individual-level measures do not.
5.3. Implications for policy
Much of the research presented in this review is conducted using secondary data. This data originates in survey datasets, hospital records, and medical examiners reports; each such location has an opportunity to collect meaningful data on SES that can contribute to eliminating health disparities. Policies from the agencies that regulate health care providers (and the government bodies that regulate those agencies) could integrate collection of additional SES variables to facilitate heath disparities research into existing systems. Hospital record keeping programs are upgraded fairly often and present a unique and rich opportunity for gathering data. Financial data are often gathered by hospitals and stored in separate databases used for billing purposes, or for assessing financial aid to patients. If regulatory agencies required reporting of financial data along with the medical information that is already reported to national clearinghouses, such as the National Trauma Databank, researchers would be able to identify additional valuable information that could contribute significantly to reductions in public health disparities. Many survey datasets could also be improved in order to enhance disparities research.
5.4. Limitations
The results of this review should be considered in light of its limitations. Study selection could be impacted by publication and selection biases. We made every effort to locate studies meeting our inclusion criteria indexed in PubMed. While PubMed is extensive, it may not catalog every injury study and we cannot eliminate the possibility of selection bias. Studies were selected with particular criteria for defining injury; only studies with actual injuries as the dependent variable were included. Certainly other types of injury studies, such as those that examine events that cause injury (e.g., intimate partner violence, motor vehicle collisions) also examine SES, however, those studies were excluded from this review.
6. Conclusions
In summary, this review was focused on exploring the relationship of SES to injury through a systematic review of recent injury studies, and a discussion of the methodological considerations, especially around conceptualizing and operationalizing SES measures in injury research. Injury remains a leading cause of death and disability in the United States, and socioeconomic disparities in injury persist.
By understanding the contribution of SES to injury risk, and by committing to measuring it effectively and holistically, injury researchers can contribute to lessening this gap. Although major concerns about the measurement of SES in injury research have been discussed previously, there is still a need to improve collection of these variables. In particular, injury research should identify and collect SES variables that are related to the particular injury outcome at hand, as demonstrated by previous research, theory and conceptual pathways, and local context (if applicable). In addition, SES variables will ideally be measured and analyzed in ways that allow for assessment of gradient effects; creating false dichotomies of the “poor” and “not poor” prevents injury researchers from understanding how risk increases by changing levels of SES, and/or where the threshold for increased risk may exist. Finally, both individual and area-level measures of SES affect a person’s risk for many injury outcomes, and whenever feasible, the SES of both the person and the place in which they live should be assessed.
Funding:
This research did not receive any specific grant from funding agencies in the public, commercial, or not-for-profit sectors.
Biographies
Paula Yuma-Guerrero, PhD is an Assistant Professor at the School of Social Work at Colorado State University. Prior to obtaining her PhD at The University of Texas at Austin in 2014, Dr. Yuma coordinated pediatric injury prevention programs at Level I Trauma Centers and served on local and state injury prevention committees. Dr. Yuma-Guerrero’s current research focuses on how community-level factors affect individual health and wellbeing.
Rebecca Orsi, PhD a Research Scientist and Statistician with the Social Work Research Center at the School of Social Work, Colorado State University. Her educational background includes a Master of Science in Statistics and a PhD in Research Methodology, both from Colorado State University. Dr. Orsi’s research interests include child welfare outcomes for special populations, such as adopted children or children with special health needs.
Ping-tzu Lee, PhD is a recent doctoral graduate of the School of Social Work at Colorado State University. Her research interests include resilience in children, critical issues for culturally diverse populations, equine-assisted therapy and mental health.
Catherine Cubbin, PhD is a Professor and Associate Dean for Research in the School of Social Work at the University of Texas at Austin, a Faculty Research Associate at the Population Research Center at the University of Texas at Austin, and a Faculty Associate at the Center for Women’s and Gender Studies, also at UT Austin. Dr. Cubbin received her PhD in Health and Social Policy from the Johns Hopkins University Bloomberg School of Public Health in 1998. Dr. Cubbin’s research focuses on using epidemiological methods to better understand social inequalities in health for the purpose of informing policy.
References
- Adler, Boyce, Chesney, Cohen, Folkman, Kahn, & Syme (1994). Socioeconomic status and health: The challenge of the gradient. American Psychologist, 49(1), 15. [DOI] [PubMed] [Google Scholar]
- Allareddy, Itty, Maiorini, Lee, Rampa, Allareddy, & Nalliah (2014). Emergency department visits with facial fractures among children and adolescents: An analysis of profile and predictors of causes of injuries. Journal of Oral and Maxillofacial Surgery, 72(9), 1756–1765. [DOI] [PubMed] [Google Scholar]
- Anderson, Pomerantz, & Gittelman (2014). Intentional injuries in young Ohio children: Is there urban/rural variation? Journal of Trauma and Acute Care Surgery, 77(3), S36–S40. [DOI] [PubMed] [Google Scholar]
- Bell, Arrington, & Adams (2015). Census-based socioeconomic indicators for monitoring injury causes in the USA: A review. Injury Prevention, 21(4), 278–284. 10.1136/injuryprev-2014-041444. [DOI] [PMC free article] [PubMed] [Google Scholar]
- Bilston, Finch, Hatfield, & Brown (2008). Age-specific parental knowledge of restraint transitions influences appropriateness of child occupant restraint use. Injury Prevention, 14(3), 159–163. [DOI] [PubMed] [Google Scholar]
- Bishai, Trevitt, Zhang, McKenzie, Leventhal, Gielen, & Guyer (2008). Risk factors for unintentional injuries in children: Are grandparents protective? Pediatrics, 122(5), e980–e987. [DOI] [PubMed] [Google Scholar]
- Boyer, Galizzi, Cifuentes, d’Errico, Gore, Punnett, & Slatin (2009). Ergonomic and socioeconomic risk factors for hospital workers’ compensation injury claims. American Journal of Industrial Medicine, 52(7), 551–562. [DOI] [PMC free article] [PubMed] [Google Scholar]
- Boyle, & Hassett-Walker (2008). Individual-level and socio-structural characteristics of violence an emergency department study. Journal of Interpersonal Violence, 23(8), 1011–1026. [DOI] [PubMed] [Google Scholar]
- Branas, Richmond, & Schwab (2004). Firearm homicide and firearm suicide: Opposite but equal. Public Health Reports, 119(2), 114. [DOI] [PMC free article] [PubMed] [Google Scholar]
- Braveman, Cubbin, Egerter, Chideya, Marchi, Metzler, & Posner (2005). Socioeconomic status in health research: One size does not fit all. JAMA, 294(22), 2879–2888 (doi:294/22/2879 [pii] 10.1001/jama.294.22.2879 [doi]). [DOI] [PubMed] [Google Scholar]
- Braveman, Cubbin, Egerter, Williams, & Pamuk (2010). Socioeconomic disparities in health in the United States: What the patterns tell us. American Journal of Public Health, 100(S1). [DOI] [PMC free article] [PubMed] [Google Scholar]
- Brown, Quain, Troxel, & Gelfand (2006). The epidemiology of sunburn in the US population in 2003. Journal of the American Academy of Dermatology, 55(4), 577–583. [DOI] [PubMed] [Google Scholar]
- Carlberg, Shapiro-Mendoza, & Goodman (2012). Maternal and infant characteristics associated with accidental suffocation and strangulation in bed in US infants. Maternal and Child Health Journal, 16(8), 1594–1601. [DOI] [PubMed] [Google Scholar]
- Centers for Disease Control and Prevention (2013). Cdc health disparities and inequalities report, United States 2013. Morbidity and Mortality Weekly Report, 62(3), 1–186.23302815 [Google Scholar]
- Centers for Disease Control and Prevention - National Center for Injury Prevention and Control (2015). Poisoning. Retrieved from https://www.cdc.gov/homeandrecreationalsafety/poisoning/index.html.
- Centers for Disease Control and Prevention - National Center for Injury Prevention and Control (2017). Web-based injury statistics query and reporting system (Wisqars). Retrieved from http://www.cdc.gov/injury/wisqars.
- Cerdá, Messner, Tracy, Vlahov, Goldmann, Tardiff, & Galea (2010). Investigating the effect of social changes on age-specific gun-related homicide rates in New York City during the 1990s. American Journal of Public Health, 100(6), 1107–1115. [DOI] [PMC free article] [PubMed] [Google Scholar]
- Chakravarthy, Anderson, Ludlow, Lotfipour, & Vaca (2010). The relationship of pedestrian injuries to socioeconomic characteristics in a large Southern California County. Traffic Injury Prevention, 11(5), 508–513 (doi:927276611 [pii] 10.1080/15389588.2010.497546 [doi]). [DOI] [PubMed] [Google Scholar]
- Chakravarthy, Anderson, Ludlow, Lotfipour, & Vaca (2012). A geographic analysis of collisions involving child pedestrians in a large Southern California County. Traffic Injury Prevention, 13(2), 193–198. [DOI] [PubMed] [Google Scholar]
- Chang, Berg, Saltzman, & Herndon (2005). Homicide: A leading cause of injury deaths among pregnant and postpartum women in the United States, 1991–1999. American Journal of Public Health, 95(3). [DOI] [PMC free article] [PubMed] [Google Scholar]
- Cheng, Schwarz, Brenner, Wright, Fields, O’Donnell, ... Scheidt (2003). Adolescent assault injury: Risk and protective factors and locations of contact for intervention. Pediatrics, 112(4), 931–938. [DOI] [PubMed] [Google Scholar]
- Cinat, Wilson, Lush, & Atkins (2004). Significant correlation of trauma epidemiology with the economic conditions of a community. Archives of Surgery, 139(12), 1350. [DOI] [PubMed] [Google Scholar]
- Clouston, Rubin, Colen, & Link (2014). Social inequalities in suicide: The role of selective serotonin reuptake inhibitors. American Journal of Epidemiology, 180(7), 696–704. [DOI] [PubMed] [Google Scholar]
- Cralley (2007). Socioeconomic status. In Baumeister RF, & Vohs KD (Eds.), Encyclopedia of social psychology. Vol. 2. (pp. 927–928). Thousand Oaks, CA: Sage Publications. [Google Scholar]
- Crandall, Chiu, & Sheehan (2006). Injury in the first year of life: Risk factors and solutions for high-risk families. The Journal of Surgical Research, 133(1), 7–10 (doi:S0022-4804 (06)00075-8 [pii] 10.1016/j.jss.2006.02.027 [doi]). [DOI] [PubMed] [Google Scholar]
- Crandall, Han, Greendale, Seeman, Tepper, Thurston, ... Karlamangla (2014). Socioeconomic status in relation to incident fracture risk in the study of Women’s health across the nation. Osteoporosis International, 25(4), 1379–1388. [DOI] [PMC free article] [PubMed] [Google Scholar]
- Crandall, Sridharan, & Schermer (2010). Injury and health among toddlers in vulnerable families. The Journal of Trauma and Acute Care Surgery, 68(5), 1128–1133. [DOI] [PubMed] [Google Scholar]
- Cubbin, LeClere, & Smith (2000). Socioeconomic status and injury mortality: Individual and Neighbourhood determinants. Journal of Epidemiology and Community Health, 54(7), 517–524. 10.1136/jech.54.7.517. [DOI] [PMC free article] [PubMed] [Google Scholar]
- Cubbin, Pollack, Flaherty, Hayward, Sania, Vallone, & Braveman (2011). Assessing alternative measures of wealth in health research. American Journal of Public Health, 101(5), 939–947 (doi:AJPH.2010.194175 [pii] 10.2105/AJPH.2010.194175 [doi]). [DOI] [PMC free article] [PubMed] [Google Scholar]
- Cubbin, & Smith (2002). Socioeconomic inequalities in injury: Critical issues in design and analysis. Annual Review of Public Health, 23(1), 349–375. 10.1146/annurev.publhealth.23.100901.140548. [DOI] [PubMed] [Google Scholar]
- Dembe, Erickson, & Delbos (2004). Predictors of work-related injuries and illnesses: National survey findings. Journal of Occupational and Environmental Hygiene, 1(8), 542–550. [DOI] [PubMed] [Google Scholar]
- Denney, & He (2014). The social side of accidental death. Social Science Research, 43, 92–107. [DOI] [PubMed] [Google Scholar]
- Donner (2007). The political ecology of disaster: An analysis of factors influencing US tornado fatalities and injuries, 1998–2000. Demography, 44(3), 669–685. [DOI] [PubMed] [Google Scholar]
- Duberstein, Conwell, Conner, Eberly, & Caine (2004). Suicide at 50 years of age and older: Perceived physical illness, family discord and financial strain. Psychological Medicine, 34(1), 137–146. [DOI] [PubMed] [Google Scholar]
- Edelman, Cook, & Saffle (2010). Burn injury in Utah: Demographic and geographic risks. Journal of Burn Care & Research, 31(3), 375–384. 10.1097/BCR.0b013e3181db51b0. [DOI] [PubMed] [Google Scholar]
- Faulkner, Landsittel, & Hendricks (2001). Robbery characteristics and employee injuries in convenience stores*†. American Journal of Industrial Medicine, 40(6), 703–709. [DOI] [PubMed] [Google Scholar]
- Florence, Haegerich, Simon, Zhou, & Luo (2015). Estimated lifetime medical and work-loss costs of emergency department–treated nonfatal injuries—United States, 2013. MMWR. Morbidity and Mortality Weekly Report, 64(38), 1078–1082. [DOI] [PubMed] [Google Scholar]
- Forrest, & Cali (2009). Epidemiology of lifetime work-related eye injuries in the US population associated with one or more lost days of work. Ophthalmic Epidemiology, 16 (3), 156–162. [DOI] [PubMed] [Google Scholar]
- Freisthler, Gruenewald, Ring, & LaScala (2008). An ecological assessment of the population and environmental correlates of childhood accident, assault, and child abuse injuries. Alcoholism, Clinical and Experimental Research, 32(11), 1969–1975 (doi:ACER785 [pii] 10.1111/j.1530-0277.2008.00785.x [doi]). [DOI] [PMC free article] [PubMed] [Google Scholar]
- Frencher, Benedicto, Kendig, Herman, Barlow, & Pressley (2010). A comparative analysis of serious injury and illness among homeless and housed low income residents of New York City. The Journal of Trauma, 69(Suppl. 4), S191–199 (doi: 10.1097/TA.0b013e3181f1d31e [doi]00005373-201010001-00003 [pii]). [DOI] [PubMed] [Google Scholar]
- Frye, Galea, Tracy, Bucciarelli, Putnam, & Wilt (2008). The role of neighborhood environment and risk of intimate partner femicide in a large urban area. American Journal of Public Health, 98(8), 1473–1479 (doi:AJPH.2007.112813 [pii] 10.2105/AJPH.2007.112813 [doi]). [DOI] [PMC free article] [PubMed] [Google Scholar]
- Garzon, Huang, & Todd (2008). Do attention deficit/hyperactivity disorder and oppositional defiant disorder influence preschool unintentional injury risk? Archives of Psychiatric Nursing, 22(5), 288–296. [DOI] [PMC free article] [PubMed] [Google Scholar]
- Gibbons, Hur, Bhaumik, & Mann (2005). The relationship between antidepressant medication use and rate of suicide. Archives of General Psychiatry, 62(2), 165. [DOI] [PubMed] [Google Scholar]
- Glymour, Avendano, & Kawachi (2014). Socioeconomic status and health. In Berkman L, Kawachi I, & Glymour MM (Eds.), Social epidemiology (pp. 17–63) (2nd ed.). New York, NY: Oxford University Press. [Google Scholar]
- Grunwaldt, Smith, Zuckerbraun, Naran, Rottgers, Bykowski, ... Losee (2011). Pediatric facial fractures: Demographics, injury patterns, and associated injuries in 772 consecutive patients. Plastic and Reconstructive Surgery, 128(6), 1263–1271. 10.1097/PRS.0b013e318230c8cf. [DOI] [PubMed] [Google Scholar]
- Haley, & Talbot (2004). Geographic analysis of blood lead levels in New York state children born 1994–1997. Environmental Health Perspectives, 112(15), 1577. [DOI] [PMC free article] [PubMed] [Google Scholar]
- Harris, Fisher, & Thomas (2012). Homicide as a medical outcome: Racial disparity in deaths from assault in US level I and II trauma centers. Journal of Trauma and Acute Care Surgery, 72(3), 773–782 (doi: 10.1097/TA.0b013e318226eb39 [doi]01586154-201203000-00035 [pii]). [DOI] [PubMed] [Google Scholar]
- Hemenway, Barber, & Miller (2010). Unintentional firearm deaths: A comparison of other-inflicted and self-inflicted shootings. Accident Analysis & Prevention, 42(4), 1184–1188 (doi:S0001-4575(10)00011-4 [pii] 10.1016/j.aap.2010.01.008 [doi]). [DOI] [PubMed] [Google Scholar]
- Holder, Peden, Kruge, Lund, Gururaj, & Kobusingye (Eds.). (2001). Injury surveillance guidelines. Geneva: World Health Organization. [Google Scholar]
- Holman, Berkowitz, Guy, Hartman, & Perna (2014). The association between demographic and behavioral characteristics and sunburn among US adults—National Health Interview Survey, 2010. Preventive Medicine, 63, 6–12. [DOI] [PMC free article] [PubMed] [Google Scholar]
- Houston, Young, & Fitzgerald (2013). Work-related injuries an old problem revisited in the first representative US sample of home health aides. Journal of Aging and Health, 25(6), 1065–1081. [DOI] [PubMed] [Google Scholar]
- Hsiao, Cameron, Huh, Hsu, Benigni, Whitener, & Owens (2012). Clavicle fractures in the United States military: Incidence and characteristics. Military Medicine, 177(8), 970–974. [DOI] [PubMed] [Google Scholar]
- Hsiao, Owens, Burks, Sturdivant, & Cameron (2010). Incidence of acute traumatic patellar dislocation among active-duty United States military service members. The American Journal of Sports Medicine, 38(10), 1997–2004. [DOI] [PubMed] [Google Scholar]
- Istre, McCoy, Carlin, & McClain (2002). Residential fire related deaths and injuries among children: Fireplay, smoke alarms, and prevention. Injury Prevention, 8(2), 128–132. [DOI] [PMC free article] [PubMed] [Google Scholar]
- Istre, McCoy, Osborn, Barnard, & Bolton (2001). Deaths and injuries from house fires. The New England Journal of Medicine, 344(25), 1911–1916. 10.1056/NEJM200106213442506. [DOI] [PubMed] [Google Scholar]
- Jain, Khoshnood, Lee, & Concato (2001). Injury related infant death: The impact of race and birth weight. Injury Prevention, 7(2), 135–140. [DOI] [PMC free article] [PubMed] [Google Scholar]
- Johnson, Gruenewald, & Remer (2009). Suicide and alcohol: Do outlets play a role? Alcoholism: Clinical and Experimental Research, 33(12), 2124–2133. [DOI] [PMC free article] [PubMed] [Google Scholar]
- Johnson, Wilson, & Luber (2009). Socioeconomic indicators of heat-related health risk supplemented with remotely sensed data. International Journal of Health Geographics, 8, 57. [DOI] [PMC free article] [PubMed] [Google Scholar]
- Johnston, Bennett, Quan, Gonzalez-Walker, Crispin, & Ebel (2008). Factors influencing booster seat use in a multiethnic community: Lessons for program implementation. Health Promotion Practice, 10(3), 411–418. [DOI] [PubMed] [Google Scholar]
- Johnston, & Martin-Herz (2010). Correlates of Reinjury risk in sibling groups: A prospective observational study. Pediatrics, 125(3), 483–490. [DOI] [PubMed] [Google Scholar]
- Jones, Homa, Meyer, Brody, Caldwell, Pirkle, & Brown (2009). Trends in blood lead levels and blood lead testing among US children aged 1 to 5 years, 1988–2004. Pediatrics, 123(3), e376–385 (doi:123/3/e376 [pii] 10.1542/peds.2007-3608 [doi]). [DOI] [PubMed] [Google Scholar]
- Kaplowitz, Perlstadt, & Post (2010). Comparing lead poisoning risk assessment methods: Census block group characteristics vs. zip codes as predictors. Public Health Reports, 125(2), 234–245. [DOI] [PMC free article] [PubMed] [Google Scholar]
- Kaufman, Cooper, & McGee (1997). Socioeconomic status and health in blacks and whites: The problem of residual confounding and the resiliency of race. Epidemiology, 8(6), 621–628. 10.2307/3702653. [DOI] [PubMed] [Google Scholar]
- Kaufman, Graham, Lezotte, Fauerbach, Gabriel, Engrav, & Esselman (2007). Burns as a result of assault: Associated risk factors, injury characteristics, and outcomes. Journal of Burn Care & Research, 28(1), 21–28. [DOI] [PubMed] [Google Scholar]
- Keough, Lanuza, Jennrich, Gulanick, & Holm (2001). Characteristics of the trauma recidivist: An exploratory descriptive study. Journal of Emergency Nursing, 27(4), 340–346. [DOI] [PubMed] [Google Scholar]
- Kesler, Dias, Shaffer, Rottmund, Cappos, & Thomas (2008). Demographics of abusive head trauma in the commonwealth of Pennsylvania. Journal of Neurosurgery. Pediatrics, 1 (5), 351–356. 10.3171/PED/2008/1/5/351. [DOI] [PubMed] [Google Scholar]
- Kim, Staley, Curtis, & Buchanan (2002). Relation between housing age, housing value, and childhood blood lead levels in children in Jefferson County, Ky. American Journal of Public Health, 92(5), 769. [DOI] [PMC free article] [PubMed] [Google Scholar]
- Kposowa (2001). Unemployment and suicide: A cohort analysis of social factors predicting suicide in the US national longitudinal mortality study. Psychological Medicine, 31(1), 127–138. [DOI] [PubMed] [Google Scholar]
- Krieger (2010). Workers are people too: Societal aspects of occupational health disparities—An ecosocial perspective. American Journal of Industrial Medicine, 53(2), 104–115. 10.1002/ajim.20759. [DOI] [PubMed] [Google Scholar]
- Krieger, Waterman, Chen, Soobader, & Subramanian (2003). Monitoring socioeconomic inequalities in sexually transmitted infections, tuberculosis, and violence: Geocoding and choice of area-based socioeconomic measures—the public health disparities geocoding project (US). Public Health Reports, 118(3), 240. [DOI] [PMC free article] [PubMed] [Google Scholar]
- Krieger, Williams, & Moss (1997). Measuring social class in US public health research: Concepts, methodologies, and guidelines. Annual Review of Public Health, 18(1), 341–378. [DOI] [PubMed] [Google Scholar]
- Laflamme, Hasselberg, & Burrows (2010). The social inequalities in health risks related to unintentional injuries among children. Environment and health risks: A review of the influence and effects of social inequalities. [Google Scholar]
- Lee, Harrington, Chang, & Connors (2007). Increased risk of injury in children with developmental disabilities. Research in Developmental Disabilities, 29(3), 247–255. [DOI] [PubMed] [Google Scholar]
- Lee LC, Harrington RA, Chang JJ, & Connors SL (2008). Increased risk of injury in children with developmental disabilities. Research in developmental disabilities, 29(3), 247–255. [DOI] [PubMed] [Google Scholar]
- Lee, Moriarty, Tashjian, & Patterson (2013). Guns and states: Pediatric firearm injury. Journal of Trauma and Acute Care Surgery, 75(1), 50–53. [DOI] [PubMed] [Google Scholar]
- Leff, Stallones, Keefe, Rosenblatt, & Reeds (2003). Comparison of urban and rural nonfatal injury: The results of a statewide survey. Injury Prevention, 9(4), 332–337. [DOI] [PMC free article] [PubMed] [Google Scholar]
- Leininger, Ryan, & Kalil (2009). Low-income Mothers’ social support and Children’s injuries. Social Science & Medicine, 68(12), 2113–2121 (doi:S0277–9536(09)00172–5 [pii] 10.1016/j.socscimed.2009.03.013 [doi]). [DOI] [PubMed] [Google Scholar]
- Lipsky, Caetano, Field, & Bazargan (2004). Violence-related injury and intimate partner violence in an urban emergency department. The Journal of Trauma and Acute Care Surgery, 57(2), 352–359. [DOI] [PubMed] [Google Scholar]
- Lo, Howell, & Cheng (2015). Racial disparities in age at time of homicide victimization a test of the multiple disadvantage model. Journal of Interpersonal Violence, 30(1), 152–167. [DOI] [PubMed] [Google Scholar]
- Luo, Beckles, Fang, Crews, Saaddine, & Zhang (2012). Socioeconomic status and lifetime risk for workplace eye injury reported by a US population aged 50 years and over. Ophthalmic Epidemiology, 19(2), 103–110. 10.3109/09286586.2011.639977. [DOI] [PubMed] [Google Scholar]
- Macy, & Freed (2012). Child passenger safety practices in the US: Disparities in light of updated recommendations. American Journal of Preventive Medicine, 43(3), 272–281. [DOI] [PubMed] [Google Scholar]
- Malcoe, Lynch, Keger, & Skaggs (2002). Lead sources, behaviors, and socioeconomic factors in relation to blood lead of native American and white children: A community-based assessment of a former mining area. Environmental Health Perspectives, 110 (Suppl. 2), 221–231 (doi:sc271_5_1835 [pii). [DOI] [PMC free article] [PubMed] [Google Scholar]
- Marcin, Schembri, He, & Romano (2003). A population-based analysis of socioeconomic status and insurance status and their relationship with pediatric trauma hospitalization and mortality rates. American Journal of Public Health, 93(3), 461–466. [DOI] [PMC free article] [PubMed] [Google Scholar]
- Martin, Unni, Landman, Feurer, McMaster, Dabrowiak, ... Lovvorn III (2012). Race disparities in firearm injuries and outcomes among Tennessee children. Journal of Pediatric Surgery, 47(6), 1196–1203. [DOI] [PubMed] [Google Scholar]
- McCall, Parker, & MacDonald (2008). The dynamic relationship between homicide rates and social, economic, and political factors from 1970 to 2000*. Social Science Research, 37(3), 721–735. [DOI] [PubMed] [Google Scholar]
- Mericli AF, DeCesare GE, Zuckerbraun NS, Kurland KS, Grunwaldt L, Vecchione L, & Losee JE (2011). Pediatric craniofacial fractures due to violence: Comparing violent and nonviolent mechanisms of injury. Journal of Craniofacial Surgery, 22(4), 1342–1347. [DOI] [PubMed] [Google Scholar]
- Miller, Piper, Ahern, Tracy, Tardiff, Vlahov, & Galea (2005). Income inequality and risk of suicide in New York City neighborhoods: A multilevel case-control study. Suicide & Life-Threatening Behavior, 35(4), 448–459. 10.1521/suli.2005.35.4.448. [DOI] [PubMed] [Google Scholar]
- National Library of Medicine (2012, September 18). Retrieved from http://www.ncbi.nlm.nih.gov/pubmedhealth/.
- Ni, Barnes, & Hardy (2002). Recreational injury and its relation to socioeconomic status among school aged children in the US. Injury Prevention, 8(1), 60–65. [DOI] [PMC free article] [PubMed] [Google Scholar]
- Nriagu, Senthamarai-Kannan, Jamil, Fakhori, & Korponic (2011). Lead poisoning among Arab American and African American children in the Detroit Metropolitan Area, Michigan. Bulletin of Environmental Contamination and Toxicology, 87 (3), 238–244. [DOI] [PubMed] [Google Scholar]
- Oakes, & Rossi (2003). The measurement of SES in Health Research: Current practice and steps toward a new approach. Social Science & Medicine, 56(4), 769–784. 10.1016/S0277-9536(02)00073-4. [DOI] [PubMed] [Google Scholar]
- Pabayo, Molnar, & Kawachi (2014). The role of neighborhood income inequality in adolescent aggression and violence. Journal of Adolescent Health, 55(4), 571–579. [DOI] [PubMed] [Google Scholar]
- Phillips, Robin, Nugent, & Idler (2010). Understanding recent changes in suicide rates among the middle-aged: Period or cohort effects? Public Health Reports, 125(5), 680. [DOI] [PMC free article] [PubMed] [Google Scholar]
- Polivka, Elliott, & Wolowich (2002). Comparison of poison exposure data: Nhis and Tess data. Clinical Toxicology, 40(7), 839–845. [DOI] [PubMed] [Google Scholar]
- Pomerantz, Dowd, & Buncher (2001). Relationship between socioeconomic factors and severe childhood injuries. Journal of Urban Health, 78(1), 141–151. 10.1093/jurban/78.1.141. [DOI] [PMC free article] [PubMed] [Google Scholar]
- Price, Shi, Lu, Smith, Stallones, Wheeler, & Xiang (2012). Nonoccupational and occupational injuries to US workers with disabilities. American Journal of Public Health, 102 (9), e38–e46. [DOI] [PMC free article] [PubMed] [Google Scholar]
- Purselle, Heninger, Hanzlick, & Garlow (2009). Differential association of socioeconomic status in ethnic and age-defined suicides. Psychiatry Research, 167(3), 258–265 (doi:S0165-1781(08)00040-1 [pii] 10.1016/j.psychres.2008.02.003 [doi]). [DOI] [PMC free article] [PubMed] [Google Scholar]
- Putnam-Hornstein (2011). Report of maltreatment as a risk factor for injury death a prospective birth cohort study. Child Maltreatment, 16(3), 163–174. [DOI] [PubMed] [Google Scholar]
- Rastogi, Nandlike, & Fenster (2007). Elevated blood lead levels in pregnant women: Identification of a high-risk population and interventions. Journal of Perinatal Medicine, 35 (6), 492–496. [DOI] [PubMed] [Google Scholar]
- Rauscher, & Myers (2008). Socioeconomic disparities in the prevalence of work-related injuries among adolescents in the United States. The Journal of Adolescent Health, 42 (1), 50–57 (doi:S1054–139X(07)00328-X [pii] 10.1016/j.jadohealth.2007.08.003 [doi]). [DOI] [PubMed] [Google Scholar]
- Reed, Smith, Helmer, Lancaster, & Carman (2003). Rates of unemployment and penetrating trauma are correlated. Southern Medical Journal, 96(8), 772–774. [DOI] [PubMed] [Google Scholar]
- Rewers, Hedegaard, Lezotte, Meng, Battan, Emery, & Hamman (2005). Childhood femur fractures, associated injuries, and sociodemographic risk factors: A population-based study. Pediatrics, 115(5), e543–e552. [DOI] [PubMed] [Google Scholar]
- Rich, & Sullivan (2001). Correlates of violent assault among young male primary care patients. Journal of Health Care for the Poor and Underserved, 12(1), 103–112. [DOI] [PubMed] [Google Scholar]
- Robinson, Boscardin, George, Teklehaimanot, Heslin, & Bluthenthal (2009). The effect of urban street gang densities on small area homicide incidence in a large Metropolitan County, 1994–2002. Journal of Urban Health, 86(4), 511–523. [DOI] [PMC free article] [PubMed] [Google Scholar]
- Roy, Knapik, Ritland, Murphy, & Sharp (2012). Risk factors for musculoskeletal injuries for soldiers deployed to Afghanistan. Aviation, Space, and Environmental Medicine, 83(11), 1060–1066. [DOI] [PubMed] [Google Scholar]
- Saluja, Brenner, Trumble, Smith, Schroeder, & Cox (2006). Swimming pool drownings among US residents aged 5–24 years: Understanding racial/ethnic disparities. American Journal of Public Health, 96(4), 728–733 (doi:AJPH.2004.057067 [pii] 10.2105/AJPH.2004.057067 [doi]). [DOI] [PMC free article] [PubMed] [Google Scholar]
- Schecter, Betts, Schecter, & Victorino (2012). Pediatric penetrating trauma: The epidemic continues. The Journal of Trauma and Acute Care Surgery, 73(3), 721–725. [DOI] [PubMed] [Google Scholar]
- Schneiderman JU, Leslie LK, Hurlburt MS, Zhang J, & Horwitz SM (2012). Caregiver reports of serious injuries in children who remain at home after a child protective services investigation. Maternal and Child Health Journal, 16(2), 328–335. [DOI] [PMC free article] [PubMed] [Google Scholar]
- Schnitzer, & Ewigman (2005). Child deaths resulting from inflicted injuries: Household risk factors and perpetrator characteristics. Pediatrics, 116(5), e687–e693. [DOI] [PMC free article] [PubMed] [Google Scholar]
- Schwebel, & Brezausek (2007). The role of context in risk for pediatric injury: Influences from the home and child care environments. Merrill-Palmer Quarterly, 53(1), 105–130. [Google Scholar]
- Schwebel, & Brezausek (2009). Language acculturation and pediatric injury risk. Journal of Immigrant and Minority Health, 11(3), 168–173. [DOI] [PubMed] [Google Scholar]
- Schwebel, Brezausek, & Belsky (2006). Does time spent in child care influence risk for unintentional injury? Journal of Pediatric Psychology, 31(2), 184–193. [DOI] [PubMed] [Google Scholar]
- Schwebel, Roth, Elliott, Chien, Mrug, Shipp, ... Schuster (2012). Marital conflict and fifth-graders’ risk for injury. Accident Analysis & Prevention, 47, 30–35. [DOI] [PubMed] [Google Scholar]
- Senier, Bell, Yore, & Amoroso (2002). Hospitalizations for fall-related injuries among active-duty army soldiers, 1980–1998. Work: A Journal of Prevention, Assessment and Rehabilitation, 18(2), 161–170. [PMC free article] [PubMed] [Google Scholar]
- Shai (2006). Income, housing, and fire injuries: A census tract analysis. Public Health Reports, 121(2), 149–154. [DOI] [PMC free article] [PubMed] [Google Scholar]
- Shai, & Lupinacci (2003). Fire fatalities among children: An analysis across Philadelphia’s census tracts. Public Health Reports, 118(2), 115–126. [DOI] [PMC free article] [PubMed] [Google Scholar]
- Shavers (2007). Measurement of socioeconomic status in health disparities research. Journal of the National Medical Association, 99(9), 1013–1023. [PMC free article] [PubMed] [Google Scholar]
- Shenassa, Stubbendick, & Brown (2004). Social disparities in housing and related pediatric injury: A multilevel study. American Journal of Public Health, 94(4). [DOI] [PMC free article] [PubMed] [Google Scholar]
- Simon, Emsermann, DiGuiseppi, Davidson, & Hambidge (2008). Latino families report lower child injury rates than white families. International Journal of Injury Control and Safety Promotion, 15(3), 141–150. [DOI] [PubMed] [Google Scholar]
- Sinclair, Smith, & Xiang (2006). A comparison of nonfatal unintentional injuries in the United States among US-born and foreign-born persons. Journal of Community Health, 31(4), 303–325. [DOI] [PubMed] [Google Scholar]
- Sinclair, & Xiang (2008). Injuries among US children with different types of disabilities. American Journal of Public Health, 98(8), 1510–1516. [DOI] [PMC free article] [PubMed] [Google Scholar]
- Singh, & Kogan (2007). Widening socioeconomic disparities in US childhood mortality, 1969–2000. American Journal of Public Health, 97(9), 1658–1665. 10.2105/ajph.2006.087320. [DOI] [PMC free article] [PubMed] [Google Scholar]
- Madkour Spriggs, Martin, Halpern, & Schoenbach (2010). Area disadvantage and intimate partner homicide: An ecological analysis of North Carolina Counties, 2004–2006. Violence and Victims, 25(3), 363–377. [DOI] [PMC free article] [PubMed] [Google Scholar]
- Sprince, Park, Zwerling, Whitten, Lynch, Burmeister, ... Alavanja (2007). Risk factors for low back injury among farmers in Iowa: A case-control study nested in the agricultural health study. Journal of Occupational and Environmental Hygiene, 4(1), 10–16. [DOI] [PubMed] [Google Scholar]
- Sprince, Pospisil, Peek-Asa, Whitten, & Zwerling (2008). Occupational injuries among workers with diabetes: The national health interview survey, 1997–2005. Journal of Occupational and Environmental Medicine, 50(7), 804–808. [DOI] [PubMed] [Google Scholar]
- Sprince, Zwerling, Lynch, Whitten, Thu, Logsden-Sackett, ... Alavanja (2003). Risk factors for agricultural injury: A case-control analysis of Iowa farmers in the agricultural health study. Journal of Agricultural Safety and Health, 9(1), 5–18. [DOI] [PubMed] [Google Scholar]
- Sridharan, & Crandall (2011). Injury and health among children in vulnerable families. The Journal of Trauma, 70(6), 1539–1545 (doi: 10.1097/TA.0b013e3182190b94 [doi] 00005373–201106000-00035 [pii]). [DOI] [PubMed] [Google Scholar]
- Steege, Baron, Marsh, Menéndez, & Myers (2014). Examining occupational health and safety disparities using national data: A cause for continuing concern. American Journal of Industrial Medicine, 57(5), 527–538. [DOI] [PMC free article] [PubMed] [Google Scholar]
- Stiffman, Schnitzer, Adam, Kruse, & Ewigman (2002). Household composition and risk of fatal child maltreatment. Pediatrics, 109(4), 615–621. [DOI] [PubMed] [Google Scholar]
- Strong, & Zimmerman (2005). Occupational injury and absence from work among African American, Hispanic, and non-Hispanic white workers in the national longitudinal survey of youth. American Journal of Public Health, 95(7), 1226–1232. [DOI] [PMC free article] [PubMed] [Google Scholar]
- Taylor, Gary, Arora, Becker, Curtis, Kilgore, ... Yun (2011). Clinical and demographic factors associated with fractures among older Americans. Osteoporosis International, 22 (4), 1263–1274. [DOI] [PMC free article] [PubMed] [Google Scholar]
- U.S. Department of Health and Human Services Office of Disease Prevention and Health Promotion (2015). Healthy people 2020. Retrieved from http://www.healthypeople.gov/2020/About-Healthy-People.
- Vaughan, Anderson, Agran, & Winn (2004). Cultural differences in young Children’s vulnerability to injuries: A risk and protection perspective. Health Psychology, 23(3), 289. [DOI] [PubMed] [Google Scholar]
- Vivier, Hauptman, Weitzen, Bell, Quilliam, & Logan (2011). The important health impact of where a child lives: Neighborhood characteristics and the burden of lead poisoning. Maternal and Child Health Journal, 15(8), 1195–1202. 10.1007/s10995-010-0692-6. [DOI] [PMC free article] [PubMed] [Google Scholar]
- Votruba, & Kling (2009). Effects of neighborhood characteristics on the mortality of black male youth: Evidence from Gautreaux, Chicago. Social Science & Medicine, 68(5), 814–823. [DOI] [PubMed] [Google Scholar]
- Wegner, & Girasek (2003). How readable are child safety seat installation instructions? Pediatrics, 111(3), 588–591. [DOI] [PubMed] [Google Scholar]
- Wexler, Hill, Bertone-Johnson, & Fenaughty (2008). Correlates of Alaska native fatal and nonfatal suicidal behaviors 1990–2001. Suicide & Life-Threatening Behavior, 38(3), 311–320 (doi: 10.1521/suli.2008.38.3.311 [doi]10.1521/suli.2008.38.3.311 pii). [DOI] [PubMed] [Google Scholar]
- Wiebe (2003). Homicide and suicide risks associated with firearms in the home: A national case-control study. Annals of Emergency Medicine, 41(6), 771–782. [DOI] [PubMed] [Google Scholar]
- Williams, Schootman, Quayle, Struthers, & Jaffe (2003). Geographic variation of pediatric burn injuries in a metropolitan area. Academic Emergency Medicine, 10(7), 743–752. [DOI] [PubMed] [Google Scholar]
- Willis, Coombs, Drentea, & Cockerham (2003). Uncovering the mystery: Factors of African American suicide. Suicide and Life-threatening Behavior, 33(4), 412–429. [DOI] [PubMed] [Google Scholar]
- Wilson, Chase, Chrischilles, & Wallace (2006). Hip fracture risk among community-dwelling elderly people in the United States: A prospective study of physical, cognitive, and socioeconomic indicators. American Journal of Public Health, 96(7), 1210–1218 (doi: AJPH.2005.077479 [pii] 10.2105/AJPH.2005.077479 [doi]). [DOI] [PMC free article] [PubMed] [Google Scholar]
- Winston, Chen, Smith, & Elliott (2006). Parent driver characteristics associated with suboptimal restraint of child passengers. Traffic Injury Prevention, 7(4), 373–380. [DOI] [PubMed] [Google Scholar]
- Wirtz, Lombardi, Willetts, Folkard, & Christiani (2012). Gender differences in the effect of weekly working hours on occupational injury risk in the United States working population. Scandinavian Journal of Work, Environment & Health, 38(4), 349–357. [DOI] [PubMed] [Google Scholar]
- Wolinsky, Bentler, Liu, Obrizan, Cook, Wright, ... Ohsfeldt (2009). Recent hospitalization and the risk of hip fracture among older Americans. The Journals of Gerontology Series A: Biological Sciences and Medical Sciences, 64(2), 249–255. [DOI] [PMC free article] [PubMed] [Google Scholar]
- Wu (2009). Intimate homicide between Asians and non-Asians: The impact of community context. Journal of Interpersonal Violence, 24(7), 1148–1164 (doi: 0886260508322191 [pii] 10.1177/0886260508322191 [doi]). [DOI] [PubMed] [Google Scholar]
- Xiang, Stallones, Chen, Hostetler, & Kelleher (2005). Nonfatal injuries among US children with disabling conditions. American Journal of Public Health, 95(11). [DOI] [PMC free article] [PubMed] [Google Scholar]
- Xiang, Yu, Zhang, Scurlock, Smith, & Stallones (2007). Behavioral risk factors and unintentional injuries among US immigrant adults. Annals of Epidemiology, 17(11), 889–898. [DOI] [PubMed] [Google Scholar]
- Xiang, Zhao, Xiang, & Smith (2012). Ed visits for drug-related poisoning in the United States, 2007. The American Journal of Emergency Medicine, 30(2), 293–301 (doi: S0735–6757(10)00583–8 [pii] 10.1016/j.ajem.2010.11.031 [doi]). [DOI] [PubMed] [Google Scholar]
- Zarzaur, Croce, Fabian, Fischer, & Magnotti (2010). A population-based analysis of neighborhood socioeconomic status and injury admission rates and in-hospital mortality. Journal of the American College of Surgeons, 211(2), 216–223 (doi:S1072-7515(10) 00278-4 [pii] 10.1016/j.jamcollsurg.2010.03.036 [doi]). [DOI] [PMC free article] [PubMed] [Google Scholar]
- Zhang, Yu, Wheeler, Kelleher, Stallones, & Xiang (2009). Work-related non-fatal injuries among foreign-born and US-born workers: Findings from the US national health interview survey, 1997–2005. American Journal of Industrial Medicine, 52(1), 25–36. [DOI] [PubMed] [Google Scholar]