

Synopsis
Morphological features are the primary identifying properties of most animals and key to many comparative physiological studies, yet current techniques for preservation and documentation of soft-bodied marine animals are limited in terms of quality and accessibility. Digital records can complement physical specimens, with a wide array of applications ranging from species description to kinematics modeling, but options are lacking for creating models of soft-bodied semi-transparent underwater animals. We developed a lab-based technique that can live-scan semi-transparent, submerged animals, and objects within seconds. To demonstrate the method, we generated full three-dimensional reconstructions (3DRs) of an object of known dimensions for verification, as well as two live marine animals—a siphonophore and an amphipod—allowing detailed measurements on each. Techniques like these pave the way for faster data capture, integrative and comparative quantitative approaches, and more accessible collections of fragile and rare biological samples.
Introduction
Natural systems hold many secrets that could be the key to developing new materials and other bioinspired technologies (Wegst et al. 2015). A detailed understanding of their form can help answer open questions about the function of animal structures that are relevant to research in organismal biology and robotics alike (Koehl 1996; Wilson 1984). In the ocean, where 30–60% of life is yet to be described by experts (Appeltans et al. 2012), there exists a plethora of life forms that can serve as bioinspiration if they can be accessed and captured for subsequent study. Inhabitants of the ocean’s midwater region are especially understudied (Pugh 1989; Haddock 2004), despite their high biomass (Irigoien et al. 2014) and ecological importance (Robison 2004; Boyd 2019). These animals are adapted to a life suspended in the water column, and many of them have soft, flexible body plans with semi-transparent tissues. These anatomical properties have been the inspiration of engineering developments [e.g., robotic vehicles (Najem et al. 2012; Su et al. 2020; Christianson et al. 2020) and adhesives (Su et al. 2020)], and have provided new insights in organismal biology [e.g., unique feeding strategies (Matsumoto and Harbison 1993), optical tissue properties (Mackie and Mackie 1967), and colonial morphology (Totton and Bargmann 1965; Mackie et al. 1988)]. However, these fragile animals are challenging to maintain for integrative and comparative studies (Haddock et al. 2005). Yet, many anatomical studies and taxonomic descriptions rely on preservation of physical specimens. This does not work well for soft, gelatinous materials, or flexible secretions (e.g., mucus) that can deform or shrink when using formalin or alcohol (Haddock et al. 2005; Holst and Laakmann 2014; Holst et al. 2016). Therefore, techniques that preserve the shape and delineate these structures are needed to advance our understanding of these systems.
A digital record of a specimen’s form allows preservation of this morphological information without deterioration, while also improving sample accessibility for peer review and additional study (Davies et al. 2017). 3D models provide a snapshot in time that can be used for post hoc morphometric analysis, or manipulated through animation and incorporation into simulated physical environments. Examples include studies of intraspecies variability in morphology (Evans et al. 2018), taxonomic revision (Ramrez-Portilla et al. 2022), and relationships between morphology and environment (Ferreira Amado et al. 2019; Felice et al. 2019). Beyond direct analysis of morphology, digital records can also be used for (scaled) reproductions in detailed lab studies (Weber et al. 2014), or advance biomechanical knowledge through computational methods, such as finite element analysis (FEA) revealing structural function (Cox et al. 2011), and hydrodynamics simulations providing information on feeding or locomotory functions (Hoover et al. 2021; Jiang et al. 2021; Battista et al. 2022).
A variety of methods, including photogrammetry (or structure from motion), are in use to image the exterior surfaces of animals (Medina et al. 2020; Irschick et al. 2022). While straightforward to deploy, photogrammetry, and other methods that require point-correlation using two-dimensional (2D) images (e.g., stereo and lightfield imaging) fail when dealing with semi-transparent surfaces (Ihrke et al. 2010). This contrasts with volumetric methods that compute tissue properties at each element in space (voxel). X-ray computed tomography (CT) imaging, for example, can resolve tissue density at micrometer resolutions using data gathered from many angles (Boerckel et al. 2014). Scans can take several minutes to hours (du Plessis et al. 2017), requiring the sample to be stationary for extended durations and can be difficult to do with live animals. Shorter scans on the order of seconds for imaging of live animals are sometimes achievable, but at significantly lower resolution (Badea et al. 2008). Other volumetric imaging techniques commonly used in biological sciences include confocal microscopy and imaging of serial histological sections. However, these methods require expensive, specialized equipment (CT imaging) or significant sample preparation (serial sectioning), and work best for small, fixed samples (Boerckel et al. 2014; Pichat et al. 2018). These approaches are not suitable for live, motile, underwater animals, and a better way to record the 3D shape of such semi-transparent structures is needed.
Here, we describe an alternative approach to digitizing 3D animal morphology, particularly for soft-bodied, gelatinous, semi-transparent underwater structures, and animals. Similar to (Katija et al. 2020), we place a camera perpendicular to a sheet of laser light that is scanned through an animal, to collect a slice-by-slice map of transparent tissues, however, here we describe how to conduct these measurements in a laboratory environment. Since semi-transparent biological tissues scatter a fraction of the light that is proportional to their opacity (Johnsen and Widder 1999), and highly opaque surfaces will scatter more light than highly transparent surfaces, scanning a semi-transparent animal yields a volumetric opacity map that can be used to quantify its 3D structure. While tomographic approaches exist that exploit this property by rotating an object of interest (Widodo and Adi 2021), a linear scan approach reduces complexity, eliminates the need for tomographic analysis, and does not require a minimum scan size to compute 3D data. As such, the linear scan method we describe here is more tractable for a broader range of users in the biological sciences. Our portable laboratory setup uses this approach, and creates 3D reconstructions (3DR) of underwater animals or other semi-transparent, submerged structures. We derive and prescribe the motion of the camera-illumination system to compensate for the focus shift introduced by objects underwater through a filming vessel surface. This approach enables rapid visualization of live marine animals and other semi-transparent underwater structures that can be used to inform biomechanics studies and enhance accessibility of rarely observed deep sea animals.
Materials and methods
The lab 3DR setup consists of four distinct parts: the laser sheet illumination system, a high-speed imaging system, a water-filled animal filming vessel, and a motion control system (Fig. 1). Our technique is inspired by methods in Digital Particle Image Velocimetry (DPIV) (Willert and Gharib 1991), deployments of an in-situ ROV instrument DeepPIV (Katija et al. 2017), and similar scanning setups used to study semi-transparent objects in air (Su et al. 2021). Here, we describe modifications to these techniques to accommodate for refractive effects of imaging suspended objects in water through acrylic or glass filming vessel walls.
Fig. 1.

Schematic overview of the lab 3DR setup, showing two linear translation stages that control the position of the laser sheet illumination system (left) and high-speed camera (right) relative to the fluid-filled animal filming vessel.
Illumination and imaging
The source of illumination is a continuous, 2 W laser (Genesis Taipan-HD, Coherent, San Jose, CA; wavelength 639 nm), where the beam was guided through a 15 μm core fiber (Coastal Connections, Ventura, CA) using a collimator (PAF2-7A, Thorlabs, Newton, NJ) for improved flexibility and to decouple the laser source from the motion control system. During our experiments, we rarely operated the laser above 1 W, approximately 25% of which was lost to fiber coupling and transport losses. Using a 7.5 mm focal length collimator and 60○ Powell lens (LOCP-6.0R60, Laser Line Optics Canada, Penticton, B.C., Canada), the light from the fiber was first collimated and then spread out in one dimension into an expanding laser sheet with a thickness of 0.3 mm at the camera axis.
Light scattered by the object of interest was collected using a perpendicularly oriented high-speed camera (Phantom VEO 640S, Vision Research, Wayne, NJ) operated at up to 600 fps at a resolution of 2560 × 1600 pixels. Standard photography objectives (Canon Inc., Tokyo, Japan) and extension tubes were used to obtain the desired magnification and focal distance (e.g., a Canon 100 mm f/2.8 objective with 20 mm extender to achieve 31 × 19 mm field of view with a resolution of 12 μm/pixel, and a Canon 50 mm f/1.4 objective with 12 mm extender to achieve a 113 × 71 mm field of view with 44 μm/pixel resolution).
Motion control
To obtain accurate volumetric measurements, images need to be generated with equidistant spacing while maintaining accurate focus. This requires motion control of the illumination and imaging systems with respect to the object of interest. Consistent image spacing can be achieved by moving the laser illumination and imaging system at a constant velocity in air. However, refractive effects of the filming vessel walls and water affect the focus position of the imaging system (Treibitz et al. 2012), and requires modification of the camera motion control relative to the laser illumination system. In other words, due to the changing optical path length through air and water during the scan, simply shifting the camera along with the laser sheet at the same rate will not maintain focus on the laser sheet. To address this, the camera and laser are moved independently on dedicated linear translation stages to maintain focus throughout the scan, and at a rate we derive here.
We define the distance to the focal plane in air Df, air (not to be confused with the optical system’s focal length) as a reference. Imaging a distance Dw through water and Dwall through the vessel wall, the distance through air from the wall to the imaging system is given by
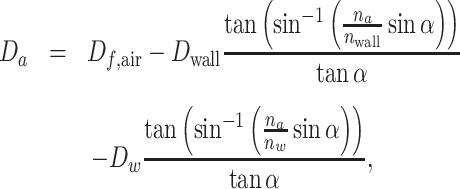 |
(1) |
where α is the angle of a given optical ray with the normal of the wall, and nw, nwall, and na for the refractive index in water, vessel wall, and air, respectively. For small angles α, i.e., long focal length or small image aperture, this is approximated by Da = Df, air − Dwna/nwall, neglecting the small effect of the vessel wall (Dwall = 0). We find that, regardless of laser sheet location, the camera is to be moved at a constant rate, na/nw ≈ 0.72 times the speed of the laser sheet. It is worth noting that the field of view (and hence the magnification) does not change during the scan, despite the change in distance between the laser sheet and the camera.
Telecentric optics can be used as an alternative approach to the method detailed here for perspective optics, also allowing both constant magnification and maintaining focus of the laser sheet. However, this reduces flexibility of the setup for different object sizes, as unlike most telecentric optics, perspective lenses can be refocused to work for a large range of working distances, providing straightforward adjustments of magnification. In addition, the selection of telecentric optics is limited for large imaging sensors often used in high-performance cameras. Finally, the narrower depth of field offered by perspective lenses reduces the influence of light scatter from objects outside the laser plane.
Smooth, repeatable, and linear motion is critical for high quality scans. While it is possible to use a single motor drive to move the laser and camera at different rates using mechanical gearing, we opted to use two separate linear stages (LTS300, Thorlabs, Newton, NJ) for the laser sheet optics and the camera, providing independent control. A custom user interface was created using the PyQt5 Python bindings (Summerfield 2015) to allow calibration of the setup, and move each linear stage the desired amount (Daniels 2022). Here, the stage controlling the laser sheet position was moved at a constant velocity vl between 1 and 20 mm/s based on the desired resolution and scan range (total depth of the stack) ΔDw, and the number of frames per scan Nfr for the selected frame rate f, through the relationship vl = ΔDwf/Nfr. The spacing between frames (depth resolution) is given by vl/f. The frame rate was maximized to reduce subject motion, and the laser power adjusted such that features of interest are shown clearly (with high contrast) in the images. The setup is calibrated by moving the camera stage to achieve focus for two or more laser sheet locations, establishing the linear relationship between the two stages. Using this information, the camera stage will then track the position of the laser stage, with its speed and acceleration scaled to keep the laser sheet in focus.
Filming vessels
Video housings were custom designed to maximize light transmission and clear aperture, using five-sided acrylic boxes sealed with an acrylic lid. This allowed encapsulation of animals in seawater without any water-air interfaces, which can affect animal behavior and introduce additional reflections that negatively affect the scan data. Furthermore, these vessels allowed illumination and imaging through any of the sides of the container, so that the best side for imaging could be selected. Various rectangular vessel sizes were used, ranging from 76 × 76 × 76 mm to 203 × 203 × 203 mm in size.
Image processing
Several steps are involved in converting the reconstruction scan video data to 3D models. Tissues that are more opaque or brighter in color will scatter more light towards the camera, and will be represented by higher luminosity values in an image. Luminosity is extracted by converting the images to monochrome using a color channel or combination of channels. Due to the monochromatic nature of the laser light, the images do not contain information about the subject’s color, even though a color camera is used. However, the color channels have different sensitivities to the laser wavelength, and an appropriate choice can minimize noise and increase detail in areas of interest. From the luminosity data, volumes can be rendered directly (Levoy 1988; Max 1995), but segmentation is required if 3D models are desired (Frey et al. 1994). Segmentations (or masks) are created using luminosity-based thresholding of the image stack that converts pixel values to binary maps, morphological operations on the binary result, as well as manual culling and selections to remove artefacts and noise. A summary of the various image processing techniques can be found in Table S1.
A variety of software packages and algorithms were used to achieve optimum model results and measurements (Fig. 2), though all key steps can be performed using freely available software [e.g., image processing package FIJI (Schindelin et al. 2012) and segmentation software 3D Slicer (Fedorov et al. 2012)]. A custom user interface (Daniels 2023) was developed in MATLAB (The Mathworks, Inc., Natick, MA) to streamline the pre-processing workflow, preparing the images for segmentation. First, image stacks were generated from the videos, selecting either one of the color channels or a predetermined mix (using MATLAB’s rgb2gray function, which combines 29.89% red, 58.70% green, and 11.40% blue). In addition, this program allowed alignment of video frames to compensate for any vibration, drift, or global animal movement along two axes. Very bright features often show up in the frame, even when not directly illuminated by the laser sheet, through scattering from illuminated surfaces, or ambient lighting, and can exaggerate their size. To address this issue, background subtraction was performed as needed, by creating a background image stack using either a moving median or moving minimum filter along the scan direction. The extent of the filter (in number of frames) can also be adjusted, with a shorter filter window resulting in a more aggressively filtered result. By subtracting the background stack from the scan, persistent, erroneous features are reduced. Further noise reduction can then be performed by applying a 3D median filter, before importing the image stack to 3D Slicer for segmentation and visualization.
Fig. 2.

Overview of processing steps and software used.
Segmentations were initialized by choosing an appropriate luminosity threshold level for each feature in 3D Slicer, thereby creating a binary mask. This mask was then refined by a combination of global morphological operations (e.g., 3D median filter, morphological growth/dilation, or shrinking/erosion) of a user-selected 3D extent, rejection of disconnected parts (largest-island approach), and manual inclusion and exclusion of elements. The following guidelines were used for manual segmentation: (1) artifacts from image noise or indirect illumination of tissues outside the laser sheet were corrected assuming mostly smooth surfaces and using symmetric features as a reference; (2) holes in continuous volumes and surfaces were filled where possible to address limitations of global thresholding in cases of partial occlusion; and (3) more rigorous manual adjustments were made where severe imaging shortcomings were present, using other imagery of the same or similar animals where assumptions of smoothness and symmetry fell short.
Validation
In order to validate the accuracy of the results, reconstruction scans were performed on a test object of known dimensions. Suitable rigid objects with simple shapes tend to have a smooth surface and difference in refractive index with the surrounding medium, which can introduce refraction artefacts that are uncommon when imaging marine organisms. To minimize these effects, we chose a thin-walled plastic cylinder (length: 36.20±0.05 mm, outer diameter: 14.4±0.1 mm, and thickness: 0.40±0.03 mm), which was suspended in fresh water by a mono-filament line, and aligned coaxially with the camera axis (Fig. 3A). In order to improve scattering of the laser on the smooth surface, the exterior of the cylinder was sanded lightly.
Fig. 3.

The cylindrical test target used for validation of the 3D reconstruction method, including results without focus correction (single stage approach; left panels), and with focus correction (two independent translation stages; right panels). (A) Photograph of the test target in air. (B,C) Single frame from the recorded image stack (in water) near the end of the cylinder. (D,E) volume rendering of the 3D image stack. (F,G) Mesh model, colorized by the deviation in mm from a cylindrical reference. (H,I) Histogram of the deviation of the inside (blue) and outside (orange) surfaces of the test measurement from a cylindrical reference. Dashed lines indicate the expected values. Note: The monofilament line used to suspend the cylinder is visible in A–E (white arrow), but was manually excluded from the models shown in F and G.
Collected images were processed using minimal manual adjustment of segmentations. After segmentation, additional steps were taken to perform a quantitative analysis of the model. First, internal gaps between the internal and external surfaces of the cylinder were filled using the wrap solidify operation (Weidert et al. 2020) in 3D Slicer before exporting the.stl model file. Meshlab (Cignoni et al. 2008) was then used to simplify the model using a Poisson surface reconstruction (Kazhdan and Hoppe 2013), and to compare it to a reference cylinder mesh to highlight the differences. Statistics on the agreement between the measurement and the reference meshes were calculated using the Hausdorff distance metric (Hausdorff 1914), which finds the closest distance to a reference model for each vertex in the measured model.
Marine animal reconstructions
We live-scanned two animals that were collected by ROV Ventana in the Monterey Bay National Marine Sanctuary (latitude 36.747○, longitude −122.105○) under specific use permit S-212590003, on December 6, 2021. The first animal was a specimen of Nanomia bijuga (Fig. 4A), a common midwater siphonophore, with a nectosome length of 32 mm. The second was a specimen of Cystisoma (Fig. 5A), a midwater amphipod known for its especially transparent exoskeleton (Bagge et al. 2016), with a length of 78 mm (antennae excluded). The siphonophore and amphipod were collected at a depth of 452 m and 302 m, respectively. 3DR scans were performed in a shore-based laboratory at MBARI (Moss Landing, CA) within 24 hours of collection, where animals were transferred to filming vessels filled with filtered, chilled seawater. Scanning and processing of the data was done as described above, however, further analysis was performed on the Nanomia model to calculate nectophore (swimming zooid) volume. This is a quantity of importance for locomotory biomechanics analysis, as it determines the upper limit of volume displacement during jet-propelled swimming (Sutherland et al. 2019). First, the nectosome segmentation was manually modified so that the ostium (aperture) of each nectophore was closed, enclosing the internal volume of each. The resulting segmentation was inverted and then expanded so that the segmented edges closely followed the nectophore walls. The 3D Objects Counter function in FIJI was then used to calculate the volume of each nectophore from the binary segmentation mask.
Fig. 4.

3D reconstruction of Nanomia bijuga. (A) Color image obtained in-situ prior to collection. (B) Single frame from the recorded scan, with the siphosome “tail” in a contracted state, and partly truncated by the bottom of the frame. (C) Two views of the volume rendering. (D) Mesh model generated from the data, highlighting the pneumatophore (yellow), nectosome (green), and siphosome (red).
Fig. 5.

3D reconstruction of Cystisoma. (A) In-situ image of the animal prior to collection by ROV. (B) Single video frame of the reconstruction scan. (C) Volume renderings of the ventral (left) and lateral (right) views. (D) Mesh model separating various elements of the data, including the exoskeleton (blue), cecum and broodsac (red), digestive tract (purple), and eyes (orange).
Results
Volume renderings and 3D mesh models were generated using the 3DR scan method for each target: a test cylinder for validation, and the two live marine invertebrate animals Nanomia bijuga and Cystisoma. Table 1 summarizes the resolution and number of frames of each scan, as well as any manual segmentation performed. More details about the processing steps performed are found in Table S1.
Table 1.
Overview of reconstruction scan data, indication resolution and the extent of manual segmentation performed. More processing details are provided in Table S1.
| Sample | Voxel size (μm) | Number of frames | Manual segmentation |
|---|---|---|---|
| Validation cylinder | |||
| - with focus correction | 12x12x100 | 544 | Filament + end bloom removal only |
| - without focus correction | 12x12x100 | 393 | Filament + end bloom removal only |
| Nanomia | 40x40x30 | 307 | Exclusion and inclusion |
| Cystisoma | 33x33x60 | 794 | Exclusion on all elements, inclusion on exoskeleton only |
Validation
Two scans were performed for the validation cylinder: one without focus correction (Fig. 3, left panels B, D, F, and H), which occurs when the laser and camera are moved at the same rate; and one with focus correction that keeps the laser plane in focus throughout the scan (Fig. 3, right panels C, E, G, and I), which occurs when the two stages are controlled independently. Comparing individual frames from each scan, the difference in sharpness is apparent: with focus correction, both the internal and external surface of the plastic object are visible along most of its circumference (Fig. 3C); without focus correction those details are blurred (Fig. 3B). A volume rendering of the data shows more homogeneous brightness and contrast in the focus-corrected case (Fig. 3D and E), although in both cases significant blooming—exaggeration of bright or reflective features—occurs at one end of the cylinder. This is a common problem in luminosity-based reconstruction (Do et al. 2011). The effects of blooming can be reduced during post-processing by appropriate thresholding, background subtraction, or manual masking. Since the goal of this validation experiment was to determine the overall accuracy of the output model, we opted to remove blooming manually during segmentation, while also removing the suspending filament. Comparison of the resulting model to an idealized cylinder yielded good agreement, with deviations typically less than 5% of the cylinder radius (Figs. 3F and G). The model without focus correction shows a larger deviation on the inside surface at one end, which is a result of out-of-focus areas growing in apparent size by magnification changes and defocusing. Histograms of the surface error (Figs. 3H and I) yield a standard deviation of 0.12 mm, compared to 0.07 mm in the case of the focus-corrected scan. In both scans, the inner and outer cylinder surface expanded, resulting in an increase in apparent wall thickness of 0.25 mm (non-corrected) and 0.20 mm (corrected), less than 3.5% of the cylinder radius. This ‘growth’ of the model can be compensated during segmentation and post-processing. Applying morphological erosion (“shrink margin” in 3D Slicer) of 0.1 mm (8x8x1 pixels) to the focus-corrected case yielded an average surface deviation of just 0.02 mm, an improvement in accuracy of an order of magnitude.
Animal 3D reconstructions
The scans of Nanomia and Cystisoma were performed at 100 and 300 fps, with a depth resolution of 30 and 60 μm, respectively. In the case of Nanomia, the animal maintained a near-stationary, vertical position due to the buoyancy of the pneumatophore; Cystisoma was swimming actively with brief pauses, which required increasing the frame rate and reducing the scan duration to less than 3 seconds. Individual frames from the reconstruction scans reveal details of the internal structures, but also reveal particles suspended in water (Figs. 4B and 5B). These particles were suppressed in the volume renderings by using a segmentation where they had been removed as a mask (Figs. 4C and 5C).
Multi-part models were generated for each animal using the scanned frames. The Nanomia reconstruction (Fig. 4D) consists of separate models for the pneumatophore (gas-filled float), nectosome (stem portion with swimming zooids), and siphosome (tail-like stem portion with remaining zooids). We observe a high degree of detail in the individual nectophores, clearly revealing relative positioning as well as both internal and external walls of all but the topmost zooid. However, the need to balance limited dynamic range for exposure of both dim (poorly scattering tissue) and bright (highly scattering / reflective tissues) features results in overexposed highlights, blooming and flares in the images in a few areas in the gas-filled, reflective pneumatophore, and in dense areas of the siphosome (Fig. S1). Bright areas often result in elongation of features in the scan direction because of their persistent visibility in many frames. Suitable background subtraction and manual segmentation is needed to correct for these features. This is a subjective process, which can yield errors depending on available data and user knowledge of the subject, and often results in irregular model surfaces. Successive smoothing of the model can mitigate these problems to some extent, but it is preferable to reduce the effects of overexposure by proper camera and illumination settings, or combining multiple datasets at different settings to capture the entire scene. The volume of each nectophore was measured individually (Table S2), averaging 94.2 mm3. Centrally located nectophores were found to be larger in volume than both the topmost and bottommost nectophores.
The Cystisoma reconstruction (Fig. 5D) was separated into the exoskeleton, gut, eyes, and the more opaque cecum and broodsac. Along with the mouth parts, the cecum and broodsac occluded part of the left side of the animal, leaving an open section in the model on the thorax (Fig. 5C). The animal was intentionally oriented to be illuminated from the posterior end to minimize feature occlusion and refraction of the laser light. Indeed, the exoskeleton is well resolved, providing an especially clear outline along the posterior segments. Several elements of the digestive system are well resolved, although interconnectivity between elements (e.g., the midgut and cecum) requires higher resolution observations to clearly identify them. The large compound eyes pose a challenge for this scan method, resulting in asymmetry in the model. The side closer to the camera reveals placement and density of the individual photoreceptors, while partially occluding the eye on the other side, providing less detail in that location (Fig. 5C; left). An important feature in species identification, the average antenna length, was measured to be 0.6x the length of the head. Parts of the long appendages fell outside the imaged volume, and are therefore truncated in the images and reconstruction.
Discussion
As we demonstrate here, a small benchtop laboratory setup can enable rapid scanning of underwater semi-transparent structures and live animals. Correction for focus shifts due to the filming vessel walls demonstrably improved the model accuracy. Although no color information is retained with this method, internal structures can be resolved, even for animals with a solid translucent exoskeleton. While we achieved a maximum resolution of 12 μm in our examples, the resolution of this technique is only limited by the laser and camera system used, thereby making this method suitable across a wide range of size scales. Practical considerations for filming vessel size limit our implementation to animals less than ∼1 meter along any direction, given an appropriate choice of camera optics and laser power. A practical lower object size limit around 1 cm is primarily constrained by the thinnest achievable laser sheet thickness. The 3DR system described here can be replicated at significantly lower cost by use of different camera and laser platforms, with appropriate modification to the data collection parameters. For example, to replicate the 60 μm depth resolution of the Cystisoma data with a 60 fps camera, a slower laser scan rate of 3.6 mm/s could be used, extending the scan duration to 13.2 seconds. The lower framerate and scan speed allows for longer exposure times, requiring less than 200 mW of laser power to achieve the same exposure.
While this 3DR method effectively resolves gelatinous and transparent structures, it struggles to accurately capture more opaque or refractive elements. Scanning of such structures can negatively affect other areas in the scan either by reflections, feature blooming, or object occlusion. To minimize these deleterious impacts, bright features may be better resolved by appropriate use of color channels in collected data, or by combining multiple scans at different exposure settings. Occlusion can be minimized by placing problematic elements on the opposite side of the laser source and camera within the imaged volume. As is true in other volumetric scanning methods (e.g., CT imaging), subject movement negatively affects the quality of the data obtained. However, by reducing scan time to a few seconds, many live animals can be scanned even without the use of anesthetics using this 3DR approach. Additionally, the object orientation can be chosen to minimize the scan length, and therefore reducing scan time.
The 3D reconstruction technique shown here can generate both volume renderings and 3D models from the same visual data, and can subsequently be used for a number of applications. Volume renderings can rapidly present the data when only qualitative observations or certain measurements (e.g., lengths and relative distances) are needed. For more detailed measurements such as volumetric measurements, segmentation of image data is required, however, this can also introduce noise or uncertainty in the analysis process (Gardiner et al. 2018). As we demonstrate here, segmentation through thresholding can result in feature growth, which causes tissues to appear thicker in reconstructed models than they really are. One straightforward option to reduce feature growth is to perform morphological erosion of the segmentation, where the most accurate results are achieved if a suitable reference measurement is available. Promising new developments in the field of deep learning may help improve both the speed and accuracy of segmentation and mesh generation; for medical imaging data, easy-to-use tools already exist Wasserthal et al. (2022); Diaz-Pinto et al. (2022).
Although sometimes tedious and time consuming to generate, accurate segmentations and subsequent reconstructed 3D models can be used for a number of quantitative applications. For example, determining the nectophore volume is useful for kinematics analysis of locomotion by siphonophores, which contract their zooids to swim via jet propulsion (Gemmell et al. 2021). Combined with the size of the aperture and estimates of contraction rates, the flow speeds of the expelled jets and amount of thrust generated during locomotion can be calculated (Colin and Costello 2002). These quantities determine the upper limits in swim speed and efficiency, which are parameters that define the ecological role these animals have. In the case of Cystisoma, the model can be used on a post hoc basis for species identification. Taxonomic and anatomical literature on the genus Cystisoma explicitly mentions difficulty in distinguishing species through morphology alone (Zeidler 2003; Brusca 1981; Coleman 1994), however, some identifying traits (e.g., eye shape, the ratio of antenna length to head length, presence of spines in certain locations on the exoskeleton, length of specific appendages, and mandible shape) make identification feasible (Zeidler 2003). All but the mandible shape are readily characterized and enumerated from the Cystisoma 3D reconstruction data, and based on the relative antenna length, this specimen was identified as either C. magna or C. longipes (Zeidler 2003).
Advanced imaging techniques like 3DR can be used to enrich specimen collections by increasing accessibility and offering the capability to preserve accurate depictions of ephemeral and rare structures for the first time. In addition to offering detailed descriptions to study form and associated physiology (Weber et al. 2014; Hirtle et al. 2022), these 3D reconstructed models can be used for advanced exploration of function. By porting these models into computational physics solvers, and imposing model motion that is informed by observing animals using other imaging modalities (Katija et al. 2017; Robison et al. 2017; Broxton et al. 2020), the biomechanics community can understand the physiological limits to certain biological activities and functions (e.g., locomotion and feeding) (Hoover et al. 2021; Jiang et al. 2021; Battista et al. 2022) that were previously intractable on non-model organisms. 3D models such as those derived from our 3DR technique can also be used for interactive educational, scientific outreach (Liu et al. 2020; Calil et al. 2021; Pimentel et al. 2022), and even entertainment purposes (Qian and Clark 2016; Waldispühl et al. 2020), thereby exposing the public to life forms otherwise rarely encountered.
Supplementary Material
Acknowledgments
The authors are thankful for software contributions by Paul Roberts and Aaron Ray, and animal collection/ handling efforts by Rob Sherlock, Kim Reisenbichler and Astrid Leitner. Furthermore, we acknowledge the skillful crews of R/V Rachel Carson and pilots of ROV Ventana without whom the live animal collections would not have been possible. This work was supported by the David and Lucile Packard Foundation. The siphonophore data processing was supported by the National Science Foundation under NSF-IOS Grant No. 2114170 (to K.K.).
Contributor Information
Joost Daniels, Monterey Bay Aquarium Research Institute, Moss Landing, CA, 95039, USA.
Giovanna Sainz, Monterey Bay Aquarium Research Institute, Moss Landing, CA, 95039, USA.
Kakani Katija, Monterey Bay Aquarium Research Institute, Moss Landing, CA, 95039, USA.
Data Availability
All raw image data from the reconstruction scans, including the 3D Slicer segmentation files, and derived model files, can be found on Zenodo with DOI 10.5281/zenodo.8021891. Processed models can be found on Sketchfab MBARI (2023). Furthermore, the MATLAB code used to control the imaging setup and process the recordings can be found on Bitbucket Daniels (2022, 2023).
Author contributions
K.K. conceived the experimental setup, while J.D. developed the implementation described here. Data collection was performed by J.D. and G.S. Data processing was performed by J.D. G.S. provided review and species ID using the taxonomic literature. All authors contributed to the manuscript text.
Competing interests
No competing interest is declared.
References
- Appeltans W, Ahyong ST, Anderson G, Angel MV, Artois T, Bailly N, Bamber R, Barber A, Bartsch I, Berta Aet al. 2012. The magnitude of global marine species diversity. Curr Biol 22:2189–202. [DOI] [PubMed] [Google Scholar]
- Badea CT, Drangova M, Holdsworth DW, Johnson GA. 2008. In vivo small-animal imaging using micro-CT and digital subtraction angiography. Phys Med Biol 53:R319–50. [DOI] [PMC free article] [PubMed] [Google Scholar]
- Bagge LE, Osborn KJ, Johnsen S. 2016. Nanostructures and monolayers of spheres reduce surface reflections in hyperiid amphipods. Curr Biol 26:3071–76. [DOI] [PubMed] [Google Scholar]
- Battista N, Gaddam MG, Hamlet CL, Hoover AP, Miller LA, Santhanakrishnan A. 2022. The presence of a substrate strengthens the jet generated by upside-down jellyfish. Front Mar Sci 9:1–16.35450130 [Google Scholar]
- Boerckel JD, Mason DE, McDermott AM, Alsberg E. 2014. Microcomputed tomography: approaches and applications in bioengineering. Stem Cell Res Ther 5:1–12. [DOI] [PMC free article] [PubMed] [Google Scholar]
- Boyd PW, Claustre H, Levy M, Siegel DA, Weber T. 2019. Multi-faceted particle pumps drive carbon sequestration in the ocean. Nature 568:327–35. [DOI] [PubMed] [Google Scholar]
- Broxton M, Flynn J, Overbeck R, Erickson D, Hedman P, Duvall M, Dourgarian J, Busch J, Whalen M, Debevec P. 2020. Immersive light field video with a layered mesh representation. ACM Trans Graph 39:15. [Google Scholar]
- Brusca GJ. 1981. On the anatomy of Cystisoma (Amphipoda: Hyperiidea). J Crustac Biol 1:358–75. [Google Scholar]
- Calil J, Fauville G, Queiroz A, Leo K, Mann A, Wise-West T, Salvatore P, Bailenson J. 2021. Using virtual reality in sea level rise planning and community engagement—an overview. Water 13:1142. [Google Scholar]
- Christianson C, Cui Y, Ishida M, Bi X, Zhu Q, Pawlak G, Tolley M. 2020. Cephalopod-inspired robot capable of cyclic jet propulsion through shape change. Bioinspir Biomim 16. [DOI] [PubMed] [Google Scholar]
- Cignoni P, Callieri M, Corsini M, Dellepiane M, Ganovelli F, Ranzuglia G. 2008. MeshLab: an open-source mesh processing tool. 6th Eurographics Italian Chapter Conference 2008—Proceedings, 129–36. [Google Scholar]
- Coleman CO. 1994. Comparative anatomy of the alimentary canal of hyperiid amphipods. J Crustac Biol 14:346. [Google Scholar]
- Colin SP, Costello JH. 2002. Morphology, swimming performance and propulsive mode of six co-occurring hydromedusae. J Exp Biol 205:427–37. [DOI] [PubMed] [Google Scholar]
- Cox PG, Fagan MJ, Rayfield EJ, Jeffery N. 2011. Finite element modelling of squirrel, guinea pig and rat skulls: using geometric morphometrics to assess sensitivity. J Anat 219: 696–709. [DOI] [PMC free article] [PubMed] [Google Scholar]
- Daniels J. 2022. Lab3DR setup control interface, Bitbucket repository. https://bitbucket.org/mbari/lab3dreconstruction.
- Daniels J. 2023. 3DR preprocessing software, Bitbucket repository. https://bitbucket.org/mbari/batho3dr.
- Davies TG, Rahman IA, Lautenschlager S, Cunningham JA, Asher RJ, Barrett PM, Bates KT, Bengtson S, Benson RBJ, Boyer DMet al. 2017. Open data and digital morphology. Proc R Soc B: Biol Sci 284:20170194. [DOI] [PMC free article] [PubMed] [Google Scholar]
- Diaz-Pinto A, Alle S, Ihsani A, Asad M, Nath V, Pérez-García F., Mehta P, Li W, Roth HR, Vercauteren Tet al. 2022. MONAI Label: a framework for AI-assisted interactive labeling of 3D medical images. arXiv e-prints. https://arxiv.org/pdf/2203.12362.pdf. [DOI] [PubMed]
- Do S, Karl WC, Liang Z, Kalra M, Brady TJ, Pien HH. 2011. A decomposition-based CT reconstruction formulation for reducing blooming artifacts. Phys Med Biol 56:7109. [DOI] [PubMed] [Google Scholar]
- du Plessis A., Broeckhoven C, Guelpa A, le Roux GS. 2017. Laboratory X-ray micro-computed tomography: a user guideline for biological samples. GigaScience 6:1–11. [DOI] [PMC free article] [PubMed] [Google Scholar]
- Evans KM, Bernt MJ, Kolmann MA, Ford KL, Albert JS. 2018. Why the long face? Static allometry in the sexually dimorphic phenotypes of neotropical electric fishes. Zool J Linn Soc 186:633–49. [Google Scholar]
- Fedorov A, Beichel R, Kalpathy-Cramer J, Finet J, Fillion-Robin JC, Pujol S, Bauer C, Jennings D, Fennessy F, Sonka Met al. 2012. 3D Slicer as an image computing platform for the Quantitative Imaging Network. Magn Reson Imaging 30: 1323–41. [DOI] [PMC free article] [PubMed] [Google Scholar]
- Felice RN, Tobias JA, Pigot AL, Goswami A. 2019. Dietary niche and the evolution of cranial morphology in birds. Proc R Soc B: Biol Sci 286:20182677. [DOI] [PMC free article] [PubMed] [Google Scholar]
- Ferreira Amado T, Moreno Pinto MG, Olalla-Tárraga MA. 2019. Anuran 3D models reveal the relationship between surface area-to-volume ratio and climate. J Biogeogr 46:1429–37. [Google Scholar]
- Frey P, Sarter B, Gautherie M. 1994. Fully automatic mesh generation for 3D domains based upon voxel sets. Int J Numer Methods Eng 37:2735–53. [Google Scholar]
- Gardiner JD, Behnsen J, Brassey CA. 2018. Alpha shapes: determining 3D shape complexity across morphologically diverse structures. BMC Evol Biol 18:184. [DOI] [PMC free article] [PubMed] [Google Scholar]
- Gemmell BJ, Dabiri JO, Colin SP, Costello JH, Townsend JP, Sutherland KR. 2021. Cool your jets: biological jet propulsion in marine invertebrates. J Exp Biol 224. [DOI] [PubMed] [Google Scholar]
- Haddock SH, Dunn CW, Pugh PR. 2005. A re-examination of siphonophore terminology and morphology, applied to the description of two new prayine species with remarkable bio-optical properties. J Mar Biol Assoc UK 85:695–707. [Google Scholar]
- Haddock SHD. 2004. A golden age of gelata: past and future research on planktonic ctenophores and cnidarians. Hydrobiologia 530–531:549–56. [Google Scholar]
- Hausdorff F. 1914. Grundzüge der Mengenlehre. Leipzig: Veit. [Google Scholar]
- Hirtle NO, Stepanuk JEF, Heywood EI, Christiansen F, Thorne LH. 2022. Integrating 3D models with morphometric measurements to improve volumetric estimates in marine mammals. Methods Ecol Evol 13:2478–90. [Google Scholar]
- Holst S, Laakmann S. 2014. Morphological and molecular discrimination of two closely related jellyfish species, Cyanea capillata and C. lamarckii (Cnidaria, Scyphozoa), from the northeast Atlantic. J Plankton Res 36:48–63. [Google Scholar]
- Holst S, Michalik P, Noske M, Krieger J, Sötje I. 2016. Potential of X-ray micro-computed tomography for soft-bodied and gelatinous cnidarians with special emphasis on scyphozoan and cubozoan statoliths. J Plankton Res 38:1225–42. [Google Scholar]
- Hoover AP, Daniels J, Nawroth JC, Katija K. 2021. A computational model for tail undulation and fluid transport in the giant larvacean. Fluids 6:88. [Google Scholar]
- Ihrke I, Kutulakos KN, Lensch HPA, Magnor M, Heidrich W. 2010. Transparent and specular object reconstruction. Comput Graph Forum 29:2400–26. [Google Scholar]
- Irigoien X, Klevjer TA, Røstad A, Martinez U, Boyra G, Acuña JL, Bode A, Echevarria F, Gonzalez-Gordillo JI, Hernandez-Leon Set al. 2014. Large mesopelagic fishes biomass and trophic efficiency in the open ocean. Nat Commun 5:3271. [DOI] [PMC free article] [PubMed] [Google Scholar]
- Irschick DJ, Christiansen F, Hammerschlag N, Martin J, Madsen PT, Wyneken J, Brooks A, Gleiss A, Fossette S, Siler Cet al. 2022. 3D visualization processes for recreating and studying organismal form. iScience 25:104867. [DOI] [PMC free article] [PubMed] [Google Scholar]
- Jiang H, Costello JH, Colin SP. 2021. Fluid dynamics and efficiency of colonial swimming via multijet propulsion at intermediate Reynolds numbers. Phys Rev Fluid 6:013103. [Google Scholar]
- Johnsen S, Widder EA. 1999. The physical basis of transparency in biological tissue: ultrastructure and the minimization of light scattering. J Theor Biol 199:181–98. [DOI] [PubMed] [Google Scholar]
- Katija K, Sherlock RE, Sherman AD, Robison BH. 2017. New technology reveals the role of giant larvaceans in oceanic carbon cycling. Sci Adv 3:e1602374. [DOI] [PMC free article] [PubMed] [Google Scholar]
- Katija K, Troni G, Daniels J, Lance K, Sherlock RE, Sherman AD, Robison BH. 2020. Revealing enigmatic mucus structures in the deep sea using DeepPIV. Nature 583:78–82. [DOI] [PubMed] [Google Scholar]
- Kazhdan M, Hoppe H. 2013. Screened Poisson surface reconstruction. ACM Trans Graph 32:1–13. [Google Scholar]
- Koehl MAR. When does morphology matter? Annu Rev Ecol Evol Syst 27:501–42. [Google Scholar]
- Levoy M. 1996. Display of surfaces from volume data. IEEE Comput Graph Appl 8:29–37. [Google Scholar]
- Liu R, Wang L, Lei J, Wang Q, Ren Y. 2020. Effects of an immersive virtual reality—based classroom on students’ learning performance in science lessons. Br J Educ Technol 51: 2034–49. [Google Scholar]
- Mackie G, Mackie G. 1967. Mesogloeal ultrastructure and reversible opacity in a transparent siphonophore. Vie et milieu 47–72. [Google Scholar]
- Mackie G, Pugh P, Purcell J. 1988. Siphonophore biology. In Blaxter J., Southward A, editors, Advances in Marine Biology, Academic Press. Vol. 24, p. 97–262. [Google Scholar]
- Matsumoto GI, Harbison GR. 1993. In situ observations of foraging, feeding, and escape behavior in three orders of oceanic ctenophores: Lobata, Cestida, and Beroida. Mar Biol 117: 279–87. [Google Scholar]
- Max N. 1995. Optical models for direct volume rendering. IEEE Trans Vis Comput Graph 1:99–108. [Google Scholar]
- MBARI . 2023. Lab 3D reconstruction models, MBARI Sketchfab collection. https://skfb.ly/oIoAW.
- Medina JJ, Maley JM, Sannapareddy S, Medina NN, Gilman CM, McCormack JE. 2020. A rapid and cost-effective pipeline for digitization of museum specimens with 3D photogrammetry. PLOS ONE 15:e0236417. [DOI] [PMC free article] [PubMed] [Google Scholar]
- Najem J, Sarles SA, Akle B, Leo DJ. 2012. Biomimetic jellyfish-inspired underwater vehicle actuated by ionic polymer metal composite actuators. Smart Mater Struct 21: 094026. [Google Scholar]
- Pichat J, Iglesias JE, Yousry T, Ourselin S, Modat M. 2018. A survey of methods for 3D histology reconstruction. Med Image Anal 46:73–105. [DOI] [PubMed] [Google Scholar]
- Pimentel D, Fauville G, Frazier K, McGivney E, Rosas S, Woolsey E. 2022. An introduction to learning in the Metaverse. Technical report, Meridian Treehouse. [Google Scholar]
- Pugh PR. 1989. Gelatinous zooplankton—the forgotten fauna. Sci Prog 14:67–78. [Google Scholar]
- Qian Mm Clark KR. 2016. Game-based learning and 21st century skills: a review of recent research. Comput Hum Behav 63: 50–58. [Google Scholar]
- Ramrez-Portilla C, Bieger IM, Belleman RG, Wilke T, Flot JF, Baird AH, Harii S, Sinniger F, Kaandorp JA. 2022. Quantitative three-dimensional morphological analysis supports species discrimination in complex-shaped and taxonomically challenging corals. Front Mar Sci 9:1–17.35450130 [Google Scholar]
- Robison B, Reisenbichler K, Sherlock R. 2017. The coevolution of midwater research and ROV technology at MBARI. Oceanography 30:26–37. [Google Scholar]
- Robison BH. 2004. Deep pelagic biology. J Exp Mar Biol Ecol 300:253–72. [Google Scholar]
- Schindelin J, Arganda-Carreras I, Frise E, Kaynig V, Longair M, Pietzsch T, Preibisch S, Rueden C, Saalfeld S, Schmid B. 2012. Fiji: An open-source platform for biological-image analysis. Nat Methods 9:676–82. [DOI] [PMC free article] [PubMed] [Google Scholar]
- Su I, Narayanan N, Logrono MA, Guo K, Bisshop A, Mühlethaler R, Saraceno T, Buehler MJ. 2021. In situ three-dimensional spider web construction and mechanics. Proc Natl Acad Sci USA 118:1–9. [DOI] [PMC free article] [PubMed] [Google Scholar]
- Su X, Luo Y, Tian Z, Yuan Z, Han Y, Dong R, Xu L, Feng Y, Liu X, Huang J. 2020. Ctenophore-inspired hydrogels for efficient and repeatable underwater specific adhesion to biotic surfaces. Mater Horiz 7:2651–61. [Google Scholar]
- Summerfield M. 2015. Rapid GUI Programming with Python and Qt: The Definitive Guide to PyQt Programming. 1st ed.Hoboken, New Jersey, USA: Prentice Hall Press. [Google Scholar]
- Sutherland KR, Gemmell BJ, Colin SP, Costello JH. 2019. Propulsive design principles in a multi-jet siphonophore. J Exp Biol 222:1–8. [DOI] [PubMed] [Google Scholar]
- Totton AK, Bargmann HE. 1965. A synopsis of the Siphonophora. British Museum (Natural History). [Google Scholar]
- Treibitz T, Schechner Y, Kunz C, Singh H. 2012. Flat refractive geometry. IEEE Trans Pattern Anal Mach Intell 34: 51–65. [DOI] [PubMed] [Google Scholar]
- Waldispühl J, Szantner A, Knight R, Caisse S, Pitchford R. 2020. Leveling up citizen science. Nat Biotechnol 38: 1124–26. [DOI] [PubMed] [Google Scholar]
- Wasserthal J, Meyer M, Breit HC, Cyriac J, Yang S, Segeroth M. 2022. TotalSegmentator: robust segmentation of 104 anatomical structures in CT images. 10.48550/arXiv.2208.05868. [Accessed November 1, 2022]. [DOI]
- Weber PW, Howle LE, Murray MM, Reidenberg JS, Fish FE. 2014. Hydrodynamic performance of the flippers of large-bodied cetaceans in relation to locomotor ecology. Mar Mamm Sci 30:413–32. [Google Scholar]
- Wegst UGK, Bai H, Saiz E, Tomsia AP, Ritchie RO. 2015. Bioinspired structural materials. Nat Mater 14:23–36. [DOI] [PubMed] [Google Scholar]
- Weidert S, Andress S, Linhart C, Suero EM, Greiner A, Bcker W, Kammerlander C, Becker CA. 2020. 3D printing method for next-day acetabular fracture surgery using a surface filtering pipeline: feasibility and 1-year clinical results. Int J Comput Assist Radiol Surg 15:565–75. [DOI] [PMC free article] [PubMed] [Google Scholar]
- Widodo CE .Adi K. 2021. Tomographic system for transparent objects using visible light as a source of radiation. J Phys Conf Ser 1943:012045. [Google Scholar]
- Willert CE, Gharib M. 1991. Digital particle image velocimetry. Exp Fluids 10:181–93. [Google Scholar]
- Wilson JF. 1984. Robotic mechanics and animal morphology. In Brady M, Gerhardt LA, Davidson HF. editors, Robotics and Artificial Intelligence, Berlin: Springer. p. 419–43. [Google Scholar]
- Zeidler W. 2003. A review of the hyperiidean amphipod family Cystisomatidae Willemöes-Suhm, 1875 (Crustacea: Amphipoda: Hyperiidea). Zootaxa 141:1. [DOI] [PubMed] [Google Scholar]
Associated Data
This section collects any data citations, data availability statements, or supplementary materials included in this article.
Supplementary Materials
Data Availability Statement
All raw image data from the reconstruction scans, including the 3D Slicer segmentation files, and derived model files, can be found on Zenodo with DOI 10.5281/zenodo.8021891. Processed models can be found on Sketchfab MBARI (2023). Furthermore, the MATLAB code used to control the imaging setup and process the recordings can be found on Bitbucket Daniels (2022, 2023).