

Abstract

Metal ions are indispensable constituent elements of the human body, among which Cu2+ plays an important role in various biochemical reactions in the human body and is an essential element for maintaining human health. Studying the interaction between Cu2+ and DNA can be helpful to further understand the mechanism of Cu2+ behavior in organisms. In this paper, we investigated the DNA–Cu2+ complex by transmission electron microscopy (TEM) and used in situ liquid-cell TEM to observe the dynamic processes of interactions between DNA and Cu2+. Results show that the binding of Cu2+ to DNA leads to the bending of the DNA strand and provides an anchor site for activating Cu2+ for the nucleation and growth of copper crystals. Bound by the DNA strand, the copper crystals are arranged along the curved strand, showing the same arrangement pattern as guanine on the DNA sequence. It is believed that the study will further elaborate the interaction mechanism by directly observing the DNA–Cu2+ complex at the nanometer scale and benefit the related biomedical research studies.
1. Introduction
Copper, due to its high antimicrobial property, was one of the first inorganic antimicrobial materials in the history. Copper was applied in ancient Egypt to clean chest wounds and to purify water. In the nineteenth and twentieth centuries, when antibiotics were not available, copper was widely used to treat skin diseases, syphilis, and tuberculosis.1 Although copper has attracted wide attention from researchers due to its antimicrobial property,2−5 the harm to body should not be ignored. Cu2+ can seriously damage human health and the ecological environment. In particular, heavy metal pollution in the ocean can accumulate in organisms once entering the food chain. As copper exists mainly in the form of ions in living organisms, it is important to study the interaction between Cu2+ and nucleic acids in order to better take advantage of copper and also to prevent copper materials from posing a hazard to the human body during applications.
Among the divalent metal cations which interact with nucleic acids, Cu2+ has the highest affinity for deoxyribonucleic acid (DNA).6,7 The interaction of Cu2+ with DNA, nucleosides, and nucleotides has been discussed extensively in earlier publications,8−11 but there is no direct evidence of the binding site of Cu2+ to DNA. Nuclear magnetic resonance (NMR) spectroscopy studies of DNA have shown that Cu2+ binds to the N7 position of adenine (A) and guanine (G) and the N1 position of cytosine (C) but not to thymine (T).10 Direct evidence for the binding of Cu2+ to bases in DNA was first given by absorption spectroscopy measurements of visible light by Coates, Jordan, and Sriastava.12
In 1973, Richard et al. proposed a “sandwich structure” for Cu2+ binding to DNA: at low Cu2+ concentrations, two adjacent guanines on the same strand are bound by Cu2+ and form a G–Cu2+–G structure (shown in Figure 1a).13 Binding sites are N7 and O6 of the two adjacent guanines. In addition to the model of binding to bases, the widely accepted model is the binding of Cu2+ to N7(G) and the oxygen atom of the closest phosphate group on the same chain,13−15 as shown in Figure 1b.
Figure 1.

(a) “Sandwich structure” of G–Cu2+–G. (b) Cu2+ bound to both guanine and phosphate groups. Reprinted with permission from ref (13). Copyright 1978 Elsevier.
In theoretical studies, the binding model of Cu2+ to bases is mostly simulated using density functional theory (DFT). Of all the complexes, the binding of Cu2+ to guanine has the highest affinity.16 Theoretical findings suggest that Cu2+ interacts with guanine at sites other than N7 and O6 and that the two sites are bound simultaneously.16,17
In 2003, Andrushchenko et al. investigated the interaction of natural calf thymus DNA with Cu2+ in the range 0–0.4 M Cu2+ using vibrational circular dichroism (VCD).18 The results showed that when the concentration ratio of Cu2+ to the phosphate group is 0.5, a “sandwich structure” emerged with Cu2+ inserted between two adjacent guanines of the GpG sequence. This structure bends the double-stranded DNA and forms a more compact DNA structure. When the concentration ratio of Cu2+ to the phosphate group is higher than 0.5, Cu2+ interacts between the guanine and the closest phosphate group.
Previous studies have mostly characterized the binding sites of DNA and Cu2+, the conformational effects of Cu2+ on DNA, and the properties of DNA–Cu2+ complexes by indirect, collective techniques, but no direct, dynamic observation of DNA–Cu2+ complexes at nanometer scale has been carried out. In addition, the conclusions of the studies reviewed above are not perfectly consistent, especially the disagreement between experimental and theoretical results. Since previous experiments were based on macroscopic detection methods, while simulations adopted DFT at the molecular level, there is currently a more pressing need for smaller-scale experimental information to further clarify the mechanism of action. In this paper, the DNA–Cu2+ complexes were directly observed under a transmission electron microscope to characterize the morphological features and distribution pattern of the complexes. The latest liquid-cell transmission microscopy technique was adopted to study the dynamic binding and dissociation of DNA and Cu2+ directly in a liquid environment.
2. Materials and Methods
2.1. 200 nM DNA Solution
The DNA used in this paper was G-rich ssDNA containing 20 bases with the sequence: 5′-TGGAGGGTTTTTTGGGTGGA-3′, produced by Sangon Biotech (Shanghai) Co., Ltd. The purification method was PAGE. Before opening the lid, the tube containing DNA was placed into a tabletop centrifuge and centrifuged at 4000 rpm for 30–60 s, allowing the dry powder DNA to be deposited to the bottom of the tube. 206 μL of buffer was added and mixed well to prepare a 50 μM DNA solution. The 50 μM DNA solution was divided into 5 μL per tube and stored frozen at −20 °C. For experiment, 5 μL of DNA solution was diluted with buffer to obtain a 200 nM DNA solution.
2.2. 1 μM Copper Sulfate Solution (CuSO4·5H2O)
The copper sulfate solution used in this paper was purchased from Shanghai Aladdin Biochemical Technology Co., Ltd. and was a 0.1 M copper sulfate standard solution. The copper sulfate standard solution was diluted to a dilute solution of 1 μM by adding ultrapure water.
2.3. 1× TE Buffer
1× TE buffer was purchased from Shanghai Aladdin Biochemical Technology Co., Ltd.
2.4. Support Films
Microgrid, ultra-thin and 300-mesh carbon films were purchased from Electron Microscopy China.
2.5. Tecnai G2 20 Transmission Electron Microscope
A Tecnai G2 20 transmission electron microscope was purchased from Thermo Fisher Scientific Inc., with a point resolution (point-to-point resolution) of 0.24 nm and a lattice resolution (the distance between interference fringes due to the phase difference) of 0.144 nm. The electron gun is a thermionic emission gun by heating the LaB6 crystal, and Gatan Orius 830 2k CCD camera is applied for the recordings. In the ex situ and in situ TEM characterization, the electron beam dose rate was controlled at 6.25 × 10²³ electrons/m2·s.
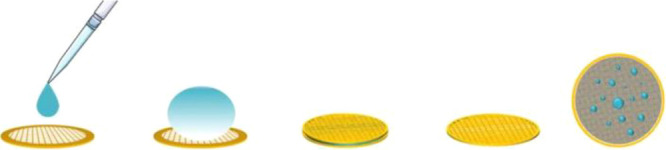
In this paper, two types of support films, microgrid and ultra-thin carbon film, were used to prepare samples for ex situ transmission electron microscopy (TEM). The samples were allowed to dry for ∼20 min and then were loaded onto a single tilted sample holder for observation under the transmission electron microscope, as shown in Scheme 1.
Scheme 1. Process of Preparing TEM Samples.

A double-layered carbon film liquid cell was used in in situ TEM. As shown in Scheme 2, first, a piece of carbon film was taken with curved tweezers and placed on a dry filter paper with the carbon sprayed side facing upward. 3 μL of the DNA–Cu2+ mixture was dropped onto the carbon film by a pipette gun. A semicircular droplet gathered on the surface of the carbon film. Next, another piece of carbon film was taken with curved tweezers and the droplet was gently covered with the carbon sprayed side down, forming a “sandwich” structure with the droplet and the underlying carbon film. The sample was placed in a dry and ventilated place for 2–3 h. After the excess liquid had evaporated, the two carbon support films closed together due to van der Waals forces, making a closed liquid cell between the spaces in the carbon film.
Scheme 2. Process of Preparing Double-Layered Carbon Film Liquid-Cell Samples.
3. Results and Discussion
3.1. Ex Situ TEM Characterization
Observation of the microgrid sample of the mixture of Cu2+ and DNA is shown in Figure 2. It is found that the particles of different sizes are organized in regularly arranged chains, and the more concentrated areas of particles even form a net-like pattern. The curvature of the chains varies, with some particles following straight lines, others following curves of a lesser curvature, and a few particles arranged in circles or semicircles. The particles are mostly in groups of five. In addition to the particles that can be clearly detected, some less lined material, likely organic matter, is present around the particles.
Figure 2.

TEM image of particle alignment.
In the area where the particles at the edges of the micropores are clustered, there are more typical groups of five particles constructing a straight line. As shown in Figure 3a, the particle group is also surrounded by a less lined organic material. Meanwhile, the 2nd and 3rd particles of the chain are more widely separated. As the given DNA sequence is 5′-TGGAGGGTTTTTTGGGTGGA-3′, with an adenine separating two guanines from three guanines, it is believed that the alignment pattern of the particles corresponds to that of the DNA sequence.
Figure 3.

(a) Five particles arranged along a straight line. (b) Lattice stripes of some of the particles in the curved chain.
In order to determine the lattice structure of the particles, high-resolution images are taken of the particles. As shown in Figure 3b, the individual particles have different crystalline structures. Further direct measurements of the lattice spacing show that the d is 0.208 nm. The lattice spacing of Cu in the (111) direction, as queried by the PDF card, is 0.208 nm. The measured lattice spacing is consistent with the lattice spacing of Cu in the (111) direction. Therefore, the particles aggregated on the microgrid are Cu crystals.
In the ultra-thin carbon film sample, a clearer lattice phase is observed, as shown in Figure 4. A fast Fourier transform (FFT) of the sample shows a crystalline spacing of 2.07 Å. In this experimental sample, apart from 1× TE buffer, there is only DNA with Cu2+. Because the contrast of the carbon film and DNA is similar, it is difficult to observe the carbon-based DNA strands in the carbon-supported membrane sample under a transmission electron microscope. As a result, the crystal particles that appear can only be Cu crystals resulting from DNA–Cu2+ interaction. The (111) crystalline plane spacing of Cu is 2.08 Å. Within the error margin, the observed crystalline plane spacing of the individual crystals matches the (111) crystalline plane spacing of Cu, demonstrating once again that the crystals are Cu.
Figure 4.

Crystals observed in an ultra-thin carbon film sample.
Hackl et al. found in their study that the interaction of Cu2+ with DNA transformed the structure of DNA into a densified form.19 Densification of DNA is a characteristic of a dramatic reduction in the volume occupied by DNA molecules and the formation of curved, shortened structures. The mechanism for the transition of DNA to a densified structure is not dominated by electrostatic interactions but is related to the affinity of the metal ion for the DNA bases. Zhan et al. utilized a particular ssDNA sequence named Cu100, which has a copper specificity, and the Sybr Green I fluorescence extinction method sensitively detects Cu2+ in water.20 ssDNA Cu100 is present in an arbitrary form in the absence of Cu2+ in the experiment. When Cu2+ is added, Cu2+ occupied the binding site on the ssDNA, resulting in a curled DNA morphology that can only bind a small amount of fluorescent agent.3 This is consistent with the distribution of particles along the curled strand observed under a transmission electron microscope in this experiment.
Previous research studies have shown that Cu2+ binds to G and that the sites of action are N7 and O6.16,17 Earlier work also explored the interaction of Cu2+ with dsDNA and ssDNA, and experimental results showed that Cu2+ can insert into dsDNA and also bind to ssDNA. Such binding can lead to DNA strand damage or bending.21 Ursu proposed a new method for the preparation of copper nanoparticles (CuNPs) modified with single-walled carbon nanotubes (SWCNTs) in aqueous solution using DNA as a template and demonstrated the selective formation of homogeneous CuNPs on SWCNTs under a transmission electron microscope. Ursu’s experiment used sodium ascorbate as the reductant and dsDNA as a substrate for CuNPs growth.22
In our experiment, the reductant is reductive electron generated by the light during the photolysis of water as explained in more detail below. Cu2+ provides an anchor site for the activation of CuNPs through electrostatic interactions or by binding to ssDNA via bases. Experiments show that Cu2+ binds mainly to bases and that Cu2+ has the strongest affinity for G, so that the formed pattern of Cu2+ on ssDNA is similar to that of G. Reductive electron produced by light-induced photolysis of water reduces the metal ion precursors to atoms. As the reduced Cu gradually accumulates, the Cu atoms progressively aggregate into nuclei and grow into metal nanoparticles (as shown in Scheme 3). The densification process of Cu2+ binding to DNA is divided into two steps: in the first step, Cu2+ binds to specific sites in the DNA, causing the DNA strand to bend; in the second step, the ends of the DNA strand bind, bringing the binding regions closer together. This leads to the DNA becoming shorter and more condensed.
Scheme 3. Schematic of the Cu Particle Production Process.

As mentioned above, light is considered to be the main cause of water decomposition in ex situ TEM characterization. There are two reasons for this: first, the sample was left for a period of time and fully reacted before the particles could be observed; second, no more particles were generated in the dry samples during the TEM observation. Therefore, the Cu particles are believed to be the result of light instead of electron beams in the ex situ TEM characterization.
3.2. In Situ Liquid-Cell TEM Characterization
In the liquid-cell TEM experiments, the irradiation of the electron beam results in the formation of bubbles in the liquid region. Therefore, the area where the bubbles are produced indicates the liquid zone. As shown in Figure 5, the light gray area corresponds to the bubble and the darker area is the liquid. To make the contrast more obvious, Figure 5a is highlighted by different colors. As shown in Figure 5b, the blue area is the liquid, while the green area is the bubble. As the electron beam irradiation time increases, the bubbles tend to enlarge and the liquid tends to diminish. Figure 5c shows the TEM image of the same region after 80 s and the bubble area increases significantly.
Figure 5.

Bubbles and droplets in the liquid cell of a double-layered carbon film: (a) initial image before coloring, (b) colored image of (a), and (c) image of the same region after 80 s.
The change of bubbles and liquids in the liquid cell is divided into three main processes: first, electron irradiation results in the creation of small bubbles in the liquid; then, small bubbles continue to merge to form larger bubbles; and finally, large bubbles merge and occupy the original position of the liquid. Under high-energy electron irradiation, the water molecules break down into the reductive hydrated electron eaq–, the hydrogen radical H·, and the gas. The reaction is expressed by the following equation:
| 1 |
Figure 6 shows the process of particle creation and disintegration. At 0 s, the center of the image consists of two particles of about 4 nm in diameter, with a small number of bubbles in the more lined area. At 2 min 27 s, under longer irradiation, new small particles, only about 2 nm in diameter, appear above the original particles, and scattered small particles begin to appear in the surrounding liquid environment. At 3 min 22 s, three new particles have formed above the two original particles and form a curvilinear chain 1 with them. In the order of creation, the particles increase in size. To the left of the original chain 1, new particles appear in a circular chain 2. Five particles are present on chain 1 and six on chain 2. At 4 min, the smallest particle at the upper end of chain 1 disappears, and the remaining particles become less lined. At 6 min 9 s, there are only three large particles on chain 1, and the spacing between the particles in chain 2 continues to increase. At this point, the number of bubbles in the liquid environment increases significantly, and the liquid decreases compared to the initial observed image.
Figure 6.

Process of Cu particle generation and decomposition.
Different from ex situ TEM samples, water molecules are decomposed by electron beam irradiation under an in situ transmission electron microscope, producing hydrated electrons eaq– and hydrogen radicals H·, which reduce Cu2+ to Cu0, followed by nucleation and growth. The water molecules are decomposed rapidly in a short time, and Cu2+ is reduced much faster in the liquid environment than in the dry sample. The reaction process can be expressed as follows:
| 2 |
| 3 |
Throughout the process, the bubble shape in the background keeps changing, indicating that the decomposition reaction of water continuously occurs. The decomposition process of Cu particles can be represented by the following equations:
| 4 |
| 5 |
The merging of Cu particles is discovered in the region marked by the red box in Figure 7. At 0 s, there are a larger and a smaller particle close to each other in the red box, and the lining of the small particles is relatively weak. After 2 min 30 s of continuous electron beam irradiation in the same region, the outline of the small particles gradually becomes obvious and the boundary between them and the large particles becomes clear. At 5 min, the small and large particles are closer together, and the boundary is no longer clear. After 6 min, the particles are completely merged, and the liquid in the region has been completely disintegrated. During the observation, the area of bubbles expands with the volume of liquid decreasing, and the process of particle merging lasts for 6 min. In Figure 7, it can also be recognized that the Cu particles distribute along straight or curved chains, while the number of particles on the chains is five or more, which is more than the number of particles on the chains under ex situ characterization. The diameter of the particles is larger. The rate of particle formation and growth is more rapid under the irradiation of the electron beam.
Figure 7.

Merging process of Cu particles (red square) and distribution of particles along straight or curved chains (white and yellow lines).
The in situ TEM characterization for the mixture of DNA and Cu2+ makes the process of particle formation and disappearance more explicit. As shown in Scheme 4, first, ssDNA provides an anchor site for Cu-ion activation. By constructing precursors for nanoparticle formation, Cu2+ is reduced to Cu0 by hydrated electrons eaq– and hydrogen radicals H·, which are produced by radiolysis of water (electron beam). According to the LaMer nanocrystal growth model,23 when the number of precursors exceeds the nucleation threshold, the nucleation process of nanocrystals occurs, and one after another closely spaced chain-like copper particles generate along the DNA chain. Then copper particles grow by monomer addition, Ostwald ripening, or combination. Under the continuous irradiation of the high-energy electron beam, the DNA strands are disrupted, causing the originally close-aligned Cu particles to increase in spacing and form a loose chain-like arrangement, while the particle growth still continues. Without the restraint of DNA chains, neighboring large particles merge with each other to form larger particles or disintegrate under the irradiation of electron beams. The electron microscopic characterization results in this paper are consistent with the model.
Scheme 4. Schematic Diagram of the Process of Cu Particle Generation, Merging, and Decomposition.

4. Conclusions
In this article, DNA–Cu2+ complexes are characterized by TEM, the latest technique of preparing liquid cells with bilayer carbon films is used to illustrate the process of DNA–Cu2+ interaction, and finally, the mechanism of DNA binding to Cu2+ and producing copper crystals is discussed, which provides a new perspective for the study of DNA–metal ion complexes.
The lattice striations of the crystals are clearly visible in the ex situ TEM characterization. The precipitated particles are confirmed as Cu crystals by the lattice spacing. Cu2+ binds to ssDNA mainly through guanine, which provides an anchor site for the activation of Cu nanoparticles. Cu2+ binds to DNA and makes the DNA strands bend. In the presence of light, the generated free radicals and reactive oxygen species reduce Cu2+ to Cu0. With the increase of reduced Cu, the Cu atoms gradually aggregate into nuclei and grow into metal nanoparticles. In the in situ TEM characterization, the dynamic process of Cu particle generation, merging, and decomposition is witnessed. Unlike the ex situ TEM, water is irradiated by the electron beam and decomposed to produce hydrated electrons eaq– and hydrogen radicals H· in the liquid environment, which reduce Cu2+ to Cu0 and construct precursors for nanoparticle formation. When the number of precursors exceeds a certain threshold, the nucleation reaction occurs, and the nucleated Cu crystals continue to develop into large particles of about 7 nm in diameter. High-energy electron beam irradiation causes the DNA strands to be disintegrated, the Cu particle distribution becomes loose, and two adjacent Cu particles merge to become larger nanoparticles. Under long-term electron irradiation, the Cu particles are gradually disintegrated until they finally disappear.
This paper is the first to observe the dynamic process of DNA–Cu2+ interaction at the nanoscale and completes the nanoscale experimental information of DNA–Cu2+ complexes. The results of this paper further improve the understanding of the mechanism of DNA–metal ion interaction and contribute to the practical application of DNA–metal ion complexes.
Glossary
Abbreviations
- DNA
deoxyribonucleic acid
- NMR
nuclear magnetic resonance
- A
adenine
- G
guanine
- C
cytosine
- T
thymine
- VCD
vibrational circular dichroism
- DFT
density functional theory
- TEM
transmission electron microscopy
- FFT
fast Fourier transform
- CuNPs
copper nanoparticles
- SWCNTs
single-walled carbon nanotubes
Author Contributions
The manuscript was written through contributions of all authors. All authors have given approval to the final version of the manuscript.
The authors acknowledge the support from the National Natural Science Foundation of China (Nos. 61871113, 61971125) and the National Key R&D Program of China (No. 2020YFB2008901).
The authors declare no competing financial interest.
References
- Nunes K. M.; Andrade M. V. O.; Santos Filho A. M. P.; Lasmar M. C.; Sena M. M. Detection and characterisation of frauds in bovine meat in natura by non-meat ingredient additions using data fusion of chemical parameters and ATR-FTIR spectroscopy. Food Chem. 2016, 205, 14–22. 10.1016/j.foodchem.2016.02.158. [DOI] [PubMed] [Google Scholar]
- Weber D. J.; Anderson D.; Rutala W. A. The role of the surface environment in healthcare-associated infections. Curr. Opin. Infect. Dis. 2013, 26, 338–344. 10.1097/QCO.0b013e3283630f04. [DOI] [PubMed] [Google Scholar]
- Xu J.; Li Z.; Xu P.; Xiao L.; Yang Z. Nanosized copper oxide induces apoptosis through oxidative stress in podocytes. Arch. Toxicol. 2013, 87, 1067–1073. 10.1007/s00204-012-0925-0. [DOI] [PubMed] [Google Scholar]
- Saulou C.; Jamme F.; Girbal L.; Maranges C.; Fourquaux I.; Cocaign-Bousquet M.; Dumas P.; Mercier-Bonin M. Synchrotron FTIR microspectroscopy of Escherichia coli at single-cell scale under silver-induced stress conditions. Anal. Bioanal. Chem. 2013, 405, 2685–2697. 10.1007/s00216-013-6725-4. [DOI] [PubMed] [Google Scholar]
- Palza H.; Quijada R.; Delgado K. Antimicrobial polymer composites with copper micro- and nanoparticles: Effect of particle size and polymer matrix. J. Bioact. Compat. Polym. 2015, 30, 366–380. 10.1177/0883911515578870. [DOI] [Google Scholar]
- Packer L.Methods in Enzymology: Oxygen Radicals in Biological Systems Part D; Academic Press, 1994. [Google Scholar]
- Hackl E. V.; Kornilova S. V.; Blagoi Y. P. DNA structural transitions induced by divalent metal ions in aqueous solutions. Int. J. Biol. Macromol. 2005, 35, 175–191. 10.1016/j.ijbiomac.2005.01.011. [DOI] [PubMed] [Google Scholar]
- Hiai S. Effects of cupric ions on thermal denaturation of nucleic acids. J. Mol. Biol. 1965, 11, 672–690. 10.1016/s0022-2836(65)80025-0. [DOI] [PubMed] [Google Scholar]
- Eichhorn G. L.; Clark P. Interactions of metal ions with polynucleotides and related compounds. V. The unwinding and rewinding of DNA strands under the influence of copper (ii) ions. Proc. Natl. Acad. Sci. U. S. A. 1965, 53, 586–593. 10.1073/pnas.53.3.586. [DOI] [PMC free article] [PubMed] [Google Scholar]
- Eichhorn G. L.; Clark P.; Becker E. D. Interactions of metal ions with polynucleotides and related compounds. VII. The binding of copper(II) to nucleosides, nucleotides, and deoxyribonucleic acids. Biochemistry 1966, 5, 245–253. 10.1021/bi00865a032. [DOI] [PubMed] [Google Scholar]
- Venner H.; Zimmer C. Studies on nucleic acids. VIII. Changes in the stability of DNA secondary structure by interaction with divalent metal ions. Biopolymers 1966, 4, 321–335. 10.1002/bip.1966.360040306. [DOI] [Google Scholar]
- Coates J. H.; Jordan D. O.; Srivastava V. K. The binding of copper(II) ions to DNA. Biochem. Biophys. Res. Commun. 1965, 20, 611–615. 10.1016/0006-291x(65)90443-2. [DOI] [PubMed] [Google Scholar]
- Sissoëff I.; Grisvard J.; Guillé E. Studies on metal ions-DNA interactions: specific behaviour of reiterative DNA sequences. Prog. Biophys. Mol. Biol. 1976, 31, 165–199. 10.1016/0079-6107(78)90008-1. [DOI] [PubMed] [Google Scholar]
- Richard H.; Schreiber J. P.; Daune M. Interactions of metallic ions with DNA. V. DNA renaturation mechanism in the presence of Cu2+. Biopolymers 1973, 12, 1–10. 10.1002/bip.1973.360120102. [DOI] [PubMed] [Google Scholar]
- Zimmer C.; Luck G.; Fritzsche H.; Triebel H. DNA-copper (II) complex and the DNA conformation. Biopolymers 1971, 10, 441–463. 10.1002/bip.360100303. [DOI] [PubMed] [Google Scholar]
- Marino T.; Toscano M.; Russo N.; Grand A. Gas-phase interaction between DNA and RNA bases and copper (II) ion: A density functional study. Int. J. Quantum Chem. 2004, 98, 347–354. 10.1002/qua.20069. [DOI] [Google Scholar]
- Burda J. V.; Šponer J.; Hobza P. Ab Initio Study of the Interaction of Guanine and Adenine with Various Mono- and Bivalent Metal Cations (Li+ , Na+, K+, Rb+, Cs+; Cu+, Ag+, Au+; Mg2+, Ca2+, Sr2+, Ba2+; Zn2+, Cd2+, and Hg2+ ). J. Phys. Chem. 1996, 100, 7250–7255. 10.1021/jp952941h. [DOI] [Google Scholar]
- Andrushchenko V.; van de Sande J. H.; Wieser H. Vibrational circular dichroism and IR absorption of DNA complexes with Cu2+ ions. Biopolymers 2003, 72, 374–390. 10.1002/bip.10439. [DOI] [PubMed] [Google Scholar]
- Hackl E. V.; Kornilova S. V.; Blagoi Y. P. DNA structural transitions induced by divalent metal ions in aqueous solutions. Int. J. Biol. Macromol. 2005, 35, 175–191. 10.1016/j.ijbiomac.2005.01.011. [DOI] [PubMed] [Google Scholar]
- Zhan S.; Xu H.; Zhang W.; Zhan X.; Wu Y.; Wang L.; Zhou P. Sensitive fluorescent assay for copper (II) determination in aqueous solution using copper-specific ssDNA and Sybr Green I. Talanta 2015, 142, 176–182. 10.1016/j.talanta.2015.04.037. [DOI] [PubMed] [Google Scholar]
- Sagripanti J. L.; Goering P. L.; Lamanna A. Interaction of copper with DNA and antagonism by other metals. Toxicol. Appl. Pharmacol. 1991, 110, 477–485. 10.1016/0041-008x(91)90048-j. [DOI] [PubMed] [Google Scholar]
- Ursu E.-L.; Clima L.; Hejesen C.; Rotaru A.; Pinteala M. DNA-Mediated Copper Nanoparticle Formation on Dispersed Single-Walled Carbon Nanotubes. HCA 2015, 98, 1141–1146. 10.1002/hlca.201500033. [DOI] [Google Scholar]
- LaMer V. K.; Dinegar R. H. Theory, Production and Mechanism of Formation of Monodispersed Hydrosols. J. Am. Chem. Soc. 1950, 72, 4847–4854. 10.1021/ja01167a001. [DOI] [Google Scholar]