

Abstract

Direct drum seeding has emerged as a viable and alternate substitute to the current transplanted rice to address constraints of labor and water scarcity as well as rising cultivation costs. However, heavy weed infestation is the main biological factor leading to immense yield loss, which requires immediate attention. Therefore, adoption of efficient weed management practice is critical for the success and widespread adoption of direct seeded rice. In this regard, an experiment was laid out at the Faculty of Agriculture, Wadura, SKUAST of Kashmir, India, in Kharif seasons of 2018 and 2019 to assess the efficiency of direct seeded rice (DSR) under two sowing dates (D1: 10th May and D2: 3rd June) and six weed management strategies (W1: weedy check (untreated check), W2: four mechanized conoweedings at 15, 30, 45, and 60 DAS (days after sowing), equivalent to weed free (four conoweedings, equivalent to weed free), W3: bensulfuron-methyl + pretilachlor @ 60 and 600 g a.i. ha–1 as pre-emergence (BSM + pretilachlor, PE), W4: oxyfluorfen @ 750 g a.i. ha–1 as pre-emergence (oxyfluorfen, PE), W5: bensulfuron-methyl + pretilachlor @ 60 and 600 g a.i. ha–1 as pre-emergence followed by 2,4-D @ 0.75 kg a.i. ha–1 as post-emergence (30–35 DAS) (BSM + pretilachlor PE fb 2,4-D PoE), and W6: oxyfluorfen @ 750 g a.i. ha–1 as pre-emergence followed by 2,4-D @ 0.75 kg a.i. ha–1 as post-emergence (30–35 DAS) (oxyfluorfen PE fb 2,4-D PoE) on growth characteristics, productivity, weed infestation, and nutrient dynamics. The pooled results showed that 10th May sowing recorded significantly higher values of growth characteristics viz. plant height, dry matter production, tiller count, and yield characteristics, including panicle weight, panicle length, filled grains per panicle, and test weight, as compared to delayed sowing (3rd June). Earlier sowing (10th May) produced significantly higher grain yield (7.33 t ha–1) and straw yield (8.99 t ha–1) when compared to the delayed sowing (3rd June) which produced a grain yield of 6.08 t ha–1 and straw yield of 7.93 t ha–1. Among weed management strategies, four mechanized conoweeding at 15, 30, 45, and 60 DAS resulted in enhanced growth, yield characteristics, and yield but was statistically similar to bensulfuron-methyl (BSM) + pretilachlor PE fb 2,4-D post-emergence (PoE). Delayed sowing (3rd June; D2) recorded significantly higher weed density and dry-weed biomass as compared to earlier sowing (10th May; D1). Among the herbicides tested, sequential application of BSM + pretilachlor PE fb 2,4-D PoE proved an efficient weed management practice with a significantly reduced population and dry weight of weeds. Therefore, it was concluded that 10th May sowing with four mechanized conoweedings or sequential application of BSM + pretilachlor PE fb 2,4-D PoE is promising for improving productivity and efficient weed control in direct drum seeded rice under temperate Kashmir conditions.
Introduction
Rice (Oryza sativa L.) is the most important food crop for the majority of the world’s population, notably in Asia, where it accounts for greater than 90% of worldwide rice production and consumption.1 Rice has been cultivated in Jammu and Kashmir from time immemorial and is the most prominent staple food crop, covering an area of 0.28 million hectares with 0.55 MT of production and 2.1 t/ha of productivity.2 In India, rice is mostly grown through the traditional transplanting method, but rice farming practices have changed significantly in response to technological advancements, manpower and water shortages, and mounting production costs. Based on the geographical and agro-climatic conditions, the traditional rice transplanting system has been replaced with alternative direct sowing with minor interventions in the last 2 decades. Direct drum seeding, water seeding, and wet seeding using pre-germinated seeds and dry direct sowing are some of the rice establishment methods that have evolved, and these approaches hold great potential in scenarios where labor and water are scarce.3,4 Direct seeded rice (DSR) currently covers over 29 million hectares in Asia, accounting for roughly 21% of the entire rice acreage in the region,5 with Punjab alone surpassing 0.60 million hectares of DSR in 2021. DSR is a modern rice farming technique that demands less labor and inputs while boosting and sustaining productivity and mitigating degradation of soil.6,7 Direct seeding allows for faster and more convenient planting, lower labor costs, 7–10 days earlier maturity of crop, less water consumption, greater resistance to water shortages, reduced emissions of methane, and provides greater profit in regions having reliable water supplies.8 Because of water scarcity and rising labor costs, the DSR area is expected to grow even more in the future. Moreover, traditional transplanting of rice breaks soil capillary pores, disperses clay particles, and destroys stability of soil aggregates due to continuous and repeated puddling, resulting in creating a hardpan which can be rectified by adopting a DSR system.9 However, heavy weed infestation in DSR particularly during early stages is a challenging problem due to the lack of weed suppressing the action of stagnant water at the emergence of crops and unavailability of seedlings.9 Severe weed interference has witnessed about 90% of yield loss in DSR; furthermore, weeds are the primary biological constraint to the DSR production.9,10
In India, out of a total economic loss of USD 11 billion caused by weeds, DSR alone contributes about 21.4% among the 10 major crops.11 Various strategies have been employed throughout the world to curb the weed menace in the rice crop, but their effectiveness differs from region to region owing to many factors. Weed control is critical for achieving improved yields, most importantly in the initial crop establishment stages. The reduced growth of the crop due to weed interference during the early stages could be due to changes in the absorption of red light and far-red light and also due to the production of secondary metabolites, i.e., allelochemicals by the weeds, which suppresses crop growth. The triggered production of reactive oxygen species, which damages the crop plant cells and reduces season-long crop growth, which probably is due to reduced red: far red-light ratio absorption caused by weed shading. Weeding by hand has proven challenging due to labor shortages, as well as being time consuming, cumbersome, and an expensive practice.12 Herbicides are becoming extremely popular because of their selectivity, efficacy, ease of usage, and potential to reduce crop cultivation costs. Numerous pre-emergence and post-emergence herbicides have been successful in controlling weeds in rice. Different herbicides have been employed to manage weed flora in DSR crops, but the performance of chemical weed control methods based on only one herbicide treatment may not be desirable due to the restricted spectrum of weed control of these herbicides.13 In the absence of appropriate broad-spectrum herbicides in rice, administration of herbicides in combination or sequential applications may be advantageous to suppress a diverse community of weed flora14 while also increasing crop growth.15,16 Although several research works have been done in DSR regarding weed management, but due to geographical and ecological differences, efficient weed management practice for direct drum seeded rice to curb the weed menace has not been done extensively and concisely under temperate ecology.17 A drum seeder is handy equipment and is being efficiently utilized in different crops. It not only saves time and labor but also facilitates maintenance of proper planting geometry and optimum utilization of resources. It has been reported that there are lower18 or even higher19 yields in DSR as compared to traditional transplanting rice cultivation with lesser water and labor. In the Kashmir valley, to explore the potential of direct drum seeded rice, it is important to control the first flush of weeds. So, the hypothesis of the study is an attempt being made to evaluate known herbicide molecules under existing agro-climatic conditions. In this backdrop, an experiment was conducted at the Faculty of Agriculture, SKUAST-Kashmir with an objective to assess the impact of fluctuating sowing dates and weed management strategies on direct drum-seeded rice in temperate Kashmir.
Materials and Methods
Description of Site
The experiment was performed at the Division of Agronomy, Faculty of Agriculture, SKUAST-Kashmir in Kharif 2018 and 2019. The field is situated between 34° 21′ N latitude and 74° 23′ E longitude and at an altitude of 1590 m AMSL. A temperate climate prevails in the area, with freezing temperatures in the winter and hot weather in the summer. Rice crops in this zone have a short growth cycle of 140 to 150 days. To examine the initial physicochemical parameters of soil, samples were obtained from the surface layer (20 cm) (Table 1).
Table 1. Physicochemical Properties of the Soil of Experimental Field.
| soil property | value |
|---|---|
| (A) Mechanical Analysis | |
| sand (%) | 10.50 |
| silt (%) | 54.20 |
| clay (%) | 35.30 |
| texture | silty-clay loam |
| (B) Chemical Analysis | |
| electrical conductivity (dS m–1) | 0.13 |
| pH | 6.9 |
| organic carbon (%) | 0.97 |
| available N (kg ha–1) | 325 |
| available P2O5 (kg ha–1) | 16.9 |
| available K2O (kg ha–1) | 245 |
Weather Conditions
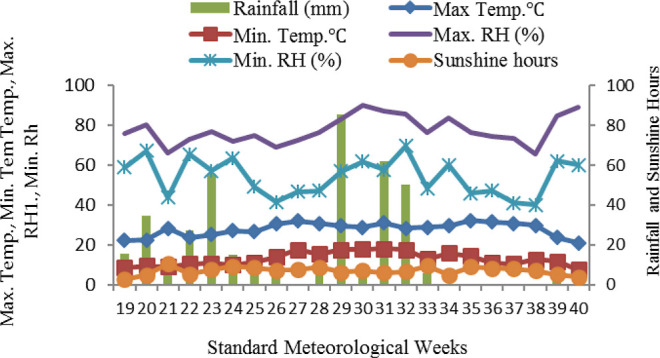
The weather of the region was variable throughout the entire crop growth period and was presented as mean data of 2018 and 2019. The average max. and min. temperatures for the entire crop growth season were 32.46 and 17.24 °C, respectively, in 2018 and 27.94 and 12.92 °C in 2019 and the total precipitation amounted to 168.06 mm in 2018 and 402.80 mm in 2019, respectively. The total number of mean sunshine hours of standard meteorological weeks recorded was 172.38 in 2018 and 154.89 in 2019, and the average maximum and minimum relative humidities were 90.45 and 62.21% in 2018, respectively, and 77.58 and 54.16% in 2019, respectively (Figures 1 and 2).
Figure 1.

Mean weather data during the crop growth season of 2018.
Figure 2.
Mean weather data during the crop growth season of 2019.
Experimental Design and Treatment Details
The experiment consisted of two factors (two dates of sowing and six weed management strategies), replicated thrice and set up in Split plot design. The main plot treatments included 2 sowing dates D1: 10th May and D2: 3rd June and 6 weed management strategies viz. W1: weedy check (untreated check), W2: four mechanized conoweedings at 15, 30, 45, and 60 DAS (days after sowing), equivalent to weed free (four conoweedings, equivalent to weed free), W3: bensulfuron-methyl + pretilachlor @ 60 and 600 g a.i. ha–1 as pre-emergence (BSM + pretilachlor, PE), W4: oxyfluorfen @ 750 g a.i. ha–1 as pre-emergence (oxyfluorfen, PE), and W5: bensulfuron-methyl + pretilachlor @ 60 and 600 g a.i. ha–1 as pre-emergence followed by 2,4-D @ 0.75 kg a.i. ha–1 as post-emergence (30–35 DAS) (BSM + pretilachlor PE fb 2,4-D PoE), and W6: oxyfluorfen @ 750 g a.i. ha–1 as pre-emergence followed by 2,4-D @ 0.75 kg a.i. ha–1 as post-emergence (30–35 DAS) (oxyfluorfen PE fb 2,4-D PoE) as sub-plot treatments. The experimental plot size was 5 m × 3 m (15 m2) and to avoid herbicide cross-contamination, a 0.5 m buffer zone was kept between the sub-plot treatments. W2 treatment (four conoweedings) at 15, 30, 45, and 60 DAS (equivalent to weed free) was kept weed free by repeated mechanized weedings by a cono-weeder and in weedy check (control), weeds were allowed to grow as it received no herbicides or manual/mechanical weeding. Granular herbicides after mixing with sand were applied uniformly as per treatments, whereas a knapsack sprayer with a flat fan nozzle was used for applying liquid herbicide formulations with an application pressure and discharge of 5.6 kg cm–2 and 500 mL min–1, respectively.
Crop Management Practices
Tractor-drawn disc-plough was used to perform one-tillage over an experimental field. Subsequently, three ploughings were given with the tiller for fine tilth of soil and levelling was done manually. Bunds were built in dry conditions according to the treatments and after the field was irrigated, puddling was done with a power tiller. Proper levelling of plots was done prior to seed sowing. Excess water was removed from the field at the time of sowing and according to the treatment layout plan; it was bifurcated into different main and sub-plot treatments by providing proper drainage channels. The variety tested in the experiment was Shalimar Rice-3 having a yield potential of 7.0–7.5 t/ha with a growing period of 135–140 days. Seeds of test variety @ 80 kg/ha were soaked for 48 h in water and then incubated for 48 h for sprouting of seeds. Seeds were uniformly placed in rows, 20 cm apart by a six-rowed drum seeder in the north–east direction. To avoid diseases, seed treatment with tricyclazole 75 WP @ 0.6 g/kg seed was done prior to seed sowing. For all the treatments, seed sowing was done by a drum seeder at 20 × 10 cm spacing. Finely decomposed FYM at a rate of 10 t ha–1 was incorporated in the experimental field at the time of layout. The primary nutrients viz., N (120 kg ha–1), P2O5 (60 kg ha–1), and K2O (30 kg ha–1) were supplied in the commercial form of urea, DAP, and MOP. Before seed sowing, each experimental plot received the full recommended quantity of phosphorous and potassium as a basal dose. Nitrogen was administered in three splits, with half as a basal dose and the other half at tillering and panicle initiation stages, in two equal splits.
Biometric Crop Observations
Plant height was measured from the surface to the tip of the extreme fully opened leaf during the vegetative growth phase and up to the apex of the panicle upon anthesis on 10 randomly chosen plants from each treatment at different phenological stages of the crop. The heights were averaged and expressed in centimeters. For the estimation of dry matter of plant samples, a quadrant of 0.25 m2 was used. Plant samples were taken at various phenological stages and dried under sunlight for 3–4 days before being dried in an oven for 48 h at 60–65 °C to achieve a stable weight. Tiller count (through use of quadrant) was taken at various phenological stages till harvest from every experimental plot and were averaged and expressed in no. m–2. Ten randomly selected panicles from each treatment were assessed for panicle length, panicle weight, and filled grains per panicle, which were then averaged and represented in centimeters, grams, and grains per panicle, respectively. Grain samples were taken from each plot and dried properly at the time of threshing and from each of the collected samples; 1000 grains were taken for test weight and expressed in grams. From each net plot grain yield, straw, and biological yield was computed and by using the following formula HI was calculated
Weed Measurements
During the course of investigation, weeds in the 1 m2 quadrants were uprooted from every plot at 30, 45, and 60 DAS, as well as at harvest, recognized, quantified, and represented as weeds m–2. The same weeds were washed and sun-dried for 48 h. Then, they were oven dried at 60–65 °C to achieve a stable weight, quantified in grams and converted to g m–2. The following formula was used to calculate the WCE
where WCE = weed control efficiency; WDC = dry weed biomass in the control plot; and WDT = dry weed biomass in the treated plot.
Nutrient Studies
Crop and weed samples during both the years were ground in a Wiley mill after oven-drying and utilized for NPK chemical estimation. By digesting a 0.5 g sample in 10 mL conc. H2SO4 and digestion mixture, the N concentration was calculated. The micro-Kjeldahl technique was employed to determine total nitrogen. Using a systronics spectrophotometer, the phosphorous content of samples of rice crops was evaluated using the “vanado molybdate phosphoric yellow method” by digestion in a tri acid mixture (HNO3/HClO4/H2SO4 at a rate of 10:4:1). Potassium concentration (percentage) in plant samples was revealed by a flame photometer. The dry-matter accumulation is multiplied by the corresponding concentration of nutrients in grain and straw, nitrogen, phosphorous, and potassium uptake was determined and expressed as kg ha–1.
Statistical Analysis
The data analysis was carried out using ANOVA (SAS Software packages, SAS EG v4.3, SAS Institute, Cary, NC, USA), and the treatment means were compared using the critical difference (CD) test at a significance level of 0.05. Weed population and dry weed biomass data were transformed into square root values, which were then employed in the analysis. The results for the various parameters viz. yield, yield attributes, and other weed parameters between the 2 years of the experiment were statistically non-significant and hence, the data were pooled for both the years.
Results
Plant Height (cm)
Sowing dates and weed management practices had a considerable impact on the plant height in DSR, according to the data (Table 2). Results showed that the plant height improved significantly up to 50% flowering stage and then increased at a slower rate until reaching maturity. At the maximum tillering and milking stages, sowing dates had non-significant effects on the plant height; however, 10th May sowing recorded significantly taller plants at panicle initiation, 50% flowering, dough, and maturation stages than 3rd June sowing. At maturity, a greater plant height of 125.9 cm was observed when sowing was done on 10th May as compared to 122.7 cm with delayed sowing (3rd June) with a superiority of 2.54% at harvest. At all phenological stages of the crop, weed management strategies had a substantial effect on plant height. Among weed management strategies, conoweeding treatment (equivalent to weed free) resulted in higher plant height of 129.5 cm but was statistically at par with sequential application of BSM + pretilachlor PE fb 2,4-D PoE, which recorded a plant height of 128.2 cm at maturity. Among the herbicides tested, sequential application of BSM + pretilachlor PE fb 2,4-D PoE recorded superiorities of 0.62, 1.79, 2.02, and 14.74% over oxyfluorfen PE fb 2,4-D PoE, BSM + pretilachlor PE, oxyfluorfen PE, and weedy check treatment, respectively. Furthermore, it was observed that weedy check (control) treatment had the lowest plant height during the crop growing season.
Table 2. Plant Height (cm) of DSR under Variable Sowing Date and Weed Management Practices (Pooled Data of 2 Years)a.
| treatments | MT | PI | 50% FLW | M | D | H |
|---|---|---|---|---|---|---|
| Dates of Sowing | ||||||
| D1: 10th May | 60.5 | 74.1 | 117.1 | 124.1 | 125.4 | 125.9 |
| D2: 3rd June | 58.8 | 71.9 | 113.3 | 121.3 | 122.2 | 122.7 |
| SE(m) ± | 0.36 | 0.11 | 1.19 | 0.90 | 0.73 | 0.73 |
| CD (p ≤ 0.05) | NS | 0.35 | 3.58 | NS | 2.20 | 2.20 |
| Weed Management Practices | ||||||
| W1: weedy check | 48.5 | 70.3 | 99.2 | 106.8 | 108.8 | 109.3 |
| W2: four conoweedings (equivalent to weed free) | 64.7 | 89.5 | 122.2 | 128.2 | 129.0 | 129.5 |
| W3: BSM + pretilachlor, PE | 60.7 | 83.3 | 117.3 | 124.3 | 125.5 | 125.9 |
| W4: oxyfluorfen, PE | 58.2 | 81.1 | 113.5 | 122.4 | 125.1 | 125.6 |
| W5: BSM + pretilachlor PE fb 2,4-D PoE | 63.3 | 87.3 | 120.5 | 127.3 | 127.8 | 128.2 |
| W6: oxyfluorfen PE fb 2,4-D PoE | 62.6 | 86.3 | 118.6 | 126.9 | 126.9 | 127.4 |
| SE(m) ± | 2.19 | 0.13 | 2.11 | 2.11 | 2.16 | 2.16 |
| CD (p ≤ 0.05) | 6.46 | 0.38 | 6.23 | 6.24 | 6.37 | 6.37 |
MT = maximum tillering, PI = panicle initiation, 50% FLW = 50% flowering, M = milking, D = dough, H = harvest.
Dry Matter Accumulation
Sowing dates had a substantial impact on the crop’s dry matter production. The 10th May sowing resulted in considerably better dry-matter accumulation across all developmental stages and at harvest (144.32 q ha–1) as compared to the 3rd June sowing (141.27 q ha–1) (Table 3). Weed control strategies had a considerable impact on crop dry matter accumulation at all phenological stages. Conoweeding treatment (equivalent to weed free) though at par with sequential application of BSM + pretilachlor PE fb 2,4-D PoE and oxyfluorfen PE fb 2,4-D PoE except at maximum the tillering stage produced significantly increased dry matter production (152.99 q ha–1) during the crop growth phases over weedy check treatment (117.43 q ha–1). The weedy check treatment observed significantly lower dry matter at all pheno-phases of the crop.
Table 3. Dry Matter Accumulation (q ha–1) of DSR under Variable Sowing Dates and Weed Management Practices (Pooled Data of 2 Years)a.
| treatments | MT | PI | 50% FLW | M | D | H |
|---|---|---|---|---|---|---|
| Dates of Sowing | ||||||
| D1: 10th May | 35.9 | 52.7 | 81.3 | 115.1 | 137.5 | 144.3 |
| D2: 3rd June | 33.8 | 49.2 | 77.9 | 110.6 | 134.5 | 141.2 |
| SE(m) ± | 0.5 | 1.08 | 1.11 | 1.36 | 0.81 | 0.83 |
| CD (p ≤ 0.05) | 1.60 | 3.25 | 3.33 | 4.06 | 2.45 | 2.51 |
| Weed Management Practices | ||||||
| W1: weedy check | 23.2 | 38.6 | 52.2 | 84.9 | 111.1 | 117.4 |
| W2: four conoweedings (equivalent to weed free) | 42.3 | 58.8 | 90.4 | 122.9 | 146.3 | 152.9 |
| W3: BSM + pretilachlor, PE | 33.7 | 50.1 | 84.3 | 117.3 | 138.7 | 145.8 |
| W4: oxyfluorfen, PE | 32.4 | 48.3 | 78.0 | 111.3 | 132.5 | 139.7 |
| W5: BSM + pretilachlor PE fb 2,4-D PoE | 41.1 | 56.4 | 88.1 | 121.3 | 144.2 | 151.1 |
| W6: oxyfluorfen PE fb 2,4-D PoE | 36.7 | 53.7 | 84.9 | 119.1 | 143.2 | 149.5 |
| SE(m) ± | 0.57 | 1.89 | 1.85 | 1.75 | 1.37 | 1.24 |
| CD (p ≤ 0.05) | 1.69 | 5.59 | 5.47 | 5.17 | 4.06 | 3.66 |
MT = maximum tillering, PI = panicle initiation, 50% FLW = 50% flowering, M = milking, D = dough, H = harvest.
Tiller Count (m2)
Data indicated that the tiller number was the highest at the maximum tillering stage and thereafter showed a steady decrease till harvest (Table 4). The two sowing dates varied significantly with respect to tiller count at all phenophases. The significantly higher tiller number was recorded for the 10th May (400.58 tillers m–2) as compared to 3rd June sowing (346.55 tillers m–2) at all phenophases of the crop. It was found that conoweeding treatment (equivalent to weed free) produced significantly more tiller count (425.08 tillers m–2) than any other weed management strategy during the crop growth season. Among the different herbicides used, sequential application of BSM + pretilachlor PE fb 2,4-D PoE revealed a significantly higher tiller count (408.21 m–2) at all the phenological stages of the crop in contrast to other herbicidal treatments and control (weedy check). Weedy check treatment noted a significantly lower tiller count (328.18 m–2) throughout the crop growth season.
Table 4. Tiller Count (No. m–2) of DSR under Variable Sowing Dates and Weed Management Practices (Pooled Data of 2 Years)a.
| treatments | MT | PI | 50% FLW | M | D | H |
|---|---|---|---|---|---|---|
| Dates of Sowing | ||||||
| D1: 10th May | 453.7 | 439.7 | 429.1 | 414.9 | 407.1 | 400.5 |
| D2: 3rd June | 404.8 | 389.1 | 380.4 | 361.5 | 354.5 | 346.5 |
| SE(m) ± | 2.89 | 6.06 | 1.87 | 3.46 | 3.79 | 0.56 |
| CD (p ≤ 0.05) | 8.68 | 18.20 | 5.61 | 10.38 | 11.37 | 1.68 |
| Weed Management Practices | ||||||
| W1: weedy check | 374.1 | 360.8 | 351.0 | 333.73 | 328.3 | 328.1 |
| W2: four conoweedings (equivalent to weed free) | 490.7 | 474.4 | 461.6 | 444.36 | 434.5 | 425.1 |
| W3: BSM + pretilachlor, PE | 411.7 | 396.3 | 388.6 | 379.39 | 376.1 | 365.5 |
| W4: oxyfluorfen, PE | 392.8 | 381.5 | 369.7 | 349.84 | 344.0 | 337.9 |
| W5: BSM + pretilachlor PE fb 2,4-D PoE | 478.6 | 465.3 | 452.8 | 428.23 | 415.7 | 408.2 |
| W6: oxyfluorfen PE fb 2,4-D PoE | 427.8 | 407.9 | 404.5 | 394.1 | 386.4 | 376.4 |
| SE(m) ± | 3.14 | 2.07 | 2.14 | 2.15 | 2.82 | 1.81 |
| CD (p ≤ 0.05) | 9.27 | 6.11 | 6.32 | 6.35 | 8.32 | 5.35 |
MT = maximum tillering, PI = panicle initiation, 50% FLW = 50% flowering, M = milking, D = dough, H = harvest.
Yield Attributes
Yield contributing characters were significantly influenced by sowing dates and weed management practices (Table 5). 10th May sowing increased panicle weight, panicle length, number of filled grains per panicle, and test weight over 3rd June sowing. Conoweeding (equivalent to weed free) significantly improved panicle weight (24.07 g), panicle length (3.07 cm), filled grains/panicle (109.9), and 1000-grain weight (24.77 g) when compared to weedy check (untreated check) and other weed management strategies. Apart from conoweeding treatment (equivalent to weed free), higher panicle length (23.36 cm), panicle weight (2.86 g), filled grains per panicle (106.8), and 1000-grain weight (24.18 g) were recorded by BSM + pretilachlor PE fb 2,4-D PoE and the least panicle length (21.64 cm), panicle weight (1.40 g), filled grains per panicle (74.3), and test weights (22.61 g) were under weedy check treatment. The better utilization of growth resources by the crop due to lower competition from the weed population in conoweeding treatment (equivalent to weed free) and sequential application of BSM + pretilachlor PE fb 2,4-D PoE resulted in enhanced yield characters.
Table 5. Yield Attributes of DSR under Variable Sowing Dates and Weed Management Practices (Pooled Data of 2 Years).
| treatments | panicle length (cm) | panicle weight (g) | filled grains per panicle | 1000 grain wt (g) |
|---|---|---|---|---|
| Dates of Sowing | ||||
| D1: 10th May | 24.3 | 2.4 | 105.2 | 24.8 |
| D2: 3rd June | 21.6 | 2.0 | 90.6 | 22.4 |
| SE(m) ± | 0.09 | 0.06 | 1.12 | 0.15 |
| CD (p ≤ 0.05) | 0.29 | 0.20 | 3.38 | 0.45 |
| Weed Management Practices | ||||
| W1: weedy check | 21.6 | 1.4 | 74.3 | 22.6 |
| W2: four conoweedings (equivalent to weed free) | 24.1 | 3.1 | 109.9 | 24.8 |
| W3: BSM + pretilachlor, PE | 22.9 | 2.0 | 100.4 | 23.4 |
| W4: oxyfluorfen, PE | 22.4 | 1.7 | 92.4 | 23.1 |
| W5: BSM + pretilachlor PE fb 2,4-D PoE | 23.4 | 2.8 | 106.8 | 24.1 |
| W6: oxyfluorfen PE fb 2,4-D PoE | 23.1 | 2.3 | 103.7 | 23.9 |
| SE(m) ± | 0.45 | 0.22 | 1.94 | 0.33 |
| CD (p ≤ 0.05) | 1.33 | 0.66 | 5.73 | 1.00 |
Grain, Straw, Biological Yield, and Harvest Index
Results indicated that the sowing dates as well as weed management strategies had a considerable impact on grain and straw production (Table 6). The analysis demonstrated that sowing on the 10th May resulted in a considerable increase in grain output over sowing on 3rd June. The biological yield recorded was 16.33 t ha–1 on 10th May and 14.01 t ha–1 on 3rd June sowing. The enhanced harvest index was recorded with 10th May (44.59%) over 3rd June sowing (43.05%).
Table 6. Yield and Harvest Index of DSR under Variable Sowing Dates and Weed Management Practices (Pooled Data of 2 Years).
| treatments | grain yield (t ha–1) | straw yield (t ha–1) | biological yield (t ha–1) | H.I (%) |
|---|---|---|---|---|
| Dates of Sowing | ||||
| D1: 10th May | 7.3 | 8.9 | 16.3 | 44.5 |
| D2: 3rd June | 6.1 | 7.9 | 14.0 | 43.0 |
| SE(m) ± | 0.04 | 0.10 | 0.09 | 0.42 |
| CD (p ≤ 0.05) | 0.14 | 0.30 | 0.26 | 1.28 |
| Weed Management Practices | ||||
| W1: weedy check | 4.2 | 6.8 | 11.1 | 38.1 |
| W2: four conoweedings (equivalent to weed free) | 7.9 | 9.3 | 17.3 | 46.1 |
| W3: BSM + pretilachlor, PE | 6.9 | 8.5 | 15.5 | 44.7 |
| W4: oxyfluorfen, PE | 6.5 | 8.3 | 14.8 | 43.6 |
| W5: BSM + pretilachlor PE fb 2,4-D PoE | 7.5 | 8.9 | 16.4 | 45.6 |
| W6: oxyfluorfen PE fb 2,4-D PoE | 7.0 | 8.7 | 15.8 | 44.6 |
| SE(m) ± | 0.16 | 0.15 | 0.19 | 0.59 |
| CD (p ≤ 0.05) | 0.47 | 0.45 | 0.58 | 1.77 |
Various weed management strategies have a significant impact on a crop’s grain, straw, biological yield, and harvest index. Conoweeding (equivalent to weed free) though at par with sequential applications of BSM + pretilachlor PE fb 2,4-D PoE recorded a higher grain yield (7.79 t ha–1), straw yield (9.33 t ha–1), biological yield (17.31 t ha–1), and harvest index (46.06%), which was superior to the control and rest of the weed management treatments. Sequential application of BSM + pretilachlor PE fb 2,4-D PoE though at par with oxyfluorfen PE fb 2,4-D PoE yielded significantly more grain, straw, and biological yield than other herbicides as well as weedy check; however, it was found that the control noted significantly lower grain yield (4.25 t ha–1), straw yield (6.86 t ha–1), biological yield (11.11 t ha–1), and harvest index (38.19%). Increased yield was the result of enhancement in all yield parameters as well as a decrease in crop-weed competition. Weedy check treatment recorded the lowest grain yield and harvest index, due to tough interference imposed by a variety of weeds.
Weed Studies
Total Weed Population and Dry Weed Biomass
Predominant grassy weeds were E. crusgalli, E. colona, and C. dactylon; broad leaf weeds like Ammania baccifera, Marsilea quadrifolia, Monochoria vaginalis, Alisma plantago-aquatic, and Potamogeton distinctus while the dominant sedges observed were Cyperus iria, Cyperus difformis, and Fimbristylis littoralis. Data showed that the total weed population and weed dry weight was maximum at 60 DAS for all the treatments. All weed management practices achieved successful weed control when compared to weedy check treatment throughout the crop growth season. Different sowing dates had a significant influence in monitoring the total population of weeds and weed dry weight (Tables 7 and 8).
Table 7. Total Weed Density (No. m–2) of DSR under Variable Sowing Dates and Weed Management Practices (Pooled Data of 2 Years)a.
| treatments | 30 DAS | 45 DAS | 60 DAS | at harvest |
|---|---|---|---|---|
| Dates of Sowing | ||||
| D1: 10th May | 3.5 (14.2) | 4.5 (24.4) | 5.1 (31.1) | 4.6 (25.3) |
| D2: 3rd June | 4.3 (20.5) | 5.2 (31.4) | 5.7 (38.3) | 5.3 (32.6) |
| SE(m) ± | 0.20 | 0.10 | 0.01 | 0.06 |
| CD (p ≤ 0.05) | 0.61 | 0.32 | 0.03 | 0.18 |
| Weed Management Practices | ||||
| W1: weedy check | 6.6 (43.0) | 8.0 (64.3) | 9.2 (84.1) | 8.1 (65.7) |
| W2: four conoweedings (equivalent to weed free) | 1.0 (0.0) | 1.0 (0.0) | 1.0 (0.0) | 1.0 (0.0) |
| W3: BSM + pretilachlor, PE | 4.2 (16.9) | 5.1 (25.8) | 5.5 (30.6) | 5.2 (27.0) |
| W4: oxyfluorfen, PE | 4.3 (18.2) | 6.1 (36.6) | 6.4 (40.1) | 6.2 (37.8) |
| W5: BSM + pretilachlor PE fb 2,4-D PoE | 3.6 (12.7) | 4.2 (17.3) | 4.9 (24.3) | 4.4 (19.1) |
| W6: oxyfluorfen PE fb 2,4-D PoE | 3.7 (13.2) | 4.8 (23.2) | 5.4 (29.4) | 5.0 (24.3) |
| SE(m) ± | 0.13 | 0.14 | 0.16 | 0.13 |
| CD (p ≤ 0.05) | 0.40 | 0.43 | 0.48 | 0.39 |
Figures in parenthesis are subjected to square root transformation.
Table 8. Total Dry Weed Biomass (g m–2) of DSR under Variable Sowing Dates and Weed Management Practices (Pooled Data of 2 Years)a.
| treatments | 30 DAS | 45 DAS | 60 DAS | at harvest |
|---|---|---|---|---|
| Dates of Sowing | ||||
| D1: 10th May | 5.0 (30.9) | 5.3 (34.1) | 6.0 (43.7) | 5.4 (35.4) |
| D2: 3rd June | 5.8 (40.4) | 6.1 (45.2) | 7.2 (61.1) | 6.2 (46.8) |
| SE(m) ± | 0.03 | 0.06 | 0.03 | 0.06 |
| CD (p ≤ 0.05) | 0.10 | 0.18 | 0.09 | 0.19 |
| Weed Management Practices | ||||
| W1: weedy check | 10.1(102.6) | 10.4(108.2) | 11.0 (120.4) | 10.4 (109.4) |
| W2: four conoweedings (equivalent to weed free) | 1.0 (0.0) | 1.0 (0.0) | 1.0 (0.0) | 1.0 (0.0) |
| W3: BSM + pretilachlor, PE | 5.5 (30.1) | 5.9 (35.2) | 7.1 (50.3) | 6.1 (37.5) |
| W4: oxyfluorfen, PE | 5.8 (33.2) | 6.0 (36.3) | 7.3 (53.4) | 6.3 (39.2) |
| W5: BSM + pretilachlor PE fb 2,4-D PoE | 4.6 (21.2) | 5.2 (27.0) | 6.4 (41.8) | 5.3 (27.6) |
| W6: oxyfluorfen PE fb 2,4-D PoE | 5.2 (26.8) | 5.6 (31.1) | 7.0 (48.7) | 5.8 (33.1) |
| SE(m) ± | 0.11 | 0.09 | 0.06 | 0.09 |
| CD (p ≤ 0.05) | 0.34 | 0.28 | 0.19 | 0.27 |
Figures in parenthesis are subjected to square root transformation.
Results indicated that lowest weed population and total weed dry weight was revealed in the conoweeding treatment (equivalent to weed free). Sequential application of BSM + pretilachlor PE fb 2,4-D PoE obtained significantly decreased population of weeds and weed dry weight over the control and other treatments at 30 DAS, 45 DAS, 60 DAS, and at harvest. Weedy check treatment resulted in a significantly higher total weed population at 30, 45, and 60 DAS, and at harvest followed by oxyfluorfen PE, which in turn significantly increased total population of weeds than the rest of the weed management strategies. However, conoweeding treatment (equivalent to weed free) observed the lowest total weed population and dry weed biomass.
Weed Control Efficiency
The analysis of data (Table 9) showed that 10th May sowing recorded significantly higher weed control efficiency at 30 DAS (68.18%), 45 DAS (65.75%), 60 DAS (60.78%), and at harvest (65.08%) than 3rd June, which recorded a weed control efficiency of 62.42% at 30 DAS, 61.14% at 45 DAS, 52.67% at 60 DAS, and 59.89% at harvest (Table 9). Among the weed management strategies, conoweeding treatment (equivalent to weed free) resulted in significantly higher weed-control efficiency of 100% at 30, 45, and 60 DAS and at harvest. Sequential application of BSM + pretilachlor PE fb 2,4-D PoE obtained a higher weed control efficiency at 30 DAS (79.38%), 45 DAS (75.23%), 60 DAS (65.72%), and at harvest (74.97%) than other weed control treatments owing to a decrease in weed population and dry weed biomass. The weedy check treatment, on the other hand, had the lowest weed-control efficiency among all the treatments.
Table 9. Weed Control Efficiency (%) of DSR under Variable Sowing Dates and Weed Management Practices (Pooled Data of 2 Years)a.
| treatments | 30 DAS | 45 DAS | 60 DAS | at harvest |
|---|---|---|---|---|
| Dates of Sowing | ||||
| D1: 10th May | 7.7 (68.1) | 7.5 (65.7) | 7.3 (60.7) | 7.5 (65.1) |
| D2: 3rd June | 7.4 (62.4) | 7.3 (61.1) | 6.7 (52.6) | 7.2 (59.8) |
| SE(m) ± | 0.04 | 0.05 | 0.03 | 0.05 |
| CD (p ≤ 0.05) | 0.12 | 0.15 | 0.10 | 0.15 |
| Weed Management Practices | ||||
| W2: four conoweedings (equivalent to weed free) | 10.1 (100) | 10.0 (100) | 10.0 (100) | 10.0 (100) |
| W3: BSM + pretilachlor, PE | 8.4 (70.8) | 8.2 (67.6) | 7.7 (58.6) | 8.1 (65.8) |
| W4: oxyfluorfen, PE | 8.2 (67.8) | 8.2 (66.5) | 7.5 (56.1) | 8.1 (64.3) |
| W5: BSM + pretilachlor PE fb 2,4-D PoE | 8.9 (79.3) | 8.7 (75.2) | 8.1 (65.7) | 8.7 (74.9) |
| W6: oxyfluorfen PE fb 2,4-D PoE | 8.6 (73.8) | 8.5 (71.3) | 7.7 (59.9) | 8.4 (69.7) |
| SE(m) ± | 0.06 | 0.05 | 0.04 | 0.05 |
| CD (p ≤ 0.05) | 0.20 | 0.16 | 0.12 | 0.16 |
Figures in parenthesis are subjected to square root transformation.
Nutrient Studies
NPK Content and Uptake by Grain and Straw of DSR
Sowing dates as well as weed management strategies resulted in varied nutrient concentrations and uptake by the crop (Tables 10 and 11). The NPK concentration of grain (1.05, 0.22, and 0.27%) and straw (0.48, 0.06, and 1.48%) and NPK uptake by grain (77.99, 16.84, and 20.76 kg ha–1) and straw (44.46, 5.96, and 134.16 kg ha–1) were significantly higher in 10th May than 3rd June sowing. Among the weed management strategies, conoweeding treatment (equivalent to weed free) recorded the highest NPK concentration of grain (1.08, 0.24, and 0.29%) and straw (0.48, 0.07, and 1.48%) and NPK uptake by grain (86.77, 19.20, and 23.77 kg ha–1) and straw (45.70, 6.60, and 139.04 kg ha–1). Sequential application of BSM + pretilachlor PE fb 2,4-D PoE though at par with oxyfluorfen PE fb 2,4-D PoE exhibited a significantly higher NPK concentration of grain (1.06, 0.22, and 0.27%) and straw (0.48, 0.06, and 1.45%). The highest NPK uptake by grain (79.98, 17.07, and 20.71 kg ha–1) and straw (43.37, 5.98, and 129.58 kg ha–1) was revealed in BSM + pretilachlor PE fb 2,4-D PoE closely accompanied by sequential application of oxyfluorfen PE fb 2,4-D PoE. The lowest NPK concentration and uptake (grain and straw) of the crop was observed in weedy check treatment. The application of oxyfluorfen PE as a post-emergence herbicide revealed the lowest uptake of NPK among the herbicidal treatments tested.
Table 10. NPK Concentration (%) of Grain and Straw of DSR under Variable Sowing Dates and Weed Management Practices (Pooled Data of 2 Years).
| treatments | grain nutrient content (%) |
straw nutrient content (%) |
||||
|---|---|---|---|---|---|---|
| N | P | K | N | P | K | |
| Dates of Sowing | ||||||
| D1: 10th May | 1.05 | 0.22 | 0.27 | 0.48 | 0.06 | 1.48 |
| D2: 3rd June | 1.03 | 0.20 | 0.24 | 0.45 | 0.05 | 1.36 |
| SE(m) ± | 0.001 | 0.002 | 0.004 | 0.005 | 0.002 | 0.021 |
| CD (p ≤ 0.05) | 0.004 | 0.006 | 0.012 | 0.013 | 0.008 | 0.064 |
| Weed Management Practices | ||||||
| W1: weedy check | 0.98 | 0.19 | 0.22 | 0.41 | 0.04 | 1.38 |
| W2: four conoweedings (equivalent to weed free) | 1.08 | 0.24 | 0.29 | 0.48 | 0.07 | 1.48 |
| W3: BSM + pretilachlor, PE | 1.04 | 0.21 | 0.26 | 0.47 | 0.05 | 1.41 |
| W4: oxyfluorfen, PE | 1.02 | 0.20 | 0.25 | 0.46 | 0.04 | 1.40 |
| W5: BSM + pretilachlor PE fb 2,4-D PoE | 1.06 | 0.22 | 0.27 | 0.48 | 0.06 | 1.45 |
| W6: oxyfluorfen PE fb 2,4-D PoE | 1.05 | 0.22 | 0.27 | 0.47 | 0.06 | 1.43 |
| SE(m) ± | 0.004 | 0.004 | 0.004 | 0.004 | 0.003 | 0.19 |
| CD (p ≤ 0.05) | 0.012 | 0.012 | 0.012 | 0.012 | 0.010 | 0.59 |
Table 11. NPK Uptake (kg/ha) of Grain and Straw of DSR under Variable Sowing Dates and Weed Management Practices (Pooled Data of 2 Years).
| treatments | grain (kg/ha) |
straw (kg/ha) |
||||
|---|---|---|---|---|---|---|
| N | P | K | N | P | K | |
| Dates of Sowing | ||||||
| D1: 10th May | 77.9 | 16.8 | 20.7 | 44.4 | 5.9 | 134.1 |
| D2: 3rd June | 63.5 | 12.7 | 15.4 | 36.2 | 4.0 | 108.5 |
| SE(m) ± | 0.54 | 0.21 | 0.24 | 0.77 | 0.29 | 2.38 |
| CD (p ≤ 0.05) | 1.62 | 0.65 | 0.74 | 2.31 | 0.89 | 7.14 |
| Weed Management Practices | ||||||
| W1: weedy check | 44.18 | 8.91 | 10.19 | 28.57 | 3.34 | 95.20 |
| W2: four conoweedings (equivalent to weed free) | 86.7 | 19.2 | 23.7 | 45.7 | 6.6 | 139.0 |
| W3: BSM + pretilachlor, PE | 72.3 | 14.5 | 17.9 | 40.3 | 4.4 | 121.7 |
| W4: oxyfluorfen, PE | 66.5 | 13.3 | 16.6 | 38.9 | 3.7 | 117.0 |
| W5: BSM + pretilachlor PE fb 2,4-D PoE | 79.9 | 17.1 | 20.7 | 43.3 | 5.9 | 129.5 |
| W6: oxyfluorfen PE fb 2,4-D PoE | 74.6 | 15.7 | 19.4 | 42.2 | 5.8 | 125.4 |
| SE(m) ± | 1.20 | 0.32 | 0.44 | 0.70 | 0.30 | 2.30 |
| CD (p ≤ 0.05) | 3.56 | 0.94 | 1.30 | 2.07 | 0.90 | 6.79 |
NPK Uptake by Weeds and Nutrient Removal Budgeting
Data indicated that earlier sowing (10th May) reduced N (6.36 kg ha–1), P (0.63 kg ha–1), and K uptake (7.23 kg ha–1) by weeds significantly, while delayed sowing of DSR on 3rd June resulted in higher N (9 kg ha–1), P (0.90 kg ha–1), and K uptake (10.24 kg ha–1) by weeds (Table 12). NPK uptake by weeds was significantly increased by weedy check treatment in comparison to all the other weed management strategies. Application of oxyfluorfen @ 750 g a.i. ha–1 (pre-emergence) exhibited higher NPK uptake by weeds in comparison to other herbicidal treatments and conoweeding treatment (equivalent to weed free), followed by the application of bensulfuron-methyl + pretilachlor (60 and 600 g a.i. ha–1 pre-emergence). The results showed that the lowest uptake of N (5.77 kg ha–1), P (0.54 kg ha–1), and K uptake (6.60 kg ha–1) by weeds was recorded in the sequential application of BSM + pretilachlor PE fb 2,4-D PoE. The highest nutrient uptake NPK by weeds (18.70, 1.94, and 20.78 kg ha–1, respectively) was observed in weedy check treatment. The highest NPK removal and uptake by weeds was observed in weedy check treatment due to higher weed population and weed dry weight.
Table 12. Nutrient Removal Budgeting (kg ha–1) and Nutrient Uptake (kg ha–1) by Weeds in DSR under Variable Sowing Dates and Weed Management Practices (Pooled Data of 2 Years)a.
| treatments | nutrient uptake weeds (kg ha–1) |
NPK removal by rice (grain + straw) (kg ha–1) | NPK removal (weeds) (kg ha–1) | NPK removal by weeds (%) | ||
|---|---|---|---|---|---|---|
| N | P | K | ||||
| Dates of Sowing | ||||||
| D1: 10th May | 2.5 (6.3) | 1.2 (0.6) | 2.6 (7.2) | 300.1 | 14.2 | 4.5 |
| D2: 3rd June | 2.98 (9.0) | 1.3 (0.9) | 3.1 (10.2) | 240.5 | 20.1 | 7.7 |
| SE(m) ± | 0.01 | 0.0006 | 0.01 | 0.23 | ||
| CD (p ≤ 0.05) | 0.04 | 0.0019 | 0.04 | 0.64 | ||
| Weed Management Practices | ||||||
| W1: weedy check | 4.4 (18.7) | 1.7 (1.9) | 4.6 (20.7) | 190.3 | 41.4 | 17.8 |
| W2: four conoweedings (equivalent to weed free) | 1.0 (0.0) | 1.0 (0.0) | 1.0 (0.0) | 321.1 | 0 | |
| W3: BSM + pretilachlor, PE | 2.8 (7.1) | 1.3 (0.6) | 3.0 (8.2) | 271.3 | 15.9 | 5.5 |
| W4: oxyfluorfen, PE | 2.9 (7.7) | 1.3 (0.7) | 3.1 (8.9) | 256.2 | 17.4 | 6.3 |
| W5: BSM + pretilachlor PE fb 2,4-D PoE | 2.5 (5.7) | 1.2 (0.5) | 2.7 (6.6) | 296.6 | 12.9 | 4.1 |
| W6: oxyfluorfen PE fb 2,4-D PoE | 2.7 (6.8) | 1.2 (0.6) | 2.9 (7.8) | 283 | 15.4 | 5.1 |
| SE(m) ± | 0.02 | 0.005 | 0.028 | 0.34 | ||
| CD (p ≤ 0.05) | 0.08 | 0.016 | 0.084 | 0.99 | ||
W1: weedy check, W3: BSM + pretilachlor, PE, W4: oxyfluorfen, PE, W5: BSM + pretilachlor PE fb 2,4-D PoE, and W6: oxyfluorfen PE fb 2,4-D PoE.
Data in Table 11 show that NPK removal by rice under different sowing dates was maximum on 10th May (300.17 kg ha–1) as compared to 3rd June sowing (240.53 kg ha–1). Maximum NPK removal by rice crops was recorded in four conoweedings (321.08 kg ha–1) followed by sequential applications of BSM + pretilachlor PE fb 2,4-D PoE (296.69 kg ha–1). Weeds compete for the NPK uptake as well and a revealed significant total macronutrient intake. Maximum NPK removal by weeds was noted under 3rd June sowing (20.14 kg ha–1) compared to that of the earlier 10th May sowing (14.22 kg ha–1). Weeds removed the most total NPK in the weedy check treatment (41.42 kg ha–1) followed by oxyfluorfen, PE (17.41 kg ha–1) under weed management strategies while as a sequential application of BSM + pretilachlor PE fb 2,4-D PoE recorded the lowest NPK removal (12.91 kg ha–1) by weeds among herbicidal treatments. Weeds removed a larger percentage of NPK, indicating that they acquired much more macronutrients (Figures 3 and 4). The maximum share of NPK removal of weeds was revealed in delayed sowing, i.e., 3rd June (7.73%) as compared to earlier 10th May sowing (4.52%). Among weed management strategies, a higher contribution in the removal of NPK by weeds was noted in the control treatment (17.87%),59−61 followed by oxyfluorfen, PE (6.36%) while the lowest contribution was revealed in sequential application of BSM + pretilachlor PE fb 2,4-D PoE (4.17%).
Figure 3.

Nutrient removal percentage by weeds under different sowing dates.
Figure 4.

Nutrient removal percentage by weeds under different weed management practices.
Correlation and Regression Studies
A significant and positive correlation was noted between grain yield and yield characters viz., panicle density, panicle weight, grains per panicle, 1000-grain weight and panicle length (Table 13). The correlation coefficient ranged between 0.79 and 0.97. Highest correlation coefficient of 0.97 was revealed between panicle density and grains per panicle and 0.93 between grains/panicle and grain yield. Lowest correlation coefficient of 0.79 was recorded between panicle length and panicle weight.
Table 13. Correlation Studies of Yield with Yield Parameters Like Panicle Density, Panicle Weight, Grains Per Panicle, Test Weight and Panicle Length.
| panicle density | panicle weight | grains per panicle | test weight | panicle length | grain yield | |
|---|---|---|---|---|---|---|
| panicle density | 1.000 | |||||
| panicle weight | 0.795** | 1.000 | ||||
| grains per panicle | 0.977** | 0.823** | 1.000 | |||
| test weight | 0.937** | 0.795** | 0.952** | 1.000 | ||
| panicle length | 0.932** | 0.794** | 0.956** | 0.945** | 1.000 | |
| grain yield | 0.880** | 0.841** | 0.939** | 0.854** | 0.926** | 1.000 |
The coefficient of determination for the grain yield with panicle density (0.77), panicle weight (0.70), grains per panicle (0.88), test weight (0.72), panicle length (0.85), and spikelets per panicle (0.60) was highly significant (Figure 5). Panicle density, panicle weight, grains/panicle, test weight, panicle length, and spikelets per panicle accounted for 77, 70, 88, 72, 85, and 60% variations in the crop grain yield, respectively. Significantly, a positive correlation of growth and yield parameters with straw yield was noticed. The coefficient of determination for straw yield (Figure 6) with panicle density (0.79), panicle weight (0.68), grains per panicle (0.89), test weight (0.75), dry matter accumulation (0.45), and plant height (0.63) revealed that 79, 68, 89, 75, 45, and 63% difference in straw yield was noted due to panicle density, panicle weight, grains/panicle, test weight, dry matter accumulation, and plant height, respectively. The data demonstrated that grain yield and straw yield had a significant negative correlation with weed population and dry weed biomass. The coefficient of determination (Figure 7) between weed density and grain yield was 0.50 and between weed dry weight and grain yield was 0.44. This means 50% difference in the grain yield may be explained by weed population and 44% by dry weed biomass. The coefficient of determination between weed density and straw yield was 0.53 and between dry weed biomass and straw yield was 0.50 and revealed that 53% variation in straw yield was contributed by weed population and 50% by weed dry weight. It can be concluded that the knowledge of population and weed dry weight is critical for estimating the yield loss in rice and estimation of weed population and weed dry weight is beneficial for predicting the productivity of rice in temperate Kashmir conditions.
Figure 5.

Linear regression line between yield attributes and grain yield.
Figure 6.

Linear regression line between growth and yield characters with straw yield.
Figure 7.

Linear regression line between weed density and weed dry matter with grain and straw yield.
Relative Economics
The data revealed that the highest
net returns and highest benefit cost ratio were realized by a combination
of 10th May (D1) sowing with the sequential application
of BSM + pretilachlor PE fb 2,4-D PoE (D1W5). The lowest net returns and lowest benefit cost ratio
was realized by a combination of 3rd June (D2) sowing with
weedy check (D2W1) treatment (Table 11). The efficiency of a treatment
or a combination of treatments is finally decided in terms of the
economics (benefit/cost) of the treatments. The present investigation
revealed that during the course of investigation across the different
measures, conoweeding (equivalent to weed free) + 10th May (D1) sowing (D1W2) treatment recorded the
highest gross returns (14,1983  ha–1) and net monetary return (85,418
  ha–1) but
lower B/C ratio of (1.07). Sequential application of bensulfuron-methyl
+ pretilachlor (60 and 600 g a.i. ha–1 pre-emergence) fb 2,4-D @ 0.75 kg a.i. ha–1 (post-emergence,
30–35 DAS) with 10th May (D1) sowing (D1W5) provided the gross returns of (131,596
ha–1) but
lower B/C ratio of (1.07). Sequential application of bensulfuron-methyl
+ pretilachlor (60 and 600 g a.i. ha–1 pre-emergence) fb 2,4-D @ 0.75 kg a.i. ha–1 (post-emergence,
30–35 DAS) with 10th May (D1) sowing (D1W5) provided the gross returns of (131,596  ha–1), net
monetary return of (89,391
ha–1), net
monetary return of (89,391 ha–1), and registered the highest B/C
ratio (1.37) across different weed management schedules and sowing
dates closely followed by the application of oxyfluorfen @ 750 g a.i
ha–1 (pre-emergence) fb 2,4-D @
0.75 kg a.i. ha–1 (post-emergence, 30–35
DAS) (D1W6) with a B/C ratio of 1.31. However,
weedy check treatment recorded the lowest benefit cost ratio among
all the weed management practices. Lower grain and straw yields of
rice might have been responsible for the corresponding lower returns and lowest benefit
cost ratio of weedy check treatment (Table 14).
ha–1), and registered the highest B/C
ratio (1.37) across different weed management schedules and sowing
dates closely followed by the application of oxyfluorfen @ 750 g a.i
ha–1 (pre-emergence) fb 2,4-D @
0.75 kg a.i. ha–1 (post-emergence, 30–35
DAS) (D1W6) with a B/C ratio of 1.31. However,
weedy check treatment recorded the lowest benefit cost ratio among
all the weed management practices. Lower grain and straw yields of
rice might have been responsible for the corresponding lower returns and lowest benefit
cost ratio of weedy check treatment (Table 14).
Table 14. Relative Economics ( ha–1) of DSR
under Variable Sowing Dates and Weed Management Practices.
ha–1) of DSR
under Variable Sowing Dates and Weed Management Practices.
| treatment combinations | total cost of cultivation (Rs.) | gross returns from grain yield (Rs.) | gross returns from straw yield (Rs.) | total returns (Rs.) | net returns (Rs.) | B/C ratio |
|---|---|---|---|---|---|---|
| D1W1 | 63,565 | 64393.33 | 22,580 | 86973.33 | 46408.33 | 0.73 |
| D1W2 | 79,565 | 111973.3 | 30,010 | 141983.3 | 85418.33 | 1.07 |
| D1W3 | 64,835 | 97283.33 | 27,300 | 124583.3 | 82748.33 | 1.28 |
| D1W4 | 65,015 | 97023.33 | 26,380 | 123403.3 | 81173.33 | 1.25 |
| D1W5 | 65,060 | 103696.7 | 27,900 | 131596.7 | 89391.67 | 1.37 |
| D1W6 | 65,240 | 100056.7 | 27,820 | 127876.7 | 85276.67 | 1.31 |
| D2W1 | 63,565 | 51826.67 | 18,610 | 70436.67 | 29871.67 | 0.47 |
| D2W2 | 79,565 | 95463.33 | 26,010 | 121473.3 | 64908.33 | 0.82 |
| D2W3 | 64,835 | 83,590 | 24,180 | 107,770 | 65,935 | 1.02 |
| D2W4 | 65,015 | 72236.67 | 23,620 | 95856.67 | 53626.67 | 0.82 |
| D2W5 | 65,060 | 91433.33 | 25,680 | 117113.3 | 74908.33 | 1.15 |
| D2W6 | 65,240 | 83503.33 | 24,640 | 108143.3 | 65543.33 | 1.00 |
Discussion
The distribution of temperature and light resources has a direct impact on rice development, with temperatures being the main environmental component that influences growth. In multi-cropping areas, direct-seeding rice eliminates the need to raise seedlings, and rice is frequently planted after the previous crop has been harvested. The practice shortens the growth period overall, shortens the crucial stages of rice growth (sowing, jointing, heading, and maturity), and also leads to a decreased use of climate resources like temperature and light. Sowing time plays a pivotal role in growth and productivity of a crop.20 The sowing date affects the accumulated temperature of DSR at different phenophases and the appropriate sowing time can make rice use the temperature and light resources effectively and offer full potential yield of DSR. The distribution of temperature and light resources has a direct impact on rice development, with the temperature being the main environmental component that influences growth.20 DSR crop is prone to more weed competition for all the growth factors because both crop and weed seeds emerge almost at the same time. So, weed management is the primary concern in DSR and selection of a particular herbicide for effective weed control plays a key role. Sowing dates and weed management practices had a considerable impact on plant height in DSR. Early sowing resulted in taller plants because of a longer growth cycle and favorable weather, which favored profuse vegetative growth whereas late sowing experienced comparatively lower temperatures during the later growth stages resulting in a lower height of the crop.21,22 At all phenological stages of the crop, weed management strategies had a substantial effect on plant height. Effective weed management through conoweeding (equivalent to weed free) could explain this development with repetitive mechanized weedings at 15, 30, 45, and 60 DAS that helped in keeping the crop free of weeds up to the critical stage of crop-weed interference resulting in efficient nutrient uptake and development of the crop.23 Sequential application of BSM + pretilachlor PE fb 2,4-D PoE resulted in taller plants at different developmental stages when compared to the other weed management strategies due to the relatively superior effect on weed growth, which was suppressed due to enhanced activity of rapid cell division and minimal crop-weed interference.24 Due to a higher weed population, weedy check (control) treatment had the lowest plant height during the crop growing season.
Sowing dates had a substantial impact on the crop’s dry matter production. Longer vegetative phase coupled with favorable weather conditions during the critical growth stages resulted in increased plant height and tiller count, which ultimately increased dry matter accumulation in earlier sowing.25,26 Significantly increased dry matter production in conoweeding treatment (equivalent to weed free) at par with BSM + pretilachlor PE fb 2,4-D PoE during the different crop growth phases over weedy check treatment could possibly be due to increased plant growth due to lower weed competition during the initial stages of crop development, which promotes their ability to access nutrients and light, culminating in efficient photosynthate accumulation.27 The weedy check treatment observed significantly lower dry matter at all pheno-phases of the crops because of the immense competition from the weed population for necessary growth resources.28
The two sowing dates varied significantly with respect to the tiller count at all phenophases. A higher tiller count in earlier sowing was due to a longer vegetative growth period and better environmental conditions experienced at different phenophases of crop. Moreover, the decrease in tillers m–2 in 3rd June sowing during later growth stages might have been due to lower temperatures, which causes tiller mortality.29,30 Conoweeding treatment (equivalent to weed free) and herbicidal treatments allow the crop to reach its maximum potential, resulting in an enhanced tiller count as also reported by ref (31). Weedy check treatment noted significantly lower tiller count throughout the crop growth season due to a higher tiller mortality and inability of the tillers to grow fully because of tough interference from the weeds.32 The reduced crop growth due to weed shading could be due to higher absorption of red light, thus lowering the ratio of red/far red-light ratio, which triggers production of reactive oxygen species causing damage to crop plant cells.33
Yield contributing characters were significantly influenced by sowing dates and weed management practices better yield attributes were obtained because of effective use of light, temperature, nutrients, CO2 and so on., during the sensitive growth phases of crops, such as panicle initiation, flowering, and grain filling periods, which caused less tiller mortality in the earlier sowing dates and ensured efficient plant establishment, effective translocation of photosynthetic assimilates, and helped crops to grow vigorously.33 Due to the delayed sowing, emergence was poor and heading was reduced, resulting in lesser panicle length,34 panicle weight, full grains per panicle, and 1000 grain weight.35−37 In order to maximize the development, yield, and productivity of wet direct-seeded rice (O. sativa L.), it is crucial to choose a suitable sowing date in conjunction with an effective weed management strategy. The vegetative growth time and rice population were reduced by delayed seeding, the number of spikelets and grains decreased as the booting stage was shortened, and postponing the heading date decreased the daily average temperature and effective accumulated temperature at the filling stage, resulting in lower grain filling.38,39 The better utilization of growth resources by the crops due to lower competition from the weed population in the conoweeding treatment (equivalent to weed free) and sequential application of BSM + pretilachlor PE fb 2,4-D PoE resulted in enhanced yield characters; also the absorption and translocation of nutrients in a better way might also have increased the yield attributing characters significantly.40−43 Sowing dates as well as weed management strategies had a considerable impact on grain and straw production. The analysis demonstrated that sowing on 10th May resulted in a considerable increase in grain output over sowing on 3rd June. A higher yield of grain and straw under earlier sown crops can be linked to superior performance of yield contributing characters as a consequence of lower weed interference and optimal input use. It could also be highlighted by the fact that yields in any specific environment is the product of yield components generated at various stages of development and growth.44−46 DSR has a lower production potential primarily because of weed-related issues. Weeds always emerge before crops do under ideal conditions for nutrient availability and moisture, which results in lower yields. Manual and mechanical weed control methods in DSR were successful, but labor shortages during peak season and growing labor costs are delaying and increasing the cost of weed control measures. The rice crop was able to synthesize more chlorophyll due to effective weed control, which improved the accumulation of photosynthates and increased translocation, which increased the number of grains, panicles, and test weight, and ultimately increased rice grain yield. Hand weeding proved to be a more effective weed control method because it produced rice with greater WCE and lower weed density and nutrient depletion than other weed control methods.47,48
Various weed management strategies have a significant impact on a crop’s grain, straw, biological yield, and harvest index. Conoweeding (equivalent to weed free) though at par with sequential application of BSM + pretilachlor PE fb 2,4-D PoE recording increased yield was the result of enhancement in all yield parameters as well as a decrease in crop-weed competition. This improvement in turn can be ascribed to improved growth and development like that of increased total dry matter realization and formation of photosynthates in different productive parts, increasing leaf area of crops. Thus, decreased crop-weed competition resulted in improved growth characteristics and yield attributing characters, shifting the balance in favor of the crop instead of the weeds. Weedy check treatment recorded the lowest grain yield and harvest index, due to tough interference imposed by a variety of weeds that resulted in reduced accumulation of nutrients, leading to an imbalanced source and sink development with low yield attributing characters and a higher weed index.49−51
Significantly less population of weeds and weed dry weight were recorded in earlier sowing over delayed sowing at 30, 45, and 60 DAS and at harvest, which may have occurred due to a relatively favorable environment and weather conditions for attaining optimum germination and early plant establishment with development of more canopy offering stronger smothering potential to crops, resulting in increased weed control, which permitted crops to best use the natural resources in the area with less light transmission ratio at the surface level inhibiting weed seed germination and growth.52,53 Herbicides were not only less hazardous to rice seedlings, but they also effectively reduced weeds. Moreover, the efficacy and long-term effectiveness of applied herbicides that prevented weeds from germinating and resulted in a rapid decline in carbohydrate reserves in weeds that had germinated due to rapid respiration reduced the leaf area and leaf senescence, leading to reduction in the photosynthesis process. The higher weed flora and dry weed biomass under control treatment may be ascribed to favorable levels of soil moisture as well as other environmental conditions, which were fruitful for emergence and growth of weeds, especially in the non-availability of proper weed management strategies.54−57 Lesser weed population and dry weed biomass in earlier sowing lead to a significantly higher weed control efficiency at 30 DAS (68.18%), 45 DAS (65.75%), 60 DAS (60.78%), and at harvest (65.08%) than 3rd June, which recorded weed control efficiency of 62.42% at 30 DAS, 61.14% at 45 DAS, 52.67% at 60 DAS, and 59.89% at harvest. Conoweeding treatment (equivalent to weed free) resulted in significantly higher weed-control efficiency of 100% at 30, 45, and 60 DAS and at harvest and sequential application of BSM + pretilachlor PE fb 2,4-D PoE obtained a higher weed control efficiency at 30 DAS (79.38%), 45 DAS (75.23%), 60 DAS (65.72%), and at harvest (74.97%) than other weed control treatments owing to a decrease in weed population and dry weed biomass due to successful weed management strategies, resulting in increased weed-control efficiency.58,59
Sowing dates as well as weed management strategies resulted in varied nutrient concentrations and uptake by the crop. Yield contributing factors were much better in the earlier sowing, resulting in a greater rice biomass accumulation and thus a higher nutrient uptake.60 The increased uptake of these nutrients in early sown crops was most likely due to better weather conditions, which caused vigorous growth and a better root system that assisted in the sufficient supply of primary nutrients, resulting in increased biological yields and effective transfer to the ultimate sink, the grains, resulting in numerically higher rice grain and straw nutrient content and uptake. Among the weed management strategies, conoweeding treatment (equivalent to weed free) recorded the highest NPK concentration and uptake of grain and straw. Sequential application of BSM + pretilachlor PE fb 2,4-D PoE though at par with oxyfluorfen PE fb 2,4-D PoE exhibited significantly higher NPK concentrations and uptakes of grain and straw. Increased crop NPK uptakes and concentrations in conoweeding and superior herbicides increased weed-control efficiency, favoring crop plant growth and development, presumably due to less interference from weeds, which led to improved crop growth and thus enhanced uptake of nutrients by increasing the leaf area and dry-matter accumulation, which led to the improved yield characteristics and build-up of a higher quantity of nutrients. The application of oxyfluorfen PE as a post-emergence herbicide revealed the lowest uptake of NPK among the herbicidal treatments tested. This is evident by the fact that the field was infested with a complex species of weeds to which herbicide molecules failed to show efficient weed control, and herbicides’ residual effects diminished with the passage of time.61,62
Earlier sowing (10th May) reduced NPK uptake by weeds significantly, while delayed sowing of DSR on 3rd June resulted in a higher NPK uptake by weeds. A higher weed population and dry weed biomass in late sown crops increased the NPK uptake by weeds and lower weed population and dry weed biomass in early sowing resulted in the reduced NPK uptake by weeds.63 NPK uptake by weeds was significantly increased by weedy check treatment in comparison to all the other weed management strategies. High due to different effects of treatments on the density, growth, and dry biomass of weeds, differences in nutrient removal could be one the most noted reasons. The highest NPK removal and uptake by weeds was observed in weedy check treatments due to higher weed populations and weed dry weight. Similarly, the low uptake of NPK by weeds in herbicidal treatments appears to be due to the broad impact of these weed control treatments.59 NPK removal by rice under different sowing dates was maximum on 10th May (300.17 kg ha–1) as compared to 3rd June sowing (240.53 kg ha–1). Weeds compete for NPK uptake as well and revealed a significant total macronutrient intake. Weeds removed a larger percentage of NPK, indicating that they acquired much more macronutrients (Figures 3 and 4). The maximum share of NPK removal of weeds was revealed in delayed sowing, i.e., 3rd June (7.73%) as compared to the earlier 10th May sowing (4.52%). Among weed management strategies, a higher contribution in the removal of NPK by weeds was noted in the control treatment, while the lowest contribution was revealed in the sequential application of BSM + pretilachlor PE fb 2,4-D PoE (4.17%) due to an effective control of weeds.64−68
Conclusions
Suitable sowing time with efficient weed management in DSR is a necessity as it could be the promising establishment method in the present scenario of global water scarcity and increasing labor wages. It was concluded that earlier sowing (10th May) of direct drum seeded rice proved to be more feasible and promising than delayed sowing (3rd June) in terms of production and productivity. Furthermore, among different weed management strategies used, four mechanized conoweedings at 15, 30, 45, and 60 DAS (equivalent to weed free) or sequential application of BSM + pretilachlor PE fb 2,4-D PoE recorded significantly higher results for growth, yield attributing characters, yields, nutrient partitioning, and better weed control. Moreover, further research needed to be done with respect to sowing time and weed management in DSR so that efficient policy making should be in temperate rice ecology as in the future, DSR can completely substitute traditional transplantation in the Kashmir valley due to labor and water scarcity.
Acknowledgments
The authors extend their appreciation to Researchers Supporting project number (RSP2023R298), King Saud University, Riyadh, Saidi Arabia. The authors express the deepest appreciation to the teachers and technical staff of Division of Agronomy; Faculty of Agriculture, Sher-e-Kashmir University of Agricultural Sciences and Technology of Kashmir, Wadura, Sopore-193201, India for providing all the necessary facilities, suggestion, help, cooperation, and praise to complete the research.
Author Contributions
Mohd Salim Mir, Parmeet Singh, and Tauseef A. Bhat wrote original the original manuscript draft preparation. Tauseef A. Bhat, Raihana H. Kanth, Aijaz Nazir, Ibrahim Al-Ashkar, Muhammad Kamran, Adel A. Hadifa, and Ayman El Sabagh wrote and edited the review. All authors have given approval to the final version of the manuscript.
The authors extend their appreciation to Researchers Supporting project number (RSP2023R298), King Saud University, Riyadh, Saidi Arabia.
The authors declare no competing financial interest.
References
- Food and Agriculture Organization . 2019. Available online. http://www.fao.org/faostat/en/#data/QC/visualize (accessed Jan 1, 2019).
- DES. Directorate of Economics and Statistics, Ministry of Agriculture, 2018. Available online. http://eands.dancet.nic.in (accessed March, 2018).
- Chakraborty D.; Ladha J. K.; Rana D. S.; Jat M. L.; Gathala M. K.; Yadav S.; Rao A. N.; Ramesha M. S.; Raman A. A global analysis of alternative tillage and crop establishment practices for economically and environmentally efficient rice production. Sci. Rep. 2017, 7, 9342. 10.1038/s41598-017-09742-9. [DOI] [PMC free article] [PubMed] [Google Scholar]
- Kumar V.; Ladha J. K. Direct seeded rice: Recent development & future research needs. Adv. Agron. 2011, 111, 297–413. 10.1016/B978-0-12-387689-8.00001-1. [DOI] [Google Scholar]
- Pathak H.; Tewari A. N.; Sankhyan S.; Dubey D. S.; Mina U.; Singh V. K.; Jain N.; Bhatia A. Direct-seeded rice: Potential, performance and problems—A review. Curr. Adv. Agric. Sci. 2011, 3, 77–88. [Google Scholar]
- Farooq M.; Siddique K. H. M.; Rehman H. M. U.; Aziz T.; Lee D.; Wahid A. Rice direct seeding: Experiences, challenges and opportunities. Soil Tillage Res. 2011, 111, 87–98. 10.1016/j.still.2010.10.008. [DOI] [Google Scholar]
- Ladha J. K.; Kumar V.; Alam M. M.; Sharma S.; Gathala M. K.; Chandna P.. Integrating crop and resource management for enhanced productivity, profitability, and sustainability of the rice-wheat system in South Asia. Integrated Crop and Resource Management in the Rice-Wheat System of South Asia; International Rice Research Institute: Los Baños, Philippines, 2009; pp 69–108. [Google Scholar]
- Sidhu A. S.; Kooner R.; Verma A. On-farm assessment of direct-seeded rice production system under central Punjab conditions. J. Crop Weed 2014, 10, 56–60. [Google Scholar]
- Shekhawat K.; Rathore S. S.; Chauhan B. S. Weed Management in Dry Direct-Seeded Rice: A Review on Challenges and Opportunities for Sustainable Rice Production. Agronomy 2022, 10, 1264. 10.3390/agronomy10091264. [DOI] [Google Scholar]
- Chauhan B. S.; Johnson D. E. Row spacing and weed control timing affect yield of aerobic rice. Field Crop. Res. 2011, 121, 226–231. 10.1016/j.fcr.2010.12.008. [DOI] [Google Scholar]
- Gharde Y.; Singh P.; Dubey R.; Gupta P. Assessment of yield and economic losses in agriculture due to weeds in India. Crop Prot. 2018, 107, 12–18. 10.1016/j.cropro.2018.01.007. [DOI] [Google Scholar]
- Warade A. D.; Gonge V. S.; Jog Dande N. D.; Ingole P. G.; Karunakar A. P. Integrated weed management in onion. Indian J. Weed Sci. 2006, 38, 92–95. [Google Scholar]
- Narayana A. L.; Veerbadram V.; Poonguzhalan R. Performance of low doses high efficacy herbicides for weed control in transplanted rice. Oryza 1999, 36, 290–292. [Google Scholar]
- Rao A. S.; Singh R. P. Effect of herbicide mixtures and sequential application on weed control in transplanted rice (Oryza sativa). Indian J. Agron. 1997, 42, 77–81. [Google Scholar]
- Jabran K.; Husain E. M.; Hussain M.; Farooq M.; Babar M.; Doğan M. N.; Lee D. J. Application of bispyribac-sodium provides effective weed control in direct-planted rice on a sandy loam soil. Weed Biol. Manage. 2012, 12, 136–145. 10.1111/j.1445-6664.2012.00446.x. [DOI] [Google Scholar]
- Khaliq A.; Matloob A. I.; Abbas M. Z.; Zubair R. N.; Rasul F. Supplementing herbicides with manual weeding improves weed control efficiency, growth and yield of direct seeded rice. Int. J. Agric. Biol. 2013, 15, 191–199. [Google Scholar]
- Kotresh D.; Radhamani S.; Murali P. A.; Ravichandran V.; Bharathi C.; Sangothari A. Effect of Integrated Weed Management Practices on Weed Parameters in Direct Seeded Aerobic Rice. Biol. Forum 2022, 14, 539–544. [Google Scholar]
- Xu L.; Li X.; Wang X.; Xiong D.; Wang F. Comparing the Grain Yields of Direct-Seeded and Transplanted Rice: A Meta-Analysis. Agronomy 2019, 9, 767. 10.3390/agronomy9110767. [DOI] [Google Scholar]
- Liu H.; Hussain S.; Zheng M.; Peng S.; Huang J.; Cui K.; Nie L. Dry direct-seeded rice as an alternative to transplanted-flooded rice in Central China. Agron. Sustainable Dev. 2014, 35, 285–294. 10.1007/s13593-014-0239-0. [DOI] [Google Scholar]
- Jia Y.; Liu H.; Mei Y.; Wang H.; Zou D.; Wang J.; Zheng H.; Wang J.; Zhang H.; Zhao H. Analysis of Gaps Yield and Resource use Efficiency of Cold-Region Japonica Rice. Int. J. Plant Prod. 2022, 17, 17–33. 10.1007/s42106-022-00225-0. [DOI] [Google Scholar]
- Chandini; Sen A.; Srivastava V. K.; Sankar A.; Sahoo M. Effect of planting dates on dry weight, flowering and yield of different rice varieties. J. Pharmacogn. Phytochem. 2020, 9, 1394–1397. [Google Scholar]
- Zhang L.; Shen C.; Zhu S.; Ren N.; Chen K.; Xu J. Effects of sowing dates and nitrogen application rate on grain yield, nitrogen use efficiency and 2-Acetyl-1-Pyrroline formation in fragrant rice. Agron 2022, 12, 3035. 10.3390/agronomy12123035. [DOI] [Google Scholar]
- Dangol R.; Pandey S. R.; Shrestha B.; Thapa Magar D. B.; Bhattarai N. Effects of different weed management practices on growth and yield of direct seeded spring rice in Jhapa, Nepal. Cogent food agric. 2020, 6, 1825040. 10.1080/23311932.2020.1825040. [DOI] [Google Scholar]
- Kumar R.; Singh A. K.; Shanker R.; Singh A. K.; Bhushan S.; Kumawat N.; Singh N. K.; Singh A. K. Effect of weed management practices on crop productivity and economics in dry-direct seeded rice under hill and plateau region of Eastern India. J. AgriSearch 2022, 9, 12–15. 10.21921/jas.v9i01.9886. [DOI] [Google Scholar]
- Naz S.; Nandan R.; Roy D. K. Effect of crop establishment methods and weed management practices on productivity , economics and nutrient uptake in direct seeded rice (Oryza sativa L.). Int. J. Curr. Microbiol. Appl. Sci. 2020, 9, 3002–3009. 10.20546/ijcmas.2020.902.344. [DOI] [Google Scholar]
- Cm S.; Ym R.; Krishnamurthy D.; Mr U.; Bhanuvally M. Growth and yield response of direct seeded rice (Oryza sativa L.) to dates of sowing and varieties. Int. J. Chem. Stud. 2020, 8, 295–299. 10.22271/chemi.2020.v8.i4e.9704. [DOI] [Google Scholar]
- Sen S.; Kaur R.; Das T. K. Weed management in dry direct-seeded rice: Assessing the impacts on weeds and crop. Indian J. Weed Sci. 2020, 52, 169–174. 10.5958/0974-8164.2020.00030.1. [DOI] [Google Scholar]
- Singh A.; Singh R. S.; Kumar M.; Pandey V. K.; Singh V.; Shahi A. K. S. Effect of weed management practices on weed flora, growth and yield of direct seeded rice (Oryza sativa L.). J. Pharmacogn. Phytochem. 2021, 10, 138–142. [Google Scholar]
- Toppo O.; Kewat M. L. Impact of sowing time and weed management practices on yield of direct seeded rice. Pharma Innovation 2023, 12, 3475–3478. [Google Scholar]
- Mrudhula K. A.; Rama R. C. V. Effect of sowing window on growth parameters and yield of different rice varieties in Krishna Western delta. J. Pharmacogn. Phytochem. 2020, 9, 1081–1085. [Google Scholar]
- Akbar N.; Iqbal A.; Khan H. Z.; Hanif M. K.; Bashir M. U. Effect of different sowing dates on the yield and yield components of direct seeded fine rice (Oryza sativa L.). J. Plant Breed. Crop Sci. 2010, 2, 312–315. [Google Scholar]
- Sanjoy S. Efficacy of Bensulfuron-methyl for controlling sedges and non-grassy weeds in transplanted rice (Oryza sativa L). Indian J. Agric. Sci. 2009, 79, 313–316. [Google Scholar]
- Verma B.; Bhan M.; Jha A. K.; Khatoon S.; Ranghuwanshi M.; Bhayal L. Weeds of direct seeded rice influenced by herbicide mixture. Pharm. Innov. 2022, 11, 1080–1082. [Google Scholar]
- Huber M.; Nieuwendijk N. M.; Pantazopoulou C. K.; Pierik R. Light signaling shapes plant-plant interactions in dense canopies. Plant, Cell Environ. 2021, 44, 1014–1029. 10.1111/pce.13912. [DOI] [PMC free article] [PubMed] [Google Scholar]
- Khalifa A. A. B. A. Physiological evaluation of some hybrid rice varieties under different sowing dates. Aust. J. Crop Sci. 2009, 3, 178–183. [Google Scholar]
- Hayat K.; Awan I. U.; Hassan G. Impact of seeding dates and varieties on weed infestation yield and yield components of rice under direct wet seeded culture. Pak. J. Weed Sci. Res. 2007, 102, 9–21. [Google Scholar]
- Shah M. L.; Bhurer K. P. Response of wet seeded rice varieties to sowing dates. Nepal Agric. Res. J. 2005, 6, 39–48. 10.3126/narj.v6i0.3342. [DOI] [Google Scholar]
- Zheng E.; Qin M.; Chen P.; Xu T.; Zhang Z. Climate Change Affects the Utilization of Light and Heat Resources in Paddy Field on the Songnen Plain. China Agric. 2022, 12, 1648. 10.3390/agriculture12101648. [DOI] [Google Scholar]
- Gholami Golafshan M.; Madani H.; Heydari Sharifabadi H.; Nourmohammadi Q.; Yasari E. The effect of growth compounds with different doses on physiological characteristics of rice in the treasury. Model. Earth Syst. Environ. 2022, 8, 5521–5534. 10.1007/s40808-022-01391-w. [DOI] [Google Scholar]
- Nargave G.; Sharma P. B.; Sahu R. P.; Singh V.; Patel R. Influence of varying environment on rice varieties under upland condition of Madhya Pradesh, India. Int. J. Curr. Microbiol. Appl. Sci. 2020, 9, 1317–1323. 10.20546/ijcmas.2020.908.149. [DOI] [Google Scholar]
- Singh G.; Kumar S.; Kaur P.; Singh R.; Kaur M.; Kaur C. Response of nitrogen scheduling and weed management on weed and growth attributes of direct seeded rice in Central Punjab. Int. Arch. App. Sci. Tech. 2020, 11, 19–25. 10.15515/iaast.0976-4828. [DOI] [Google Scholar]
- Goswami G.; Singh Y.; Raghuveer M.; Maurya A. V. Effect of agronomic and weed management practices on crop growth of direct seeded rice under agroclimatic condition of Eastern Uttar Pradesh. J. Cereal Res. 2022, 14, 339–342. 10.25174/2582-2675/2022/131254. [DOI] [Google Scholar]
- Kachroo D.; Bazaya B. R. Efficacy of different herbicides on growth and yield of direct wet seeded rice sown through drum seeder. Indian J. Weed Sci. 2011, 43, 67. [Google Scholar]
- Netam C. R.; Singh R.; Thakur A. K.; Netam A. K. Effect of crop establishment methods and productivity of rice (Oryza sativa). Indian J. Agron. 2016, 61, 326–330. [Google Scholar]
- Satapathy B. S.; Duary B.; Saha S.; Munda S.; Chatterjee D. Impact of sowing methods and weed control practices on yield and economics of wet direct seeded rice. Oryza 2021, 58, 375–383. 10.35709/ory.2021.58.3.4. [DOI] [Google Scholar]
- Sreenivas G.; Reddy M. D.; Reddy D. R. Performance of aerobic rice as influenced by different dates of sowing and varieties, dry matter production, yield and water productivity. J. Agrometeorol. 2007, 9, 180. 10.54386/jam.v9i2.1126. [DOI] [Google Scholar]
- Santiago-Arenas R.; Soe H. N.; Ullah H.; Agarwal A.; Datta A. Optimum Sowing Date and Nitrogen Rate Ensure Sustainable Production of Wet Direct-Seeded Rice under Water-saving Irrigation Technique. J. Soil Sci. Plant Nutr. 2022, 22, 2805–2820. 10.1007/s42729-022-00847-3. [DOI] [Google Scholar]
- Zhang R.-P.; Zhou N.-N.; Ashen R.-G.; Zhou L.; Feng T.-Y.; Zhang K.-Y.; Liao X.-H.; Aer L.-S.; Shu J.-C.; He X.-W.; Gao F.; Ma P. Effect of Sowing Date on the Growth Characteristics and Yield of Growth-Constrained Direct-Seeding Rice. Plants 2023, 12, 1899. 10.3390/plants12091899. [DOI] [PMC free article] [PubMed] [Google Scholar]
- Bashir M. U.; Akbar N.; Iqbal A.; Zaman H. Effect of different sowing dates on yield and yield components of direct seeded coarse rice (Oryza sativa L). Pakistan J. Agric. Sci. 2010, 47, 361–365. [Google Scholar]
- Saini J. P. Efficacy of cyhalofop-butyl alone and in combination with 2,4-D against mixed weed flora in direct-seeded upland rice. Indian J. Agron. 2005, 50, 38–40. [Google Scholar]
- Saha S.; Rao K. S. Evaluation of Bensulfuron-methyl for weed control in wet direct-sown summer rice. Oryza 2010, 47, 38–41. [Google Scholar]
- Rawat A.; Chaudhary C. S.; Upadhyaya V. B.; Jain V. Effect of bispyribac sodium on weed flora and yield of drilled rice. Indian J. Weed Sci. 2012, 44, 183–185. [Google Scholar]
- Chaudhary A.; Venkatramanan V.; Kumar Mishra A.; Sharma S. Agronomic and environmental determinants of direct seeded rice in South Asia. Circ. Econ. Sustainability 2023, 3, 253–290. 10.1007/s43615-022-00173-x. [DOI] [PMC free article] [PubMed] [Google Scholar]
- Chalka K. S.; Sinha J. S. Problems, prospects and new approaches in weed management. Pestic. Inf. 2013, 21, 7–19. [Google Scholar]
- Shekhawat K.; Rathore S. S.; Chauhan B. S. Weed management in dry direct-seeded rice: A review on challenges and opportunities for sustainable rice production. Agron 2020, 10, 1264. 10.3390/agronomy10091264. [DOI] [Google Scholar]
- Jannu N.; Narender G. Weed management in direct seeded rice in Indian perspective: A review. Pharma Innov. 2023, 12, 2522–2532. [Google Scholar]
- Walia U. S.; Bhullar M. S.; Nayyar S.; Sindhu V. Role of seed rate and herbicide on the growth and development of direct dry-seeded rice. Indian J. Weed Sci. 2009, 41, 33–36. [Google Scholar]
- Chauhan B. S.; Ahmed S.; Awan T. H.; Jabran K.; Manalil S. Integrated weed management approach to improve weed control efficiencies for sustainable rice production in dry-seeded systems. Crop Prot. 2015, 71, 19–24. 10.1016/j.cropro.2015.01.012. [DOI] [Google Scholar]
- Singh M.; Singh R. P. Influence of crop establishment method and weed management practices on yield and economics of direct-seeded rice (Oryza sativa). Indian J. Agron. 2010, 55, 224–229. [Google Scholar]
- Kashid N. V.; Barhate K. K.; Bodake P. S. Management of weeds in direct seeded rice. Indian J. Weed Sci. 2015, 47, 110–112. [Google Scholar]
- Kumar J.; Singh D.; Puniya R.; Pandey P. C. Effect of weed management practices on nutrient uptake by direct seeded rice. Oryza 2010, 47, 291–294. [Google Scholar]
- Jeet S.; Tabassum S.; Kumar R.; Dev C. M. Yield and economics of aerobic direct seeded upland rice as affected by different weed control measures under rice-wheat system. J. Crop. Weed 2020, 16, 83–93. 10.22271/09746315.2020.v16.i1.1277. [DOI] [Google Scholar]
- Bali A. S.; Singh M.; Kachroo D.; Sharma B. C.; Shivran D. R. Efficacy of herbicides in transplanted, medium duration rice (Oryza sativa) under subtropical conditions of Jammu. Indian J. Agron. 2006, 51, 128–130. [Google Scholar]
- Sharma N.Influence of Multiple Herbicidal Interventions and Time of Planting of Direct Seeded Basmati Rice (Oryza sativa L.) and Wheat (Triticum aestivum L.) in Rice-Wheat Cropping System. Ph.D. Thesis, Sher-e-Kashmir University of Agricultural Sciences and Technology of Jammu, Chatha, 2015, pp 1–166. [Google Scholar]
- Kumar A.; Vivek R.; Ghasal P.; Chaudhary K.; Singh V.; Kumar S. Effect of pyrazosulfuron and azimsulfuron in combination with other herbicides on weeds species, growth and yield of transplanted rice in typic ustochrept soil. J. Pharmacogn. Phytochem. 2017, 6, 1550–1556. [Google Scholar]
- Nazir A.; Bhat M. A.; Bhat T. A.; Fayaz S.; Mir M. S.; Basu U.; Ahanger S. A.; Altaf S.; Jan B.; Lone B. A.; et al. Comparative Analysis of Rice and Weeds and Their Nutrient Partitioning under Various Establishment Methods and Weed Management Practices in Temperate Environment. Agronomy 2022, 12, 816. 10.3390/agronomy12040816. [DOI] [Google Scholar]
- Nazir A.; Bhat M. A.; Bhat T. A.; Rashid Z.; Rehana M.; Fayaz S.; Wani S. A. Crop establishment and weed management effect on weed parameters and rice yield under temperate zone of Kashmir. Indian J. Weed Sci. 2020, 52, 217–221. 10.5958/0974-8164.2020.00041.6. [DOI] [Google Scholar]
- Nazir A.; Bhat M. A.; Bhat T. A.; Bhat S. F.; Qayoom S.; Hussain A.; Lone B. A.; Jan B.; Dar S. A.; John J. Impact of crop establishment techniques and weed management practices on Oryza sativa L. growth and yield. Agron. J. 2023, 10.1002/agj2.21363. [DOI] [Google Scholar]