

Abstract
BACKGROUND:
Direct oral anticoagulants (DOACs) have become widely used for the prevention of stroke in nonvalvular atrial fibrillation (AF) and for the treatment of venous thromboembolism (VTE). Warfarin, the standard of care prior to DOACs, requires monitoring and dose adjustment to ensure patients remain appropriately anticoagulated. DOACs do not require monitoring but are significantly more expensive. We sought to examine real-world effectiveness and costs of DOACs and warfarin in patients with AF and VTE.
OBJECTIVE:
To examine clinical and economic outcomes. The clinical objectives were to determine the bleeding and thrombotic event rates associated with DOACs vs warfarin. The economic objectives were to determine the cost associated with these events, as well as the all-cause medical and pharmacy costs associated with DOACs vs warfarin.
METHODS:
This analysis was an observational, propensity-matched comparison of retrospective medical and pharmacy claims data for members enrolled in an integrated health plan between October 1, 2015, and September 30, 2020. Members who were older than 18 years of age with at least 1 30-day supply of warfarin or a DOAC filled within 30 days of a new diagnosis of VTE or nonvalvular AF were eligible for the analysis. Cox hazard ratios were used to compare differences in clinical outcomes, where paired t-tests were used to evaluate economic outcomes.
RESULTS:
After matching, there were 893 patients in each group. Among matched members, warfarin was associated with increased risk of nonmajor bleeds relative to apixaban (hazard ratio [HR] = 1.526; P = 0.0048) and increased risk of pulmonary embolism relative to both DOACs (apixaban: HR = 1.941 [P = 0.0328]; rivaroxaban: HR = 1.833 [P = 0.0489]). No statistically significant difference was observed in hospitalizations or in length of stay between warfarin and either DOAC. The difference-in-difference (DID) in total costs of care per member per month for apixaban and rivaroxaban relative to warfarin were $801.64 (P = 0.0178) and $534.23 (P = 0.0998) more, respectively. DID in VTE-related cost for apixaban was $177.09 less, relative to warfarin (P = 0.0098). DID in all-cause pharmacy costs for apixaban and rivaroxaban relative to warfarin were $342.47 (P < 0.0001) and $386.42 (P < 0.001) more, respectively.
CONCLUSIONS:
Warfarin use was associated with a significant decrease in total cost of care despite a significant increase in VTE-related costs vs apixaban. Warfarin was also associated with a significant increase in other nonmajor bleeds relative to apixaban, as well as a significant increase in pulmonary embolism relative to both DOACs. Warfarin was associated with a significant reduction in all-cause pharmacy cost compared with either DOAC.
Plain language summary
Anticoagulants are medicines used to treat or prevent blood clots. The oldest and cheapest anticoagulant is warfarin. Warfarin works well but requires regular blood work. Newer anticoagulants do not require blood work to be done but are much more expensive. This study shows that warfarin had the lowest total cost of all the anticoagulants. However, it may be more likely to cause bleeding and less effective at preventing lung blood clots than more expensive options.
Implications for managed care pharmacy
This study compares the clinical and economic outcomes associated with direct oral anticoagulants (DOACs) vs warfarin in a real-world patient population of matched members of an integrated health plan. This study indicates that despite being associated with increased risk of treatment complications, warfarin use had a lower overall cost of care than 2 of the most used DOACs. Therefore, managed care organizations should consider the overall cost of DOACs relative to warfarin when determining formulary placement.
Atrial fibrillation (AF) is a common cardiac rhythm disturbance that increases in prevalence with advancing age. Hemodynamic abnormalities and thromboembolic events related to AF result in significant morbidity and mortality. Of thrombotic events, strokes are a feared complication of AF, accounting for more than 15% of all strokes in the United States, and a leading cause of death in patients with AF.1,2 Because of these severe complications, it is estimated that treating patients with AF costs up to $26 billion annually in the United States.3
Venous thromboembolism (VTE) is a condition in which a thrombus forms most often in the deep veins of the leg, groin, or arm (known as deep vein thrombosis [DVT]). If dislodged into circulation, these thrombi can result in more severe complications, such as pulmonary embolism (PE) or ischemic stroke. In the United States, there are 100,000-300,000 VTE-related deaths every year. In addition to disease burden, VTE causes significant economic burden.4 Associated diagnostic testing and treatment, prolonged hospital admissions, follow-up care, and recurrent VTE can be extremely costly. In the United States, diagnosis and treatment of VTE costs approximately $15.5 billion per year.5
Prior to the introduction of direct oral anticoagulants (DOACs) (eg, dabigatran, rivaroxaban, apixaban, and edoxaban), warfarin was the standard of care for thrombosis prevention in AF and for the long-term treatment of VTE. Although clinically effective when therapeutic levels are maintained, warfarin has a narrow therapeutic index and requires frequent monitoring and dose adjustment to ensure patients remain appropriately anticoagulated. Conversely, DOACs do not require monitoring but are significantly more expensive. The clinical efficacy and safety of DOACs were demonstrated by numerous landmark trials, including AMPLIFY, ARISTOTLE, EINSTEIN, and ROCKET-AF.6,7,8,9 These studies showed that their respective DOACs were either superior or noninferior to warfarin for the treatment and prevention of systemic embolism and prevention of stroke; additionally, they have similar or lower bleeding risks. As a result, the American College of Chest Physicians guidelines recommends anticoagulation therapy with DOACs over warfarin for both AF and VTE in most patients.10 Randomized controlled trials (RCTs) on the use of DOACs for treatment of AF and VTE are abundant, and there is a growing body of evidence in real-world populations.11,12,13,14 This study aims to provide additional real-world clinical and economic data to support existing literature.
Guo and colleagues recently compared the clinical and economic outcomes associated with warfarin vs those associated with apixaban in the treatment of patients with VTE in a large US commercial claims database. The study reported that warfarin was associated with higher risks of bleeding and thrombosis, as well as higher all-cause medical costs, compared with apixaban.15 These results are similar to those of other real-world studies that have compared apixaban and warfarin in the treatment of AF.11,12 Lopes et al examined the clinical and economic outcomes among nonvalvular AF patients with coronary artery disease and/or peripheral artery disease. This study found that warfarin and rivaroxaban were associated with increased VTE risk and major bleeding risk, as well as increased bleeding/VTE costs and total health care costs, compared with apixaban.11 These results are also corroborated by Amin et al who produced the same conclusions in their study of hospitalization and health care costs among patients with nonvalvular AF prescribed oral anticoagulants in the US Medicare population.12 Studies comparing rivaroxaban and warfarin have produced mixed results.13,14 For example, Peterson et al examined the comparative effectiveness and costs of rivaroxaban and warfarin among morbidly obese patients with AF and found that patients treated with rivaroxaban had a risk of VTE and major bleeding comparable to those treated with warfarin but lower health care resource utilization and costs.13 These conclusions were replicated by these authors in a similar study analyzing the same outcomes in patients with morbid obesity being treated for VTE with rivaroxaban or warfarin.14 By using similar criteria outlined in the Guo et al study, this study expands on their findings by investigating the clinical and economic outcomes of warfarin vs the 2 most commonly used DOACs (apixaban and rivaroxaban) in the treatment of VTE and AF in commercial, Medicare, and Medicaid members of a large managed care organization.
Methods
This study was performed at an integrated health plan, with members located in Pennsylvania, New York, West Virginia, and Maryland. At the time of this study, the integrated health plan covered approximately 1.5 million members with medical and pharmacy benefits. A retrospective review of pharmacy and medical claims between October 1, 2015, and September 30, 2020, was performed to include members from all lines of business (commercial, Medicare, and Medicaid) with a new diagnosis of VTE or AF who were initiated on DOAC or warfarin therapy within 1 month of diagnosis.
The 6-month period before the first AF/VTE encounter was defined as the baseline period. The first AF/VTE encounter was designated the index encounter, and the first warfarin/DOAC fill was designated the index date. Patients were followed through the earliest of the following: end of the subsequent 6-month period, health plan disenrollment, index therapy discontinuation, switch to non-index oral anticoagulant (OAC)/parenteral anticoagulant treatment, or study end (Figure 1). The UPMC Quality Review Committee approved this project as a quality improvement project.
FIGURE 1.

Patient Selection
Study populations were matched by important clinical and economic characteristics (Table 1). Matched clinical outcomes were reported as the incidence rates in the follow-up period and hazard ratios (HRs) were calculated relative to each DOAC (Figure 2). Adherence and time to first fill was also assessed for each of the treatment groups. Matched economic outcomes were reported as the difference between the follow-up per member per month (PMPM) costs and the baseline PMPM costs (Table 2). The difference between the follow-up PMPM costs and the baseline PMPM costs for each DOAC were compared with that of warfarin to determine significance via a difference-in-difference (DID) analysis.
TABLE 1.
Direct Oral Anticoagulant: Warfarin Matching
| Warfarin to apixaban matching | |||||||||||
|---|---|---|---|---|---|---|---|---|---|---|---|
| Demographics/characteristics | Warfarin (n = 893) | All apixaban (n = 4,539) | Matched apixaban (n = 893) | Difference average before matching (P value) | Difference average after matching (P value) | ||||||
| Propensity score | 0.3088 | 0.1360 | 0.2982 | 1.0812 (< 0.0001) | 0.0665 (0.6076) | ||||||
| Male sex, % | 48.15 | 48.82 | 47.26 | −0.0134 (0.7417) | 0.0179 (0.7402) | ||||||
| Average age, years | 61.95 | 66.28 | 61.99 | −0.2837 (< 0.0001) | −0.0028 (0.7439) | ||||||
| Age-adjusted CCI score | 5.75 | 5.41 | 5.75 | 0.0940 (0.0411) | 0.0015 (0.7432) | ||||||
| CCI score | 3.87 | 3.16 | 3.83 | 0.2420 (< 0.0001) | 0.0140 (0.2514) | ||||||
| Commercial, % | 30.12 | 28.62 | 29.45 | 0.0330 (0.3742) | 0.0147 (0.7959) | ||||||
| Medicaid, % | 20.83 | 15.22 | 20.83 | 0.1461 (0.0001) | 0.0000 (1.0000) | ||||||
| Medicare, % | 40.31 | 46.82 | 41.21 | −0.1314 (0.0004) | −0.0181 (0.7361) | ||||||
| Special needs plans, % | 8.73 | 9.34 | 8.51 | −0.0212 (0.6132) | 0.0078 (0.9328) | ||||||
| CHC aligned, % | 2.46 | 4.65 | 1.57 | −0.1182 (0.0027) | 0.0484 (0.2382) | ||||||
| Index event and admission setting, % | |||||||||||
| AF | 34.49 | 63.85 | 34.83 | −0.6141 (< 0.0001) | −0.0070 (0.9208) | ||||||
| PE | 43.45 | 23.18 | 43.45 | 0.4402 (< 0.0001) | 0.0000 (1.0000) | ||||||
| VTE | 46.47 | 23.40 | 45.58 | 0.4986 (< 0.0001) | 0.0194 (0.7397) | ||||||
| Emergency department | 5.15 | 16.70 | 5.26 | −0.3766 (< 0.0001) | −0.0037 (1.0000) | ||||||
| Inpatient | 84.21 | 61.82 | 84.66 | 0.5211 (< 0.0001) | −0.0104 (0.8448) | ||||||
| Observation | 3.25 | 16.61 | 2.91 | −0.4584 (< 0.0001) | 0.0115 (0.7844) | ||||||
| Comorbidities, % | |||||||||||
| Anemia | 16.80 | 13.24 | 17.47 | 0.0996 (0.0058) | −0.0188 (0.7536) | ||||||
| History of bleed | 8.06 | 9.03 | 7.95 | −0.0347 (0.3681) | 0.0040 (1.0000) | ||||||
| Dyspepsia | 2.02 | 2.58 | 2.02 | −0.0375 (0.4096) | 0.0000 (1.0000) | ||||||
| Peptic ulcer | 1.23 | 1.04 | 0.90 | 0.0185 (0.5931) | 0.0317 (0.6458) | ||||||
| Peripheral vascular disease | 9.07 | 8.88 | 7.73 | 0.0067 (0.8472) | 0.0470 (0.3481) | ||||||
| Sleep apnea | 10.97 | 10.66 | 11.53 | 0.0100 (0.7675) | −0.0180 (0.7646) | ||||||
| Thrombophilia | 1.01 | 0.37 | 0.56 | 0.0765 (0.0279) | 0.0541 (0.4221) | ||||||
| Fracture | 1.01 | 0.82 | 0.56 | 0.0203 (0.5493) | 0.0471 (0.4221) | ||||||
| Pneumonia | 6.05 | 6.19 | 6.27 | −0.0060 (0.9394) | −0.0093 (0.9216) | ||||||
| Coronary artery disease | 29.45 | 26.99 | 29.23 | 0.0547 (0.1395) | 0.0050 (0.9586) | ||||||
| Cerebrovascular disease | 16.24 | 14.83 | 15.90 | 0.0389 (0.2826) | 0.0093 (0.8975) | ||||||
| Congestive heart failure | 18.59 | 18.55 | 18.25 | 0.0010 (1.0000) | 0.0086 (0.9029) | ||||||
| COPD | 19.37 | 19.54 | 19.71 | −0.0043 (0.9265) | −0.0085 (0.9050) | ||||||
| Diabetes | 33.26 | 28.55 | 34.60 | 0.1019 (0.0055) | −0.0291 (0.5825) | ||||||
| Hyperlipidemia | 52.07 | 58.18 | 52.18 | −0.1231 (0.0009) | −0.0023 (1.0000) | ||||||
| Hypertension | 69.09 | 71.76 | 70.66 | −0.0584 (0.1144) | −0.0344 (0.5026) | ||||||
| Liver disease | 5.04 | 4.74 | 4.48 | 0.0140 (0.6689) | 0.0260 (0.6569) | ||||||
| Morbid obesity | 17.69 | 10.29 | 19.26 | 0.2146 (< 0.0001) | −0.0454 (0.4280) | ||||||
| Renal disease | 18.81 | 12.78 | 17.92 | 0.1660 (< 0.0001) | 0.0246 (0.6689) | ||||||
| Selected surgery | 10.30 | 5.82 | 11.09 | 0.1653 (0.0000) | −0.0289 (0.6460) | ||||||
| Warfarin to apixaban matching | |||||||||||
| Demographic/characteristic | Warfarin (n = 893) | All apixaban (n = 4,539) | Matched apixaban (n = 893) | Difference average before matching (P value) | Difference average after matching (P value) | ||||||
| Baseline medication use, % | |||||||||||
| Antiarrhythmic | 0.67 | 0.48 | 0.56 | 0.0247 (0.4453) | 0.0148 (1.0000) | ||||||
| Antiplatelet | 3.47 | 5.31 | 3.92 | −0.0898 (0.0230) | −0.0219 (0.7070) | ||||||
| β-Blocker | 21.16 | 21.55 | 21.72 | −0.0093 (0.8237) | −0.0137 (0.8176) | ||||||
| Calcium channel blocker | 11.53 | 14.10 | 11.53 | −0.0768 (0.0429) | 0.0000 (1.0000) | ||||||
| Gastroprotective agent | 13.66 | 15.53 | 14.56 | −0.0530 (0.1688) | −0.0254 (0.6343) | ||||||
| Hormone therapy | 0.67 | 0.59 | 0.90 | 0.0097 (0.8129) | −0.0282 (0.7897) | ||||||
| NSAIDs | 3.36 | 4.69 | 3.14 | −0.0678 (0.0918) | 0.0114 (0.8939) | ||||||
| SERMs | 0.11 | 0.04 | 0.11 | 0.0243 (0.4166) | 0.0000 (1.0000) | ||||||
| Statins | 20.16 | 25.89 | 20.94 | −0.1364 (0.0003) | −0.0187 (0.7253) | ||||||
| Warfarin to rivaroxaban matching | |||||||||||
| Demographic/characteristic | Warfarin (n = 893) | All rivaroxaban (n = 2,999) | Matched rivaroxaban (n = 893) | Difference average before matching (P value) | Difference average after matching (P value) | ||||||
| Propensity score | 0.3973 | 0.1795 | 0.3648 | 1.1624 (< 0.0001) | 0.1736 (0.0201) | ||||||
| Male sex, % | 48.15 | 51.08 | 47.14 | −0.0586 (0.1274) | 0.0202 (0.7047) | ||||||
| Average age, years | 61.95 | 57.97 | 62.30 | 0.2530 (< 0.0001) | −0.0224 (0.3685) | ||||||
| Age-adjusted CCI score | 5.75 | 3.80 | 5.84 | 0.5551 (< 0.0001) | −0.0255 (0.5462) | ||||||
| CCI score | 3.87 | 2.25 | 3.90 | 0.5711 (< 0.0001) | −0.0087 (0.9032) | ||||||
| Commercial, % | 30.12 | 39.55 | 29.23 | −0.1987 (< 0.0001) | 0.0189 (0.7169) | ||||||
| Medicaid, % | 20.83 | 25.71 | 21.28 | −0.1156 (0.0030) | −0.0106 (0.8618) | ||||||
| Medicare, % | 40.31 | 28.34 | 41.21 | 0.2541 (< 0.0001) | −0.0190 (0.7361) | ||||||
| Special needs plans, % | 8.73 | 6.40 | 8.29 | 0.0882 (0.0198) | 0.0169 (0.7993) | ||||||
| CHC aligned, % | 2.46 | 2.47 | 2.35 | −0.0003 (1.0000) | 0.0072 (1.0000) | ||||||
| Index event and admission setting, % | |||||||||||
| AF | 34.49 | 31.78 | 35.39 | 0.0576 (0.1319) | −0.0190 (0.7283) | ||||||
| PE | 43.45 | 35.08 | 44.34 | 0.1720 (< 0.0001) | −0.0184 (0.7386) | ||||||
| VTE | 46.47 | 47.72 | 47.14 | −0.0249 (0.5167) | −0.0135 (0.8126) | ||||||
| Emergency department | 5.15 | 33.88 | 4.26 | −0.7775 (< 0.0001) | 0.0242 (0.4342) | ||||||
| Inpatient | 84.21 | 48.42 | 85.11 | 0.8180 (< 0.0001) | −0.0205 (0.6459) | ||||||
| Observation | 3.25 | 13.40 | 2.58 | −0.3739 (< 0.0001) | 0.0247 (0.4820) | ||||||
| Comorbidities, % | |||||||||||
| Anemia | 16.80 | 9.00 | 15.90 | 0.2340 (< 0.0001) | 0.0269 (0.6543) | ||||||
| History of bleed | 8.06 | 7.14 | 8.62 | 0.0350 (0.3432) | −0.0211 (0.7322) | ||||||
| Dyspepsia | 2.02 | 2.40 | 1.79 | −0.0262 (0.6118) | 0.0152 (0.8629) | ||||||
| Peptic ulcer | 1.23 | 0.87 | 0.78 | 0.0358 (0.3275) | 0.0439 (0.4784) | ||||||
| Peripheral vascular disease | 9.07 | 5.90 | 8.29 | 0.1206 (0.0012) | 0.0298 (0.6142) | ||||||
| Sleep apnea | 10.97 | 10.10 | 11.65 | 0.0284 (0.4521) | −0.0219 (0.7088) | ||||||
| Warfarin to rivaroxaban matching | |||||||||||
| Demographics/characteristics | Warfarin (n = 893) | All rivaroxaban (n = 2,999) | Matched rivaroxaban (n = 893) | Difference average before matching (P value) | Difference average after matching (P value) | ||||||
| Comorbidities, % | |||||||||||
| Thrombophilia | 1.01 | 0.80 | 0.56 | 0.0219 (0.5357) | 0.0473 (0.4221) | ||||||
| Fracture | 1.01 | 1.30 | 0.90 | −0.0274 (0.6050) | 0.0105 (1.0000) | ||||||
| Pneumonia | 6.05 | 4.40 | 6.16 | 0.0740 (0.0490) | −0.0050 (1.0000) | ||||||
| Coronary artery disease | 29.45 | 15.97 | 31.02 | 0.3258 (< 0.0001) | −0.0379 (0.5030) | ||||||
| Cerebrovascular disease | 16.24 | 7.84 | 15.34 | 0.2603 (< 0.0001) | 0.0278 (0.6497) | ||||||
| Congestive heart failure | 18.59 | 8.74 | 17.69 | 0.2897 (< 0.0001) | 0.0263 (0.6674) | ||||||
| COPD | 19.37 | 15.47 | 20.49 | 0.1029 (0.0063) | −0.0296 (0.5940) | ||||||
| Diabetes | 33.26 | 21.04 | 33.48 | 0.2773 (< 0.0001) | −0.0051 (0.9600) | ||||||
| Hyperlipidemia | 52.07 | 44.18 | 53.64 | 0.1584 (< 0.0001) | −0.0315 (0.5378) | ||||||
| Hypertension | 69.09 | 56.15 | 70.32 | 0.2698 (< 0.0001) | −0.0257 (0.6066) | ||||||
| Liver disease | 5.04 | 4.33 | 5.15 | 0.0333 (0.3592) | −0.0053 (1.0000) | ||||||
| Morbid obesity | 17.69 | 10.64 | 17.47 | 0.2033 (< 0.0001) | 0.0065 (0.9504) | ||||||
| Renal disease | 18.81 | 6.37 | 17.92 | 0.3817 (< 0.0001) | 0.0275 (0.6689) | ||||||
| Selected surgery | 10.30 | 7.70 | 9.63 | 0.0909 (0.0155) | 0.0235 (0.6930) | ||||||
| Baseline medication use, % | |||||||||||
| Antiarrhythmic | 0.67 | 0.47 | 0.78 | 0.0272 (0.4300) | −0.0149 (1.0000) | ||||||
| Antiplatelet | 3.47 | 2.47 | 3.92 | 0.0591 (0.1251) | −0.0264 (0.7070) | ||||||
| β-Blocker | 21.16 | 10.50 | 20.27 | 0.2951 (< 0.0001) | 0.0248 (0.6828) | ||||||
| Calcium channel blocker | 11.53 | 5.84 | 10.64 | 0.2033 (< 0.0001) | 0.0320 (0.5979) | ||||||
| Gastroprotective agent | 13.66 | 9.40 | 14.11 | 0.1336 (0.0004) | −0.0140 (0.8374) | ||||||
| Hormone therapy | 0.67 | 0.27 | 0.56 | 0.0593 (0.1044) | 0.0164 (1.0000) | ||||||
| NSAIDs | 3.36 | 3.90 | 4.14 | −0.0290 (0.4858) | −0.0419 (0.4552) | ||||||
| SERMs | 0.11 | 0.03 | 0.00 | 0.0292 (0.4063) | 0.0415 (1.0000) | ||||||
| Statins | 20.16 | 14.40 | 20.49 | 0.1525 (0.0001) | −0.0089 (0.9064) | ||||||
CHC is the Department of Human Services Medical Assistance (Medicaid) program that allows MCOs to coordinate medical care and long-term services and supports for individuals who qualify for Medical Assistance and also qualify for Medicare or require a nursing facility level of care. UPMC CHC is a CHC-MCO in Pennsylvania.
AF = atrial fibrillation; CCI = Charlson Comorbidity Index; CHC = Community HealthChoices; COPD = chronic obstructive pulmonary disease; MCO = managed care organization; PE = pulmonary embolism; NSAID = nonsteroidal anti-inflammatory drug; SERM = selective estrogen receptor modulator; VTE = venous thromboembolism.
FIGURE 2.
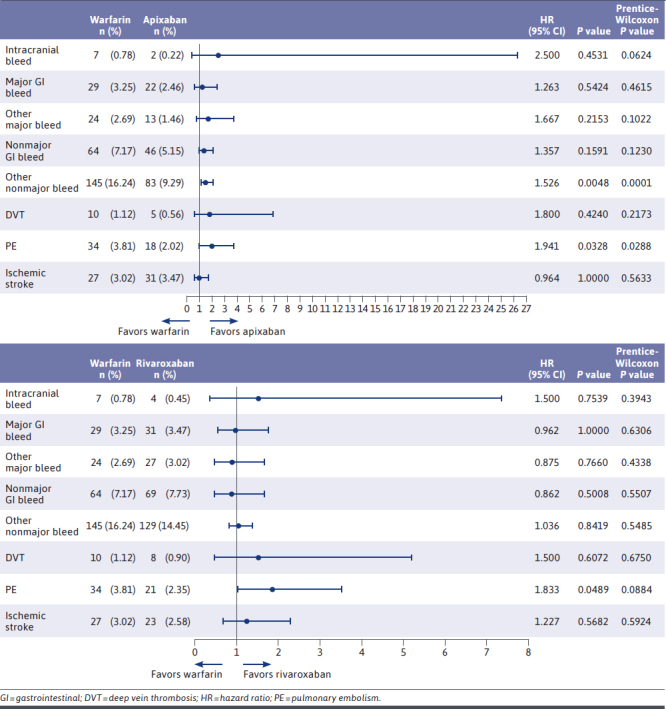
Clinical Outcomes: Paired HRs and CIs, Warfarin vs DOACs
TABLE 2.
Economic Outcomes: Warfarin vs Direct Oral Anticoagulants (Per Member Per Month)
| Economic outcome | Warfarin vs apixaban | Warfarin vs rivaroxaban | ||||||
|---|---|---|---|---|---|---|---|---|
| Warfarin cost difference | Apixaban cost difference | DID t-test (95% CI); P value | DID M-estimate (95% CI); P value | Warfarin cost difference | Rivaroxaban cost difference | DID t-test (95% CI); P value | DID M-estimate (95% CI); P value | |
| Total cost of care | 1,281.16 | 2,082.80 | −801.64 (−1,464.09 to −139.18); 0.0178 | −392.56 (−666.83 to −118.07); 0.0055 | 1,281.16 | 1,815.39 | −534.23 (−1,170.87 to 102.42); 0.0998 | −450.90 (−775.97 to −127.94); 0.0067 |
| All-cause inpatient | 347.60 | 777.82 | −430.22 (−999.56 to 139.13); 0.1382 | −48.17 (−181.39 to 93.43); 0.5001 | 347.60 | 626.19 | −278.59 (−818.53 to 261.36); 0.3111 | −142.57 (−344.33 to 52.53); 0.1510 |
| All-cause outpatient | 317.92 | 471.80 | −153.87 (−353.79 to 46.04); 0.1311 | −8.72 (−61.45 to 42.65); 0.7375 | 317.92 | 244.64 | 73.29 (−105.98 to 252.55); 0.4222 | 16.36 (−37.50 to 69.77); 0.5499 |
| All-cause pharmacy | 111.46 | 453.93 | −342.47 (−443.17 to −241.76); < 0.0001 | −342.38 (−365.32 to −319.07); < 0.001 | 111.46 | 497.70 | −386.24 (−494.13 to −278.35); < 0.0001 | −380.30 (−406.55 to −353.75); 0.0069 |
| VTE-related costs | 235.19 | 58.10 | 177.09 (42.93 to 311.26); 0.0098 | N/A | 235.19 | 170.48 | 64.71 (−120.28 to 249.70); 0.4922 | N/A |
| Bleed-related costs | 358.64 | 408.76 | −50.13 (−364.74 to 264.48); 0.7543 | N/A | 358.64 | 318.64 | 40.00 (−158.03 to 238.03); 0.6916 | N/A |
DID is calculated relative to warfarin.
DID = difference-in-difference; N/A = not applicable; VTE = venous thromboembolism.
INCLUSION/EXCLUSION CRITERIA
Inclusion criteria were as follows: VTE/AF diagnosis claim in any position (any setting), age 18 years or older, at least 1 pharmacy claim for warfarin or a DOAC on or within the 30-day period following index encounter, and continuous health plan enrollment with medical and pharmacy benefits for at least 6 months before index encounter and during the time between index encounter and index date. Members were excluded if they had a history of a mechanical heart valve, anticoagulants were used during baseline period, a VTE/AF diagnosis was present 6 months before index encounter, a claim for malignancy was present, inferior vena cava filter was present, they were pregnant at any time during the study period, non-index OAC was used, warfarin was used without evidence of bridging within 14 days or less of index date, or if they received parenteral anticoagulant treatment beyond 14 days after index date.
OUTCOMES MEASURED
Clinical outcomes were compared between groups and consisted of any incidence of each of the following on separate dates within the study period: bleeding events (intracranial hemorrhage, gastrointestinal bleeding, and other bleeds) and thrombotic events (DVT, PE, and ischemic stroke). Health care resource use was compared between groups and consisted of number of hospitalizations, length of stay, and number of outpatient visits. Medication adherence was also assessed for each of the treatment groups; a medication possession ratio of at least 80% was defined as adherent for the DOACs, whereas international normalized ratio (INR) in therapeutic range (standard 2.0-3.0 range) was used to assess adherence to warfarin. The time to first fill was defined as the time between the index encounter date and the date of the first fill of the treatment medication.
Economic outcomes were compared between groups on a PMPM basis and included total cost of care, all-cause inpatient and outpatient costs, all-cause pharmacy costs, and costs associated with bleeding and thrombosis events.
DATA SOURCE AND STATISTICAL ANALYSIS
Retrospective medical and pharmacy claims of UPMC Health Plan members were used for both economic and clinical outcomes. Medical data were identified via International Statistical Classification of Diseases and Related Health Problems 10 (ICD-10) diagnosis codes, and pharmacy claims were identified using Generic Code Numbers or Hierarchical Ingredient Codes.
Study populations were matched by important clinical and economic characteristics (Figure 1), including demographic information, comorbidities (any incidence during the baseline period), baseline medication use, index event leading to use of any OAC, baseline cost data, and a propensity score predicting receipt of warfarin vs each respective DOAC. Matching on a propensity score helps to balance covariates that are included in the propensity score.16,17 In addition to the propensity score, controls were assigned using an optimal matching procedure21 that used the Mahalanobis distance metric,19 as well as using a near-fine balance constraint that chooses the optimal assignment within an allowed deviation in the marginal distribution across groups within each specified categorical variable.20 All matching was completed using the “designmatch” R package.22 As suggested by Rubin, all matching was completed first before analyzing outcomes.14 All matched characteristics were balanced to have a standardized difference below 0.20. Costs were compared between matched groups using a paired t-test, retaining the matched pairs constructed. For continuous outcomes, the matched measure was the DID; the difference of the pre-intervention–post-intervention cost difference for the warfarin group compared with their matched control pre-intervention–post-intervention cost difference. As noted by Rosenbaum and Rubin,19 creating a suitably matched comparison group helps remove bias and allow for more straightforward comparisons between the groups. A t-test to detect differences in PMPM across groups was used to address economic impact between interventions. A more robust comparison was made using m-estimates based on Huber (1964, 1981), with associated test statistics and CIs based on Maritz (1979) using the “sensitivitymw” R package.24 Cox paired HRs were calculated for each clinical outcome following the procedure outlined in Holt and Prentice using the paired version of the Cox proportional hazards model.15 A CI of 95% was used and a P value less than 0.05 was considered significant. Clinical outcomes also had a P value calculated from the Prentice-Wilcoxon procedure to examine possible differences in time to event for each clinical outcome between groups.25 Each of these procedures for clinical outcomes uses the paired information for time to event information to calculate the test statistic, as opposed to evaluating each group separately or through a regression variable. The DID of PMPM costs and HR were reported as warfarin vs respective DOAC.
Results
BASELINE CHARACTERISTICS
Initial data selection consisted of warfarin, apixaban, dabigatran, edoxaban, and rivaroxaban. After applying the inclusion and exclusion criteria, there were too few members using dabigatran (n = 81) or edoxaban (n = 0) to include in the analysis. Therefore, the 2-analysis set consisted of 893 members using warfarin; 4,439 members using apixaban; and 2,999 members using rivaroxaban. To adjust for the inherent differences between these treatment groups, the apixaban and rivaroxaban populations were matched to warfarin by clinical and economic characteristics (Table 1). The matching process resulted in a matched study population of 893 participants for each of the 3 anticoagulant groups.
In the matched populations, the average age was 61.95, 61.99, and 62.30 years for the warfarin, apixaban, and rivaroxaban treatment groups, respectively. Additionally, a slight majority of patients in each group were female. A small percentage of patients in each group were noted to use antiplatelet agents and prescription nonsteroidal anti-inflammatory drugs. However, this characteristic (along with every other characteristic) was matched between groups to eliminate any statistically significant difference between them. The most common comorbidities in each of the 3 populations were hypertension, hyperlipidemia, and diabetes. Notably, the warfarin population had a higher Charlson Comorbidity Index (CCI) score, indicating potential greater disease burden. The most common index event in the matched populations was DVT (warfarin: 47.14%, apixaban: 45.58%, rivaroxaban: 46.47%), followed by PE (warfarin 44.34%, apixaban: 43.45%, rivaroxaban: 43.45%) and finally AF (warfarin: 35.36%, apixaban: 34.83%, rivaroxaban: 34.49%). Members with multiple diagnoses (ie, both DVT and PE noted on the same date of diagnosis) during their index event were included. The average duration of follow-up was 139.14 days, 134.21 days, and 132.11 days for warfarin, apixaban, and rivaroxaban, respectively.
CLINICAL OUTCOMES
Relative to apixaban, warfarin was associated with a significant increase in other nonmajor bleeds (HR = 1.526; P = 0.0048), as well as a significant increase in PE (HR = 1.941; P = 0.0328). No statistically significant differences between warfarin and rivaroxaban were observed in any bleed category. However, relative to rivaroxaban, warfarin also was associated with a significant increase in PE (HR = 1.833; P = 0.0489). Additionally, no statistically significant difference was observed in PMPM hospitalizations (DID vs apixaban: 0.00 [P = 0.9774]; DID vs rivaroxaban: 0.008 [P = 0.6086]) or in length of stay (DID vs apixaban: −0.002 days [P = 0.9901]; DID vs rivaroxaban: 0.094 days [P = 0.05342]) between warfarin and either DOAC.
Apixaban and rivaroxaban had similar adherence rates, with 63% and 57% of patients achieving a medication possession ratio of greater than or equal to 80%, respectively. Warfarin patients were in a therapeutic INR range 45% of the time. The median time from the index event to first fill for both DOACs was 4 days, whereas the median time from the index event to first fill of warfarin was 6 days.
ECONOMIC OUTCOMES
The DID in PMPM total cost of care was significantly lower for warfarin relative to apixaban (−$801.64; P = 0.0178), whereas warfarin’s DID relative to rivaroxaban was not statistically different (−$534.23; P = 0.0998). Much of this difference in total cost of care was a result of the lower allcause inpatient costs among the warfarin group (DID vs apixaban: −$430.22 [P = 0.1382]; DID vs rivaroxaban: −$278.59 [P = 0.3111]), as well as significantly lower all-cause pharmacy costs (DID vs apixaban: −$342.47 [P < 0.0001]; DID vs rivaroxaban: −$386.24 [P < 0.0001]). Although not statistically significant, all-cause outpatient costs were higher for apixaban and lower for rivaroxaban vs warfarin (DID vs apixaban: −$153.87 [P = 0.1311]; DID vs rivaroxaban: $73.29 [P = 0.4222]).
Warfarin was associated with significantly higher VTE-related costs vs apixaban (DID vs apixaban: $177.09 [P = 0.0098]), whereas its difference vs rivaroxaban was not statistically significant (DID vs rivaroxaban: $64.71 [P = 0.4922]). Bleed-related costs were similar for each anticoagulant (DID vs apixaban: −$50.13 [P = 0.7543]; DID vs rivaroxaban: $40.00 [P = 0.6916]).
Discussion
This retrospective analysis evaluated the clinical and economic outcomes associated with AF and VTE in patients treated with warfarin, apixaban, and rivaroxaban. Regarding bleeding events, warfarin was associated with a significantly higher rate of other nonmajor bleeds relative to apixaban. This is consistent with findings of the AMPLIFY and ARISTOTLE trials in which apixaban was associated with a significant reduction in both major and nonmajor bleeds.6,7 No statistically significant differences were observed between warfarin and rivaroxaban in any bleed categories. It is notable, though not significant, that rivaroxaban was associated with the highest incidence of major and nonmajor gastrointestinal bleeds. These results are consistent with recent evidence that rivaroxaban (and dabigatran) has increased risk of gastrointestinal bleed compared with warfarin and other DOACs in patients older than 75 years of age.29 In the matched populations of this study, approximately 22% of patients in each treatment group were aged 75 years or older.
Additionally, warfarin was associated with a significantly higher rate of PE relative to both DOACs. These results differ from the findings of the EINSTEIN and AMPLIFY trials, which did not find any statistically significant difference in PE incidence rates of rivaroxaban and apixaban when compared with warfarin.6,8 One possible explanation for this discrepancy would be that in clinical trials, patients treated with warfarin would be more closely controlled than in the real-world setting. Therefore, DOACs, which (unlike warfarin) do not require frequent monitoring, dosing adjustment, or adherence to a specific diet, could be expected to have better outcomes in the real-world setting.
Despite identifying some favorable anticoagulant-related clinical outcomes, DOACs were associated with higher total cost of care compared with warfarin. Our patient population was matched with a large number of clinical and demographic variables, and a DID methodology was used to control for individual costs of care at baseline. The difference between total cost of care was mostly attributable to the increased pharmacy and inpatient costs associated with DOACs. The list prices for 30-day supplies of apixaban and rivaroxaban are $499 and $492, respectively, whereas the average retail price of a 30-day supply of warfarin is typically around $19.30.31,32 Outliers were present within the PMPM inpatient cost for both DOAC and warfarin groups; however, when these outliers were eliminated within an additional analysis, warfarin was still associated with lower inpatient costs although the difference was no longer significant. Additionally, potential use of expensive reversal agents for DOACs in the event of a bleeding episode would have been captured within the inpatient costs; because of data limitations, claims for reversal agents could not be captured, as they are bundled in inpatient costs.
In the real-world setting, a major cost incurred with warfarin therapy is the cost associated with outpatient INR monitoring. In this study, a total of 4,541 INR tests were captured for the warfarin group, equating to an average of 5 INR tests per warfarin patient over an average of 139.14 days, or about 1 INR test every 4 weeks per patient. Unfortunately, INR laboratory tests are not always captured individually in insurance claims data (ie, point-of-care testing, at-home INR monitoring, INR tests that may be bundled with inpatient costs). INR monitoring frequency for warfarin patients is recommended to occur daily for the first 5 days after initiation of therapy and once every 4 to 6 weeks in stable patients on maintenance therapy, but many patients commonly require more frequent testing in the initial dosing period.33 Given that the patients included in this study were new to warfarin therapy and the noted frequency of INR testing above, it is likely that some INR readings and associated costs were not captured.
This study expands on the findings of previous research by Guo et al.15 Guo et al illustrated warfarin’s association with higher rates of major bleeding, clinically relevant nonmajor bleeding, and recurrent VTE when compared with apixaban in a real-world setting; additionally, the study found higher all-cause medical costs in the warfarin group when compared with apixaban. Although this study illustrated similar clinical outcomes with a significant increase in other nonmajor bleeding and incidence of PE with warfarin vs apixaban, these results differed in terms of rates of major bleed, nonmajor bleed, and all economic outcomes. Varying economic outcomes may be due to differences in the 2 study populations. This study included members from commercial, Medicare, and Medicaid lines of business, whereas the study by Guo et al included primarily commercially insured members. With the inclusion of Medicare and Medicaid members, this study population was older (approximately 10 years older on average) and had increased comorbid status. Additionally, this study included patients being treated for AF and VTE, whereas Guo et al looked specifically at VTE treatment. These study population differences may have accounted for an overall increased cost of care in this study’s patient population, leading to the differing economic observations.
LIMITATIONS
To reduce the inherent differences between the treatment groups, the DOAC populations were matched to the warfarin population. The prematched warfarin population had a higher CCI score and higher total cost of care than the DOAC populations, indicating that these patients had a greater disease burden and higher costs at baseline. By matching to the warfarin population, higher-acuity patients were included in the DOAC arm. Consequently, the reported results for the DOACs may not be representative of real-world DOAC populations.
Although patients were matched on clinical and economic baseline characteristics, unmeasured differences among the groups may exist that were not able to be accounted for. For example, over-the-counter use of aspirin or nonsteroidal anti-inflammatory drugs not captured in pharmacy claims data could have increased the incidence of bleeds that could not be accounted for in the study because of claims limitations. It is possible that greater interaction with clinical pharmacists in patients on warfarin would result in lower use of these over-the-counter products in patients on warfarin relative to DOACs.
ICD-10 diagnosis codes were used to identify the incidence of clinical outcomes. Although utilization of ICD-10 diagnosis codes is the research standard within a managed care organization, the presence of a diagnosis code in a medical claim does not guarantee the presence of disease. According to studies, ICD-10 diagnosis codes have been found to differ from chart-documented diagnoses by as much as 13.9% to 16.7%.34,35,36 In data collection for this, the incidence of an ICD-10 code constituted a diagnosis of that event. Chart review was not performed to confirm diagnosis validity. Therefore, it is possible patients had diagnosis codes inputted into their electronic health record without a true diagnosis, resulting in inaccurate incidence rates in the clinical outcomes. However, it is unlikely that any significant differences in inaccurate coding exists between groups.
INR monitoring occurred less frequently in warfarin patients than is clinically recommended for warfarin initiation. This may have led to lower outpatient costs for warfarin patients than would typically be seen in practice and may also have contributed to the relatively low observed percentage of INR tests in therapeutic range. Additionally, it may have contributed to higher rates of PE observed in the warfarin population relative to apixaban. However, INR claims are not always captured individually, and tests done by third parties do not always contain laboratory values.
Additional limitations include a study population limited to 1 region of the United States and a relatively short follow-up period. The relatively short follow-up period (although on par with typical treatment durations for acute VTE) limits external validity for patients being treated for AF.
Finally, data limitations did not allow for categorization and breakdown of all-cause inpatient costs. Therefore, specific sources of the variation in all-cause inpatient costs could not be identified.
Conclusions
In this real-world patient population, warfarin was associated with a significant increase in other nonmajor bleeds relative to apixaban. Warfarin was also associated with a significant increase in the incidence of PE relative to both DOACs. These specific outcomes are largely consistent with the results of published RCTs comparing DOACs to warfarin.6,7,8,9 Despite these clinical outcomes, warfarin was associated with lower overall health care costs when compared with DOACs, driven in part by lower pharmacy costs. Further studies that include chart review to corroborate documented ICD-10 diagnosis codes are needed to more accurately assesses and compare the cost-effectiveness of DOACs and warfarin. Similar assessments of total cost of care among similar patient populations as those chosen in this study would be useful to confirm or refute the findings of higher total costs of care for DOACs relative to warfarin.
REFERENCES
- 1.Reiffel JA. Atrial fibrillation and stroke: Epidemiology. Am J Med. 2014;127:e15-6. doi: 10.1016/j.amjmed.2013.06.002 [DOI] [PubMed] [Google Scholar]
- 2.Fauchier L, Villejoubert O, Clementy N, et al. Causes of death and influencing factors in patients with atrial fibrillation. Am J Med. 2016;129(12):1278-87. doi: 10.1016/j.amjmed.2016.06.045 [DOI] [PubMed] [Google Scholar]
- 3.Kim MH, Johnston SS, Chu BC, Dalal MR, Schulman KL. Estimation of total incremental health care costs in patients with atrial fibrillation in the United States. Circ Cardiovasc Qual Outcomes. 2011;4(3):313-20. doi: 10.1161/CIRCOUTCOMES.110.958165 [DOI] [PubMed] [Google Scholar]
- 4.US Department of Health and Human Services. Surgeon general’s call to action to prevent deep vein thrombosis and pulmonary embolism 2008. Accessed February 10, 2021. https://www.ncbi.nlm.nih.gov/books/NBK44178/ [PubMed]
- 5.Grosse SD, Nelson RE, Nyarko KA, Richardson LC, Raskob GE. The economic burden of incident venous thromboembolism in the United States: A review of estimated attributable healthcare costs. Thromb Res. 2016;137:3-10. doi: 10.1016/j.thromres.2015.11.033 [DOI] [PMC free article] [PubMed] [Google Scholar]
- 6.Agnelli G, Buller HR, Cohen A, et al. Oral apixaban for the treatment of acute venous thromboembolism. N Engl J Med. 2013;369(9):799-808. doi: 10.1056/NEJMoa1302507 [DOI] [PubMed] [Google Scholar]
- 7.Granger CB, Alexander JH, McMurray JJ, et al. Apixaban versus warfarin in patients with atrial fibrillation. N Engl J Med. 2011;365:981-92. doi: 10.1056/NEJMoa1107039 [DOI] [PubMed] [Google Scholar]
- 8.Bauersachs BS, Brenner B, Buller HR, et al. EINSTEIN Investigators. Oral rivaroxaban for symptomatic venous thromboembolism. N Engl J Med. 2010;363(26):2499-510. doi: 10.1056/NEJMoa1007903 [DOI] [PubMed] [Google Scholar]
- 9.Patel MR, Mahaffey KW, Garg J, et al. ROCKET AF Investigators. Rivaroxaban versus warfarin in nonvalvular atrial fibrillation. N Engl J Med. 2011;365(10): 883-91. doi: 10.1056/NEJMoa1009638 [DOI] [PubMed] [Google Scholar]
- 10.Kearon C, Akl EA, Ornelas J, et al. Antithrombotic therapy for VTE disease: CHEST guideline and expert panel report. Chest. 2016;149(2):315-52. doi: 10.1016/j.chest.2015.11.026 [DOI] [PubMed] [Google Scholar]
- 11.Lopes RD, Thomas L, Di Fusco M, et al. Clinical and economic outcomes among nonvalvular arterial fibrillation patients with coronary artery disease and/or peripheral artery disease. Am J Cardiol. 2021;148:69-77. doi: 10.1016/j.amjcard.2021.02.021 [DOI] [PubMed] [Google Scholar]
- 12.Amin A, Keshishian A, Trocio J, et al. A real-world observational study of hospitalization and health care costs among nonvalvular atrial fibrillation patients prescribed oral anticoagulants in the U.S. Medicare population [published correction appears in J Manag Care Spec Pharm. 2020;26(5):682]. J Manag Care Spec Pharm. 2020;26(5): 639-51. doi: 10.18553/jmcp.2020.26.5.639 [DOI] [PMC free article] [PubMed] [Google Scholar]
- 13.Peterson ED, Ashton V, Chen YW, Wu B, Spyropoulos AC. Comparative effectiveness, safety, and costs of rivaroxaban and warfarin among morbidly obese patients with atrial fibrillation. Am Heart J. 2019;212:113-9. doi: 10.1016/j.ahj.2019.02.001 [DOI] [PubMed] [Google Scholar]
- 14.Spyropoulos AC, Ashton V, Chen YW, Wu B, Peterson ED. Rivaroxaban versus warfarin treatment among morbidly obese patients with venous thromboembolism: Comparative effectiveness, safety, and costs. Thromb Res. 2019;182:159-66. doi: 10.1016/j.thromres.2019.08.021 [DOI] [PubMed] [Google Scholar]
- 15.Guo J, Rajpura J, Hlavacek P, et al. Comparative clinical and economic outcomes associated with warfarin versus apixaban in the treatment of patients with venous thromboembolism in a large U.S. commercial claims database. J Manag Care Pharm. 2020;26(8):1017-26. doi: 10.18553/jmcp.2020.19311 [DOI] [PMC free article] [PubMed] [Google Scholar]
- 16.Rosenbaum P, Rubin D. The central role of the propensity score in observational studies for causal effects. Biometrika. 1983;70(1):41-55. [Google Scholar]
- 17.Rosenbaum PR. Design of Observational Studies. Springer; 2010. [Google Scholar]
- 18.Rubin DB. For objective causal inference, design trumps analysis. Ann Appl Stat. 2008;2(3):808-40. doi: 10.1214/08-AOAS187 [DOI] [Google Scholar]
- 19.Rosenbaum PR, Rubin DB. Constructing a control group using multivariate matched sampling methods that incorporate the propensity score. The American Statistician. 1985;39(1):33-8. [Google Scholar]
- 20.Yang D, Small DS, Silber JH, Rosenbaum PR. Optimal matching with minimal deviation from fine balance in a study of obesity and surgical outcomes. Biometrics. 2012;68(2):628-36. doi: 10.1111/j.1541-0420.2011.01691.x [DOI] [PMC free article] [PubMed] [Google Scholar]
- 21.Rosenbaum PR. Optimal matching for observational studies. Journal of the American Statistical Association. 1989;84(408):1024-32. [Google Scholar]
- 22.Zubizarreta J, Kilcioglu C, Vielma J. designmatch: Matched samples that are balanced and representative by design (2018). R package version 0.3.1. Accessed March 12, 2021. https://CRAN.R-project.org/package=designmatch
- 23.O’Brien PC, Fleming TR. A paired Prentice-Wilcoxon test for censored paired data. Biometrics. 1987;43:169-80. [Google Scholar]
- 24.Rosenbaum PR. Sensitivitymw: Sensitivity Analysis for Observational Studies Using Weighted M-Statistics (2022). R package version 2.1. Accessed May 05, 2022. https://cran.r-project.org/web/packages/sensitivitymw/sensitivitymw.pdf
- 25.Huber PJ. Robust estimation of a location parameter. Annals of Mathematical Statistics. 1964;35:73-101. doi: 10.1214/aoms/1177703732 [DOI] [Google Scholar]
- 26.Huber PJ. Robust Statistics. New York, NY; 1981. [Google Scholar]
- 27.Maritz JS. A note on exact robust confidence intervals for location. Biometrika. 1979;66:163-6. [Google Scholar]
- 28.Holt J, Prentice R. Survival analysis in twin studies and matched pair experiments. Biometrika. 1974;61(1):17-30. [Google Scholar]
- 29.Abraham NS, Singh S, Alexander GC, et al. Comparative risk of gastrointestinal bleeding with dabigatran, rivaroxaban, and warfarin: Population based cohort study. The British Medical Journal. 2015;350:h1857. doi: 10.1136/bmj.h1857 [DOI] [PMC free article] [PubMed] [Google Scholar]
- 30.ELIQUIS. Pricing information. Bristol-Myers Squibb Company. Accessed October 05, 2021. https://www.eliquis.bmscustomerconnect.com/afib/price
- 31.XARELTO. Savings and support for XARELTO. Janssen Pharmaceuticals, Inc. Accessed October 05, 2021. https://www.xarelto-us.com/xarelto-cost/co-pay-and-list-price
- 32.Mui K. Warfarin alternatives: Are ELIQUIS and Xarelto worth the COST? GoodRx Health. Accessed October 05, 2021. https://www.goodrx.com/blog/warfarin-alternatives-are-eliquis-and-xarelto-worth-the-cost/
- 33.Tideman PA, Tirimacco R, St John A, Roberts GW. How to manage warfarin therapy [published correction appears in Aust Prescr. 2016;39(2):66]. Aust Prescr. 2015;38(2):44-8. doi: 10.18773/austprescr.2015.016 [DOI] [PMC free article] [PubMed] [Google Scholar]
- 34.Januel JM, Luthi JC, Quan H. et al. Improved accuracy of comorbidity coding over time after the introduction of ICD-10 administrative data. BMC Health Serv Res. 2011;11:194. doi: 10.1186/1472-6963-11-194 [DOI] [PMC free article] [PubMed] [Google Scholar]
- 35.Cai CX, Michalak SM, Stinnett SS, et al. Effect of ICD-9 to ICD-10 transition on accuracy of codes for stage of diabetic retinopathy and related complications: results from the CODER study. Ophthalmol Retina. 2021;5(4):374-80. doi: 10.1016/j.oret.2020.08.004 [DOI] [PubMed] [Google Scholar]
- 36.Mo L, Xie Z, Liu G, et al. Feasibility of coding-based Charlson comorbidity index for hospitalized patients in China, a representative developing country. BMC Health Serv Res. 2020;20:432. doi: 10.1186/s12913-020-05273-8 [DOI] [PMC free article] [PubMed] [Google Scholar]