

Abstract
BACKGROUND:
Various factors, including patient demographic and socioeconomic characteristics, patient out-of-pocket (OOP) costs, therapy-related factors, clinical characteristics, and health-system factors, can affect patient adherence to oral anticancer medications (OAMs).
OBJECTIVE:
To determine the proportion of patients initiating oral anticancer therapy who were adherent to OAMs and to identify significant predictors of adherence to OAMs, including patient OOP costs and patient demographics.
METHODS:
A retrospective cohort study was conducted using data from Optum Clinformatics Data Mart commercial claims database for 2010-2018. Patients with a new pharmacy claim for an OAM between July 1, 2010, and December 31, 2017, were followed for 6 months to ascertain their medication adherence, which was defined as a proportion of days covered value of at least 0.8. Average monthly patient OOP costs for OAM prescriptions were categorized as lower OOP costs (quartiles 1-3) and higher OOP costs (quartile 4). Separate multivariable logistic regressions were conducted to identify predictors of OAM nonadherence for each cancer type.
RESULTS:
Out of 37,938 patients with cancer, 51.9% were adherent to OAMs, with adherence ranging from 32.8% among those with liver cancer to 70.4% among those with brain tumor. The average monthly OOP costs of OAMs also differed by cancer type, ranging from $749 (SD = $1,014) among patients with blood cancer to $106 (SD = $439) among those with prostate cancer. Higher patient OOP costs were associated with higher odds of OAM nonadherence for many cancer types, including renal cancer (adjusted odds ratio [AOR] = 3.91; 95% CI = 2.80-5.47) and breast cancer (AOR = 1.26; 95% CI = 1.13-1.41). Additionally, patients with inpatient hospitalizations during the 6 months following OAM initiation had significantly higher odds of OAM nonadherence for all cancer types except for stomach cancer. Among patients with stomach cancer, male sex was associated with lower odds of OAM nonadherence (AOR = 0.60; 95% CI = 0.37-0.97). Among patients with renal or stomach cancer, those who had Medicare low-income subsidy had higher odds of OAM nonadherence compared with those with commercial insurance coverage. Among patients with blood cancers, Black and Hispanic patients had higher odds of OAM nonadherence compared with White patients (AOR = 1.48; 95% CI = 1.25-1.75 and AOR = 1.38; 95% CI = 1.13-1.68, respectively).
CONCLUSIONS:
Overall adherence to OAMs was suboptimal, and for several cancer types, adherence was worse among patients with higher OOP costs, those who were hospitalized, and those who received Medicare low-income subsidy. Policies addressing cost and access to OAMs and health-system strategies to address barriers to the effective use of OAMs are needed to improve patient access to these vital medications.
Plain language summary
We used a large health care claims database to study patient adherence with oral anticancer medications (OAMs). We also identified the factors that predict OAM adherence. We found that patient adherence with OAMs was less than optimal, especially for patients having higher out-of-pocket (OOP) costs or receiving Medicare low-income subsidy. This study provided strong evidence for the need for strategies to address the high costs of OAMs.
Implications for managed care pharmacy
Adherence to OAMs was suboptimal in several cancer types and was negatively associated with higher patient OOP costs, Medicare low-income subsidy status, sex, race and ethnicity, and inpatient hospitalization. Patients with higher OOP costs due to their pharmacy benefit design may not be able to continually afford OAMs. Financial barriers that impact patients’ access to OAMs should be addressed by developing and implementing interventions that target socioeconomic and health-system influences of patient adherence to OAMs.
There has been a dramatic increase in the use of oral anticancer medications (OAMs) during the past decade. By 2015, more than 50 OAMs were approved by the US Food and Drug Administration, with a record number of 11 oral oncology drugs launched in 2018.1 This has resulted in a shift of the treatment paradigm from receiving medication in hospitals and outpatient clinics to patients being responsible for self-administering their cancer therapies. OAM adherence ranges from 20% to 100% depending on patient characteristics, cancer type and cancer therapy, and definition of adherence.2,3 It is essential for patients with cancer to adhere to OAMs, as nonadherence is associated with disease progression, lower quality of life, and premature death.4
Many OAMs are expensive, resulting in substantial patient out-of-pocket (OOP) costs.5,6 Higher OOP costs may lead to prescription abandonment,7-9 delayed initiation,9,10 or other forms of nonadherence,11,12 which may lead to poorer outcomes and avoidable health care utilization.2,13,14 Although cost can be a foremost barrier to OAM adherence, clinical, sociodemographic, and health-system factors can also be of influence. The Medication Access Patient Journey conceptual framework was jointly developed by the Pharmacy Quality Alliance (PQA) and National Pharmaceutical Council with the aim to define and address social determinants of health that may affect patients’ access to medications.15 According to this framework, patients’ access to medications is significantly affected by medication-related costs including OOP costs, access to health insurance, and type of insurance coverage, in addition to several other factors.
Prior studies that have examined patient adherence to OAMs have used older data7-10,16 or have focused on one specific cancer type.8,9,17 There is a shortage of current knowledge about what factors may affect OAM adherence across cancer types. Given the expanding development of OAMs, it is crucial to understand factors that affect patient adherence. The study’s objective was to identify what proportion of patients were adherent with newly initiated OAMs across 10 cancer types: blood, brain, breast, colorectal, liver, lung, ovarian, prostate, renal, or stomach cancers. We also identified factors associated with OAM adherence using multivariable logistic regression.
Methods
STUDY DESIGN AND DATA SOURCE
This retrospective observational cohort study was conducted using the 2010-2018 De-identified Optum Clinformatics Data Mart commercial claims database. This database provides comprehensive information about patient demographics, health care utilization, health care costs, and pharmacy medication use of 50 million unique patients from geographically diverse US regions enrolled in commercial insurance or Medicare Advantage. Pharmacy claims data include data on drug name and strength, dosage form, fill date, days supply, National Drug Codes, and costs to third-party payers and patients. The study received an Institutional Review Board Exemption from the University of Rhode Island.
STUDY COHORT
We identified patients with a new pharmacy claim for an OAM between July 1, 2010, and December 31, 2017, which defined their index prescription date. We used the National Drug Codes in pharmacy claims to identify prescriptions of OAMs. Supplementary Table 1 (609.8KB, pdf) , available in online article, lists OAMs included in the study, which were identified in consultation with a board-certified oncology pharmacist. Patients were required to have no paid claim for OAMs in the 6 months prior to the index date, to identify patients who newly initiated an OAM. Patients who initiated 2 or more OAMs on the same day were excluded from the study. We did not include older oral endocrine therapies for breast cancer (tamoxifen, anastrozole, and letrozole), which are generally inexpensive and have been extensively studied. Additionally, these medications are used to prevent cancer recurrence and metastasis and are not used as front-line cancer therapies, compared with the other OAMs included in our study. We included patients who received OAMs indicated for any of these cancers: blood, brain, breast, colorectal, liver, lung, ovarian, prostate, renal, or stomach. We selected these cancers because of their prevalence, higher mortality burden, and indications for OAMs.18 The type of cancer that each OAM was indicated was determined during the baseline period using International Classification of Diseases, Ninth Revision, Clinical Modification (ICD-9-CM) or International Classification of Diseases, Tenth Revision, Clinical Modification (ICD-10-CM) codes for cancer. For instance, for imatinib indicated for chronic myeloid leukemia, acute lymphocytic leukemia, and stomach cancer, we identified ICD-9-CM or ICD-10-CM codes for each of these cancers in the baseline period and assigned cancer type for that patient based on the ICD codes identified. Patients were required to have continuous insurance enrollment 6 months prior to and at least 6 months following the index OAM date, and a non-negative OOP cost data for the index OAM.
STUDY MEASURES
OOP Costs of OAMs. Patient OOP costs for selected OAMs were calculated by summing copays and deductible payments for each prescription claim of OAMs during the 6-month period following the index prescription date. Average OOP costs per 30-day supply of an OAM were calculated by dividing the total OOP costs by the total days of medication supply during the 6-month follow-up period and then multiplying by 30 to approximate monthly spend.19 Based on the distribution of the medication cost data for each cancer type, patient OOP cost categories were formed representing lower (quartiles 1-3) and the higher (quartile 4) quartile of OOP spending. OOP costs were adjusted for inflation to 2019 US dollars using the Consumer Price Index.20
Medication Adherence. Adherence to OAMs during the 6-month exposure period following the index prescription date was determined using a modification of the proportion of days covered (PDC) measure, a PQA-endorsed metric.21 Patients were considered adherent if their PDC value was 0.8 or more.21 In each model, patients were categorized as those adherent to OAMs and those not adherent to OAMs. Given our aim to evaluate short-term medication use among newly treated patients, we included patients with at least 1 OAM prescription and measured adherence during the 6-month exposure period. This approach differs from that suggested by the PQA for chronic therapies, which requires at least 2 dispensings.21 Some patients initiating their OAM may not refill their prescription after the first fill owing to high OOP costs and hence may not receive a second OAM prescription. Such cases were important to include in our analysis. Additionally, discontinuation during the exposure period, defined as a continuous gap of at least 60 days in the supply of OAMs,22 was also assessed.
Independent Variables. Patient demographics included age, sex, race and ethnicity, US geographic region, and index year. Socioeconomic status included census level income, education, and the number of adults in the household. Health-system factors included insurance type (commercial, Medicare 65 + years, Medicare < 65 years, Medicare low-income subsidy [LIS]), type of health plan (point of service, exclusive provider organization, health maintenance organization, preferred provider organization, indemnity, and others), and residence in a US state that had enacted drug price parity laws during the study time frame. Clinical characteristics comprised the cancer type for which an index medication was prescribed, baseline modified Charlson Comorbidity Index score,23 and mental health comorbidities. Mental health conditions may be negatively associated with adherence.24,25 We applied validated ICD-9-CM and ICD-10-CM code sets to identify patients with depression, anxiety, dysthymia, posttraumatic stress disorder, bipolar disorder, personality disorders, schizophrenia, and other psychotic disorders, obtained from the medical claims.26-28 Additionally, therapy-related factors included dosing schedule, typical dose, inpatient hospitalization during the exposure period, and the use of additional anticancer treatment given intravenously or through infusion during the exposure period. A patient was considered as receiving a typical dose if the OAM required daily use without any interruptions, whereas a patient was considered as having an atypical dose if the OAM was indicated to be used for a certain number of days of the month (ie, cycling). For patients on atypical dosing OAMs (eg, lenalidomide), we added the number of days of a break from OAM use between the cycles of therapy to the numerator of the PDC in order to avoid underestimation of adherence.
STATISTICAL ANALYSES
Descriptive statistics were used to characterize the overall study cohort and the subpopulations according to cancer types. Chi-square tests were conducted to identify significant differences between adherent and nonadherent groups, across independent variables, for the entire cohort of patients with cancer included in our study. Trends in OOP costs and adherence to OAMs during 2010-2018 were determined using regressions. Separate multivariable logistic regression models with forward selection method were used to identify the predictors of adherence to OAMs for each cancer type. Bivariate logistic regressions were first performed, and variables with a P value of less than 0.25 were carried forward for evaluation in the multivariable models. Variables with P values less than 0.05 were retained. Findings with P values of 0.05 or less were considered statistically significant. All statistical analyses were performed using SAS 9.4 software (SAS Institute Inc).
Results
DESCRIPTIVE CHARACTERISTICS
After applying the inclusion and exclusion criteria, 37,938 patients were included (Supplementary Figure 1 (609.8KB, pdf) ). The average age of the study cohort was 68 years, with the majority being White (61.1%) and women (50.7%) and having Medicare Advantage insurance coverage (≥ 65 years; 52.1%) (Table 1). Additionally, health maintenance organization (30.1%) and point of service (26.1%) were the most observed health plan types. Clinically, 35.1% of patients had a Charlson Comorbidity Index score of 2 or more, and 11.8% had a diagnosis for a psychiatric comorbidity. Concomitant utilization of injection chemotherapy during followup was observed among one-third of the study cohort.
TABLE 1.
Baseline Characteristics of Patients With Cancer Who Received an Index Oral Anticancer Medication Between June 2010 and December 2017
| Variables | Total cohort (N = 37,938) | Nonadherent (n = 18,236 [48.1%]) | Adherent (n = 19,702 [51.9%]) | P value |
|---|---|---|---|---|
| Demographic characteristics | ||||
| Age, mean (SD), years | 67.9 (12.1) | 68.0 (11.9) | 67.8 (12.2) | 0.0300 |
| Age, years | ||||
| < 55 | 5,595 (14.8) | 2,686 (48.0) | 2,909 (52.0) | 0.0005 |
| 55-64 | 7,644 (20.2) | 3,513 (46.0) | 4,131 (54.0) | |
| 65-69 | 5,765 (15.2) | 2,825 (49.0) | 2,940 (51.0) | |
| 70-74 | 6,626 (17.5) | 3,281 (49.5) | 3,345 (50.5) | |
| 75-79 | 5,363 (14.1) | 2,606 (48.6) | 2,757 (51.4) | |
| ≥ 80 | 6,945 (18.3) | 3,325 (47.9) | 3,620 (52.1) | |
| Sex | ||||
| Female | 19,245 (50.7) | 9,077 (47.2) | 10,168 (52.8) | 0.0004 |
| Male | 18,693 (49.3) | 9,159 (49.0) | 9,534 (51.0) | |
| Race and ethnicity | ||||
| White | 23,169 (61.1) | 11,109 (48.0) | 12,060 (52.0) | 0.0003 |
| Black | 3,952 (10.4) | 1,971 (49.9) | 1,981 (50.1) | |
| Hispanic | 3,186 (8.4) | 1,565 (49.1) | 1,621 (50.9) | |
| Asian | 1,093 (2.9) | 470 (43.0) | 623 (57.0) | |
| Unknown/missing | 6,538 (17.2) | 3,121 (49.8) | 3,417 (50.2) | |
| US geographic region | ||||
| Northeast | 4,490 (11.8) | 2,109 (47.0) | 2,381 (53.0) | 0.0013 |
| Midwest | 8,591 (22.6) | 4,001 (46.6) | 4,590 (53.4) | |
| South | 14,629 (38.6) | 7,171 (49.0) | 7,458 (51.0) | |
| West | 10,228 (27.0) | 4,955 (48.5) | 5,273 (51.5) | |
| Index year | ||||
| 2010 | 1,834 (4.8) | 993 (54.1) | 841 (45.9) | < 0.0001 |
| 2011 | 4,097 (10.8) | 2,128 (51.9) | 1,969 (48.1) | |
| 2012 | 4,451 (11.7) | 2,203 (49.5) | 2,248 (50.5) | |
| 2013 | 4,208 (11.1) | 2,102 (49.9) | 2,106 (50.1) | |
| 2014 | 4,480 (11.8) | 2,092 (46.7) | 2,388 (53.3) | |
| 2015 | 5,383 (14.2) | 2,456 (45.6) | 2,927 (54.4) | |
| 2016 | 6,086 (16.0) | 2,826 (46.4) | 3,260 (53.6) | |
| 2017 | 7,398 (19.5) | 3,435 (46.4) | 3,963 (53.6) | |
| Health-system characteristics | ||||
| Type of insurance | ||||
| Commercial | 14,360 (37.9) | 6,646 (46.3) | 7,714 (53.7) | < 0.0001 |
| Medicare LIS | 2,714 (7.2) | 1,306 (48.1) | 1,408 (51.9) | |
| Medicare (≥ 65 years) | 19,779 (52.1) | 9,751 (49.3) | 10,028 (50.7) | |
| Medicare (< 65 years) | 1,085 (2.9) | 533 (49.1) | 552 (50.9) | |
| Type of health plan | ||||
| POS | 9,914 (26.1) | 4,571 (46.1) | 5,343 (53.9) | < 0.0001 |
| EPO | 1,477 (3.9) | 695 (47.1) | 782 (52.9) | |
| HMO | 11,424 (30.1) | 5,723 (50.1) | 5,701 (49.9) | |
| PPO | 2,471 (6.5) | 1,176 (47.6) | 1,295 (52.4) | |
| Indemnity | 862 (2.3) | 373 (43.3) | 489 (56.7) | |
| Others | 11,790 (31.1) | 5,698 (48.3) | 6,092 (51.7) | |
| State parity enactment | ||||
| Prestudy enactment | 2,350 (6.2) | 1,181 (50.3) | 1,169 (49.7) | 0.0044 |
| Study enactment | 32,064 (84.5) | 15,297 (47.7) | 16,767 (52.3) | |
| Poststudy enactment | 3,524 (9.3) | 1,758 (49.9) | 1,766 (50.1) | |
| Socioeconomic characteristics | ||||
| Household income | ||||
| < $40K | 7,412 (19.5) | 3,625 (48.9) | 3,787 (51.1) | < 0.0001 |
| $40K-$49K | 2,460 (6.5) | 1,241 (50.5) | 1,219 (49.5) | |
| $50K-$59K | 2,688 (7.1) | 1,348 (50.2) | 1,340 (49.8) | |
| $60K-$74K | 3,683 (9.7) | 1,804 (49.0) | 1,879 (51.0) | |
| $75K-$99K | 5,244 (13.8) | 2,491 (47.5) | 2,753 (52.5) | |
| ≥ $100K | 9,325 (24.6) | 4,263 (45.7) | 5,062 (54.3) | |
| Unknown/Missing | 7,126 (18.8) | 3,464 (48.6) | 3,662 (51.4) | |
| Education | ||||
| HS or less | 9,460 (24.9) | 4,594 (48.6) | 4,866 (51.4) | < 0.0001 |
| Less than bachelor’s degree | 19,071 (50.3) | 9,255 (48.5) | 9,816 (51.5) | |
| Bachelor’s degree and higher | 6,348 (16.7) | 2,882 (45.4) | 3,466 (54.6) | |
| Unknown/missing | 3,059 (8.1) | 1,505 (49.2) | 1,554 (50.8) | |
| Number of adults in household | ||||
| 1 | 9,460 (24.9) | 12,246 (48.9) | 12,771 (51.1) | < 0.0001 |
| 2 | 19,071 (50.3) | 2,640 (45.6) | 3,148 (54.4) | |
| ≥ 3 | 6,348 (16.7) | 1,845 (45.3) | 2,229 (54.7) | |
| Unknown/missing | 3,059 (8.1) | 1,505 (49.2) | 1,554 (50.8) | |
| Clinical characteristics | ||||
| Modified CCI Score | ||||
| 0 | 15,450 (40.7) | 7,311 (47.3) | 8,139 (52.7) | < 0.0001 |
| 1 | 9,169 (24.2) | 4,291 (46.8) | 4,878 (53.2) | |
| ≥ 2 | 13,319 (35.1) | 6,634 (49.8) | 6,685 (50.2) | |
| Psychiatric comorbidity | ||||
| No | 33,444 (88.2) | 16,106 (48.2) | 17,338 (51.8) | 0.337 |
| Yes | 4,494 (11.9) | 2,130 (47.4) | 2,364 (52.6) | |
| Therapy-related characteristics | ||||
| Concomitant injection/infused chemotherapy | ||||
| No | 25,422 (67.0) | 11,436 (45.0) | 13,986 (55.0) | < 0.0001 |
| Yes | 12,516 (33.0) | 6,800 (54.3) | 5,716 (45.7) | |
| Dosing schedule | ||||
| Once daily | 29,039 (76.5) | 13,061 (45.0) | 15,978 (55.0) | < 0.0001 |
| Twice daily | 8,899 (23.5) | 5,175 (58.2) | 3,724 (41.8) | |
| Typical daily dosing | ||||
| No | 15,222 (40.1) | 8,013 (52.6) | 7,209 (47.4) | < 0.0001 |
| Yes | 22,716 (59.9) | 10,223 (45.0) | 12,493 (55.0) | |
Data are shown as n (%) unless otherwise noted.
CCI = Charlson comorbidity index; EPO = exclusive provider organization; HMO = health maintenance organization; HS = high school; LIS = low-income subsidy; POS = point of service; PPO = preferred provider organization.
Overall, 51.9% of the study cohort were adherent to OAMs, and 48.1% were not adherent. Subgroup crosstabulations showed statistically significant differences between adherent and nonadherent groups for several covariates (Table 1). Adherence was slightly higher among patients aged 55-64 years, of whom 54.0% adhered to their OAM compared with those aged 65-69 years (51.0%). Adherence was observed to be somewhat higher among Asian patients (57.0%), followed by White patients (52.0%), and lowest among Black patients (50.1%). Among those with commercial insurance, a somewhat higher percentage of patients were adherent (53.7%), followed by those with Medicare LIS (51.9%), and the lowest adherence was among those aged 65 and older with Medicare (50.7%, P < 0.05). Among patients who had concomitant use of injection/infused chemotherapy, 45.7% adhered to their OAMs compared with 55.0% who were nonadherent (P < 0.05). Additionally, 55.0% of patients who took their medication once daily or had a typical dosing regimen were adherent compared with 41.8% of patients with twice-daily dosing and 47.4% with atypical dosing (ie, cycling). Supplementary Table 2 (609.8KB, pdf) describes the baseline characteristics of nonadherent patients separately for each cancer type.
ADHERENCE AND DISCONTINUATION
The proportion of patients adherent to OAMs varied significantly by cancer type (Figure 1). Those with liver cancer or colorectal cancer had the lowest proportion of adherence to OAMs at 32.8% and 37.3%, respectively, whereas those with brain, stomach, or lung cancer had the highest proportions at 70.4%, 68.8%, and 64.7%, respectively. The average PDC value for most cancer types did not substantially differ according to year of index OAM (Supplementary Figure 2). The proportion of patients who discontinued OAMs varied by cancer type. Approximately 19.5% of patients with stomach cancer, 30.8% of those with renal cancer, and 49.1% of those with liver cancer discontinued their OAMs.
FIGURE 1.
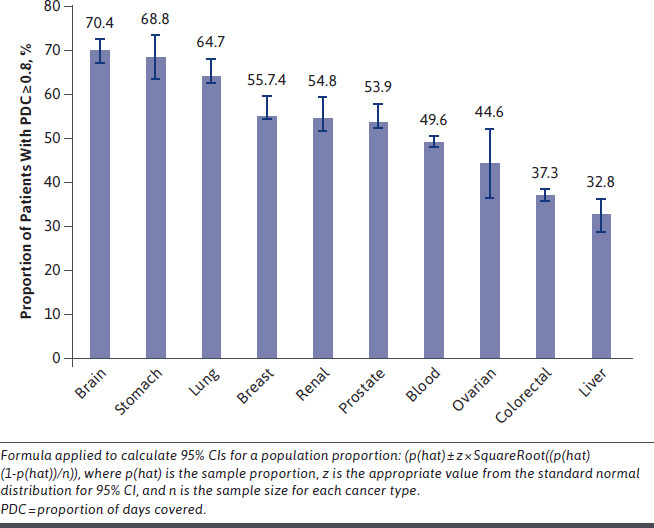
Proportion of Patients Adherent to Oral Anticancer Medications by Cancer Type
AVERAGE MONTHLY OOP COSTS
Average monthly OAM OOP costs varied largely by cancer type, with blood and liver cancer cohorts facing the greatest OOP financial burdens at $749 (SD = $1,014) and $722 (SD = $1,040), respectively. Brain, breast, and prostate cancer cohorts had the lowest average monthly OOP costs at $187 (SD = 579), $165 (SD = 436), and $106 (SD = 439), respectively (Table 2). Average monthly patient OOP costs were relatively stable for each cancer type throughout the study (Supplementary Figure 3 (609.8KB, pdf) ). Supplementary Tables 3 and 4 (609.8KB, pdf) describe the quartiles of OOP costs by insurance type for the entire cohort, and the unadjusted association between OOP costs and nonadherence separately for each cancer type, respectively.
TABLE 2.
Average Monthly OOP Costs of Oral Anticancer Medications by Cancer Type
| Type of cancer (n) | Average monthly OOP costs, $ (SD) |
|---|---|
| Prostate cancer (8,816) | 106 (439) |
| Breast cancer (11,078) | 165 (436) |
| Brain cancer (1,124) | 187 (579) |
| Colorectal cancer (6,040) | 364 (457) |
| Ovarian cancer (148) | 423 (1,117) |
| Stomach cancer (352) | 532 (905) |
| Lung cancer (2,080) | 594 (832) |
| Renal cancer (1,213) | 648 (1,000) |
| Liver cancer (564) | 722 (1,040) |
| Blood cancer (6,523) | 749 (1,014) |
OOP = out-of-pocket.
PREDICTORS OF MEDICATION NONADHERENCE BY CANCER TYPE
Higher OOP costs were significantly associated with increased odds of OAM nonadherence for all cancer types except for prostate cancer. The highest odds of OAM nonadherence were observed among those with liver and renal cancer, with adjusted odds ratios (AORs) of 3.03 (95% CI = 1.86-4.96) (Figure 2) and 3.91 (95% CI = 2.80-5.47) (Figure 3), respectively, for those with higher OOP costs compared with those with lower OOP costs. Therapy-related covariates were important predictors of nonadherence for almost every cancer type. In particular, among patients with ovarian cancer, the odds of nonadherence were 5 times higher for those who received injection chemotherapy in addition to their oral medications as compared with those with no concomitant use of injection chemotherapy (AOR = 5.07; 95% CI = 1.28-20.03) (Figure 3). Additionally, inpatient hospitalization during the exposure period was a significant predictor of OAM nonadherence for most cancer types. The odds of nonadherence to OAMs were more than 5 times higher for those with hospitalizations than for those without hospitalization (AOR = 5.83; 95% CI = 5.12-6.63 for colorectal cancer and AOR = 4.51; 95% CI = 1.50-13.55 for ovarian cancer).
FIGURE 2.
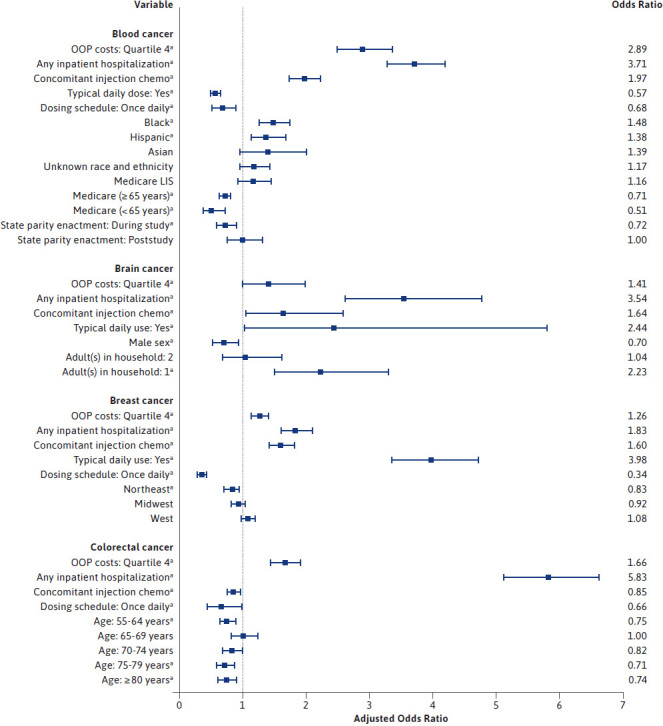
Predictors of Medication Nonadherence for Patients Who Received an Index Oral Anticancer Medication, Separately for Major Cancer Types
FIGURE 3.
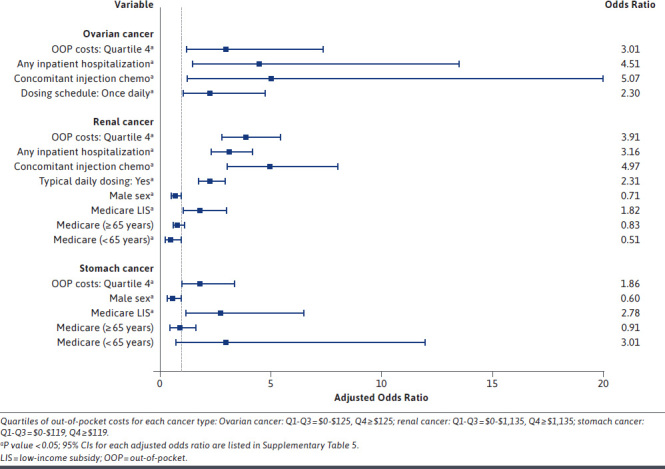
Predictors of Medication Nonadherence for Patients Who Received an Index Oral Anticancer Medication, for Ovarian, Renal, and Stomach Cancer
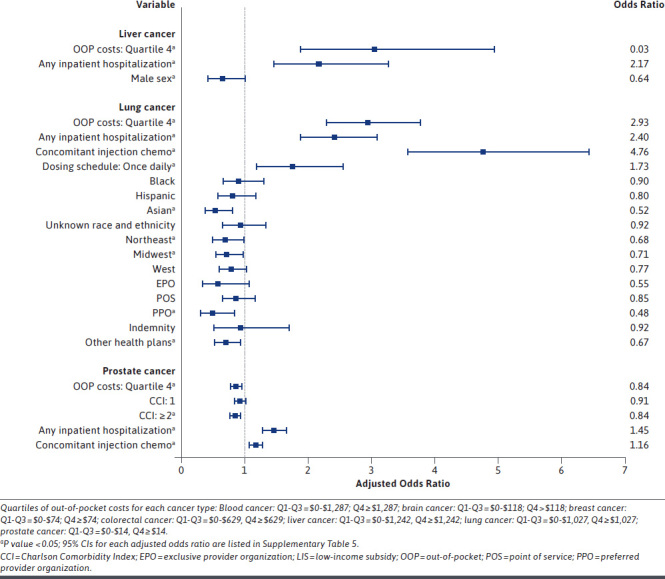
Patient demographics such as race and ethnicity and sex were also significant predictors of OAM nonadherence. Race and ethnicity were significantly associated with nonadherence in patients with blood cancer or lung cancer (Figure 2); however, findings differed across these cancer types. Among patients with blood cancer, those who were Black or Hispanic had higher odds of being nonadherent compared with White patients, with AORs of 1.48 (95% CI = 1.25-1.75) and 1.38 (95% CI = 1.13-1.68), respectively. Moreover, within the lung cancer cohort, Asian patients were almost half as likely (AOR = 0.52; 95% CI = 0.34-0.80) to be nonadherent to their OAMs compared with White patients. Sex was a significant predictor of nonadherence in 4 out of the 7 cancer types for which sex was assessed, all of which showed men having lower odds of being nonadherent to their medications, with the strongest association observed in the stomach cancer cohort (AOR = 0.60, 95% CI = 0.37-0.97) (Figure 3). Additionally, patients with prostate cancer with Charlson comorbidity index of 2 or more were significantly less likely to be nonadherent to OAMs (AOR = 0.84; 95% CI = 0.76-0.93). Health-system factors were also significant predictors of medication nonadherence for those with blood, renal, stomach, or lung cancer. Those with renal or stomach cancers who had a Medicare LIS had significantly higher odds of medication nonadherence compared with those with commercial insurance coverage (AOR = 1.82; 95% CI = 1.09-3.04 for renal cancer and AOR = 2.78; 95% CI = 1.19-6.51 for stomach cancer). Supplementary Tables 5 and 6 (609.8KB, pdf) describe the predictors of OAM nonadherence from forward selection and full logistic regressions, respectively, separately for each cancer type.
Discussion
This study provides current insights into patient adherence to newly prescribed OAMs across several cancer types. Our study found that overall, slightly more than half of patients were adherent to their OAMs during the initial 6-month treatment period and the proportion of patients adherent to their OAMs differed by cancer type, ranging from 32.8% for those with liver cancer to 70.4% for those with brain cancer. A systematic review by Greer et al reported the proportion of patients with 80% or more adherence to OAMs.24 Our study found lower adherence for some cancer types than that reported in their review. This may be partly attributed to our inclusion of data through 2018, during which several expensive targeted drugs were newly approved, including alectinib, gefitinib, palbociclib, osimertinib, rucaparib, venetoclax, and neratinib. Additionally, lower adherence observed in our analysis may be due to our method for calculating adherence, which included patients who received at least 1 prescription of OAM, rather than requiring at least 2 OAM prescriptions as was the criterion used in some studies included in the Greer et al review and in other studies. Our inclusion of patients with at least 1 prescription for OAM likely contributed to comparatively lower estimates of OAM adherence overall. Yet, it was important to include these cases as it is possible that some patients initiating their OAM may not refill their prescription after the first fill due to high OOP costs or several other factors including treatment-related adverse events, intolerance to OAMs, or disease progression. A 2021 study examining OAM adherence among Medicare beneficiaries with chronic myeloid leukemia, multiple myeloma, metastatic prostate cancer, metastatic breast cancer, or metastatic renal cancer used data for 2012-2013.29 Our study found higher OAM adherence for all cancer types included in the study by Doshi et al. The discrepancies between our findings and the study by Doshi et al may in part be due to differences in adherence assessment periods: our study measured adherence during 6 months following initiation of an OAM, whereas the latter study assessed adherence for 12 months following initiation of an OAM.
Furthermore, variations in adherence may occur owing to complexities of different cancer types, including cancer staging and severity, the patient’s performance status, patient preferences, and other factors that may affect a patient’s access to OAMs. For instance, OAMs for liver, ovarian, or colorectal cancers are indicated for advanced or metastatic disease. Hence, patients with such cancers are at an advanced stage and are more likely to experience worse clinical sequelae, which may adversely impact their medication adherence. Indeed, we found the lowest PDC values among patients with liver, colorectal, or ovarian cancer (32.8%, 37.3%, 44.9%, respectively) and higher PDC values among patients with breast cancer and prostate cancer (> 50%). In our study, a majority of patients with breast cancer (69%) and all patients with prostate cancer received oral hormonal therapies as their index OAM. Oral hormonal therapies have a comparatively lower risk of serious adverse events when compared with other oral chemotherapies, which suggests that greater patient tolerability may have had a role in the higher degree of adherence observed among patients using hormonal therapies. We found a relatively higher proportion of patients with brain, stomach, or lung cancer being adherent to OAMs than patients with other cancer types. One study found that around 75% of patients with central nervous system tumors were adherent to temozolomide,30 whereas another study also found that 73% of patients with gastric tumors were adherent to OAMs.31 This finding may be explained in part by the use of several OAMs as first-line therapies for these cancer types,32,33 which have shown to significantly improve survival and quality of life.34 Additionally, PDC values for each cancer type remained stable according to the year of OAM initiation, indicating that suboptimal adherence to OAMs has been a continuing problem.
Patient OOP costs for OAMs varied widely by cancer type. This can in part be explained by the availability of generic versions for some of the medications included in our study. Our study pinpoints higher OOP costs as one of the major significant predictors of medication nonadherence for all cancer types, except prostate cancer, for which lower-cost generic medications are often indicated. The AORs of nonadherence were significantly higher for higher OOP costs for blood, liver, lung, ovarian, and renal cancers. Several expensive targeted OAMs approved during the past decade include treatments for blood (bosutinib, ibrutinib, imatinib), lung (afatinib, alectinib, ceritinib, gefitinib, osimertinib, dabrafenib, trametinib), renal (axitinib, cabozantinib, lenvatinib), and ovarian (olaparib, rucaparib, niraparib) cancers. List prices for a month supply of these medications are often thousands of dollars, and with the patient cost sharing required by the pharmacy benefit design, these medications accounted for the highest average monthly OOP costs among the OAMs included in our study.
Several studies have reported higher OOP costs to be a significant predictor of nonadherence to OAMs.17,35,36 Additionally, there are reports showing higher OOP costs being associated with increased rates of prescription abandonment and delayed initiation7,10 or discontinuation of oral anticancer treatment.36 Although we could not measure prescription abandonment with the data source used in this study, our results added to the prior findings reported by Doshi et al10 and Dusetzina et al22 that higher OOP costs are associated with OAM nonadherence, despite the differences in measurement methods. Patients exposed to a high cost sharing for OAMs through the pharmacy benefit design may not be able to afford the medication continually and may then delay or discontinue treatment. Any form of nonadherence to OAMs can have adverse and costly outcomes, potentially causing cancer progression, lower quality of life, increased health care utilization, and premature mortality.4 Our findings suggest that it is crucial to address financial barriers and improve patients’ OAM access to achieve the favorable clinical outcomes demonstrated in clinical trials. Moreover, financial barriers can cause increased emotional distress in addition to the distress already brought on by a facing a life-threatening illness.37,38
Nonadherence to OAMs was also associated with a range of patient, therapy-related, health-system, and clinical characteristics. Recognition of these factors is important to the development of health-system interventions to promote adherence to OAMs. Among patients with lung, blood, renal, breast, liver, and ovarian cancers, those who received injection chemotherapy along with OAMs and those who had hospitalization had higher odds of OAM nonadherence. One systematic review reported significant associations between nonadherence and health care utilization, including hospitalizations and concomitant chemotherapy.24 Those who received concurrent injection chemotherapy may have experienced treatment-related adverse events that disrupted OAM adherence. These patients may also experience disease-specific toxicities and events, age-related factors including polypharmacy, and adverse drug-drug interactions, resulting in hospitalizations. Several OAMs are extremely expensive, and because of this, hospitals may not have them on their formularies. We are unable to determine the specific reasons why OAM nonadherence was higher among patients who were hospitalized. Lengthy inpatient stays may have delayed the time between refills; however, patients may have continued using their own medication while in the hospital. It may become challenging for hospitals to provide OAMs to hospitalized patients given the costs and complexities of acquiring OAMs.39 Additionally, health events that required hospitalization may have also necessitated a temporary or permanent cessation of the OAM. Hence, these findings suggest a need for interventions to be incorporated into the care protocols of patients with cancer to monitor and promote OAM adherence.
We found that men had lower odds of nonadherence compared with females for brain, liver, renal, and stomach cancers, after adjusting for other factors. Reviews have reported inconsistent results for the influence of sex as a barrier or facilitator for OAM adherence.24,25 Patients with Medicare LIS were also more likely to be nonadherent for several cancer types. Shen et al reported that patients with cancer with subsidized Medicare Part D plans were more likely to be nonadherent than those without a subsidy.35 Patients qualifying for Medicare LIS generally have lower financial resources than working-age persons enrolled in commercial plans, and this may diminish their ability to adhere to the regimen, irrespective of cost sharing. For example, LIS qualification may be associated with a lack of transportation access or other social barriers to optimal adherence. Several studies have shown lower income and fewer financial resources as the significant predictors of OAM nonadherence.40,41
Several strategies to reduce patient OOP costs of OAMs have been implemented, including the enactment of oral cancer drug price parity legislation in many US states,42 provision of Medicare LIS for eligible patients, and more broadly, closure of the Medicare Part D coverage gap. Our findings suggest that these strategies alone may not be sufficient to reduce patient OOP medication costs and improve access to OAMs. Other notable strategies include value-based insurance designs that involve patients in the treatment choice43 and the American Society of Clinical Oncology’s initiative of incorporating costs into future treatment guidelines.44 Capping annual patient OOP spending in the Medicare Part D design promises to be a particularly important action.45
LIMITATIONS
OAMs can cause adverse events that may be associated with poorer adherence. We were not able to discern if OAM nonadherence was due to clinical or financial reasons. Also, adherence by cancer stage was not examined owing to the lack of staging information in the database. The dosing differences among patients were also not evaluated. Additionally, similar to all claims database analyses, it was not possible to determine if the oral medications were taken by the patients as indicated. The administrative claims data do not provide any information on prescription assistance (eg, copayment cards), and we have no information on the number of patients who received such assistance. The database does not include uninsured patients, so findings cannot be generalized to uninsured patients with cancer. Lastly, patients in our study were covered by one single health plan and hence the findings of our study may not be generalizable to the entire commercially insured population in the United States.
Conclusions
Overall, patient adherence to OAMs was suboptimal across several cancer types. Higher OOP costs, Medicare LIS insurance type, sex, race and ethnicity, and inpatient hospitalization were associated with nonadherence to OAMs. It is important to develop and implement policies addressing cost and access to OAMs and target common socioeconomic and health-system influences of patient adherence to OAMs.
ACKNOWLEDGMENTS
The authors acknowledge Dr Britny Brown, Pharm D, BCOP, for her consultation about medications that were included in our study.
REFERENCES
- 1.Global Oncology Trends 2019: Therapeutics, clinical development and health system implications. The IQVIA Institute Report, May 30, 2019. Accessed December 20, 2021. https://www.iqvia.com/insights/the-iqvia-institute/reports/global-oncology-trends-2019
- 2.Partridge AH, Avorn J, Wang PS, Winer EP. Adherence to therapy with oral antineoplastic agents. J Natl Cancer Inst. 2002;94(9):652-61. doi: 10.1093/jnci/94.9.652 [DOI] [PubMed] [Google Scholar]
- 3.Foulon V, Schoffski P, Wolter P. Patient adherence to oral anticancer drugs: An emerging issue in modern oncology. Acta Clin Belg. 2011;66(2):85-96. doi: 10.2143/ACB.66.2.2062525 [DOI] [PubMed] [Google Scholar]
- 4.World Health Organization. Adherence to long-term therapies: Evidence for action. Geneva, Switzerland; 2003. Accessed December 20, 2021. http://apps.who.int/iris/bitstream/handle/10665/42682/9241545992.pdf;jsessionid=F754FF185F5B651CFB5ACF496A23FF90?sequence=1 [Google Scholar]
- 5.Centers for Medicare and Medicaid Services: Medicare Part D specialty tier. Accessed December 20, 2021. https://www.cms.gov/Medicare/Prescription-Drug-Coverage/PrescriptionDrugCovGenln/Downloads/SpecialtyTierMethodology.pdf
- 6.Kaiser Family Foundation, Health Research and Educational Trust, NORC at University of Chicago: 2016 employer health benefits survey. Accessed December 20, 2021. https://www.kff.org/health-costs/report/2016-employer-health-benefits-survey/
- 7.Streeter SB, Schwartzberg L, Husain N, Johnsrud M. Patient and plan characteristics affecting abandonment of oral oncolytic prescriptions. J Oncol Pract. 2011;7(3S):46s-51s. doi: 10.1200/JOP.2011.000316 [DOI] [PMC free article] [PubMed] [Google Scholar]
- 8.Winn AN, Keating NL, Dusetzina SB. Factors associated with tyrosine kinase inhibitor initiation and adherence among Medicare beneficiaries with chronic myeloid leukemia. J Clin Oncol. 2016;34:4323-28. doi: 10.1200/JCO.2016.67.4184 [DOI] [PMC free article] [PubMed] [Google Scholar]
- 9.Doshi JA, Li P, Huo H, et al. High cost sharing and specialty drug initiation under Medicare Part D: A case study in patients with newly diagnosed chronic myeloid leukemia. Am J Manag Care. 2016;22(4S):S78-86. [PubMed] [Google Scholar]
- 10.Doshi JA, Li P, Huo H, Pettit AR, Armstrong KA. Association of patient out-of-pocket costs with prescription abandonment and delay in fills of novel oral anticancer agents. J Clin Oncol. 2018;36(5):476-82. doi: 10.1200/JCO.2017.74.5091 [DOI] [PubMed] [Google Scholar]
- 11.Decker V, Spoelstra S, Miezo E, et al. A pilot study of an automated voice response system and nursing intervention to monitor adherence to oral chemotherapy agents. Cancer Nurs. 2009;32(6):E20-29. doi: 10.1097/NCC.0b013e3181b31114 [DOI] [PubMed] [Google Scholar]
- 12.Sedjo RL, Devine S. Predictors of non-adherence to aromatase inhibitors among commercially insured women with breast cancer. Breast Cancer Res Treat. 2011;125(1):191-200. doi: 10.1007/s10549-010-0952-6 [DOI] [PubMed] [Google Scholar]
- 13.Wu EQ, Johnson S, Beaulieu N, et al. Healthcare resource utilization and costs associated with non-adherence to imatinib treatment in chronic myeloid leukemia patients. Curr Med Res Opin. 2010;26(1):61-69. doi: 10.1185/03007990903396469 [DOI] [PubMed] [Google Scholar]
- 14.Gebbia V, Bellavia G, Ferrau F, Valerio MR. Adherence, compliance, and persistence to oral antineoplastic therapy: A review focused on chemotherapeutic and biologic agents. Expert Opin Drug Saf. 2012;11(Suppl 1):S49-59. doi: 10.1517/14740338.2011.645803 [DOI] [PubMed] [Google Scholar]
- 15.Holland L, Nelson ML, Westrich K, Campbell PH, Pickering MK. The patient’s medication access journey: A conceptual framework focused beyond adherence. J Manag Care Spec Pharm. 2021;27(12): 1627-35. doi: 10.18553/jmcp.2021.27.12.1627 [DOI] [PMC free article] [PubMed] [Google Scholar]
- 16.Kaisaeng N, Harpe SE, Carroll NV. Out-of-pocket costs and oral cancer medication discontinuation in the elderly. J Manag Care Spec Pharm. 2014;20(7): 669-75. doi: 10.18553/jmcp.2014.20.7.669 [DOI] [PMC free article] [PubMed] [Google Scholar]
- 17.Hess LM, Louder A, Winfree K, Zhu YE, Oton AB, Nair R. Factors associated with adherence to and treatment duration of erlotinib among patients with non-small cell lung cancer. J Manag Care Spec Pharm. 2017;23(6):643-52. doi: 10.18553/jmcp.2017.16389 [DOI] [PMC free article] [PubMed] [Google Scholar]
- 18.American Cancer Society. Cancer Facts and Figures 2019. Atlanta: American Cancer Society; 2019. Accessed June 20, 2021. https://www.cancer.org/content/dam/cancer-org/research/cancer-facts-and-statistics/annual-cancer-facts-and-figures/2019/cancer-facts-and-figures-2019.pdf [Google Scholar]
- 19.Spargo A, Yost C, Squires P, Raju A, Schroader B, Brown JD. The effects of oral anticancer parity laws on out-of-pocket spending and adherence among commercially insured patients with chronic myeloid leukemia. J Manag Care Spec Pharm. 2017;27(5):554-64. doi: 10.18553/jmcp.2021.27.5.554 [DOI] [PMC free article] [PubMed] [Google Scholar]
- 20.United States Department of Labor: Bureau of Labor Statistics. Consumer price index, medical care services, 1982-84 (2018). Accessed December 20, 2021. https://www.bls.gov/
- 21.Nau DP. Proportion of days covered (PDC) as the preferred method of measuring medication adherence. Pharmacy Quality Alliance. Accessed December 2021. http://ep.yimg.com/ty/cdn/epill/pdcmpr.pdf
- 22.Dusetzina SB, Winn AN, Abel GA, Huskamp HA, Keating NL. Cost sharing and adherence to tyrosine kinase inhibitors for patients with chronic myeloid leukemia. J Clin Oncol. 2014;32(4):306-11. doi: 10.1200/JCO.2013.52.9123 [DOI] [PubMed] [Google Scholar]
- 23.Klabunde CN, Potosky AL, Legler JM, Warren JL. Development of a comorbidity index using physician claims data. J Clin Epidemiol. 2000;53(12):1258-67. doi: 10.1016/s0895-4356(00)00256-0 [DOI] [PubMed] [Google Scholar]
- 24.Greer JA, Amoyal N, Nisotel L, et al. A systematic review of adherence to oral antineoplastic therapies. Oncologist. 2016;21:354-76. doi: 10.1634/theoncologist.2015-0405 [DOI] [PMC free article] [PubMed] [Google Scholar]
- 25.Mathes T, Pieper D, Antoine S, Eikermann M. Adherence influencing factors in patients taking oral anticancer agents: A systematic review. Cancer Epidemiol. 2014;38(3):214-26. doi: 10.1016/j.canep.2014.03.012 [DOI] [PubMed] [Google Scholar]
- 26.Kadan-Lottick NS, Vanderwerker LC, Block SD, Zhang B, Prigerson HG. Psychiatric disorders and mental health service use in patients with advanced cancer: A report from the Coping with Cancer study. Cancer. 2005;104:2872-81. doi: 10.1002/cncr.21532 [DOI] [PMC free article] [PubMed] [Google Scholar]
- 27.Iglay K, Santorelli ML, Hirshfield KM, et al. Diagnosis and treatment delays among elderly breast cancer patients with pre-existing mental illness. Breast Cancer Res Treat. 2017;166:267-75. doi: 10.1007/s10549-017-4399-x [DOI] [PubMed] [Google Scholar]
- 28.Braun IM, Rao SR, Meyer FL, Fedele G. Patterns of psychiatric medication use among nationally representative long-term cancer survivors and controls. Cancer. 2015;121:132-38. doi: 10.1002/cncr.29014 [DOI] [PubMed] [Google Scholar]
- 29.Doshi JA, Jahnke J, Raman S, et al. Treatment utilization patterns of newly initiated oral anticancer agents in a national sample of Medicare beneficiaries. J Manag Care Spec Pharm. 2021;27(10):1457-68. doi: 10.18553/jmcp.2021.27.10.1457 [DOI] [PMC free article] [PubMed] [Google Scholar]
- 30.Vallathol SH. A study of adherence to oral temozolomide chemotherapy in central nervous system tumors. Ann Oncol. 2018;29(Supp 9):IX137-38. doi: 10.1093/annonc/mdy444.029 [DOI] [Google Scholar]
- 31.Tsang J, Rudychev I, Pescatore SL. Prescription compliance and persistency in chronic myelogenous leukemia (CML) and gastrointestinal stromal tumor (GIST) patients on imatinib. J Clin Oncol. 2006;24(18 suppl):6119. doi: 10.1200/jco.2006.24.18suppl.6119 [DOI] [Google Scholar]
- 32.Thomas A, Rajan A, Giaccone G. Tyrosine kinase inhibitors in lung cancer. Hematol Oncol Clin North Am. 2012;26(3):589-605. doi: 10.1016/j.hoc.2012.02.001 [DOI] [PMC free article] [PubMed] [Google Scholar]
- 33.Nishida T, Doi T, Naito Y. Tyrosine kinase inhibitors in the treatment of unresectable or metastatic gastrointestinal stromal tumors. Expert Opin Pharmacother. 2014;15(14):1979-89. doi: 10.1517/14656566.2014.937707 [DOI] [PubMed] [Google Scholar]
- 34.Huang L, Jiang S, Shi Y. Tyrosine kinase inhibitors for solid tumors in the past 20 years (2001-2020). J Hematol Oncol. 2020;13(1):143. doi: 10.1186/s13045-020-00977-0 [DOI] [PMC free article] [PubMed] [Google Scholar]
- 35.Shen C, Zhao B, Liu L, Shih YT. Adherence to tyrosine kinase inhibitors among Medicare Part D beneficiaries with chronic myeloid leukemia. Cancer. 2018;124(2):364-73. doi: 10.1002/cncr.31050 [DOI] [PMC free article] [PubMed] [Google Scholar]
- 36.Goulart BH, Under JM, Chennupati S, Fedorenko CR, Ramsey SD. Out-of-pocket costs for tyrosine kinase inhibitors and patient outcomes in EGFR- and ALKpositive advanced non-small-cell lung cancer. JCO Oncol Pract. 2021;17(2): e130-39. doi: 10.1200/OP.20.00692 [DOI] [PMC free article] [PubMed] [Google Scholar]
- 37.Goldstein DA. Financial toxicity in cancer care: Edging toward solutions. Cancer. 2017;123:1301-02. doi: 10.1002/cncr.30555 [DOI] [PubMed] [Google Scholar]
- 38.de Souza JA, Yap BJ, Wroblewski K, et al. Measuring financial toxicity as a clinically relevant patient-reported outcome: The validation of the Comprehensive Score for Financial Toxicity (COST). Cancer. 2017;123:476-84. doi: 10.1002/cncr.30369 [DOI] [PMC free article] [PubMed] [Google Scholar]
- 39.Betcher J, Dow E, Khera N. Oral chemotherapy in patients with hematological malignancies-care process, pharmacoeconomic and policy implications. Curr Hematol Malig Rep. 2016;11:288-94. doi: 10.1007/s11899-016-0325-2 [DOI] [PubMed] [Google Scholar]
- 40.Roberts MC, Wheeler SB, Reeder-Hayes K. Racial/ethnic and socioeconomic disparities in endocrine therapy adherence in breast cancer: A systematic review. Am J Public Health. 2015;105(Suppl 3):e4-15. doi: 10.2105/AJPH.2014.302490 [DOI] [PMC free article] [PubMed] [Google Scholar]
- 41.de Almeida MH, Pagnano KB, Vigorito AC, Lorand-Metze I, de Souza CA. Adherence to tyrosine kinase inhibitor therapy for chronic myeloid leukemia: A Brazilian single-center cohort. Acta Haematol. 2013;130(1):16-22. doi: 10.1159/000345722 [DOI] [PubMed] [Google Scholar]
- 42.Kircher SM, Meeker CR, Nimeiri H, et al. The parity paradigm: Can legislation help reduce the cost burden of oral anticancer medications? Value Health. 2016;19(2016):88-98. doi: 10.1016/j.jval.2015.10.005 [DOI] [PubMed] [Google Scholar]
- 43.Fendrick AM, Buxbaum J, Westrich K. Supporting consumer access to specialty medications through value-based insurance design. Accessed December 20, 2021. https://www.npcnow.org/resources/value-value-based-insurance-design
- 44.Cavallo J. ASCO develops new strategy to increase value in cancer care. Accessed December 20, 2021. https://ascopost.com/issues/may-15-2014/asco-develops-new-strategy-to-increase-value-in-cancer-care.aspx
- 45.Klaisner J, Pierce K, Cires A. The Build Back Better (BBB) Act: Brief summary of Medicare Parts B & D Changes. Milliman Report, November 2021. Accessed December 20, 2021. https://us.milliman.com/en/insight/the-build-back-better-act-medicare-parts-b-and-d-key-changes