

Abstract
BACKGROUND:
Limited data are available on health care resource utilization (HCRU) and health care costs of calcitonin gene–related peptide monoclonal antibodies (CGRP mAbs) for preventive treatment of migraine.
OBJECTIVE:
To compare all-cause and migraine-related HCRU and direct health care costs in patients with migraine initiating CGRP mAbs, galcanezumab (GMB), vs standard-of-care (SOC) preventive treatments in the United States.
METHODS:
This retrospective observational study used insurance claims data collected from IBM MarketScan Research Databases. Adults (aged ≥ 18 years) with 1 or more claims for CGRP mAb (GMB, erenumab, or fremanezumab) or SOC preventive treatment between May 1, 2018, and June 30, 2019, were included. The date of earliest migraine treatment claim during this period was the index date. Annual all-cause and migraine-related HCRU included inpatient visits, emergency department visits, and acute and preventive migraine medication fills. After matching, HCRU and costs at 6- and 12-month follow-up in CGRP mAb, specifically GMB, vs SOC cohorts were analyzed using paired t-test and chi-square test.
RESULTS:
In the 12-month follow-up study, 4,528 patients using CGRP mAb (GMB, n = 426) and 10,897 patients using SOC were included. After matching, 3,082 pairs were identified in the CGRP mAb and SOC cohorts and 421 pairs in the GMB and SOC cohorts. After matching, all variables were well balanced across cohorts. At 12-month follow-up, the percentage decrease in acute and preventive migraine medication fills was significantly greater in the CGRP mAb (acute: −1.5% vs −0.2%, P < 0.001; preventive: −1.1% vs 3.8, P < 0.001) and GMB cohorts (acute: −1.5% vs −0.2%, P = 0.002; preventive: −1.8 vs 3.0, P < 0.001) compared with the SOC cohort. At follow-up, compared with the SOC cohort, the mean change of annual all-cause total costs was significantly higher in both the CGRP mAb ($6,043 vs $1,323, P < 0.001) and GMB cohorts ($8,398 vs $68, P < 0.001), and the mean change of annual migraine-related total costs was significantly higher in both the CGRP mAb ($3,416 vs $976, P < 0.001) and GMB cohorts ($4,334 vs $1,245, P < 0.001). Significant cost savings in mean acute and preventive migraine prescription costs occurred in both the CGRP mAb (acute: −$358 vs −$80, P < 0.001; preventive: −$298 vs $1,376, P < 0.001) and GMB cohorts (acute: −$280 vs −$36, P = 0.034; preventive: −$374 vs $1,537, P < 0.001) compared with the SOC cohort.
CONCLUSIONS:
Although treatment with CGRP mAbs and GMB increase total costs, they may lead to significantly greater cost savings in outpatient acute and preventive migraine medication costs vs SOC. Further studies assessing indirect health care costs are important to understand additional cost savings with CGRP mAbs.
Plain language summary
In this study, patients taking calcitonin gene–related peptide monoclonal antibody (CGRP mAb) or galcanezumab (one of the CGRP mAbs) had higher costs than patients on standard of care (SOC). CGRP mAb and galcanezumab users had fewer outpatient acute and preventive migraine drug fills than SOC users. Because of the reduced number of outpatient acute and preventive migraine drug fills, significant cost savings occurred among CGRP mAb and galcanezumab users in their respective cohorts compared with patients on SOC treatment.
Implications for managed care pharmacy
The results of our study suggest that initiation of CGRP mAbs, specifically galcanezumab, reduces the consumption of acute and preventive migraine medications among patients with migraine. Although CGRP mAb use increases total costs, reduced consumption of acute and preventive migraine medications helps with cost saving. Further studies are warranted to understand the effect of CGRP mAbs on indirect costs. The results of our study may help health care practitioners select appropriate preventive medications for migraine.
Migraine is a neurological disease characterized by recurrent, throbbing, and often unilateral headache, nausea, vomiting, and increased sensitivity to light, sound, or head movement.1 In the United States, the age-adjusted prevalence of migraine and severe headache (2018 estimates) was 15.9% across all adults; 21% of women and 10.7% men were affected.2 Migraine has a high health care resource and cost burden, which is evident by more than 4 million migraine-related emergency department (ED) visits and annual direct health care costs of $22,364 per person in 2016 (inflated to 2019 US dollar).2,3
Acute and preventive treatments are recommended to reduce the burden of migraine and its economic impact.4 According to the American Headache Society 2019 and 2021 position statements and expert consensus by Lipton et al, preventive treatment is recommended for those patients with frequent attacks, attacks that impact quality of life, contraindication, failure or overuse of acute medications, or adverse events with acute medications.4-6 Preventive medications used for migraine are categorized by the American Academy of Neurology (AAN) as follows: antiepileptic drugs, β-blockers, triptans, antidepressants, angiotensin-converting enzyme inhibitors, angiotensin receptor blockers, and α-agonists.7 However, most preventive medications recommended by the AAN were not specifically developed to treat migraine.7 Moreover, patients receiving these conventional preventive medications often have inconsistent efficacy, adverse effects, or contraindications.5
In 2018, the US Food and Drug Administration (FDA) approved calcitonin gene–related peptide monoclonal antibodies (CGRP mAbs), including erenumab, fremanezumab, and galcanezumab (GMB), for migraine prevention.8-10 To date, limited data are available on health care resource utilization (HCRU) and health care costs associated with migraine for CGRP mAbs.11,12 This study compared the change in all-cause and migraine-related HCRU and direct health care costs from 6- and 12-month follow-up in the CGRP mAb cohort vs the standard-of-care (SOC) preventive treatment cohort and, specifically, GMB vs the SOC cohort.
Methods
STUDY DESIGN AND DATA SOURCES
This was a retrospective observational study that used insurance claims data to describe 6 month and 12-month HCRU and direct costs in patients with migraine in the United States who were treated with CGRP mAbs (GMB, erenumab, or fremanezumab) as compared with SOC migraine preventive treatments. SOC consisted of drugs with established efficacy (level A drugs), drugs that are probably effective (level B drugs), and other nonspecific drugs (onabotulinumtoxinA; Supplementary Tables 1 and 2 (887.8KB, pdf) , available in online article) per AAN guidelines. The National Drug Codes list was taken from First Databank. Because the FDA approved eptinezumab in 2020 and rimegepant and atogepant in 2021, and real-world clinical practice or fully adjudicated data were lacking for these drugs during the study period, we excluded them from the current study.
Data were collected using insurance claims from the IBM MarketScan Research Databases: The Commercial Claims and Encounters and the Medicare Supplemental databases. The databases include health care experience of approximately 27 million unique individuals obtained annually and contain inpatient (IP), outpatient (OP), and pharmacy claims, providing a complete assessment of patients’ treatment patterns and clinical outcomes. All study data were compliant with the US patient confidentiality requirements, including the Health Insurance Portability and Accountability Act (HIPAA) of 1996 regulations. Because all databases used in the study were fully deidentified and compliant with the HIPAA, this study did not require institutional review board approval.
STUDY POPULATION
Adults (aged ≥ 18 years) with 1 or more claims for a CGRP mAb (GMB, erenumab, or fremanezumab) or SOC preventive treatment between May 1, 2018, and June 30, 2019, were included. The date of earliest migraine treatment claim during this period was the index date, and the drug claimed was the index drug. The CGRP mAb cohort included all patients with index drug of GMB, erenumab, or fremanezumab, whereas the SOC cohort included all patients with index drug of non-CGRP mAb preventive treatment. The GMB cohort was a subset of the CGRP mAb cohort. Other inclusion criteria were continuous enrollment in medical and pharmacy benefits for greater than or equal to 12 month pre-index and 12-month post-index period, 1 or more IP or 2 or more OP claims with a migraine diagnosis (International Classification of Diseases, Tenth Revision, Clinical Modification [ICD-10-CM] codes in G43.xx range) during the 12-month pre-index period (Supplementary Figure 1 (887.8KB, pdf) ). A subset of patients with continuous enrollment for the 6-month post-index period was also identified (Supplementary Figure 2 (887.8KB, pdf) ). Patients with evidence of the index drugs during the 12 month pre-index period or multiple index drugs on the index date were excluded.
MEASURES
Baseline Demographics and Clinical Characteristics. Baseline demographic characteristics measured on the index date were age, sex, geographical region, insurance plan type, and provider type. Provider type was a proxy measure from the closest nonpharmacy claim to the index date within 45 days of the index date in either direction and was categorized as neurology, primary care, acute hospital care or ED, radiology/laboratory/pathology, and other/unknown. Primary care provider included family practice, internal medicine, obstetrics/gynecology, and nurse practitioner. Baseline clinical characteristics such as Deyo-Charlson Comorbidity Index and comorbid medical conditions were measured during the 12-month pre-index period. Comorbid medical conditions were identified by the presence of one or more IP or nondiagnostic OP medical claims with an ICD-10-CM diagnosis code in any position. Comorbid conditions observed in greater than or equal to 10% of patients in either of the cohorts were reported.
HCRU and Costs. Annual all-cause and migraine-related HCRU included IP visits, ED visits, and acute migraine medication fills. Annual all-cause and migraine-related health care costs were categorized as medical, pharmacy, and total costs. All US dollar estimates were inflated to 2019 dollars using the Medical Care Component of the Consumer Price Index. Annual all-cause or migraine-related total costs were the sum of health care costs incurred from IP visits, OP visits, ED visits, imaging, laboratory, procedures, and pharmacy. Medical costs were the sum of health care costs incurred during IP visits and OP visits. Pharmacy costs were health care costs from OP fills.
Migraine-related HCRU and costs were based on IP admissions with a primary diagnosis of migraine, OP medical claims with a migraine diagnosis, procedure codes (magnetic resonance imaging, computed tomography, electroencephalography, and electrocardiography), and migraine-related pharmacy claims. Health care costs were based on paid amounts of adjudicated claims, including insurer and health plan payments as well as patient cost-sharing in the form of copayment, deductible, and coinsurance. Costs for services provided under capitated arrangements were estimated using payment proxies based on paid claims at the procedure level using the MarketScan Commercial and Medicare Supplemental Databases. HCRU and costs were reported per patient per month (PPPM) for the 6-month follow-up period and annualized for the 12-month follow-up period.
STATISTICAL ANALYSES
Descriptive analyses, using frequencies with percentages for categorical variables and means with SDs for continuous variables, were conducted for demographic and clinical characteristics at the baseline period. To address confounding between the 2 treatment cohorts, propensity score (PS) matching was used to match (1:1) CGRP mAb and SOC cohorts and, specifically, GMB and SOC cohorts, for both the 12-month and 6-month follow-up. PS was estimated using logistic regression with receipt of CGRP mAb or specifically GMB (yes/no) as the dependent variable and prior period characteristics including age, sex, region, plan type, provider type, number of unique preventive migraine classes, Deyo-Charlson Comorbidity Index, and select comorbid conditions as the independent variables. PS was estimated prior to assessing outcomes using greedy matching with a caliper of 0.25 and without replacement. The validity of the PS adjustment was assessed by graphically examining the overlap in PSs and comparing balance in all baseline characteristics across treatment and cohorts via standardized differences and variance ratios. A standardized difference less than or equal to 10% in absolute value and variance ratio within the range of 0.55 and 2 was used to denote balance in baseline characteristics between the cohorts. PS matchings were finalized before the outcome analyses were conducted. After PS matching, cohorts were assessed for balance across all covariates included in the PS models using a standardized difference (std diff) within 0.02. All-cause and migraine related HCRU were reported as number and proportion of patients with IP and ED visits after PS matching. Annual all-cause and migraine related HCRU and costs at 12-month follow-up vs 12-month pre-index period were compared among CGRP mAb, specifically GMB, or SOC initiators. Annual all cause HCRU were reported as number and proportion of patients with annual all-cause IP and annual all-cause ED visits. Annual migraine-related HCRU was reported as number and proportion of patients with migraine-related IP visits, migraine-related ED visits, acute migraine medication prescription fills, and preventive migraine medication prescription fills. Annual all-cause and migraine-related HCRU and costs at 12- or 6-month follow-up vs 12- or 6-month pre-index period, and CGRP mAb vs SOC and specifically GMB vs SOC cohorts, were assessed using a paired t-test for continuous variables and chi-square test for categorical variables after PS matching. All analyses were performed using WPS analytics, version 4.1 (World Programming) and R version 3.6.3 (R Foundation for Statistical Computing).
Results
BASELINE CHARACTERISTICS
In this 12-month follow-up study, 4,528 patients using CGRP mAbs (GMB, n = 426) and 10,897 patients using SOC were identified (Supplementary Figure 1 (887.8KB, pdf) ). Before matching, patients in the CGRP mAb cohort (45.1 years, std diff = 0.32) were older than those in the SOC cohort (41.3 years; Table 1). The proportion of patients visiting a neurologist close to the index date was greater in the CGRP mAb cohort than in the SOC cohort (31.2% vs 25.9%, std diff = 0.12). A smaller proportion of patients in the CGRP mAb cohort (22.6%, std diff = 0.43) visited primary care compared with the SOC cohort (42.0%). Rates of chronic migraine were higher in the CGRP mAb cohort (69.0%, std diff = 1.10) than in the SOC cohort (21.6%).
TABLE 1.
Patient Demographics and Clinical Characteristics Before and After Matching During the 12-Month Follow-up Period (CGRP mAbs vs SOC)
| Characteristics | CGRP mAb (N=4,528) | SOC (N=10,897) | Std diff | CGRP mAb (N=3,082) | SOC (N=3,082) | Std diff |
|---|---|---|---|---|---|---|
| Before matching | After matching | |||||
| Age, mean (SD), years | 45.1 (11.3) | 41.3 (12.3) | 0.32 | 44.4 (11.3) | 44.2 (12.0) | 0.02 |
| Sex, n (%) | ||||||
| Male | 624 (13.8) | 1,622 (14.9) | 0.03 | 441 (14.3) | 406 (13.2) | 0.03 |
| Female | 3,904 (86.2) | 9,275 (85.1) | 0.03 | 2,641 (85.7) | 2,676 (86.8) | 0.03 |
| Geographic region, n (%) | ||||||
| Northeast | 1,071 (23.7) | 1,726 (15.8) | 0.20 | 679 (22.0) | 500 (16.2) | 0.15 |
| North Central | 930 (20.5) | 2,476 (22.7) | 0.05 | 617 (20.0) | 713 (23.1) | 0.08 |
| South | 1,899 (41.9) | 5,246 (48.1) | 0.12 | 1,354 (43.9) | 1,424 (46.2) | 0.05 |
| West | 617 (13.6) | 1,427 (13.1) | 0.02 | 427 (13.9) | 435 (14.1) | 0.01 |
| Unknown | 11 (0.2) | 22 (0.2) | 0.01 | 5 (0.2) | 10 (0.3) | 0.03 |
| Insurance plan type, n (%) | ||||||
| Comprehensive/indemnity | 153 (3.4) | 415 (3.8) | 0.02 | 105 (3.4) | 101 (3.3) | 0.01 |
| EPO/PPO | 2,604 (57.5) | 5,653 (51.9) | 0.11 | 1,734 (56.3) | 1,730 (56.1) | 0.00 |
| POS/POS with capitation | 273 (6.0) | 712 (6.5) | 0.02 | 198 (6.4) | 169 (5.5) | 0.04 |
| HMO | 500 (11.0) | 1,480 (13.6) | 0.08 | 339 (11.0) | 345 (11.2) | 0.01 |
| CDHP/HDHP | 960 (21.2) | 2,495 (22.9) | 0.04 | 674 (21.9) | 694 (22.5) | 0.02 |
| Other/unknown | 38 (0.8) | 142 (1.3) | 0.05 | 32 (1.0) | 43 (1.4) | 0.03 |
| Provider type, n (%) | ||||||
| Neurology | 1,414 (31.2) | 2,827 (25.9) | 0.12 | 944 (30.6) | 993 (32.2) | 0.03 |
| Primary carea | 1,022 (22.6) | 4,578 (42.0) | 0.43 | 800 (26.0) | 771 (25.0) | 0.02 |
| Acute care hospital, ED | 310 (6.8) | 549 (5.0) | 0.08 | 186 (6.0) | 188 (6.1) | 0.00 |
| Radiology, laboratory, pathology | 201 (4.4) | 283 (2.6) | 0.10 | 132 (4.3) | 90 (2.9) | 0.07 |
| Other/unknown | 1,581 (34.9) | 2,660 (24.4) | 0.23 | 1,020 (33.1) | 1,040 (33.7) | 0.01 |
| DCI, mean (SD) | 0.4 (0.9) | 0.4 (0.9) | 0.03 | 0.5 (0.9) | 0.4 (0.9) | 0.01 |
| Comorbid medical conditions, n (%) | ||||||
| Chronic migraine | 3,125 (69.0) | 2,355 (21.6) | 1.08 | 1,749 (56.7) | 1,690 (54.8) | 0.04 |
| Anxiety | 1,483 (32.8) | 3,496 (32.1) | 0.01 | 1,011 (32.8) | 1,023 (33.2) | 0.01 |
| Sleep disorder | 1,272 (28.1) | 2,214 (20.3) | 0.18 | 841 (27.3) | 778 (25.2) | 0.05 |
| Depression | 1,249 (27.6) | 2,573 (23.6) | 0.09 | 820 (26.6) | 828 (26.9) | 0.01 |
| Hypertension | 1,140 (25.2) | 2,729 (25.0) | 0.00 | 798 (25.9) | 810 (26.3) | 0.01 |
| Nausea | 816 (18.0) | 1,993 (18.3) | 0.01 | 564 (18.3) | 563 (18.3) | 0.00 |
| Obesity | 650 (14.4) | 1,772 (16.3) | 0.05 | 454 (14.7) | 519 (16.8) | 0.06 |
| Asthma | 594 (13.1) | 1,227 (11.3) | 0.06 | 424 (13.8) | 330 (10.7) | 0.09 |
| Osteoarthritis | 517 (11.4) | 909 (8.3) | 0.10 | 317 (10.3) | 331 (10.7) | 0.01 |
Covariates with std diff greater than or equal to 0.1 are bolded, suggesting potential imbalance between cohorts. The 1:1 ratio propensity score–matched CGRP mAb and SOC cohorts were well balanced.
a Includes family practice, internal medicine, obstetrics/gynecology, and nurse practitioner.
CDHP = consumer-driven health plan; CGRP = calcitonin gene–related peptide; DCI = Deyo-Charlson Comorbidity Index; ED = emergency department; EPO = exclusive provider organization; HDHP = high-deductible health plan; HMO=health maintenance organization; mAb=monoclonal antibody; POS=point of service; PPO = preferred provider organization; SOC = standard of care; std diff = standardized difference.
Before matching, patients in the GMB cohort (43.8 years, std diff = 0.21) were older than those in the SOC cohort (41.3 years) (Table 2). A smaller proportion of patients in the GMB cohort (26.1%, std diff = 0.34) visited primary care than the SOC cohort (42.0%). Rates of chronic migraine were higher in the GMB cohort (58.5%, std diff = 0.81) than in the SOC cohort (21.6%).
TABLE 2.
Patient Demographics and Clinical Characteristics Before and After Matching During the 12-Month Follow-up Period (GMB vs SOC)
| Characteristics | GMB (N = 426) | SOC (N = 10,897) | Std diff | GMB (N = 421) | SOC (N =421) | Std diff |
|---|---|---|---|---|---|---|
| Before matching | After matching | |||||
| Age, mean (SD), years | 43.8 (11.4) | 41.3 (12.3) | 0.21 | 43.7 (11.4) | 43.2 (11.8) | 0.05 |
| Sex, n (%) | ||||||
| Male | 58 (13.6) | 1,622 (14.9) | 0.04 | 58 (13.8) | 48 (11.4) | 0.07 |
| Female | 368 (86.4) | 9,275 (85.1) | 0.04 | 363 (86.2) | 373 (88.6) | 0.07 |
| Geographic region, % | ||||||
| Northeast | 65 (15.3) | 1,726 (15.8) | 0.02 | 65 (15.4) | 73 (17.3) | 0.05 |
| North Central | 93 (21.8) | 2,476 (22.7) | 0.02 | 92 (21.9) | 85 (20.2) | 0.04 |
| South | 216 (50.7) | 5,246 (48.1) | 0.05 | 212 (50.4) | 207 (49.2) | 0.02 |
| West | 51 (12.0) | 1,427 (13.1) | 0.03 | 51 (12.1) | 56 (13.3) | 0.04 |
| Unknown | 1 (0.2) | 22 (0.2) | 0.01 | 1 (0.2) | 0 (0.0) | 0.07 |
| Insurance plan type, n (%) | ||||||
| Comprehensive/indemnity | 22 (5.2) | 415 (3.8) | 0.07 | 22 (5.2) | 11 (2.6) | 0.13 |
| EPO/PPO | 219 (51.4) | 5,653 (51.9) | 0.01 | 216 (51.3) | 214 (50.8) | 0.01 |
| POS/POS with capitation | 18 (4.2) | 712 (6.5) | 0.10 | 18 (4.3) | 24 (5.7) | 0.07 |
| HMO | 51 (12.0) | 1,480 (13.6) | 0.05 | 51 (12.1) | 39 (9.3) | 0.09 |
| CDHP/HDHP | 113 (26.5) | 2,495 (22.9) | 0.08 | 111 (26.4) | 129 (30.6) | 0.09 |
| Other/unknown | 3 (0.7) | 142 (1.3) | 0.06 | 3 (0.7) | 4 (1.0) | 0.03 |
| Provider type, n (%) | ||||||
| Neurology | 127 (29.8) | 2,827 (25.9) | 0.09 | 126 (29.9) | 140 (33.3) | 0.07 |
| Primary carea | 111 (26.1) | 4,578 (42.0) | 0.34 | 111 (26.4) | 111 (26.4) | 0.00 |
| Acute care hospital, ED | 40 (9.4) | 549 (5.0) | 0.17 | 38 (9.0) | 33 (7.8) | 0.04 |
| Radiology, laboratory, pathology | 19 (4.5) | 283 (2.6) | 0.10 | 18 (4.3) | 9 (2.1) | 0.12 |
| Other/unknown | 129 (30.3) | 2,660 (24.4) | 0.13 | 128 (30.4) | 128 (30.4) | 0.00 |
| DCI, mean (SD) | 0.5 (1.1) | 0.4 (0.9) | 0.11 | 0.5 (1.1) | 0.6 (1.1) | 0.04 |
| Comorbid medical conditions, n (%) | ||||||
| Chronic migraine | 249 (58.5) | 2,355 (21.6) | 0.81 | 245 (58.2) | 251 (59.6) | 0.03 |
| Anxiety | 134 (31.5) | 3,496 (32.1) | 0.01 | 132 (31.4) | 130 (30.9) | 0.01 |
| Sleep disorder | 124 (29.1) | 2,214 (20.3) | 0.20 | 122 (29.0) | 118 (28.0) | 0.02 |
| Depression | 116 (27.2) | 2,573 (23.6) | 0.08 | 116 (27.6) | 112 (26.6) | 0.02 |
| Hypertension | 109 (25.6) | 2,729 (25.0) | 0.01 | 107 (25.4) | 98 (23.3) | 0.05 |
| Nausea | 65 (15.3) | 1,993 (18.3) | 0.08 | 65 (15.4) | 76 (18.1) | 0.07 |
| Obesity | 62 (14.6) | 1,772 (16.3) | 0.05 | 62 (14.7) | 78 (18.5) | 0.10 |
| Asthma | 56 (13.1) | 1,227 (11.3) | 0.06 | 54 (12.8) | 45 (10.7) | 0.07 |
| Osteoarthritis | 44 (10.3) | 909 (8.3) | 0.07 | 43 (10.2) | 50 (11.9) | 0.05 |
Covariates with std diff greater than or equal to 0.1 are bolded, suggesting potential imbalance between cohorts. The 1:1 ratio propensity score–matched GMB and SOC cohorts were well balanced.
a Includes family practice, internal medicine, obstetrics/gynecology, and nurse practitioner.
CDHP = consumer-driven health plan; DCI = Deyo-Charlson Comorbidity Index; ED = emergency department; EPO = exclusive provider organization; GMB = galcanezumab; HDHP = high-deductible health plan; HMO = health maintenance organization; POS = point of service; PPO = preferred provider organization; SOC = standard of care; std diff = standardized difference.
After matching, 3,082 patient pairs were identified in the CGRP mAb and SOC cohorts (Table 1). The GMB and SOC cohorts included 421 patient pairs (Table 2). Across all cohorts, after matching, all variables were well balanced (std diff range: 0.00-0.15; Tables 1 and 2).
HCRU
CGRP mAb vs SOC After PS Matching. During the 12-month follow-up period, both CGRP mAb and SOC cohorts had a statistically significant decrease in the percentage of patients with annual all-cause ED visits (CGRP mAb: 35.3% vs 32.0%, P = 0.001; SOC: 40.7% vs 37.3%, P = 0.001) and mean (SD) number of annual all-cause ED visits (CGRP mAb: 0.8 [4.9] vs 0.7 [1.9], P = 0.033; SOC: 0.9 [1.9] vs 0.8 [2.1], P = 0.009) from baseline to follow-up. In the SOC cohort, the percentage of patients with annual all-cause IP visits (9.8% vs 7.0%, P < 0.001) decreased significantly from baseline (Table 3).
TABLE 3.
Annual All-Cause and Migraine-Related HCRU at 12-Month Baseline and 12-Month Follow-up Periods (CGRP mAbs vs SOC and GMB vs SOC)
| CGRP mAb vs SOC | |||||||||
|---|---|---|---|---|---|---|---|---|---|
| 12-month baseline period | 12-month follow-up period | P value (baseline period vs follow-up period) | Mean change (baseline period vs follow-up period), % | P value (mean change) CGRP mAb vs SOC | |||||
| CGRP mAb (N = 3,082) | SOC (N = 3,082) | CGRP mAb (N = 3,082) | SOC (N = 3,082) | CGRP mAb | SOC | CGRP mAb | SOC | ||
| Annual all-cause HCRU | |||||||||
| IP visits | |||||||||
| Patients, n (%) | 210 (6.8) | 302 (9.8) | 204 (6.6) | 217 (7.0) | 0.730 | < 0.001 | −0.200 | −2.800 | 0.003 |
| Visits, mean (SD) | 0.1 (0.4) | 0.1 (0.5) | 0.1 (0.4) | 0.1 (0.4) | 0.901 | < 0.001 | −0.001 | −0.040 | 0.002 |
| ED visits | |||||||||
| Patients, n (%) | 1,087 (35.3) | 1,254 (40.7) | 987 (32.0) | 1,149 (37.3) | 0.001 | 0.001 | −3.200 | −3.400 | 0.911 |
| Visits, mean (SD) | 0.8 (4.9) | 0.9 (1.9) | 0.7 (1.9) | 0.8 (2.1) | 0.033 | 0.009 | −0.200 | −0.100 | 0.399 |
| Annual migraine-related HCRU | |||||||||
| IP visits | |||||||||
| Patients, n (%) | 58 (1.9) | 32 (1.0) | 39 (1.3) | 8 (0.3) | 0.022 | < 0.001 | −0.600 | −0.800 | 0.625 |
| Visits, mean (SD) | 0.02 (0.19) | 0.01 (0.11) | 0.01 (0.14) | 0.004 (0.08) | 0.006 | 0.001 | −0.009 | −0.007 | 0.635 |
| ED visits | |||||||||
| Patients, n (%) | 561 (18.2) | 562 (18.2) | 354 (11.5) | 393 (12.8) | < 0.001 | < 0.001 | −6.700 | −5.500 | 0.270 |
| Visits, mean (SD) | 0.41 (3.90) | 0.30 (0.86) | 0.24 (1.39) | 0.23 (1.36) | 0.006 | 0.001 | −0.200 | −0.100 | 0.115 |
| Acute migraine medication fills | |||||||||
| Patients, n (%) | 2,820 (91.5) | 2,568 (83.3) | 2,676 (86.8) | 2,504 (81.2) | < 0.001 | 0.009 | −4.700 | −2.100 | 0.010 |
| Fills, mean (SD) | 10.00 (12.23) | 6.09 (7.64) | 8.49 (13.35) | 5.86 (7.79) | < 0.001 | 0.024 | −1.500 | −0.200 | < 0.001 |
| Preventive migraine medication fills | |||||||||
| Patients, n (%) | 2,570 (83.4) | 2,406 (78.1) | 2,226 (72.2) | 3,082 (100.0) | < 0.001 | < 0.001 | −11.200 | 21.900 | < 0.001 |
| Fills, mean (SD) | 7.52 (8.11) | 5.05 (6.01) | 6.38 (7.87) | 8.81 (7.62) | < 0.001 | < 0.001 | −1.100 | 3.800 | < 0.001 |
| GMB vs SOC | |||||||||
| 12-month baseline period | 12-month follow-up period | P value (baseline period vs follow-up period) | Mean change (baseline period vs follow-up period), % | P value (mean change) GMB vs SOC | |||||
| GMB (N = 421) | SOC (N = 421) | GMB (N = 421) | SOC (N = 421) | GMB | SOC | GMB | SOC | ||
| Annual all-cause HCRU | |||||||||
| IP visits | |||||||||
| Patients, n (%) | 26 (6.2) | 51 (12.1) | 28 (6.7) | 28 (6.7) | 0.746 | 0.002 | 0.500 | −5.500 | 0.009 |
| Visits, mean (SD) | 0.07 (0.31) | 0.17 (0.61) | 0.09 (0.39) | 0.08 (0.35) | 0.508 | 0.003 | 0.000 | −0.100 | 0.005 |
| ED visits | |||||||||
| Patients, n (%) | 146 (34.7) | 183 (43.5) | 132 (31.4) | 159 (37.8) | 0.240 | 0.043 | −3.300 | −5.700 | 0.551 |
| Visits, mean (SD) | 0.66 (1.47) | 1.02 (2.50) | 0.54 (1.41) | 0.95 (2.30) | 0.034 | 0.493 | −0.100 | −0.100 | 0.730 |
| Annual migraine-related HCRU | |||||||||
| IP visits | |||||||||
| Patients, n (%) | 4 (1.0) | 8 (1.9) | 6 (1.4) | 3 (0.7) | 0.527 | 0.059 | 0.500 | −1.200 | 0.090 |
| Visits, mean (SD) | 0.01 (0.13) | 0.02 (0.14) | 0.01 (0.12) | 0.01 (0.16) | 0.782 | 0.366 | 0.002 | −0.007 | 0.415 |
| ED visits | |||||||||
| Patients, n (%) | 73 (17.3) | 88 (20.9) | 36 (8.6) | 58 (13.8) | < 0.001 | 0.002 | −8.800 | −7.100 | 0.589 |
| Visits, mean (SD) | 0.28 (1.09) | 0.32 (0.85) | 0.16 (1.14) | 0.24 (0.81) | < 0.001 | 0.086 | −0.100 | −0.100 | 0.354 |
| Acute migraine medication fills | |||||||||
| Patients, n (%) | 377 (89.5) | 353 (83.8) | 351 (83.4) | 347 (82.4) | 0.001 | 0.513 | −6.200 | −1.400 | 0.094 |
| Fills, mean (SD) | 8.73 (10.03) | 6.87 (8.01) | 7.24 (9.93) | 6.67 (8.25) | <0.001 | 0.513 | −1.500 | −0.200 | 0.002 |
| Preventive migraine medication fills | |||||||||
| Patients, n (%) | 380 (90.3) | 356 (84.6) | 322 (76.5) | 421 (100.0) | < 0.001 | < 0.001 | −13.800 | 15.400 | < 0.001 |
| Fills, mean (SD) | 9.3 (8.4) | 6.9 (6.7) | 7.5 (8.2) | 9.9 (7.6) | < 0.001 | < 0.001 | −1.800 | 3.000 | < 0.001 |
CGRP = calcitonin gene–related peptide; ED = emergency department; GMB = galcanezumab; HCRU = health care resource utilization; IP = inpatient; mAb = monoclonal antibody; SOC = standard of care.
Both cohorts had a statistically significant decrease in mean (SD) number of annual migraine-related IP visits (CGRP mAb: 0.02 [0.19] vs 0.01 [0.14], P = 0.006; SOC: 0.01 [0.11] vs 0.004 [0.08], P = 0.001), mean (SD) number of annual migraine-related ED visits (CGRP mAb: 0.41 [3.90] vs 0.24 [1.39], P = 0.006; SOC: 0.30 [0.86] vs 0.23 [1.36], P = 0.001), mean (SD) number of outpatient acute migraine medication fills (CGRP mAb: 10.00 [12.23] vs 8.49 [13.35], P < 0.001; SOC: 6.09 [7.64] vs 5.86 [7.79], P = 0.024), and preventive migraine medication fills (CGRP mAb: 7.52 [8.11] vs 6.38 [7.87]; SOC: 5.05 [6.01] vs 8.81 [7.62], P < 0.001) from baseline to follow-up. The percentage decrease in mean number of outpatient acute migraine medication fills (−1.5% vs −0.2%, P < 0.001) and outpatient preventive migraine medication fills (−1.1% vs 3.8, P < 0.001) from baseline to follow-up was significantly greater among CGRP mAb initiators than SOC initiators (Table 3).
GMB vs SOC After PS Matching. From baseline to follow-up, a statistically significant decrease in the proportion of patients with mean annual all-cause IP visits (12.1% vs 6.7%, P = 0.002) and mean (SD) number of annual all-cause IP visits (0.17 [0.60] vs 0.08 [0.35], P = 0.003) was observed in the SOC cohort. The percentage decrease in the SOC cohort was significantly greater than that in the GMB cohort (5.5% vs 0.5%, P = 0.009). The proportion of patients with annual all-cause ED visits decreased significantly in the SOC cohort (43.5% vs 37.8%, P = 0.043) from baseline, whereas a statistically significant decrease in mean (SD) number of annual all-cause ED visits from baseline to follow-up (0.66 [1.47] vs 0.54 [1.41], P = 0.034) was observed in the GMB cohort (Table 3).
From baseline to follow-up, a statistically significant decrease in the proportion of patients with annual migraine-related ED visits was observed in the GMB cohort (17.3% vs 8.6%, P < 0.001) and the SOC cohort (20.9% vs 13.8%, P = 0.002). A statistically significant decrease in the mean (SD) number of annual migraine-related ED visits (0.28 [1.09] vs 0.16 [1.14], P < 0.001), acute migraine medication fills (8.73 [10.03] vs 7.24 [9.93], P < 0.001), and preventive migraine medication fills (GMB: 9.30 [8.42] vs 7.48 [8.17]; SOC: 6.90 [6.71] vs 9.86 [7.64], P < 0.01) was observed in the GMB cohort from baseline to follow-up. The percentage decrease in acute migraine medication fills (−1.5% vs −0.2%, P = 0.002) and preventive migraine medication fills (−1.8 vs 3.0, P < 0.001) was significantly greater in the GMB cohort than in the SOC cohort (Table 3).
HEALTH CARE COSTS
CGRP mAb vs SOC After PS Matching. A statistically significant increase from baseline to follow-up occurred in mean annual all-cause total costs in both the CGRP mAb cohort ($22,291 vs $28,334, P < 0.05) and the SOC cohort ($20,485 vs $21,809, P < 0.05; Supplementary Figure 3A (887.8KB, pdf) ). The increase in mean annual all-cause total costs was significantly greater in the CGRP mAb cohort ($6,043 vs $1,323, P < 0.001) than in the SOC cohort (Figure 1).
FIGURE 1.

Change in Annual All-Cause and Migraine-Related Direct Health Care Costs at 12-Month Baseline and 12-Month Follow-up Periods (CGRP mAb vs SOC)
In both cohorts, a statistically significant decrease from baseline to follow-up in mean annual migraine-related medical costs (CGRP mAb: −$3,301 vs −$2,394, P < 0.05; SOC: −$2,279 vs −$1,932, P < 0.05) and outpatient acute migraine fills costs (CGRP mAb: −$1,558 vs −$1,200, P < 0.05; SOC: −$497 vs −$417, P < 0.05) was observed (Supplementary Figure 3B (887.8KB, pdf) ). The decrease in mean annual migraine-related medical costs (−$907 vs −$347, P = 0.009), mean outpatient acute migraine fills costs (−$358 vs −$80, P < 0.001), and mean outpatient preventive migraine fills costs (−$298 vs $1,376, P < 0.001) was significantly greater in the CGRP mAb cohort than in the SOC cohort. The mean annual migraine-related total costs increased from baseline to follow-up in both the CGRP mAb cohort ($6,530 vs $9,947, P < 0.05) and the SOC cohort ($3,132 vs $4,108, P < 0.05). The increase in mean annual migraine-related total costs increased significantly in the CGRP mAb cohort compared with the SOC cohort ($3,416 vs $976, P < 0.001) (Figure 1).
GMB vs SOC After PS Matching. A statistically significant increase occurred in mean annual medical costs ($13,660 vs $16,757, P < 0.05) and mean annual all-cause total costs ($21,329 vs $29,727, P < 0.05) from baseline to follow-up in the GMB cohort (Supplementary Figure 4A (887.8KB, pdf) ). The increase in mean annual medical costs was significantly greater in the GMB cohort than in the SOC cohort ($3,097 vs −$1,149, P = 0.044) (Figure 2).
FIGURE 2.
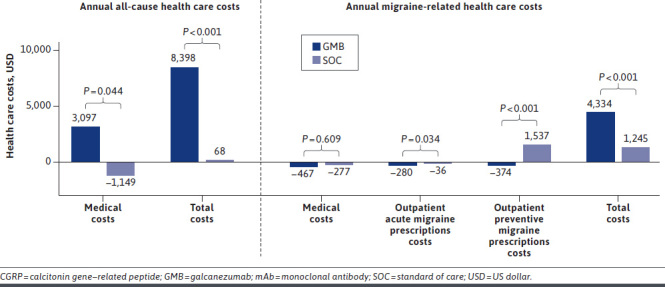
Change in Annual All-Cause and Migraine-Related Direct Health Care Costs at 12-Month Baseline and 12-Month Follow-up Periods (GMB vs SOC)
A statistically significant increase from baseline to follow-up in mean annual migraine-related total costs in both the GMB cohort ($5,510 vs $9,844, P < 0.05) and the SOC cohort ($3,741 vs $4,986, P < 0.05) was observed (Supplementary Figure 4B (887.8KB, pdf) ). The increase in mean annual migraine-related total costs was statistically significant in the GMB cohort vs the SOC cohort ($4,334 vs $1,245, P < 0.001) (Figure 2). Mean outpatient acute migraine fills costs ($1,147 vs $868, P < 0.05) and mean outpatient preventive migraine fills costs ($1,885 vs $1,511, P = 0.001) in the GMB cohort decreased significantly from baseline to follow-up (Supplementary Figure 4B (887.8KB, pdf) ). The decrease in mean outpatient acute migraine medication fills costs (−$280 vs −$36, P = 0.034) and mean outpatient preventive migraine medication fills costs (−$374 vs $1,537, P < 0.001) was statistically significant in the GMB cohort compared with the SOC cohort (Figure 2).
HCRU AND COSTS (6-MONTH FOLLOW-UP) AFTER PS MATCHING
The decrease in PPPM acute migraine medication from 6-month baseline to 6-month follow-up (−0.115 vs 0.004, P = 0.000) was significantly greater in the CGRP mAb cohort than in the SOC cohort (Supplementary Table 5 (887.8KB, pdf) ). Similarly, the decrease in PPPM acute migraine medication fills from 6-month baseline to 6-month follow-up (−0.121 vs −0.021, P < 0.001) was significantly greater in the GMB cohort than in the SOC cohort. Also, the decrease in PPPM preventive migraine medication fills from 6-month baseline to 6-month follow-up (−0.105 vs 0.448, P < 0.001) was significantly greater in the GMB cohort than in the SOC cohort (Supplementary Table 6 (887.8KB, pdf) ).
The change in PPPM all-cause total costs from 6-month baseline to 6-month follow-up was significantly greater in the CGRP mAb cohort than in the SOC cohort ($550 vs $43, P < 0.001; Supplementary Figure 5A (887.8KB, pdf) ). The changes in PPPM migraine-related outpatient acute migraine fills costs (−$15 vs $1, P < 0.001), outpatient preventive migraine fills costs (−$16 vs $116, P < 0.001), and total costs ($370 vs $56, P < 0.01) from 6-month baseline to 6-month follow-up were significantly greater in the CGRP mAb cohort than in the SOC cohort (Supplementary Figure 5B (887.8KB, pdf) ).
The change in PPPM all-cause total costs from 6-month baseline to 6-month follow-up was significantly greater in the GMB cohort than in the SOC cohort ($587 vs −$5, P < 0.001; Supplementary Figure 6A (887.8KB, pdf) ). The change in outpatient acute migraine fills costs (−$14 vs −$1, P = 0.007), outpatient preventive migraine medication fills costs (−$24 vs $136, P < 0.001), and total costs ($412 vs $56, P < 0.001) from 6-month baseline to 6-month follow-up were significantly greater in the GMB cohort than in the SOC cohort (Supplementary Figure 6B (887.8KB, pdf) ).
Discussion
In this study, we compared the change in mean annual all-cause and migraine-related HCRU and direct costs of CGRP mAb and GMB vs SOC from 6-month baseline to 6-month follow-up and from 12-month baseline to 12-month follow-up. In the CGRP mAb, GMB, and SOC cohorts, the number of mean annual all-cause ED visits decreased significantly from baseline to follow-up. In the CGRP mAb cohort, the mean number of annual migraine-related IP visits decreased significantly from baseline to follow-up; however, the decrease was not significantly different compared with the SOC cohort. The number of mean annual migraine-related ED visits and mean outpatient acute migraine medication fills decreased significantly from baseline to follow-up in both the CGRP mAb and GMB cohorts. The decrease in outpatient acute migraine medication fills for both cohorts was significantly greater than that in the SOC cohort. The mean annual all-cause total costs increased significantly from baseline to follow-up in both the CGRP mAb and GMB cohorts; the increase in both cohorts was significantly greater than that in the SOC cohort. The GMB cohort also had a significant increase in mean annual all-cause medical costs from baseline to follow-up; the increase was significantly greater than that in the SOC cohort. Both the CGRP mAb and GMB cohorts also had a significant increase in mean annual migraine-related total costs, which was significantly greater than that in the SOC cohort. There were significant cost savings in outpatient acute migraine medication fills in both the CGRP mAb and GMB cohorts compared with the SOC cohort.
The majority of patients in this study were female, and more than half the population had chronic migraine. There was a greater proportion of females in this study possibly owing to the overall greater risk (3.25 times) of migraine observed.13 The patients had anxiety, sleep disorders, and depression as the top 3 comorbid medical conditions. A recent prospective, survey-based study reported that patients with migraine are more likely to have comorbid conditions such as insomnia, depression, and anxiety. The study also reported an association of increase in intensity of headache with these comorbid conditions.14 In another study conducted using data pooled from the Medical Expenditure Panel Survey, Household Component during 2008 and 2013, 4.2 million patients spent $5.2 billion a year ($1,251 per patient) on treatment of chronic migraine. Per-patient annual chronic migraine–related cost among patients with more than 4 comorbid conditions was almost double ($1,554 vs $800) compared with patients with no comorbidity.15
In the present study, among CGRP mAb and GMB users, a significant decrease in mean annual all-cause ED visits, migraine-related ED visits, outpatient acute migraine medication fills, and outpatient preventive migraine medication fills was observed from baseline to follow-up. These results are consistent with a previously published open-label study. The open-label study reported a significant reduction in ED visits (20.2 to 4.7, P = 0.051) and in mean number of monthly migraine headache days with acute medication (~5.1 days, P < 0.001) from baseline through 12-month follow-up among GMB users.11 In another claims-based study by Tepper et al, differences in acute medication usage and HCRU from the 6-month pre-index period through the 6-month post-index period were assessed among erenumab (a CGRP mAb) users. There was a significant decrease in mean (SD) number of acute migraine medications claims from 3.29 (4.40) to 2.52 (3.78; rate ratio = 0.77; 95% CI = 0.74-0.80; P < 0.0001) and ED visits from 1.03 (1.53) to 0.77 (1.48; rate ratio = 0.75; 95% CI = 0.71-0.79; P < 0.0001).12
In the current study, there was a statistically significant increase in mean annual all-cause total costs and mean annual migraine-related total costs in both the CGRP mAb and GMB cohorts, which was primarily due to increased outpatient prescription costs. However, significant cost savings were achieved through decreased acute and preventive migraine medication fills and costs in both cohorts compared with the SOC cohort. A similar outcome was observed in another retrospective claims-based study among patients with chronic or episodic migraine initiating fremanezumab. The study reported a significant reduction in mean (SD) migraine-related acute medication costs ($706.76 [1,812.39] vs $519.65 [1,506.41], P < 0.001) from 6 months pre-index vs 6 months post-index.16 Taken together, these results suggest that CGRP mAb preventive therapy has the potential to reduce migraine-related acute medication use.
STRENGTHS
At present, there are limited real-world studies comparing HCRU and health care costs of CGRP mAbs in general, or GMB in particular, compared with SOC among patients with migraine; hence, this study is crucial for addressing the gaps in literature. The use of propensity score to address confounder bias is one of the strengths of this study. For an unbiased comparison, we included index drugs with favorable evidence-based efficacy in the SOC cohort. The consistency in results from the 6-month and 12-month follow-up cohorts further adds to the credibility of the study.
LIMITATIONS
Administrative claims data are subject to data coding or data entry error, which may cause misclassification of migraines, comorbidities, or medication use. The costs data included in the study reflect the amount paid and do not account for rebates, if any. The data collected were based on medication filled; there was no confirmation through chart review or patient contact that patients took the medications. As the study used data from commercial health or private Medicare supplemental insurance databases, the results may not be generalizable to patients with other or no insurance coverage.
Conclusions
The decrease in use and costs of acute migraine medication as well as all-cause and migraine-related ED visits in the CGRP mAb and GMB cohorts was significantly greater than that in the SOC cohort. The results of this study suggest that treatment with CGRP mAbs and GMB may lead to numerically greater cost savings in acute and preventive migraine medication costs and fewer ED visits vs SOC. Future studies evaluating indirect health care costs (ie, absenteeism) are warranted and may provide insight into additional cost savings with CGRP mAbs compared with SOC. These outcomes may help health care practitioners in the selection of a suitable preventive medication for migraine.
ACKNOWLEDGMENTS
The authors thank Shonda A Foster and Janet H Ford (Eli Lilly and Company, Indianapolis, IN) for providing input during the study design and implementation. Rahul Nikam, an employee of Eli Lilly Services India Pvt. Ltd., provided writing support.
REFERENCES
- 1.Headache Classification Committee of the International Headache Society (IHS) The International Classification of Headache Disorders, 3rd edition. Cephalalgia. 2018;38(1):1-211. doi: 10.1177/0333102417738202 [DOI] [PubMed] [Google Scholar]
- 2.Burch R, Rizzoli P, Loder E. The prevalence and impact of migraine and severe headache in the United States: Updated age, sex, and socioeconomic-specific estimates from government health surveys. Headache. 2021;61(1):60-68. doi: 10.1111/head.14024 [DOI] [PubMed] [Google Scholar]
- 3.Yucel A, Thach A, Kumar S, Loden C, Bensink M, Goldfarb N. Estimating the economic burden of migraine on US employers. Am J Manag Care. 2020;26(12):e403-08. doi: 10.37765/ajmc.2020.88547 [DOI] [PubMed] [Google Scholar]
- 4.American Headache Society. The American Headache Society Position Statement On Integrating New Migraine Treatments Into Clinical Practice. Headache. 2019;59(1):1-18. doi: 10.1111/head.13456 [DOI] [PubMed] [Google Scholar]
- 5.Ailani J, Burch RC, Robbins MS. The American Headache Society Consensus Statement: Update on integrating new migraine treatments into clinical practice. Headache. 2021;61(7):1021-39. 10.1111/head.14153 [DOI] [PubMed] [Google Scholar]
- 6.Lipton RB, Bigal ME, Diamond M, Freitag F, Reed ML, Stewart WF. Migraine prevalence, disease burden, and the need for preventive therapy. Neurology. 2007;68(5):343-49. doi: 10.1212/01.wnl.0000252808.97649.21 [DOI] [PubMed] [Google Scholar]
- 7.Silberstein SD, Holland S, Freitag F, Dodick DW, Argoff C, Ashman E. Evidence-based guideline update: Pharmacologic treatment for episodic migraine prevention in adults: Report of the Quality Standards Subcommittee of the American Academy of Neurology and the American Headache Society. Neurology. 2012;78(17):1337-45. doi: 10.1212/WNL.0b013e3182535d20 [DOI] [PMC free article] [PubMed] [Google Scholar]
- 8.US Food and Drug Administration. FDA approves novel preventive treatment for migraine. Published 2018. Accessed August 20, 2021. https://www.fda.gov/news-events/press-announcements/fda-approves-novel-preventive-treatment-migraine
- 9.US Food and Drug Administration. Approval package for fremanezumab-vfrm. Published 2018. Accessed August 20, 2021. https://www.accessdata.fda.gov/drugsatfda_docs/nda/2018/761089Orig1s000TOC.cfm
- 10.US Food and Drug Administration. Approval package for galcanezumab. Published 2018. Accessed August 20, 2021. https://www.accessdata.fda.gov/drugsatfda_docs/nda/2018/761063Orig1s000TOC.cfm
- 11.Ford JH, Foster SA, Stauffer VL, Ruff DD, Aurora SK, Versijpt J. Patient satisfaction, health care resource utilization, and acute headache medication use with galcanezumab: Results from a 12-month open-label study in patients with migraine. Patient Prefer Adherence. 2018;12:2413-24. doi: 10.2147/PPA.S182563 [DOI] [PMC free article] [PubMed] [Google Scholar]
- 12.Tepper SJ, Fang J, Vo P, et al. Impact of erenumab on acute medication usage and health care resource utilization among migraine patients: A US claims database study. J Headache Pain. 2021;22(1):27. doi: 10.1186/s10194-021-01238-2 [DOI] [PMC free article] [PubMed] [Google Scholar]
- 13.Delaruelle Z, Ivanova TA, Khan S, et al. Male and female sex hormones in primary headaches. J Headache Pain. 2018;19(1):117. doi: 10.1186/s10194-018-0922-7 [DOI] [PMC free article] [PubMed] [Google Scholar]
- 14.Buse DC, Reed ML, Fanning KM, et al. Comorbid and co-occurring conditions in migraine and associated risk of increasing headache pain intensity and headache frequency: Results of the migraine in America symptoms and treatment (MAST) study. J Headache Pain. 2020;21(1):23. doi: 10.1186/s10194-020-1084-y [DOI] [PMC free article] [PubMed] [Google Scholar]
- 15.Thorpe K. Prevalence, health care spending and comorbidities associated with chronic migraine patients. In: The Headache & Migraine Policy Forum. February 2017. [Google Scholar]
- 16.Seminerio M, Tangirala K, Thompson SF, et al. US real-world migraine-related health care resource utilization and costs for patients initiating fremanezumab (4289). Neurology. 2021;96(15 Supplement):4289. [Google Scholar]