

Abstract
Dysregulated Myc signaling is a key oncogenic pathway in glioblastoma multiforme (GBM). Yet, effective therapeutic targeting of Myc continues to be challenging. Here, we demonstrate that exosomes generated from human bone marrow mesenchymal stem cells (MSCs) engineered to encapsulate siRNAs targeting Myc (iExo-Myc) localize to orthotopic GBM tumors in mice. Treatment of late stage GBM tumors with iExo-Myc inhibits proliferation and angiogenesis, suppresses tumor growth, and extends survival. Transcriptional profiling of tumors reveals that the mesenchymal transition and estrogen receptor signaling pathways are impacted by Myc inhibition. Single nuclei RNA sequencing (snRNA-seq) shows that iExo-Myc treatment induces transcriptional repression of multiple growth factor and interleukin signaling pathways, triggering a mesenchymal to proneural transition and shifting the cellular landscape of the tumor. These data confirm that Myc is an effective anti-glioma target and that iExo-Myc offers a feasible, readily translational strategy to inhibit challenging oncogene targets for the treatment of brain tumors.
Keywords: iExosomes, Myc siRNA, drug delivery, glioblastoma, mesenchymal proneural transition
Introduction
Glioblastoma multiforme (GBM) is one of the deadliest forms of cancer, and over two-thirds of adults diagnosed with GBM die within 2 years of diagnosis.1 The unique biology and microenvironment of the brain as well as the tumor make the disease challenging to treat. The blood–brain barrier (BBB), a neurovascular unit that serves as a selective barrier restricting the transit of molecules to the brain, can impede effective delivery of anticancer therapeutics.2 In addition, the intra-tumor heterogeneity and cellular plasticity associated with GBM can contribute to treatment resistance.3,4 In this regard, two major cancer cell subsets have been described in human GBM tumors, mesenchymal and proneural, defined by distinct hypoxia-dependent and immune-dependent gene signatures.5,6 The two cell types coexist in GBM tumors, potentially with dynamic transitions between the mesenchymal and proneural gene signatures. Several factors have been reported to mediate this bi-directional transition, including genetic mutations, epigenetic alterations, hypoxia, inflammation, recruitment of immune cells, chemotherapy, and radiation.4,6–8 Further, the mesenchymal signature has been associated with therapy resistance and worse prognosis as compared to proneural cell type.9,10
GBM tumors are thought to be generated and/or propagated by neural stem cells that retain an inherent capacity for self-renewal and differentiation.11 Myc signaling has been demonstrated to be one of the critical regulators of both neurogenesis and tumorigenesis in the brain.12 The Myc pathway drives neural stem cell proliferation and renewal, generating diverse neural and glial cell populations in the developing brain.12 Myc is also amongst the most prevalently deregulated genes in stem cell-driven brain cancers.13 In GBM, Myc overexpression is required for GBM progression and maintenance, and several pre-clinical studies have shown sustained tumor regression when Myc, or its upstream or downstream targets are inhibited. 14–21
Myc is a highly conserved nuclear transcription factor that is anomalously expressed in most human cancers. In addition to driving and maintaining neoplasia, Myc is essential for normal cells and tissue homeostasis of several regenerating tissues.22 In normal cells, Myc mRNA is short-lived. In addition, Myc transcription is downregulated, and transcripts rapidly degraded in the absence of sustained proactive mitogenic signals. On the other hand, cancer cells show sustained Myc transcription in addition to an extended half-life of Myc transcripts.23–25
Despite substantial evidence showing that targeting Myc holds therapeutic promise and decades of efforts towards clinical translation of Myc targeting, Myc has not been successfully targeted in the clinic to date.26 Myc is deemed ‘undruggable’ due to its lack of enzymatic activity and known pocket amenable to binding by conventional small molecule drugs as well as its lack of structure when not complexed with partner proteins.27 Alternatives to Myc blockade have been widely explored, including Myc/Max complex disruption, transcriptional and/or translational inhibition, destabilization, and synthetic lethality.27 However, none of these approaches have been successful in clinical trials or tested as yet.21,27,28
RNA interference (RNAi), a highly specific and versatile technique to knock down gene expression, has emerged as a promising option for genes that are difficult to target with small molecules.29 The existence of a therapeutic window to selectively and safely target Myc mRNA in tumor cells has been demonstrated but initial clinical attempts to target Myc mRNA using RNAi were discontinued due to poor drug stability and delivery problems. 20 30,31 In recent years, anti-Myc RNAi delivery via lipid-based, organic, and inorganic nanoparticles has been explored. Translation of these approaches to the clinic has been hindered by low transfection efficiency, high production costs, toxicity, and immunogenicity.32
Exosomes are a subset of lipid bilayer bound extracellular nanovesicles averaging 100 nm in diameter, that are naturally released by all living cells and show immense promise as drug carriers.33 Exosomes are a major component of the intercellular communication network, shuttling peptides, metabolites, and nucleic acids between neighboring and distant cells.33 Various small molecule drugs, chemotherapeutics, and RNAi have been successfully loaded into exosomes and delivered to target cells in vitro and in preclinical models where they demonstrate anti-tumor efficacy.34 Exosomes produced by human bone marrow mesenchymal stem/stromal cells (MSCs) have been developed as FDA approved drug delivery vehicles due to their robust safety profile and low immunogenicity and are currently being investigated in several clinical trials.35,36
In this study, we use engineered MSC exosomes to deliver siRNAs targeting Myc and evaluate their mechanistic impact on tumor growth and survival in mice with GBM.
Results
Exosomes carrying Myc siRNA localize to GBM tumors
The size distribution of MSC exosomes was confirmed using nanoparticle tracking analysis (NTA). The size and morphology were further confirmed using transmission electron microscopy (Figure 1A–B). The presence of the exosome markers syntenin, CD81 and CD9 and the absence of exclusion markers, calnexin and β-actin, was confirmed by western blot analysis of exosome lysates (Figure 1C). U87 cells transfected with a Myc-targeting siRNA (Myc-siRNA#1, Dharmacon) for 24 hours showed a 71% reduction in MYC expression when compared with non-targeting control siRNA (Ctrl-siRNA#1, Dharmacon) (Figure 1D). A second Myc-targeting siRNA (Myc siRNA#2, Qiagen) was tested and showed a 47% reduction in MYC expression compared with non-targeting control siRNA (Ctrl-siRNA#2, Qiagen) (Figure 1E). Transfection of U87 cells with Myc siRNA#1 and Myc siRNA#2 was associated with a significant reduction in the number of viable cells (Figure 1F). MSC exosomes electroporated with Ctrl-siRNA#1, Myc-siRNA#1, Ctrl-siRNA#2, and Myc-siRNA#2 are referred to as iExo-Ctrl#1, iExo-Myc#1, iExo-Ctrl#2, and iExo-Myc#2, respectively.
Figure 1. MSC exosomes effectively target Myc and home to GBM tumors.

(A) MSC exosomes concentration and size distribution using nanoparticle tracking analysis (NTA). (B) Transmission electron microscopy images of exosomes. Scale bar, 100 nm. (C) Western blots showing the expression of exosomes and cellular markers, from MSC and MSC exosome lysates. (D) MYC mRNA expression in U87 cells transfected with Ctrl-siRNA#1 and Myc-siRNA#1 for 24 hours. One-way ANOVA with Dunnett’s multiple comparisons test was performed based on ΔCT values. (E) MYC mRNA expression in U87 cells transfected with Ctrl-siRNA#2 and Myc-siRNA#2 for 24 hours. One-way ANOVA with Dunnett’s multiple comparisons test was performed based on ΔCT values. (F) Cell viability of U87 cells, transfected with Ctrl-siRNA#2 and Myc-siRNA#1 Ctrl-siRNA#1 and Myc-siRNA#2 for 48 hours. One-way ANOVA with Dunnett’s multiple comparisons test was performed based on raw 560 nm absorbance values. (G) In vivo bioluminescence and ex vivo fluorescence imaging of non-tumor-bearing mice and luciferase-expressing GL261 intracranial tumor-bearing mice, 6 hours after i.v. injection of DiR-labeled MSC exosomes. Exact p-values are reported.
DiR labeling of MSC-derived exosomes confirmed the localization of exosomes to both temozolomide treated and untreated luciferase-expressing orthotopic GL261 GBM tumors 6 hours after intravenous (i.v.) injection, with no detectable brain localization observed in non-tumor bearing mice (Figure 1G). DiR labeled MSC exosomes were also detected in the liver and spleen of non-tumor bearing mice (Supplementary Figure 1A). Similarly, DiI labeled 293F exosomes administered i.v. to non-tumor bearing mice accumulated in the liver and spleen, with lower exosomes abundance in the brain, lung, pancreas, and kidney (Supplementary Figure 1B). Mice with U87 orthotopic tumors administered i.v. iExosomes with fluorescently labeled siRNA revealed colocalization of the siRNA tag in GFP+ U87 cancer cells (Supplementary Figure 1C), suggesting that iExosomes can target GBM cancer cells.
Systemically or intranasally delivered iExosomes carrying Myc siRNA extend the survival of mice with GBM
To test the efficacy of iExo-Myc in vivo, luciferase-expressing U87 cells were implanted orthotopically in nude mice. On day 25 post tumor implantation, when all tumors reached a late disease stage as evidenced by an average bioluminescence signal of approximately 1x10⁶, mice were divided into three groups with similar initial tumor sizes (Supplementary Figure 1D) and treated three times per week via i.v. injection of plasmalyte with Myc siRNA#1, iExo-Ctrl#1, or iExo-Myc#1 (Figure 2A). Mice were split into small and large tumors based on the bioluminescence intensity (BLI) of the tumor prior to treatment initiation (day 23, Supplementary Figure 1D), of less than 1x10⁶ and greater than 1x10⁶, respectively. In both small and large tumors, slower tumor growth in the iExo-Myc#1 treated group (Figure 2B). Histological analysis further confirmed smaller tumors in the iExo-Myc#1 treated group (Figure 2C–D).
Figure 2. Systemic and intranasal Myc iExosome delivery increases the survival of mice with end-stage intracranial U87 tumors.
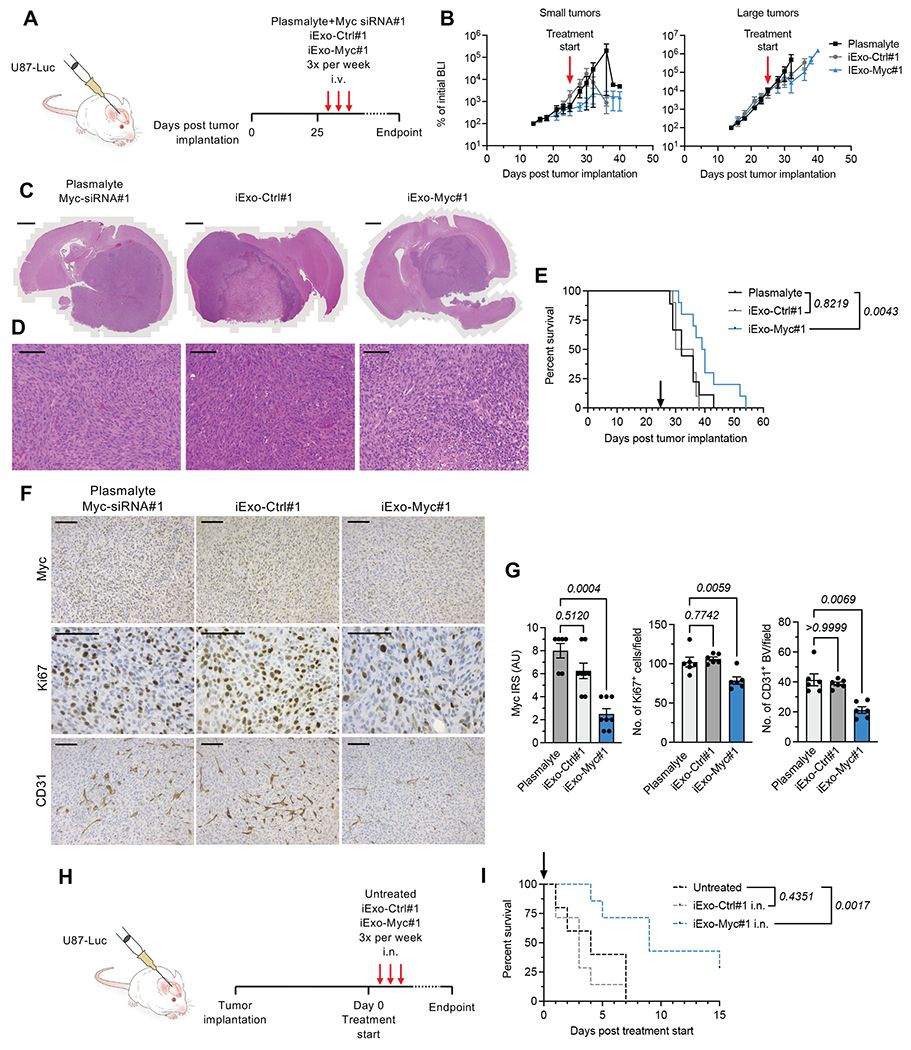
(A) Experimental design of treatment with i.v. injected exosomes (B) Bioluminescence measurement per mouse over the dosing period with mice divided into two groups: small tumors (BLI at day 23 < 1x10⁶) and large tumors (BLI at day 23 < 1x10⁶). Plasmalyte + Myc siRNA#1, N=9; iExo-Ctrl#1, N=10; iExo-Myc#1, N=10. (C-D) Histological analyses of whole brain (C) and tumor regions (D) H&E stained tissues. (C) Scale bar, 500 μm. (D) Scale bar, 50 μm. (E) Kaplan-Meier survival curve of animals treated via i.v. injection. Log-rank (Mantel-Cox) test was performed. Plasmalyte + Myc siRNA#1, N=9; iExo-Ctrl#1, N=10; iExo-Myc#1, N=10. (F) Immunohistochemical detection of Myc, Ki67 and CD31 in U87 brain tumor sections treated with iExosomes administered i.v. Scale bar, 50 μm. (G) Quantification of Myc, Ki67 and CD31 positive cells. IRS, immunoreactive score. Kruskall-Wallis with Dunn’s multiple comparisons test was performed for Myc and CD31. One-way ANOVA with Dunnett’s multiple comparisons test was performed for Ki67. Myc: Plasmalyte + Myc siRNA#1, N=6; iExo-Ctrl#1, N=8; iExo-Myc#1, N=8. Ki67: Plasmalyte + Myc siRNA#1, N=6; iExo-Ctrl#1, N=6; and iExo-Myc#1, N=6. CD31: Plasmalyte + Myc siRNA#1, N=6; iExo-Ctrl#1, N=6; iExo-Myc#1, N=6. (H) Experimental design of treatment with intranasal (i.n.) administered exosomes. (I) Kaplan-Meier survival curve of mice treated i.n. Log-rank (Mantel-Cox) test was performed. Untreated control group, N=5; iExo-Ctrl#1, N=7; iExo-Myc#1, N=7. Exact p-values are reported.
Treatment with iExo-Myc#1 was associated with a significant increase in survival (p=0.0043, Figure 2E). Tumors treated with iExo-Myc#1 showed a 2.5-fold decrease in Myc expression by immunohistochemical scoring, confirming effective Myc siRNA delivery and Myc targeting (Figure 2F–G). These tumors showed significantly lower numbers of proliferative Ki67+ cells and tumor angiogenesis associated CD31+ blood vessels (Figure 2F–G).
Previous studies have indicated that the intranasal route may serve as an effective, non-invasive route for the delivery of exosomes to the brain.37–39 As a result, we also evaluated the efficacy of iExosomes delivered intranasally. On day 28 after tumor implantation, tumor-bearing mice were administered with iExo-Scr#1 or iExo-Myc#1 intranasally (i.n., Figure 2H). Similar to administration by i.v. injection, i.n. administration of iExo-Myc led to extended survival of treated mice (Figure 2I), confirming intranasal administration as an effective route for iExo-Myc delivery to brain tumors.
Finally, no change in survival was observed between iExo-Ctrl#1 treated and plasmalyte treated mice (Figure 2E, 2I), suggesting that iExo-Ctrl is not associated with overt off-target effects. Taken together, our data demonstrate that exosomes can deliver Myc siRNA to tumors in the brain, and downregulate Myc in vivo upon systemic or intranasal administration, thereby extending survival of mice with late stage GBM tumors.
iExo-Myc suppresses Myc and late stage GBM to prolong survival
To confirm the effect of targeting Myc using exosomes (iExo-Myc), we used a second independent set of non-targeting and Myc targeting siRNA sequences, iExo-Ctrl#2 and iExo-Myc#2 (Figure 3A). Similar to studies using iExo-Ctrl#1 and iExo-Myc#1, iExo-Ctrl#2 and iExo-Myc#2 were administered with i.v. injections three times a week, starting on day 28 after the implantation of GBM cells, when the tumor registered a bioluminescence signal of approximately 1x10⁶, indicative of late stage GBM (Supplementary Figure 1E). Bioluminescence measurements showed delayed tumor growth in the iExo-Myc#2 treated group as compared to iExo-Ctrl#2 and was further confirmed by H&E staining (Figure 3B). Reduced tumor size in iExo-Myc#2 treated mice was confirmed by histological analysis (Figure 3C–D).
Figure 3. Reproducibility of iExo-Myc efficacy in GBM tumors.

(A) Experimental design of treatment with intravenous (i.v.) injected exosomes. (B) Bioluminescence measurement per mouse in Exo-Ctrl#2 and iExo-Myc#2 treated groups over the dosing period. iExo-Ctrl#2, N=5; iExo-Myc#2, N=8. (C-D) Histological analyses of whole brain (C) and tumor regions (D) H&E stained tissues. (C) Scale bar, 1000 μm. (D) Scale bar, 50 μm. (E) Kaplan-Meier survival curves of iExo-Ctrl#2 and iExo-Myc#2 treated groups, compared using log-rank (Mantel-Cox) test. iExo-Ctrl#2, N=5; iExo-Myc#2, N=8. (F) Immunohistochemical detection of Myc, Ki67 and CD31 in U87 brain tumor sections of iExo-Ctrl#2 and iExo-Myc#2 treated samples. Scale bar, 200 μm. (F) Quantification of Myc, Ki67 and CD31 positive cells. Mann Whitney test was performed for Myc. Unpaired t test was performed for Ki67 and CD31. Myc: iExo-Ctrl#2, N=4; iExo-Myc#2, N=8. Ki67: iExo-Ctrl#2, N=4; iExo-Myc#2, N=4. CD31: iExo-Ctrl#2, N=4; iExo-Myc#2, N=4. Exact p-values are reported.
Treatment with iExo-Myc#2 led to a significant increase in survival compared with iExo-Ctrl#2 treatment (p=0.0009, Figure 3E). Like the results obtained using iExo-Ctrl#1 and iExo-Myc#1, immunohistochemistry staining showed decreased Myc, Ki67 and CD31+ blood vessel abundance in iExo-Myc#2 treated mice compared with iExo-Ctrl#2 treated mice (Figure 3F–G). These data further confirm that targeting Myc using exosomes to deliver siRNA improves survival in late stage GBM.
iExo-Myc rewire the cancer cell transcriptome in GBM
To elucidate the mechanisms underlying the improved survival of mice with GBM, we utilized bulk RNA-seq to analyze the global transcriptomic profile of tumor tissues from control and Myc siRNA treated mice (iExo-Ctrl#1, iExo-Myc#1, iExo-Ctrl#2, and iExo-Myc#2). While bulk sequencing was performed, human-specific transcripts were analyzed to evaluate iExo-Myc regulation of the U87 cancer cell transcriptome. Principal component analysis (PCA) showed segregation of iExo-Ctrl treated tumors from iExo-Myc treated tumors (Figure 4A and B). We identified 340 up-regulated genes and 362 down-regulated genes in iExo-Myc#1 treated tumors, and 877 up-regulated genes and 987 down-regulated genes in iExo-Myc#2 treated tumors, compared to iExo-Ctrl#1 and iExo-Ctrl#2 treated samples, respectively (Figure 4C–F, Supplementary Figure 2, Supplementary Table 1, Supplementary Table 2). In addition, 34 upregulated genes and 20 downregulated genes were found to be conserved in iExo-Myc#1 and iExo-Myc#2 treated tumors (Supplementary Figure 3). Gene set enrichment analysis (GSEA) was focused on differentially regulated genes detected in iExo-Myc#1 and iExo-Myc#2 treated tumors in order to evaluate conserved pathways between the two targeting approaches. GSEA showed consistent downregulation of Myc target pathways in both iExo-Myc treated groups (Figure 4E–F). In both datasets, apoptotic cell death was activated, and E2F targets and the G2M checkpoint were inhibited, suggesting suppression of proliferation upon targeting of Myc (Figure 4E–F). Other pathways that were impacted in both iExo-Myc treated groups included mesenchymal transition, xenobiotic metabolism, heme metabolism, glycolysis, DNA repair, inflammation, and hypoxia, all of which have been previously associated with downstream Myc signaling.40 We observed a greater than 80% concordance between the cellular pathways identified in the two independent datasets (Figure 4E–F).
Figure 4. iExo-Myc rewires the GBM cancer cell transcriptome in a specific and consistent manner.

(A) PCA of RNA-seq analysis of U87 xenografts treated with iExo-Ctrl#1 (N=4) and iExo-Myc#1 (N=3) administered i.v. (B) PCA of RNA-seq analysis of U87 xenografts treated with iExo-Ctrl#2 (N=4) and iExo-Myc#2 (N=5) administered i.v. (C) Volcano plot showing up- and down-regulated genes in iExo-Ctrl#1 and iExo-Myc#1 treated samples. (D) Volcano plot showing up- and down-regulated genes in iExo-Ctrl#2 and iExo-Myc#2 treated samples. (E) GSEA pathways in iExo-Myc#1 treated samples. (F) GSEA pathways in iExo-Myc#2 samples.
snRNA-seq of iExo-Myc treated GBM reveals cellular subtypes that identify mesenchymal and proneural GBM signatures
We performed single-nucleus RNA-seq (snRNA-seq) transcriptional profiling of iExo-Ctrl#1 and iExo-Myc#1 treated tumors to assess the cellular states in treated and control GBM tumors41. Gene detection and identification of cell types by snRNA-seq has been shown to be similar to scRNA-seq42–44, indicating that both methods are suitable for transcriptional analysis of individual cells. The analysis was restricted to human transcripts in order to specifically evaluate U87 cancer cell responses to iExosomes treatment. We employed unsupervised clustering with Uniform Manifold Approximation and Projection (UMAP) to delineate eight clusters (Figure 5A–B, Supplementary Figure 4, Supplementary Table 3). Further analysis using UMAP and heatmap was performed to derive three distinct compartments from the eight clusters. Each of the three compartments had a distinct transcriptional signature. Based on the overlap in gene expression, Compartment 1 included Cluster 1-5, (blue compartment), Compartment 2 included Cluster 6-7 (red compartment) and Compartment 3 included Cluster 8 (grey compartment) (Figure 5A–B). We evaluated whether each of the three transcriptional signatures could reflect specific cell cycle states of cancer cells in the GBM.45 We determined a cell cycle score and classified cells as either cycling or non-cycling (Figure 5C).46 Each compartment contained both cycling and non-cycling cells in varying percentages (Figure 5D). After removal of the cell cycle effect,46 both the UMAP (data not shown) and the heatmap (Figure 5E) yielded 7 clusters and the same 3 transcriptional compartments that was observed in the initial analysis. Collectively, the results support the notion that the transcriptional signatures might reflect different neurodevelopmental and/or lineage differentiation programs.
Figure 5. snRNA-seq of iExo-Myc treated tumors charts cellular states that recapitulate human GBM subtypes.

(A) UMAP of the unsupervised clustering of cancer cells derived from U87 tumors treated with iExo-Ctrl#1 (N=2) and iExo-Myc#1 (N=2) via i.v. injection. (B) Heatmap showing 8 clusters with the 10 most highly expressed genes- and the 3 transcriptional compartments: Compartment 1 (blue) Cluster 1 - Cluster 5, Compartment 2 (Red) Cluster 6 - Cluster 7, Compartment 3 (grey) Cluster 8. (C) UMAP showing the cycling and non-cycling cells in each cluster. (D) Percentage of cycling cells in each cluster. (E) Heatmap showing 7 clusters and the 3 transcriptional compartments after cell cycle effect removal. (F) Expression of major mesenchymal markers in the 3 transcriptional compartments. (G) Expression of major proneural markers in the 3 transcriptional compartments. (H) GO pathways enriched in Cluster 1 to Cluster 7 after cell cycle removal.
Expression analysis of common mesenchymal and proneural makers among the 3 compartments revealed that mesenchymal markers were highly expressed in Compartment 1 and Compartment 2 but decreased in Compartment 3. A subset of proneural markers, including STMN4, DLL1, ASCL1, DLX5, and DCX, were found to be exclusively expressed in Compartment 3. Other proneural markers, including STMN2, SOX11, SOX4, and OMG were enriched in Compartment 3 when compared with Compartment 1 and 2 (Figure 5F–G, Supplementary Figure 4). Gene ontology (GO) enrichment of hypoxia and mesenchyme development pathways were noted in Compartment 1. Neutrophil, leukocyte and granulocyte activation and cellular response to cytokine stimulus and cytokine-mediated signaling pathways were enriched in Compartment 2. Compartment 3 showed enrichment in neural function pathways including glutamate receptor signaling, synaptic signaling and neurotransmitter secretion (Figure 5H, Supplementary Table 4).
The existence of distinct cycling populations in each compartment, the identification of mesenchymal markers in Compartments 1 and 2, and the prevalence of pathways highlighting hypoxia and cytokine signaling, respectively, suggested that compartments 1 and 2 likely represent mesenchymal population previously described in human GBM tumors.4,6 Compartments 1 and 2 are referred to as Mesenchymal-like#1 (Mes-Like#1) and Mesenchymal-like#2 (Mes-like#2), respectively. Compartment 3 revealed features of a proneural-like cellular state with increased expression of proneural markers, decreased expression of mesenchymal genes, and enrichment of neural function pathways. This compartment is referred to as Proneural-like (PN-like). Taken together, these data suggest that GBM treated with iExo-Ctrl#1 and iExo-Myc#1 reveal transcriptional signatures that recapitulate the human GBM mesenchymal and proneural subtypes.
iExosomes carrying Myc siRNA reverse the proneural-mesenchymal transition
Control (iExo-Ctrl#1 treated) samples showed a largely mono-compartment distribution with a dominant Mes-like#1 subpopulation, low abundance Mes-like#2 subpopulation, and and lack of the PN-like subpopulation (Figure 6A, Supplementary Figure 5). Treatment with iExo-Myc#1 led to a 50% depletion of the Mes-like#1 and a 4.6-fold increase in Mes-like#2 compartment (Figure 6A–B). The PN-like compartment was absent in control samples and emerged after iExo-Myc#1 treatment to reach 12% of the tumor cell population, suggesting that Myc downregulation results in a transcriptional shift from a mesenchymal to proneural signature (Figure 6A–B). To estimate the chronological sequence of transitions among the different compartments, pseudo-time analysis was performed to arrange cells in order of similarities in expression patterns, and thereby infer their transcriptional progression. The resulting quasi-linear trajectory topology delineated a sequential transition tree, in which Mes-like#2 cells arise from Mes-like#1 cells and PN-like cells likely differentiate from the Mes-like#2 cells (Figure 6C).
Figure 6. iExo-Myc reshapes anti-tumor immunity and reverse the proneural mesenchymal transition.

(A) UMAP of unsupervised clustering of cancer cells derived from U87 tumors treated with iExo-Ctrl#1 (N=2) and iExo-Myc#1 (N=2) via i.v. injection. (B) Percentage of tumor cells per cluster (C1-C8, described in Figure 5) in iExo-Ctrl#1 (left) and iExo-Myc#1 (right) treated samples. (C) Pseudo-time mapping of U87 tumor xenografts showing sequential transitions from Cluster 1 to Cluster 8. (D) Venn diagram showing number of upregulated and downregulated genes in iExo-Myc#1 as compared to iExo-Ctrl#1 treated samples. (E) IPA in Mes-like#1 and Mes-like#2 and PN-Like compartment from iExo-Myc#1 treated samples as compared to iExo-Ctrl#1 treated samples. (F) Expression of major known mesenchymal master regulators. (G) Monocles of the expression of new master regulators of the proneural mesenchymal transition.
To explore the molecular mechanisms underlying such predicted transitions, we compared the transcriptional profiles of Mes-like#1 and Mes-like#2/PN-like compartments in iExo-Myc#1 and iExo-Ctrl#1 treated groups. A total of 1908 downregulated genes and 760 upregulated genes were identified by this analysis, with 98 genes upregulated and 957 genes downregulated were identified solely in the Mes-like#2/PN-like compartment (Figure 6D, Supplementary Table 5). Ingenuity pathway analysis (IPA) revealed upregulation of PPARα/RXR signaling, and downregulation of cyclins/cell cycle regulation pathways, epithelial to mesenchymal transition, glioma signaling, estrogen receptor signaling and the WNT/Ca2+ pathway in the Mes-like#2/PN-like compartment (Figure 6E, Supplementary Table 6). Several signaling pathways involved in the proneural to mesenchymal transition, including HIF1, AMPK, and HGF signaling, were among the most downregulated pathways in the Mes-like#2/PN-like compartment (Figure 6E).47–49 The expression of known transcriptional regulators of the proneural to mesenchymal transition, including STAT3, YAP1, TAZ, TGFB1, and FOSL2, was downregulated in iExo-Myc treated tumors (Figure 6F). Downregulation of Nrf2 (NFE2L2) and estrogen receptor 2 (ESR2) pathways were identified as key events in the Mes-like#2 to proneural transition (Figure 6G). These data support a role for Myc in driving the mesenchymal to proneural transcriptional signature, likely influenced by growth factor and cytokine signaling.
Discussion
Delivering therapeutics to the brain has long been a challenge, with several clinical trials currently attempting to overcome the blood-brain barrier (BBB) mediated exclusion of therapeutic molecules from the brain. In this study, we demonstrate that MSC-derived exosomes can be engineered to carry customized siRNAs and deliver these molecules to GBM tumors, leading to Myc suppression, decreased cancer cell proliferation and tumor angiogenesis, and extension of overall survival. Our data suggest that MSC exosomes may pass through the BBB, as we demonstrate accumulation of iExosomes in U87 cancer cells and target engagement in the brain after intravenous administration. Currently, our understanding of how exosomes are trafficked in vivo are limited, and exosomes may accumulate in the brain through mechanisms independent of crossing the BBB. Future studies will give critical insight into the ability of exosomes to penetrate the BBB. Previous studies demonstrated that MSC and adipose stem cell-derived exosomes delivered intranasally accumulate in the brain and spinal cord area37,38 and suggest that the intranasal compared to intravenous administration may lead to increased exosomes accumulation in the brain of healthy mice39. Our data indicate that exosomes have the potential to serve as a reliable drug delivery system for treating brain tumors and other likely other diseases of the brain.
GBM is a heterogeneous, dynamic neoplasm with cells that retain phenotypic plasticity. GBM can display one or more of four major subtypes based on global transcriptional profiles: mesenchymal, classical, proneural and neural. The poorly differentiated, mesenchymal subtype is characteristic of aggressive GBM, and proneural subtype shows neuronal differentiation and is associated with better patient outcomes. Transcriptionally, these two subtypes have the least overlap in mouse and human GBM. Our data suggest that downregulation of Myc alters the cellular landscape of GBM, facilitating transitioning of cancer cells from an aggressive mesenchymal phenotype to a differentiated proneural phenotype, partially restoring normal tissue structure, and improving overall survival. Regulation of the mesenchymal-proneural transition is less well understood than proneural-mesenchymal transition, and our study describes a critical role for Myc in maintaining the mesenchymal phenotype in GBM. Myc inactivation has been reported to drive tumor cell differentiation in other tissues. Myc inactivation in mice with Myc-driven mesenchymal-derived osteosarcoma results in the robust terminal differentiation of bone cancer.50 In mice with Myc-driven epithelial-derived HCC or renal cell carcinoma, Myc inactivation results in tumor regression with the persistence of a dormant cell population.51,52 Prior to the transition to a proneural phenotype in response to Myc downregulation, we observe an increase of inflammatory, cytokine secreting mesenchymal cell subpopulation that is associated with a shift to a proneural cell type. Pathway analysis supports the critical role of Myc expression on the GBM secretome, and subsequent impact on the tumor milieu. Reversal of the proneural mesenchymal transition is potentially a mediator of the improved survival associated with iExo-Myc, as the mesenchymal signature correlates with resistance to therapy and worse prognosis9,10.
In summary, our results demonstrate that Myc is an attractive therapeutic target for GBM and suggest that targeting Myc extends survival by tipping the balance towards a more differentiated proneural phenotype. We demonstrate efficient Myc targeting using iExo-Myc, laying the groundwork for a robust platform to address other undruggable targets in GBM and other brain cancers, including non-neoplastic diseases of the brain. Finally, this study provides evidence that iExosome-based therapeutics are a readily modified, efficient treatment modality to construct and deliver personalized therapies.
Materials and Methods
Cell culture
Human bone marrow-derived MSCs were obtained from the Cell Therapy Laboratory at the University of Texas MD Anderson Cancer Center and cultured in αMEM (Corning) supplemented with 5% human platelet lysate (PLTMax, Sigma), 1% non-essential amino acids (Corning), 1% L-glutamine (Corning), 2 U/mL Heparin (Sigma) and 1% penicillin-streptomycin (Corning) in a humidified incubator at 37°C and 5% CO2. U87 and GL261 cell lines were obtained from the I.J. Fidler lab (MDACC) and cultured in Dulbecco’s Modified Eagle’s Medium (DMEM) supplemented with 10% fetal bovine serum (FBS), 1% penicillin-streptomycin in a humidified incubator at 37°C and 5% CO2. 293F were obtained from Thermo Fisher and cultured in 293F expression medium in a humidified incubator at 37°C and 8% CO2. U87 and GL261 were STR validated, and all cell lines were tested for and confirmed negative for mycoplasma contamination.
Generation of U87 cells stably expressing GFP and firefly luciferase
U87 and GL261 cells were transduced with a lentiviral vector containing the humanized firefly luciferase (hFLuc) gene under the control of a cytomegalovirus (CMV) promoter and green fluorescent protein (GFP) under the control of an SV40 promoter. Lentiviruses were obtained from Capital Biosciences, (VSL-0088P) as ready-to-transduce, replication incompetent and VSV-G pseudo-typed lentiviral particles. Cells were plated at a density of 2x10⁴ cells per well in 12-well plates using complete media and transduced with hFLuc lentivirus at a multiplicity of infection (MOI) of 5 for 24 hours. A puromycin resistance marker was used for selection of stably transduced cells bi-cistronically co-expressed with GFP. U87 and GL261 were selected with 2.4 μg/mL puromycin and cells expressing GFP were sorted using BD FACSAria II, followed by maintenance in growth media with 2.4 μg/mL puromycin.
Isolation and purification of MSC and 293F Exosomes
MSCs were cultured and at 80% confluency were washed three times in phosphate buffered saline (PBS, Corning) and the media replaced with MSC growth media without human platelet lysate for 48 hours. 293F cells were cultured and every 48 hours conditioned medium collected following centrifugation at 100g for 5 minutes. The conditioned medium was centrifuged at 800g for 5 minutes followed by 2,000g for 10 minutes. The conditioned medium was next filtered through 0.2μm filter and ultra-centrifuged at 100,000g for 3 hours at 4 °C in a SW32 Ti rotor (Beckman Coulter). The supernatant was removed and the exosome pellet resuspended in PBS or plasmalyte. Exosomes were stored at −80 °C for downstream analyses.
Nanoparticle tracking analysis
MSC exosomes concentration and size distribution were measured based on Brownian motion using a NanoSight LM10 (Malvern) system equipped with a blue 488 nm laser and a high sensitivity sCMOS camera. 293F exosomes concentration and size were evaluated using a NanoSight NS300 (Malvern) equipped with a green 532 nm laser and a high sensitivity sCMOS camera. For each acquisition, a delay of 90 seconds followed by three captures of 30 seconds each was used. The averaged value of the three captures for each biological replicate was used to determine the size distribution and the nanoparticle concentration.
Transmission electron microscopy
MSC exosome samples (1x10¹² in 50 μl PBS) were fixed in 2.5% EM-grade glutaraldehyde and were processed and analyzed at the High-Resolution Electron Microscopy Facility (MDACC). Exosome samples were placed onto 100-mesh carbon-coated poly-L-lysine-treated form var-coated copper grids for 1 hour, then negatively stained for contrast using 1% uranyl acetate for 1 minute (Millipore). Staining was removed using a paper filter. The exosome samples were viewed using a JEM 1010 transmission electron microscope (JEOL) at an accelerating voltage of 80 kV. Digital images were captured using the AMT Imaging System (Advanced Microscopy Techniques).
Western Blot
Cells were lysed in RIPA buffer supplemented with an EDTA-free protease inhibitor cocktail. Exosomes were lysed in Laemmli sample buffer. Qubit protein assay kit was used for protein quantification. Cell and exosome lysate samples were loaded onto polyacrylamide gels for electrophoretic separation. Protein transfer was performed on a methanol-activated polyvinylidene difluoride membrane. The membrane was blocked in 5% BSA in TBST at room temperature for 1 hour. The following primary antibodies were used: anti-human syntenin (EPR8102) (Abcam, ab133267, 1:2,000); anti-CD9 (Abcam, ab263019, 1:1,000); anti-CD81 (Santa Cruz, sc166029, 1:1,000); anti-Calnexin (Santa Cruz, sc23954, 1:200); anti-β-actin (13E5) (CST, 4970, 1:1,000) and prepared in 5% BSA in TBST. Anti-rabbit HRP-conjugated (CST, 7074, 1:5,000) or anti-mouse HRP-conjugated (R&D, HAF007, 1:1,000) secondary antibodies were incubated for 1 h at room temperature in 5% BSA in TBST. Visualization was performed using West-Q Pico ECL solution (Gendepot) or ECL (Pierce) according to the manufacturer’s instructions. Chemiluminescent signals were captured with Amersham Hyperfilm (GE Healthcare).
siRNA Transfection
U87 cells seeded at 20,000 cells per well in 12-well plate were washed twice with PBS, placed in DMEM with 10% FBS, and transfected with non-targeting and Myc siRNAs at a final concentration of 25nM with Dharmafect (Dharmacon) or Lipofectamine 2000 (Invitrogen). The following human Myc siRNA #1 from Dharmacon was used: ON-TARGETplus J-003282-26 (Target sequence: 5’-CGAUGUUGUUUCUGUGGAA-3’). The non-targeting siRNA (Ctrl-siRNA #1) used was: ON-TARGETplus D-001810-01-05 (Target sequence: 5’-UGGUUUACAUGUCGACUAA-3’). Human Myc siRNA#2 from Qiagen was used: the sense strand: 5’-UCUACCAGCAGCAGTT-3’, the anti-sense strand: 5’-CUGCUGCUGCUGGUAGAAG-3’ and the target sequence: 5’-CTTCTACCAGCAGCAGCAG-3’. The non-targeting siRNA (Ctrl-siRNA #2) used was: the sense strand: 5’-AACGGGCUCCCAACAUUTT-3’, the anti-sense strand: 5’-AAUGYYGGGAGCCCGUUGC-3’ (Target sequence :5’-GCAACGGGCTCCCAACATT-3’). Cells were collected at 24 hours for qPCR analysis and 48 hours for cell viability analysis.
Quantitative real-time PCR analyses (qPCR)
RNA was isolated using a RNeasy mini kit (Qiagen) including an on-column DNase digest according to the manufacturer’s directions. Complementary DNA (cDNA) was synthesized using the High-Capacity cDNA Reverse Transcription Kit (Applied Biosystems) according to the manufacturer’s instructions. For experiments using Dharmacon siRNA, qPCR was performed to analyze the gene expression profile of MYC using TaqMan gene expression assays (Hs00153408_m1) (Applied Biosystems) using a QuantStudio 7 Flex Real-time PCR system (Applied Biosystems), and measurements were normalized to the expression of B2M (Hs00187842_m1) (Applied Biosystems). For experiments using Qiagen siRNA, qPCR reactions were performed using Power SYBR green PCR master mix (Applied Biosystems). The sequences of human MYC primers used are as follows: Reverse: 5’-CTGCGTAGTTGTGCTGATGT-3’ and Forward: 5’-GGCTCCTGGCAAAAGGTCA-3’. Measurements were normalized to B2M (Reverse: 5’-TCTCTGCTCCCCACCTCTAAGT-3’ and Forward: 5’-TGCTGTCTCCATGTTTGATGTATCT-3’. The expression data are presented as fold change (2−ΔΔCT) or relative expression of technical triplicates. Statistical significance was calculated using analysis of variance (ANOVA).
MTT assay
U87 cells seeded at 5,000 cells per well in 96-well plates and transfected with non-targeting and Myc siRNAs at a concentration of 25nM for 48 hours were treated with MTT (5mg/ml) for 3 hours. Absorbance was measured at 560nm using a BMG Lab Tech FLUOstar Omega plate reader.
Exosome siRNA electroporation
Up to 4x10⁹ total exosomes were mixed with 4μg non-targeting or Myc siRNAs (#1 and #2) in a 4mm cuvette using a Gene Pulser Xcell Electroporation System (Bio-Rad) in an electroporation volume of 400μl of plasmalyte. The exponential decay protocol included a voltage (V) = 400, a capacitance (μF) = 125 and a resistance (ohm) = ∞. In our previous studies, we observed a siRNA loading efficiency of approximately 100%34. While precise quantification of siRNA loading per exosome remains a challenge, based on these data we anticipate that the majority of siRNA is associated with exosomes. For biodistribution experiments, an Alexa Fluor 546 (AF 546) tagged Ctrl#2 siRNA was incorporated in MSC exosomes to enable visualization of siRNA in target tissue.
Intracranial glioblastoma xenograft mouse model
All animal procedures were reviewed and approved by the MDACC Institutional Animal Care and Use Committee. Female athymic Foxn1−/− mice (obtained from MDACC Department of Experimental Radiation Oncology) were housed under standard conditions at MDACC animal facilities. Between 6 and 8 weeks of age, 1x10⁶ U87-Luc cells suspended in 5μl PBS were stereotactically injected at (x=2 mm right, y=1 mm anterior, z=2 mm inferior to the bregma). After injection, the hole was sealed with bone wax. At day 25 post tumor implantation, mice were treated with MSC electroporated exosomes iExo-Crtl#1 and iExo-Myc#1 via retro-orbital venous sinus injection 3 times a week at a dose of 1x10⁹ exosomes in a volume of 100μl of plasmalyte. The control group received 100μl of plasmalyte+1μg Myc-siRNA#1. For the intranasal iExosome experiment, mice were treated with MSC electroporated exosomes (iExo-Ctrl#1 and iExo-Myc#1) via intranasal administration, 3 times a week at a dose of 1x10⁹ exosomes carrying 1μg of siRNA in a volume of 100μl of plasmalyte. The control group received no treatment. Mice were enrolled in intranasal treatment when tumors were detectable by IVIS. In the experiments presented in Figure 3, treatment started on day 28 post tumor implantation. Mice were administered MSC electroporated exosomes, iExo-Ctrl#2 and iExo-Myc#2 injected via retro-orbital sinus, 3 times a week at a dose of 1x10⁹ exosomes carrying 1μg of siRNA in a volume of 100μl of plasmalyte. Mice were imaged to confirm proper anatomical injection and to monitor for progression of disease burden using an IVIS-100 bioluminescent imager. For bioluminescence imaging (BLI) acquisition, D-Luciferin (150 mg/kg, Goldbio, USA) was injected intraperitoneally following the manufacturer’s protocol. Images were captured using an IVIS-100 imaging system twice a week post-transplantation.
In vivo MSC exosome biodistribution
MSC exosomes were labeled with 1 μM 1,1′-dioctadecyltetramethyl indotricarbocyanine iodide (DiIC18, XenoLight DiR, Perkin Elmer) by incubation for 5 min at 37°C and 15 minutes at 4°C, washed overnight by ultracentrifugation in 10 ml PBS at 100,000 g in a SW 41 Ti rotor (Beckman Coulter) and resuspended in plasmalyte. Prelabeled MSC exosomes resuspended in plasmalyte were injected (8x10⁹/100 μl/mouse) via retro-orbital sinus in non-tumor-bearing and GL261 tumor-bearing nude mice and compared to mice injected with the dye only. 293F exosomes were labeled with 1 μM 1,1’-Dioctadecyl-3,3,3’,3’-Tetramethylindocarbocyanine Perchlorate (DiIC18(3), DiI, Invitrogen) by incubation for 1 hour at 37°C in 1 mL PBS. 500 μL of total exosome isolation reagent from cell culture media (Thermo Fisher) was added, the mixture vortexed, and incubated at 4°C overnight. The sample was centrifuged at 21,000 g for 1 hour at 4°C, the supernatant discarded, and the pellet resuspended in PBS. DiI labeled 293F exosomes were injected (1x10¹⁰/100 μl/mouse) via retro-orbital sinus in non-tumor-bearing C57BL/6J mice (Jackson Laboratory). DiI and DiR only controls were prepared in the same manner as labeled exosomes but lacked exosomes. For temozolomide treatment, mice were injected with temozolomide (40mg/kg) or vehicle (DMSO) i.p. daily. Bioluminescence imaging was used to validate intracranial GL261 luciferase-expressing tumors. Six hours after prelabeled MSC exosomes injection, the mice were euthanized, and the brains were collected and immediately imaged ex-vivo. Fluorescence imaging was performed using the IVIS-100 imaging system (IVIS Lumina XR) using the excitation filter at 700 nm and the emission filter at 780 nm. U87-GFP tumor bearing mice treated with exosomes containing Alexa Fluor 546 tagged Ctrl-siRNA#2 were euthanized, brains fixed in 4% paraformaldehyde overnight at 4°C, incubated in 30% sucrose for 48 hours and embedded in OCT. 5 μm sections were stained with Hoechst 33342 (Invitrogen), mounted with Vectashield mounting media, and imaged with a Zeiss Axio Observer Z1 epifluorescent microscopy with a 63x objective. Mice injected with 293F exosomes were perfusion fixed with 4% paraformaldehyde, the tissues incubated in 30% sucrose for 48 hours and embedded in OCT. 10 μm sections were stained with Hoechst 33342 (Invitrogen), mounted with Vectashield mounting media, and imaged with a Zeiss LSM800 confocal microscope with a 20x objective. Images are presented as maximum intensity projections.
Histology and Immunohistochemistry
Brain tissues were fixed overnight at room temperature in 10% neutral buffered formalin, dehydrated and embedded in paraffin. Tissue sections of 4μm thickness were cut and H&E stained (Leica). Digital slides scans of brain tumor sections were performed using AxioScan.Z1 (Zeiss) using a 20x objective. For immunohistochemical detection of Myc, CD31, and Ki67, heat-mediated antigen retrieval was performed at 98°C for 30 minutes in Tris-EDTA buffer (10 mM Tris Base, 1 mM EDTA, and 0.05% Tween 20, pH 9). Tissue sections were incubated with 0.3% peroxide for 15 minutes at room temperature and subsequently blocked with 1% bovine serum albumin (BSA) in PBS for 1 hour at room temperature. The following primary antibodies were used: Myc (EP121, Cell Marque, 1ug/ml), Ki67 (RM-9106, Thermo Fisher Scientific, 1:400), CD31 (Dia310M, DiaNova, 1:50) and incubated overnight at 4°C. Anti-rat (Polink-1 HRP polymer (Golden Bridge International Labs, D35-110)) and anti-rabbit (Rabbit on rodent HRP polymer; Biocare Medical) conjugated HRP antibodies were used and incubated for 30 min at room temperature. 3,3′-diaminobenzidine (DAB) substrate was used for visualization according to the manufacturer’s recommendations. All tissue sections were counterstained with hematoxylin. Brightfield images were acquired with a Leica DM1000 LED (light-emitting diode) microscope mounted with a DFC295 microscope camera (Leica) using LAS version 4.4 software (Leica). Immunoreactive score (IRS) was defined as previously described53. Four images were captured at 400X for Ki67 quantification and 3 images were captured at 200X for CD31 quantification. Data are presented as the average per mouse.
RNA-seq sample processing and analysis
iExo-Ctrl#1 (N=4 tumors) and iExo-Myc#1 (N=3 tumors) treated samples; and iExo-Ctrl#2 (N=4 tumors) and iExo-Myc#2 (N=5 tumors) treated samples were processed for RNA-seq analysis. Total RNA was extracted with Trizol (Invitrogen) and cleaned up using a RNeasy extraction kit (Qiagen). RNA concentration was measured by NanoDrop, and RNA quality was assessed using Bioanalyzer RNA 6000 Nano assay (Agilent). Samples with an RNA integrity number score ≥7.2 were submitted to the MDACC Sequencing and ncRNA Program for sequencing. Illumina Nextseq500 was used for sequencing. For RNA-seq dataset analysis, we converted BCL files to FASTQ using Illumina bcl2fastq/2.20.0 module. RNA QC was performed using RNA-SeQC(v1.1.7).54 The FASTQ files were aligned to hg19+mm10 reference genome (mm10 added to remove mouse reads) using STAR (2.6.0b)55 and followed by mark_duplication (http://broadinstitute.github.io/picard/) to generate bam files. RNA quantification was conducted from the bam files using HTSeq.
For the downstream analysis, we employed the prcomp function from R package stats (version 4.1.2) to perform principal components analysis. Limma package (version 3.50.0) was used to perform the differential expression analysis and significant genes were determined by p-value less than 0.05 and absolute fold change higher than 1.5. Gene Set Enrichment Analysis was conducted using GSEA (version 4.1.0).56 The data was deposited into Gene Expression Omnibus, GSE207452.
Single nuclei RNA sequencing
Nuclei from frozen tumors were isolated from ~40 mg of both iExo-Myc#1 and iExo-Ctrl#1 retro-orbital-administered tumors that were treated using the EZ Prep buffer (Sigma). The nuclei suspension was centrifuged at 500xg for 5 minutes at 4°C followed by an additional EZ PREP washing step. An additional washing step was performed using nuclei suspension buffer (NSB) containing PBS, 0.01% BSA and 0.1% RNase inhibitor. Nuclei were resuspended in 2 ml NSB and filtered through a 35 μm strainer, stained with DAPI and counted.
Nuclei and custom-made barcode (BC) beads (ChemGenes) were loaded at a concentration of 300,000 nuclei/ml in NSB and 350,000 beads/ml in lysis buffer in separate 3 ml syringes. A 75-micron microfluidic device fabricated in-house was used to run the Droplet Nuclear Sequencing (DroNc-seq) experiments at 1.5, 1.5 and 12 ml/hr flow-rated for the nuclei, BC beads and carrier oil channels respectively, with approximately 22 minutes per collection. Following collection, drops were broken, and uniquely barcoded cDNA was generated from the barcoded polyT-mRNA hybrids using reverse transcription. The barcoded cDNA attached to the polymer beads called STAMPs was washed several times in TE buffer containing Tween and SDS, then treated with exonuclease I enzyme (Sigma) to digest and remove any barcodes that did not have a cDNA attached to them. The number of recovered beads or STAMPS were counted. Approximately 20 wells in a PCR plate with 5000 beads per well were amplified through 15 cycles of PCR. Supernatants from each well were pooled and cleaned with 0.6x SPRI beads. Purified cDNA was quantified using a Qubit DNA assay kit and 450-650 pg of each sample was used as input for Nextera library preparation reactions (12 cycles). Tagmented libraries were quantified on Agilent BioAnalyzer High sensitivity chip before sequencing. All sequencing was performed at the Genomics Facility, University of Chicago, on an Illumina Nextseq 500 sequencer using 75 cycle v3 kits. Paired end sequencing with 20 bp for Read 1, and 60 bp for Read 2 was performed using a custom Read 1 primer: GCCTGTCCGCGGAAGCAGTGGTATCAACGCAGAGTAC (IDT).
Data alignment preprocessing and quality control
Using DroNc-seq alignment pipeline that considers both intronic and exonic reads, we obtained the gene expression profiles for individual nuclei in the form of digital gene expression (DGE) matrix for each sample. We collected ~5000 nuclei for each sample, with 200-400 genes detected per nucleus, depending on the quality of the sample and sequencing depth. A total of 40,000 unique Gencode v.27 identifiers or transcript fragments were detected across all samples. The identifiers included most protein-coding genes, pseudogenes and lncRNA. The relative abundance of unspliced mRNA in the nucleus resulted in a high fraction of intronic reads in our single-nucleus DroNc-seq data, compared to single-cell sequencing. Incorporating the intronic fragments increased the number of genes detected per nucleus by about two-fold, thus improving the overall capture efficiency per nucleus.
snRNA-seq data analysis
The count matrices were adopted for the downstream analysis. To minimize the noise in the single cell data, the threshold for the number of genes detected per nucleus was set to 450, which resulted in expression matrices with high-quality, albeit fewer, cells per sample. We performed log-normalization on the number of unique molecule identifiers (UMI) per nucleus on the expression data and centered the expression per gene at zero. Next, we employed Harmony (version 1.0)57 to correct the batch effects of all samples. We imputed the missing gene expression using the Markov affinity-based graph imputation of cells (MAGIC) tool (version 2.0.3).58 Multiple functions from the Seurat package (version 4.0.3)59 were used to perform the downstream clustering and cell cycle analysis. Specifically, we used “RunUMAP” to perform the non-linear dimensional reduction of filtered cells and “FindClusters” to cluster cells with a resolution of 0.5. The resulting clusters and corresponding markers were consistent for gene expression matrices generated from both the exon region-based pipeline and intronic/exon region-based pipeline and showed the robustness of the reads collected by droplet-based single cell technology in both exon and intronic region. “FindAllMarkers” was used to identify the marker genes for each cluster. We obtained the signature genes of cell cycles from a previous study4 and used “CellCycleScoring” to generate the cell cycle score for each cell. R package clusterProfiler (3.16.1)60 was used to perform the Gene Ontology analysis for the markers of each cluster. Trajectory analysis was conducted by monocle3 package (version 0.2.2).61 For Ingenuity Pathway analysis (IPA), the lists of differentially expressed genes were uploaded into IPA software (version: 52912811). Pathways with z-score >2 and <−2 and log p-value>1.3 were considered significant. All analyses were performed under the R/4.0.0 environment. snRNA-seq data have been deposited in the Gene Expression Omnibus (GEO) (https://ncbi.nlm.nih.gov/geo/) with the accession number GSE208323.
Statistical analyses
Statistical analysis was performed with Prism 9. Data normality was determined using Shapiro-Wilk test. Statistical analyses were performed using ordinary one-way ANOVA with Dunnett’s multiple comparisons test and unpaired t test for normally distributed data. For non-normally distributed data, Kruskall-Wallis with Dunn’s multiple comparisons tests and Mann-Whitney test were performed. Error bars represent SEM.
Supplementary Material
Acknowledgements:
We thank Kenneth Dunner Jr. and the High-resolution Electron Microscopy Facility at the MD Anderson Cancer Center (CCSG grant NIH P30CA016672). We thank the MDACC Sequencing and ncRNA Program and Small Animal Imaging Facility at MD Anderson Cancer Center for help. We thank Riley Martin, Laura Snowden, and Qian Peng for their technical assistance and Xunian Zhou for data review. We thank Xingzhi Song and Chia-Chin Wu for their help with RNA-seq data analysis.
Funding:
This work was supported by Musella Foundation for Brain Tumor Research & Information, Inc and NIH R35CA263815. The R.K. laboratory is supported with research funds from The University of Texas MD Anderson Cancer Center and with a gift from Fifth Generation, Inc. (“Love, Tito’s”) to the Kalluri Laboratory. Other support includes the Small Animal Imaging Facility and High-resolution Electron Microscopy Facility (CCSG grant NCI P30CA16672).
Footnotes
Conflict of Interest statement: UT MD Anderson Cancer Center and R.K. hold patents in exosome biology that are licensed to Codiak Biosciences, Inc. MD Anderson Cancer Center and R.K. are stock equity holders in Codiak Biosciences, Inc. R.K. is a consultant and scientific adviser for Codiak Biosciences, Inc. K.M.M. received a speaker honorarium from Stellanova Therapeutics. V.S.L. is a Scientific Advisory Board member and stockholder of Stellanova Therapeutics.
References
- 1.Gilbert MR et al. A randomized trial of bevacizumab for newly diagnosed glioblastoma. N Engl J Med 370, 699–708, doi: 10.1056/NEJMoa1308573 (2014). [DOI] [PMC free article] [PubMed] [Google Scholar]
- 2.Arvanitis CD, Ferraro GB & Jain RK The blood-brain barrier and blood-tumour barrier in brain tumours and metastases. Nat Rev Cancer 20, 26–41, doi: 10.1038/s41568-019-0205-x (2020). [DOI] [PMC free article] [PubMed] [Google Scholar]
- 3.Patel AP et al. Single-cell RNA-seq highlights intratumoral heterogeneity in primary glioblastoma. Science 344, 1396–1401, doi: 10.1126/science.1254257 (2014). [DOI] [PMC free article] [PubMed] [Google Scholar]
- 4.Neftel C et al. An Integrative Model of Cellular States, Plasticity, and Genetics for Glioblastoma. Cell 178, 835–849.e821, doi: 10.1016/j.cell.2019.06.024 (2019). [DOI] [PMC free article] [PubMed] [Google Scholar]
- 5.Phillips HS et al. Molecular subclasses of high-grade glioma predict prognosis, delineate a pattern of disease progression, and resemble stages in neurogenesis. Cancer Cell 9, 157–173, doi: 10.1016/j.ccr.2006.02.019 (2006). [DOI] [PubMed] [Google Scholar]
- 6.Wang L et al. The Phenotypes of Proliferating Glioblastoma Cells Reside on a Single Axis of Variation. Cancer Discov 9, 1708–1719, doi: 10.1158/2159-8290.Cd-19-0329 (2019). [DOI] [PMC free article] [PubMed] [Google Scholar]
- 7.Minata M et al. Phenotypic Plasticity of Invasive Edge Glioma Stem-like Cells in Response to Ionizing Radiation. Cell Rep 26, 1893–1905 e1897, doi: 10.1016/j.celrep.2019.01.076 (2019). [DOI] [PMC free article] [PubMed] [Google Scholar]
- 8.Wang Q et al. Tumor Evolution of Glioma-Intrinsic Gene Expression Subtypes Associates with Immunological Changes in the Microenvironment. Cancer Cell 32, 42–56 e46, doi: 10.1016/j.ccell.2017.06.003 (2017). [DOI] [PMC free article] [PubMed] [Google Scholar]
- 9.Bhat KPL et al. Mesenchymal differentiation mediated by NF-kappaB promotes radiation resistance in glioblastoma. Cancer Cell 24, 331–346, doi: 10.1016/j.ccr.2013.08.001 (2013). [DOI] [PMC free article] [PubMed] [Google Scholar]
- 10.Halliday J et al. In vivo radiation response of proneural glioma characterized by protective p53 transcriptional program and proneural-mesenchymal shift. Proc Natl Acad Sci U S A 111, 5248–5253, doi: 10.1073/pnas.1321014111 (2014). [DOI] [PMC free article] [PubMed] [Google Scholar]
- 11.Lathia JD, Mack SC, Mulkearns-Hubert EE, Valentim CL & Rich JN Cancer stem cells in glioblastoma. Genes Dev 29, 1203–1217, doi: 10.1101/gad.261982.115 (2015). [DOI] [PMC free article] [PubMed] [Google Scholar]
- 12.Zaytseva O, Kim NH & Quinn LM MYC in Brain Development and Cancer. Int J Mol Sci 21, doi: 10.3390/ijms21207742 (2020). [DOI] [PMC free article] [PubMed] [Google Scholar]
- 13.Ashrafizadeh M et al. C-Myc Signaling Pathway in Treatment and Prevention of Brain Tumors. Curr Cancer Drug Targets 21, 2–20, doi: 10.2174/1568009620666201016121005 (2021). [DOI] [PubMed] [Google Scholar]
- 14.Wang H et al. Dual PLK1 and STAT3 inhibition promotes glioblastoma cells apoptosis through MYC. Biochem Biophys Res Commun 533, 368–375, doi: 10.1016/j.bbrc.2020.09.008 (2020). [DOI] [PubMed] [Google Scholar]
- 15.Tateishi K et al. Myc-Driven Glycolysis Is a Therapeutic Target in Glioblastoma. Clin Cancer Res 22, 4452–4465, doi: 10.1158/1078-0432.Ccr-15-2274 (2016). [DOI] [PMC free article] [PubMed] [Google Scholar]
- 16.Lee DH et al. Histone demethylase KDM4C controls tumorigenesis of glioblastoma by epigenetically regulating p53 and c-Myc. Cell Death Dis 12, 89, doi: 10.1038/s41419-020-03380-2 (2021). [DOI] [PMC free article] [PubMed] [Google Scholar]
- 17.Bhaduri A et al. Outer Radial Glia-like Cancer Stem Cells Contribute to Heterogeneity of Glioblastoma. Cell Stem Cell 26, 48–63.e46, doi: 10.1016/j.stem.2019.11.015 (2020). [DOI] [PMC free article] [PubMed] [Google Scholar]
- 18.Annibali D et al. Myc inhibition is effective against glioma and reveals a role for Myc in proficient mitosis. Nat Commun 5, 4632, doi: 10.1038/ncomms5632 (2014). [DOI] [PMC free article] [PubMed] [Google Scholar]
- 19.Li C et al. Protective effect of c-Myc/Rab7a signal pathway in glioblastoma cells under hypoxia. Ann Transl Med 8, 283, doi: 10.21037/atm.2020.02.173 (2020). [DOI] [PMC free article] [PubMed] [Google Scholar]
- 20.Soucek L et al. Modelling Myc inhibition as a cancer therapy. Nature 455, 679–683, doi: 10.1038/nature07260 (2008). [DOI] [PMC free article] [PubMed] [Google Scholar]
- 21.Whitfield JR & Soucek L The long journey to bring a Myc inhibitor to the clinic. J Cell Biol 220, doi: 10.1083/jcb.202103090 (2021). [DOI] [PMC free article] [PubMed] [Google Scholar]
- 22.Wilson A et al. c-Myc controls the balance between hematopoietic stem cell self-renewal and differentiation. Genes Dev 18, 2747–2763, doi: 10.1101/gad.313104 (2004). [DOI] [PMC free article] [PubMed] [Google Scholar]
- 23.Yang F et al. Long non-coding RNA GHET1 promotes gastric carcinoma cell proliferation by increasing c-Myc mRNA stability. Febs j 281, 802–813, doi: 10.1111/febs.12625 (2014). [DOI] [PubMed] [Google Scholar]
- 24.Zhang K et al. AGO2 Mediates MYC mRNA Stability in Hepatocellular Carcinoma. Mol Cancer Res 18, 612–622, doi: 10.1158/1541-7786.Mcr-19-0805 (2020). [DOI] [PMC free article] [PubMed] [Google Scholar]
- 25.Visvanathan A, Patil V, Abdulla S, Hoheisel JD & Somasundaram K N6-Methyladenosine Landscape of Glioma Stem-Like Cells: METTL3 Is Essential for the Expression of Actively Transcribed Genes and Sustenance of the Oncogenic Signaling. Genes (Basel) 10, doi: 10.3390/genes10020141 (2019). [DOI] [PMC free article] [PubMed] [Google Scholar]
- 26.Wolf E & Eilers M Targeting MYC Proteins for Tumor Therapy. Annual Review of Cancer Biology 4, 61–75, doi: 10.1146/annurev-cancerbio-030518-055826 (2020). [DOI] [Google Scholar]
- 27.Madden SK, de Araujo AD, Gerhardt M, Fairlie DP & Mason JM Taking the Myc out of cancer: toward therapeutic strategies to directly inhibit c-Myc. Molecular Cancer 20, 3, doi: 10.1186/s12943-020-01291-6 (2021). [DOI] [PMC free article] [PubMed] [Google Scholar]
- 28.Masso-Valles D & Soucek L Blocking Myc to Treat Cancer: Reflecting on Two Decades of Omomyc. Cells 9, doi: 10.3390/cells9040883 (2020). [DOI] [PMC free article] [PubMed] [Google Scholar]
- 29.Setten RL, Rossi JJ & Han SP The current state and future directions of RNAi-based therapeutics. Nat Rev Drug Discov 18, 421–446, doi: 10.1038/s41573-019-0017-4 (2019). [DOI] [PubMed] [Google Scholar]
- 30.Sklar MD et al. Depletion of c-myc with specific antisense sequences reverses the transformed phenotype in ras oncogene-transformed NIH 3T3 cells. Mol Cell Biol 11, 3699–3710, doi: 10.1128/mcb.11.7.3699-3710.1991 (1991). [DOI] [PMC free article] [PubMed] [Google Scholar]
- 31.Devi GR et al. In vivo bioavailability and pharmacokinetics of a c-MYC antisense phosphorodiamidate morpholino oligomer, AVI-4126, in solid tumors. Clin Cancer Res 11, 3930–3938, doi: 10.1158/1078-0432.Ccr-04-2091 (2005). [DOI] [PubMed] [Google Scholar]
- 32.Habib S, Ariatti M & Singh M Anti-c-myc RNAi-Based Onconanotherapeutics. Biomedicines 8, doi: 10.3390/biomedicines8120612 (2020). [DOI] [PMC free article] [PubMed] [Google Scholar]
- 33.Kalluri R & LeBleu VS The biology, function, and biomedical applications of exosomes. Science 367, doi: 10.1126/science.aau6977 (2020). [DOI] [PMC free article] [PubMed] [Google Scholar]
- 34.Kamerkar S et al. Exosomes facilitate therapeutic targeting of oncogenic KRAS in pancreatic cancer. Nature 546, 498–503, doi: 10.1038/nature22341 (2017). [DOI] [PMC free article] [PubMed] [Google Scholar]
- 35.Cheng L & Hill AF Therapeutically harnessing extracellular vesicles. Nat Rev Drug Discov 21, 379–399, doi: 10.1038/s41573-022-00410-w (2022). [DOI] [PubMed] [Google Scholar]
- 36.Perocheau D, Touramanidou L, Gurung S, Gissen P & Baruteau J Clinical applications for exosomes: Are we there yet? Br J Pharmacol 178, 2375–2392, doi: 10.1111/bph.15432 (2021). [DOI] [PMC free article] [PubMed] [Google Scholar]
- 37.Guo S et al. Intranasal Delivery of Mesenchymal Stem Cell Derived Exosomes Loaded with Phosphatase and Tensin Homolog siRNA Repairs Complete Spinal Cord Injury. ACS Nano 13, 10015–10028, doi: 10.1021/acsnano.9b01892 (2019). [DOI] [PubMed] [Google Scholar]
- 38.Moss LD et al. Intranasal delivery of exosomes from human adipose derived stem cells at forty-eight hours post injury reduces motor and cognitive impairments following traumatic brain injury. Neurochem Int 150, 105173, doi: 10.1016/j.neuint.2021.105173 (2021). [DOI] [PMC free article] [PubMed] [Google Scholar]
- 39.Perets N, Hertz S, London M & Offen D Intranasal administration of exosomes derived from mesenchymal stem cells ameliorates autistic-like behaviors of BTBR mice. Mol Autism 9, 57, doi: 10.1186/s13229-018-0240-6 (2018). [DOI] [PMC free article] [PubMed] [Google Scholar]
- 40.Meyer N & Penn LZ Reflecting on 25 years with MYC. Nat Rev Cancer 8, 976–990, doi: 10.1038/nrc2231 (2008). [DOI] [PubMed] [Google Scholar]
- 41.Habib N et al. Massively parallel single-nucleus RNA-seq with DroNc-seq. Nat Methods 14, 955–958, doi: 10.1038/nmeth.4407 (2017). [DOI] [PMC free article] [PubMed] [Google Scholar]
- 42.Wu H, Kirita Y, Donnelly EL & Humphreys BD Advantages of Single-Nucleus over Single-Cell RNA Sequencing of Adult Kidney: Rare Cell Types and Novel Cell States Revealed in Fibrosis. J Am Soc Nephrol 30, 23–32, doi: 10.1681/ASN.2018090912 (2019). [DOI] [PMC free article] [PubMed] [Google Scholar]
- 43.Bakken TE et al. Single-nucleus and single-cell transcriptomes compared in matched cortical cell types. PLoS One 13, e0209648, doi: 10.1371/journal.pone.0209648 (2018). [DOI] [PMC free article] [PubMed] [Google Scholar]
- 44.Basile G et al. Using single-nucleus RNA-sequencing to interrogate transcriptomic profiles of archived human pancreatic islets. Genome Med 13, 128, doi: 10.1186/s13073-021-00941-8 (2021). [DOI] [PMC free article] [PubMed] [Google Scholar]
- 45.Tirosh I et al. Dissecting the multicellular ecosystem of metastatic melanoma by single-cell RNA-seq. Science 352, 189–196, doi: 10.1126/science.aad0501 (2016). [DOI] [PMC free article] [PubMed] [Google Scholar]
- 46.Barron M & Li J Identifying and removing the cell-cycle effect from single-cell RNA-Sequencing data. Sci Rep 6, 33892, doi: 10.1038/srep33892 (2016). [DOI] [PMC free article] [PubMed] [Google Scholar]
- 47.Kim Y et al. Perspective of mesenchymal transformation in glioblastoma. Acta Neuropathologica Communications 9, 50, doi: 10.1186/s40478-021-01151-4 (2021). [DOI] [PMC free article] [PubMed] [Google Scholar]
- 48.Fedele M, Cerchia L, Pegoraro S, Sgarra R & Manfioletti G Proneural-Mesenchymal Transition: Phenotypic Plasticity to Acquire Multitherapy Resistance in Glioblastoma. Int J Mol Sci 20, doi: 10.3390/ijms20112746 (2019). [DOI] [PMC free article] [PubMed] [Google Scholar]
- 49.Behnan J, Finocchiaro G & Hanna G The landscape of the mesenchymal signature in brain tumours. Brain 142, 847–866, doi: 10.1093/brain/awz044 (2019). [DOI] [PMC free article] [PubMed] [Google Scholar]
- 50.Jain M et al. Sustained loss of a neoplastic phenotype by brief inactivation of MYC. Science 297, 102–104, doi: 10.1126/science.1071489 (2002). [DOI] [PubMed] [Google Scholar]
- 51.Shroff EH et al. MYC oncogene overexpression drives renal cell carcinoma in a mouse model through glutamine metabolism. Proc Natl Acad Sci U S A 112, 6539–6544, doi: 10.1073/pnas.1507228112 (2015). [DOI] [PMC free article] [PubMed] [Google Scholar]
- 52.Shachaf CM et al. MYC inactivation uncovers pluripotent differentiation and tumour dormancy in hepatocellular cancer. Nature 431, 1112–1117, doi: 10.1038/nature03043 (2004). [DOI] [PubMed] [Google Scholar]
- 53.Fedchenko N & Reifenrath J Different approaches for interpretation and reporting of immunohistochemistry analysis results in the bone tissue - a review. Diagn Pathol 9, 221, doi: 10.1186/s13000-014-0221-9 (2014). [DOI] [PMC free article] [PubMed] [Google Scholar]
- 54.DeLuca DS et al. RNA-SeQC: RNA-seq metrics for quality control and process optimization. Bioinformatics 28, 1530–1532, doi: 10.1093/bioinformatics/bts196 (2012). [DOI] [PMC free article] [PubMed] [Google Scholar]
- 55.Dobin A et al. STAR: ultrafast universal RNA-seq aligner. Bioinformatics 29, 15–21, doi: 10.1093/bioinformatics/bts635 (2013). [DOI] [PMC free article] [PubMed] [Google Scholar]
- 56.Subramanian A et al. Gene set enrichment analysis: a knowledge-based approach for interpreting genome-wide expression profiles. Proc Natl Acad Sci U S A 102, 15545–15550, doi: 10.1073/pnas.0506580102 (2005). [DOI] [PMC free article] [PubMed] [Google Scholar]
- 57.Korsunsky I et al. Fast, sensitive and accurate integration of single-cell data with Harmony. Nat Methods 16, 1289–1296, doi: 10.1038/s41592-019-0619-0 (2019). [DOI] [PMC free article] [PubMed] [Google Scholar]
- 58.van Dijk D et al. Recovering Gene Interactions from Single-Cell Data Using Data Diffusion. Cell 174, 716–729.e727, doi: 10.1016/j.cell.2018.05.061 (2018). [DOI] [PMC free article] [PubMed] [Google Scholar]
- 59.Hao Y et al. Integrated analysis of multimodal single-cell data. Cell 184, 3573–3587.e3529, doi: 10.1016/j.cell.2021.04.048 (2021). [DOI] [PMC free article] [PubMed] [Google Scholar]
- 60.Yu G, Wang LG, Han Y & He QY clusterProfiler: an R package for comparing biological themes among gene clusters. Omics 16, 284–287, doi: 10.1089/omi.2011.0118 (2012). [DOI] [PMC free article] [PubMed] [Google Scholar]
- 61.Cao J et al. The single-cell transcriptional landscape of mammalian organogenesis. Nature 566, 496–502, doi: 10.1038/s41586-019-0969-x (2019). [DOI] [PMC free article] [PubMed] [Google Scholar]
Associated Data
This section collects any data citations, data availability statements, or supplementary materials included in this article.