

Abstract
Wearable electronics play important roles in noninvasive, continuous, and personalized monitoring of multiple biosignals generated by the body. To unleash their full potential for next-generation human centered bio-integrated electronics, the wireless sensing capability is a desirable feature. However, state-of-the-art wireless sensing technologies exploit rigid and bulky electronic modules for power supply, signal generation, and data transmission. This study reports a battery-free device technology based on a “two-part” resonance circuit model with modularized, physically separated, and detachable functional units for magnetic coupling and biosensing. The resulting platform combines advantages of electronics and microfluidics with low cost, minimized form factors, and improved performance stability. Demonstration of a detachable sweat patch capable of simultaneous recording of cortisol concentration, pH value, and temperature highlights the potential of the “two-part” circuit for advanced, transformative biosensing. The resulting wireless sensors provide a new engineering solution to monitoring biosignals through intimate and seamless integration with skin surfaces.
Keywords: sweat sensors, epidermal electronics, battery-free electronics, resonance circuits, cortisol, multifunctional
Graphical Abstract
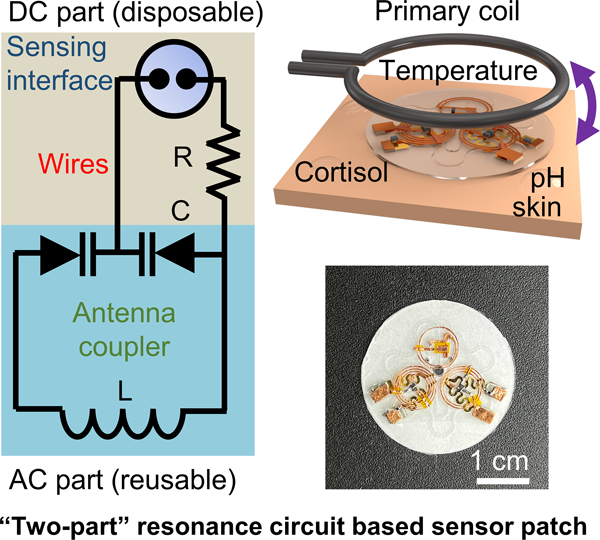
This work reports a wireless, battery-free, multifunctional epidermal sweat sensor system based on a two-part resonance circuit model. The sensing platform is capable of measuring sweat cortisol level, sweat pH, and skin temperature simultaneously. Such bio-integrated epidermal sensing systems can serve as a complementary tool for health status tracking and close-loop health management to commercialized sensors with on-chip electronic modules.
1. Introduction
Today, fast paced modern lifestyle is causing high levels of mental and physical stress to people, which could weaken the immune system of the human body and result in health issues such as depression, cardiovascular disease, and Cushing’s disease.[1–4] Since patients’ self-reports of symptoms are highly subjective, it is crucial to develop strategies enabling the tracking of the stress level of the human body in a quantitative and continuous manner for early diagnosis and timely intervention of stress-related diseases. As a classic example, the end product of the Hypothalamus-Pituitary-Adrenal (HPA) axis, cortisol (Figure 1a) - “the stress hormone”,[5] often serves as a quantitative measure of the body’s stress level, since its concentration tends to increase with stress as a natural response to maintain homeostasis.[6] Real-time and continuous monitoring of cortisol in human biofluids, as well as other relevant chemical and biological markers, is therefore vital for tracking the health/emotion status, metabolism, and immune response of the human body. Among all human biofluids, sweat is highly appealing for cortisol analysis due to the noninvasive nature and the easy accessibility of samples.[7–12] Consequently, the need for real-time capture and analysis of cortisol level in freshly excreted sweat has motivated continued efforts in developing bio-integrated analytical tools, ideally, with the wireless sensing capability. Recent works report the demonstration of cortisol sensors in various forms, including those working based on electrochemical impedance spectroscopy (EIS),[13–15] differential pulse voltammetry (DPV),[16–17] cyclic voltammetry (CV),[18–19] chronoamperometry (CA),[7, 20] field-effect/electrochemical transistors,[21–25] and colorimetry.[26–27] The remarkable success of the pioneering studies has paved the way for utilizing this concept towards stress monitoring and management in biomedical research and translational engineering. Nevertheless, the following issues in establishing ready-to-use biochemical sensing platforms require additional attention: (1) The design of the cortisol-recognition interface is worth further investigation to ensure that the dynamic range of the sensor can fully encompass physiologically relevant concentrations since the levels of hormones such as cortisol are naturally low (0.4–142 ng ml−1 in sweat).[4, 28] The system should also allow for on-chip generation of measurable signals within a reasonable period and without relying on additional chemicals (e.g., reagents for immunoassays, redox probes for EIS). (2) Conventional sensing strategies for cortisol, such as CV, DPV, and EIS, require complex collections of hardware mounted on printed circuit boards: most existing wearable sensing technologies utilize digital wireless schemes (e.g., Bluetooth, near-field communication) and addition subsystems for signal generation/processing and power management/supply. Difficulties in minimizing the overall dimensions, thickness, weight, flexibility, and conformality to skin of the resulting systems represent practical challenges in realizing their applications for human centric health monitoring during daily activities.
Figure 1.

Device concept of the multifunctional epidermal sensing system and envisioned applications in advanced healthcare. (a) Schematic illustration of the stress-induced generation of cortisol. Stress will trigger the secretion of corticotropin-releasing hormone (CRH) in central nervous system, which will induce the production of adrenocorticotropic hormone and further trigger the production of cortisol in adrenal glands. The generated cortisol will be transported to sweat glands by the circulation system and finally be excreted out of human body in sweat. (b) Concept of using the wearable, resonance circuit based sweat patch reported in this work for concurrent monitoring of sweat cortisol, pH and temperature for daily healthcare, and early prevention and diagnosis of stress-related diseases.
To address these challenges, this work reports the design, integration, characterization, and application of a resonance circuit-based wireless sensing system for stress monitoring and management. This platform exploits single stranded DNA aptamers[29–33] as the biorecognition elements for cortisol.[34–36] The conformational rearrangement of aptamers with negatively charged backbones upon the formation of aptamer-cortisol complexes generates a detectable change in surface potential by perturbating the electric double layer.[30, 37] Coupling the functionalized sensing interface and an on-chip reference electrode to a pair of varactor diodes in an inductor-capacitor (LC) resonance circuit transduces a modification in surface potential into a quantifiable change in the resonance frequency of the LC resonator. As this method physically separates the sensing interface from the LC resonator, a unique “two-part” detachable sensor layout enables reversible connection between a reusable antenna coupler and a disposable microfluidics-integrated sensing interface. The isolation of the coupling unit from the sensing site makes the circuit suitable for designing skin-interfaced sensor systems that can operate with a high fidelity in electrical performance on curvilinear and soft entities. Based on a similar working principle of surface potential-modification, adapting the modularized design with corresponding sensing interfaces allows for extending this concept to alternative biomarkers. Demonstration of a multifunctional system consisting of cortisol, pH, and temperature sensors suggests the versatility of this approach (Figure 1b). Overall, the resulting sensor prototype provides a promising and realistic strategy for establishing lightweight, battery-free, low-cost, and multifunctional epidermal sensing platforms, which addresses fundamental limitations crucial to advancing the field of telehealth and personalized precision medicine. Such bio-integrated epidermal sensing systems can serve as a complementary tool for health status tracking and close-loop health management to commercialized sensors with on-chip electronic modules.
2. Results and Discussion
2.1. Design and Working Principle of the Detachable Sensor System
Figure 2 shows the design and working principle of the resonance circuit-based sensing platform. An example of an integrated, multifunctional, skin-interfaced sensing patch appears in Figure 2a. The system consists of three sensing units designed for detection of cortisol, pH, and temperature. Figure 2b presents an exploded view schematic illustration of the overall construction, with corresponding photographs and microscopic images of key functional parts shown on the right (Figure 2c-2d) fabricated using a “cut-and-paste” method[38] (Figure S1). The platform includes two functional layers separated by a polyester (PET) film spacer: a disposable biochemical interface contacting target biofluids (sweat) for surface potential capture (direct current (DC) part) and a reusable magnetic coupling unit for signal transmission (alternative current (AC) part). A set of neodymium magnets affixed with conductive adhesives enables mechanically robust, reversible, and self-aligning attachment between the DC and AC parts through openings in the PET film. A silicone elastomer (polydimethylsiloxane, PDMS) patterned by soft lithography (Figure S2) defines a microfluidic channel (filled with red liquid, width: 0.5 mm, height: ~ 180 μm, total volume: ~ 3.6 μL) (Figure 2e) which collects and routes sweat via capillary force[26, 39–40] to the functional area in the DC part for the generation of quantifiable biochemical signals. The sweat collecting patch also consists of another channel (filled with blue liquid, width: 0.6 mm, height: ~ 180 μm, total volume: 11.28 μL) for real-time sweat rate measurement during exercise. A double-sided medical adhesive (3M 2477P) forms contact with the skin, allowing for comfortable and irritation-free mounting onto soft and curvilinear surfaces of the body. sweat rate measurement during exercise. A double-sided medical adhesive (3M 2477P) forms contact with the skin, allowing for comfortable and irritation-free mounting onto soft and curvilinear surfaces of the body.
Figure 2.

General design and sensing mechanism of the “two-part” resonance circuit based epidermal sensing system. (a) Schematic illustration of a multifunctional wearable sweat patch consisting of a cortisol sensor, a sweat pH sensor, and a temperature sensor. (b) Exploded view of “two-part” sensor system showing key functional layers including the LC magnetic coupling units, the gold working electrodes, the microfluidic channels, and a piece of double-sided medical adhesive as the interface to the skin. (c-d) Microscopic images of the LC coupling unit (c) and the gold working electrodes with serpentine wires (d). (e) Photograph of the microfluidics filled with colored liquids for visualization purpose. The blue trace represents the microfluidic channel for sweat rate measurement, and the red trace represents the sweat collecting channel for measurement of sweat cortisol and pH. (f) Circuit diagram of the chemical sensing system and schemes showing the modularized, detachable sensor design with the disposable DC and reusable AC parts connected through magnets. Changes in electric potential in the DC part will lead to shift in the resonance frequency of the AC part when powered by an RF energy radiated from an external reader system (vector network analyzer). (g-i) Photographs showing the assembly process of the “two-part” electronics. (j-k) Resonance curves (j) and extracted resonance frequencies (k) of the device after cyclic attaching-detaching cycles. The individual data points represent the averages of three measurements, and the error bars represent the standard deviation of three measurements (n = 3). (l) Resonance curves of a representative coupling unit with varying DC input as the reverse bias for the varactor diodes and (m) extracted resonance frequencies showing the voltage sensitivity. The individual data points represent the averages of three measurements, and the error bars represent the standard deviation of three measurements (n = 3).
The cortisol and pH sensors exploit a circuit model inspired by the working principle of tuning circuits in radio frequency (RF) electronics (Figure 2f):[41] in each chemical sensor, the interaction between the target biomarker and the corresponding recognition elements causes a change in the differential potential across a thin-film Ag/AgCl reference electrode (RE) and a chemically functionalized working electrode (WE) in the DC part. The potential serves as the reverse bias for a pair of varactor diodes in the magnetic coupling unit (AC part). Changes in the reverse bias modify the thickness of the depletion region of the p-n junction of the diodes, thus tuning the capacitance of the varactors, and accordingly, shifting the resonance frequency of the LC resonator according to the following equation:[42–45]
| (1) |
where is the inductance of the LC resonator. Aligning the coupling unit to an external antenna connected to a vector network analyzer (VNA) operated in reflection mode records the magnitude of the return loss . Sweeping the frequency spectrum yields a dip in around . Fitting the resonance curve determines the value for quantitative measurement of concentrations of biomarkers. Beyond the single sensor system, incorporating multiple sensors into the patch and varying the and of each coupling unit can sufficiently separate for simultaneous readout of different signals within a single sweep. For example, incorporating another LC circuit containing temperature-sensitive polyethylene glycol (PEG) capacitor[46] into the reusable AC part allows for the detection of skin temperature, providing a more comprehensive overview of physiological state through multimodal operation.
The detachable biochemical sensor design with physically separated DC and AC parts minimizes biofouling issue by isolating the fluidic sample reservoirs from the magnetic coupling unit. Replacing the sensing interface and the microfluidics for each measurement can address the saturation issue of aptamers while ensuring a low cost by recycling the AC part for biophysical sensing and/or wireless signal transmission. Figure 2g-2i show photographs of the device assembling process (Supplementary Movie S1). The resonance curves of a coupling unit during and after different numbers of attaching-detaching cycles appear in Figure 2j, suggesting negligible changes in (Figure 2k) throughout the process. Applying a reverse bias to the diodes evaluates the capability of the LC circuit in transducing DC signals and determines the voltage sensitivity (Figure 2l). An increasing thickens the width of depletion layer formed at the p-n junction in varactors, leading to a smaller and a larger according to Equation (1). The relationship between and is near-linear with a voltage sensitivity of 0.0506 MHz mV−1 ( range: 133.2 to 147.9 MHz) (Figure 2m). Please note that since the relationship between resonance frequency and capacitance is not a linear function, the response of resonators at different base frequencies to a same capacitance (and accordingly, voltage) variation is supposed to be different. In our work, however, results suggest a near linear mathematical relationship between and when the reverse bias is much lower than the junction potential of the varactor diode (i.e., < ~200 mV).[41] Figure S3a shows that the relationship between the reverse bias (0 – 200 mV) and resonance frequency is near-linear with a Pearson’s correlation coefficient of 0.9999. Therefore, it is still reasonable to use a single calibration curve for chemical sensing. Future efforts in exploiting the equation for calculation can further improve the sensing accuracy. Varying of the circuit shifts forms building components for multiplexed sensing platforms. An example of another LC resonator appears in Figure S3b, with voltage sensitivity of 0.0374 MHz mV−1 ( range: 98.4 to 109.2 MHz) (Figure S3c). The results suggest the feasibility of using the “two-part” resonance circuit for detecting changes in differential potential across WE and RE at mV scale.
2.2. Mechanical Robustness and Working Range
The “two-part” sensor design with modularized AC and DC units offers unique advantages in maintaining stable electrical performances for magnetic coupling when customized as skin-mounted electronics. Figure 3a shows the comparison between a conventional sensing platform and the coupling scheme in this work: most reported resonance circuit-based sensors have the responsive elements integrated within the coupling unit. When used as bio-integrated electronics, however, the overall circuitry goes through deformation in response to mechanical strains from the underlying tissues (i.e., epidermis), and the inductance and capacitance of the electronic components (including parasitic ones of the metal traces) will change inevitably which could affect and frustrate the interpretation of target signals. The “two-part” design, on the other hand, separates the magnetic coupling unit from the sensing interface with the PET film spacer in the middle such that the isolated antenna coupler provides stable performance on a different plane for signal transmission. Additionally, to minimize the impact associated with deformations of the DC part on , patterning conductive metal wires into serpentine structures accommodates mechanical strains in the DC part, and connecting a damping resistor in series with WE and RE isolates the DC circuitry from the coupling unit. Figure 3b shows an integrated device (Experimental Section) deployed to curved surfaces with a bending radius of 40, 60 and 80 mm. The almost overlapping resonance curves (Figure 3c) and stable magnitude and in response to bending (Figure 3d) highlight stable performance metrics (quality factor: ~11.8,: ~ 98.2 MHz) in magnetic coupling during mechanical deformation. The results demonstrate the broad range of conditions over which devices based on the “two-part” design provide stable performance. Another unique feature and advantage of the sensing scheme is that it works based on a frequency modulation mechanism responding to changes in according to Equation (1), in contrast to those measuring the amplitude of reflected signals. As is an intrinsic property of the LC circuit, this method can accommodate slight misalignments between the primary coil and the magnetic coupling unit.
Figure 3.
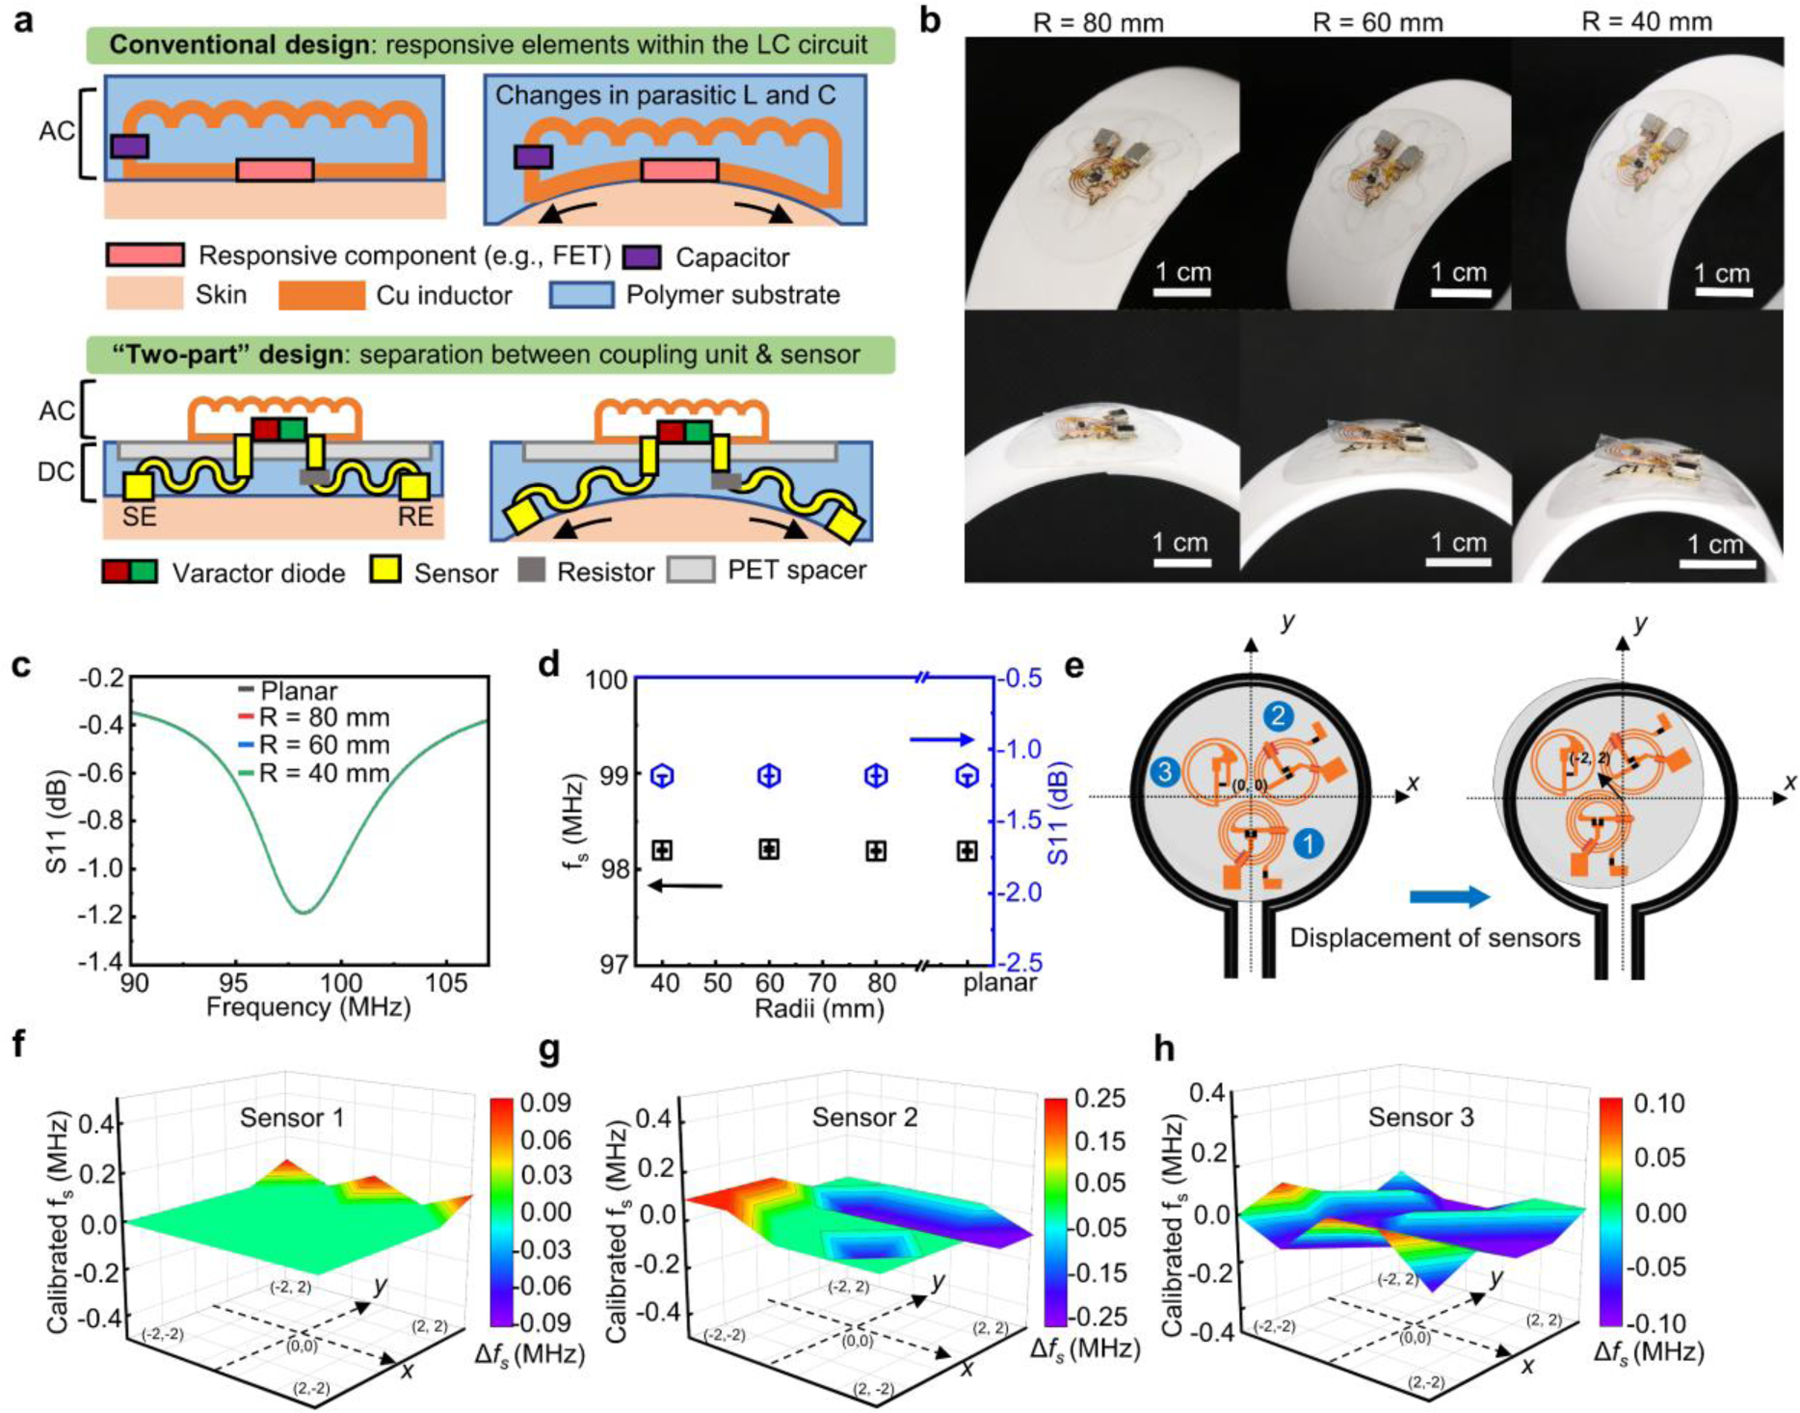
Characterizations of mechanical robustness and operational range of the sensing platform. (a) Schematic illustration comparing the conventional “one-part” LC resonance sensor with the “two-part” design reported in this work. (b) Photographs of a “two-part” sensor in bending configurations on curvilinear surfaces. (c-d) Resonance curve (c) and extracted resonance frequency and magnitude of the return loss (in dB) (d) of the sensor when deployed on surfaces with varying curvature radii. The individual data points represent the averages of three measurements, and the error bars represent the standard deviation of three measurements (n = 3). (e) Schematic illustration of the experimental setup for the displacement test by varying the relative position between the primary readout coil and LC sensors (unit of the coordination system: mm). (f-h) Variations in resonance frequencies of three LC sensors in the multifunctional system at different locations.
Resonators are very sensitive devices and are susceptible to deformation and parasitic capacitive effect despite of the separate design of this work with isolated AC and DC parts. Comparing of a resonator on a flat glass slide and a piece of pork skin evaluates the capacitive effect introduced by skin. Figure S4 shows the photographs, resonance curves and extracted resonance frequencies of the device. The of the system does not change significantly in the two cases (99.7 vs. 99.9 MHz). The results suggest that the deformation and parasitic parameters play a minor role in the performance stability of the resonator in the “two-part” design.
The robustness also allows for simultaneous recording of signals from multiple sensors in a single scan of the frequency spectrum. A displacement test characterizes the effects of misalignment within a three-sensor system and determines the working range (details in Experimental Section). Figure 3f-h present changes in values of the three sensors at different positions (Figure 3e) as extracted from the recorded resonance curves (Figure S5a-S5b). When moving inside the 2 × 2 mm square, the values of of all the three LC sensors remain stable with only minor variations below 0.1 MHz. Figure S5c and S5d present the resonance curves and the values of the three sensors recorded with varying vertical distances from the primary coil at (0,0) position. The minor variations in values of all the three sensors indicate that the system working based on the frequency modulation sensing mechanism is resistant to the environmental interference.
In a multi-sensor system, the mutual inductance between different sensors could affect the resonance frequencies of each individual sensor. Based on the results in Figure S4 (denoted as “resonator a”), another set of experiment examines the performance of the system using the same experimental setup (i.e., on a flat glass slide and a piece of pork skin) by adding an additional resonator next to resonator a (denoted as “resonator b”) (Figure S6a). Figure S6b presents measured resonance curves together with those in Figure S4b. In both cases, adding resonator b into the system causes almost negligible changes in of resonator a due to the lateral arrangement of the two electronic components, indicating that in both cases (in flat configuration and bent over the skin), the mutual inductance between resonator a and b remains minimal. For the two-resonator system, the of resonator a and b are 99.70 MHz and 129.37 MHz (in flat state), and 99.93 MHz and 129.60 MHz (bent over the skin). Overall, the results suggest that the mutual inductance and resonance frequency will not be affected when multiple sensors are bent over the skin. Devices used for potentiometric sensing should have a high impedance to ensure accurate measurement. Based on the measured return loss, the calculated input impedance of a resonator (AC part) used for this study is in the range of 9.5 Ω to 20.5 Ω near the resonance frequency (Figure S7a). And for resonance curves with slightly varying is in the range of 16.5 Ω to 17.5 Ω at the resonant point (Figure S7b). This does not affect potential measurements in the DC part in this study due to the following reasons: (1) The head-to-head varactor configuration eliminates the DC path and prevents AC signals from modulating the DC voltage by canceling out RF voltage–induced capacitance variation.[41] (2) In the DC part, the impedance of the varactors (6 ×10⁸ Ω, according to the datasheet) is designed to be much larger than that of the damping resistor (9×10³ Ω,) to avoid the formation of the voltage divider structure. Accordingly, 99.99% of the potential different between WE and RE will serve as the reverse bias for the varactors.
The wireless communication between the sensor and the readout system will generate electromagnetic field covering surrounding biotissues. Simulations evaluates the electromagnetic field and heat generation during operation (Figure S8 and Table S1) and proves the safety of the system for human body (Supplementary Note S1).
2.3. Development and Characterization of Aptamer Functionalized Cortisol Sensors
One challenge for developing wireless, battery-free cortisol sensors is in the design of biochemical sensing interfaces. Existing electrochemical sensing strategies for cortisol typically require an input power to drive the redox reactions which generate a current signal that scales with the concentration of cortisol. This issue imposes practical challenges in building lightweight, bio-integrated electronics due to the need for on-chip subsystems for power supply/harvesting and signal generation. Additionally, conventional sensing schemes usually need the modification of the interface with electroactive species, incubation steps with chemical reagents, and/or redox couples for signal transduction due to the low electroactivity of cortisol. This study exploits a highly sensitive, simple, and fully passive sensing interface formed by functionalizing gold surface with commercially available single stranded DNA aptamers.
Figure 4a shows the working principle of the potentiometric sensing interface functionalized by anti-cortisol aptamers via Au-S bonds. 6-mercapto-1-hexanol (MCH) covers the rest of the WE, passivating the surface from nonspecific interactions. The binding between cortisol and aptamers leads to conformational changes in the DNA strands with negatively charged backbones, which will then modify the surface potential of the WE by perturbating the electric double layer.[30, 37] Measuring the open circuit potential (OCP) between the WE and RE determines the change as a function of the concentration of cortisol. Figure 4b presents the OCP response of the sensor to varying cortisol concentration in 1X PBS solution (raw data in Figure S9a). The value increases monotonically with cortisol concentration increasing from 0.1 to 64 ng ml−1, yielding a sensitivity of ~14 mV dec-1. The results indicate that the cortisol-aptamer complexation causes a reorientation of the negatively charged DNA aptamers away from the gold electrode surface. A desalting step to remove impurities in the aptamer is crucial to obtain the sensitivity reported here (Supplementary Note S2). Tests in 0.1X PBS suggest the same trend with a sensitivity of 8 mV dec−1, further confirming that the aptamers move away from the gold electrode surface upon binding with cortisol. Calibration of the sensor in artificial sweat solutions with cortisol (composition listed in Experimental Section) yields a sensitivity of 8.5 mV dec−1 (Figure S9b). For comparison, a gold electrode only functionalized with MCH shows a much weaker response to varying cortisol concentrations (~2 mV dec−1) (Figure 4c) due to the lack of biorecognition events. Results obtained using bare gold electrodes demonstrate an even smaller response of −0.2 mV dec−1 (Figure S9c). The physisorption of cortisol may account for the response of electrodes without aptamers. Systematic studies suggest that the ratio of aptamer to MCH (A/M) plays a role in the sensitivity, as the electrostatic repulsion between the negatively charged oligonucleotides may affect their conformation at the sensor-solution interface: a ratio of 1/1000 yields a sensitivity of ~15 mV dec-1. When A/M = 1/10, the value of OCP slightly decreases with an increasing cortisol concentration (sensitivity: ~ −6 mV dec−1). Multiple reasons may account for this observation, such as the insufficient surface passivation and the steric hindrance due to the interactions between excessive aptamers. Based on the results, the following part of the study uses A/M = 1/100 for sensor development. Testing the response in solutions with interferents evaluates the selectivity of the system to cortisol (Figure S10a-S10c). Fitting the results estimates the sensitivity towards progesterone (2 mV dec−1), serotonin (−0.9 mV dec−1), and glucose (~−5 mV dec−1) (Figure 4d). A variety of ionic and redox substances can affect the accuracy of potential measurements. Figure S11 shows the sensor’s response to potential interferents including NaCl, KCl, uric acid, and ascorbic acid within their physiologically relevant concentration ranges in 1X PBS solutions. For example, a previous study shows that the Na+ concentration in primary sweat ranges from 135 to 145 mM, and the day-to-day variation is 5–17%.[47] Given that the Na+ concentration in 1X PBS is ~140 mM, the experiment exploits the following increases in NaCl concentration: 5 mM, 10 mM, 15 mM, 20 mM, 30 mM (Figure S11a). Similarly, the study uses physiologically relevant concentration ranges of other interferences in sweat (KCl, ascorbic acid, and uric acid)[48–50] as shown in Figure S11b-S11d for all other selectivity tests. While the results suggest certain levels of fluctuations in OCP in all cases, the variation are typically within 10 mV. For future works, including another device without functionalization can help calibrate shifts in baseline potential due to nonspecific interactions and variation in environmental factors (e.g., temperature/strain). While further improvements in sensing performance are possible through detailed, systematic studies on the structure-property interrelationship, the predominant response to cortisol suggests the high selectivity over interferents.
Figure 4.
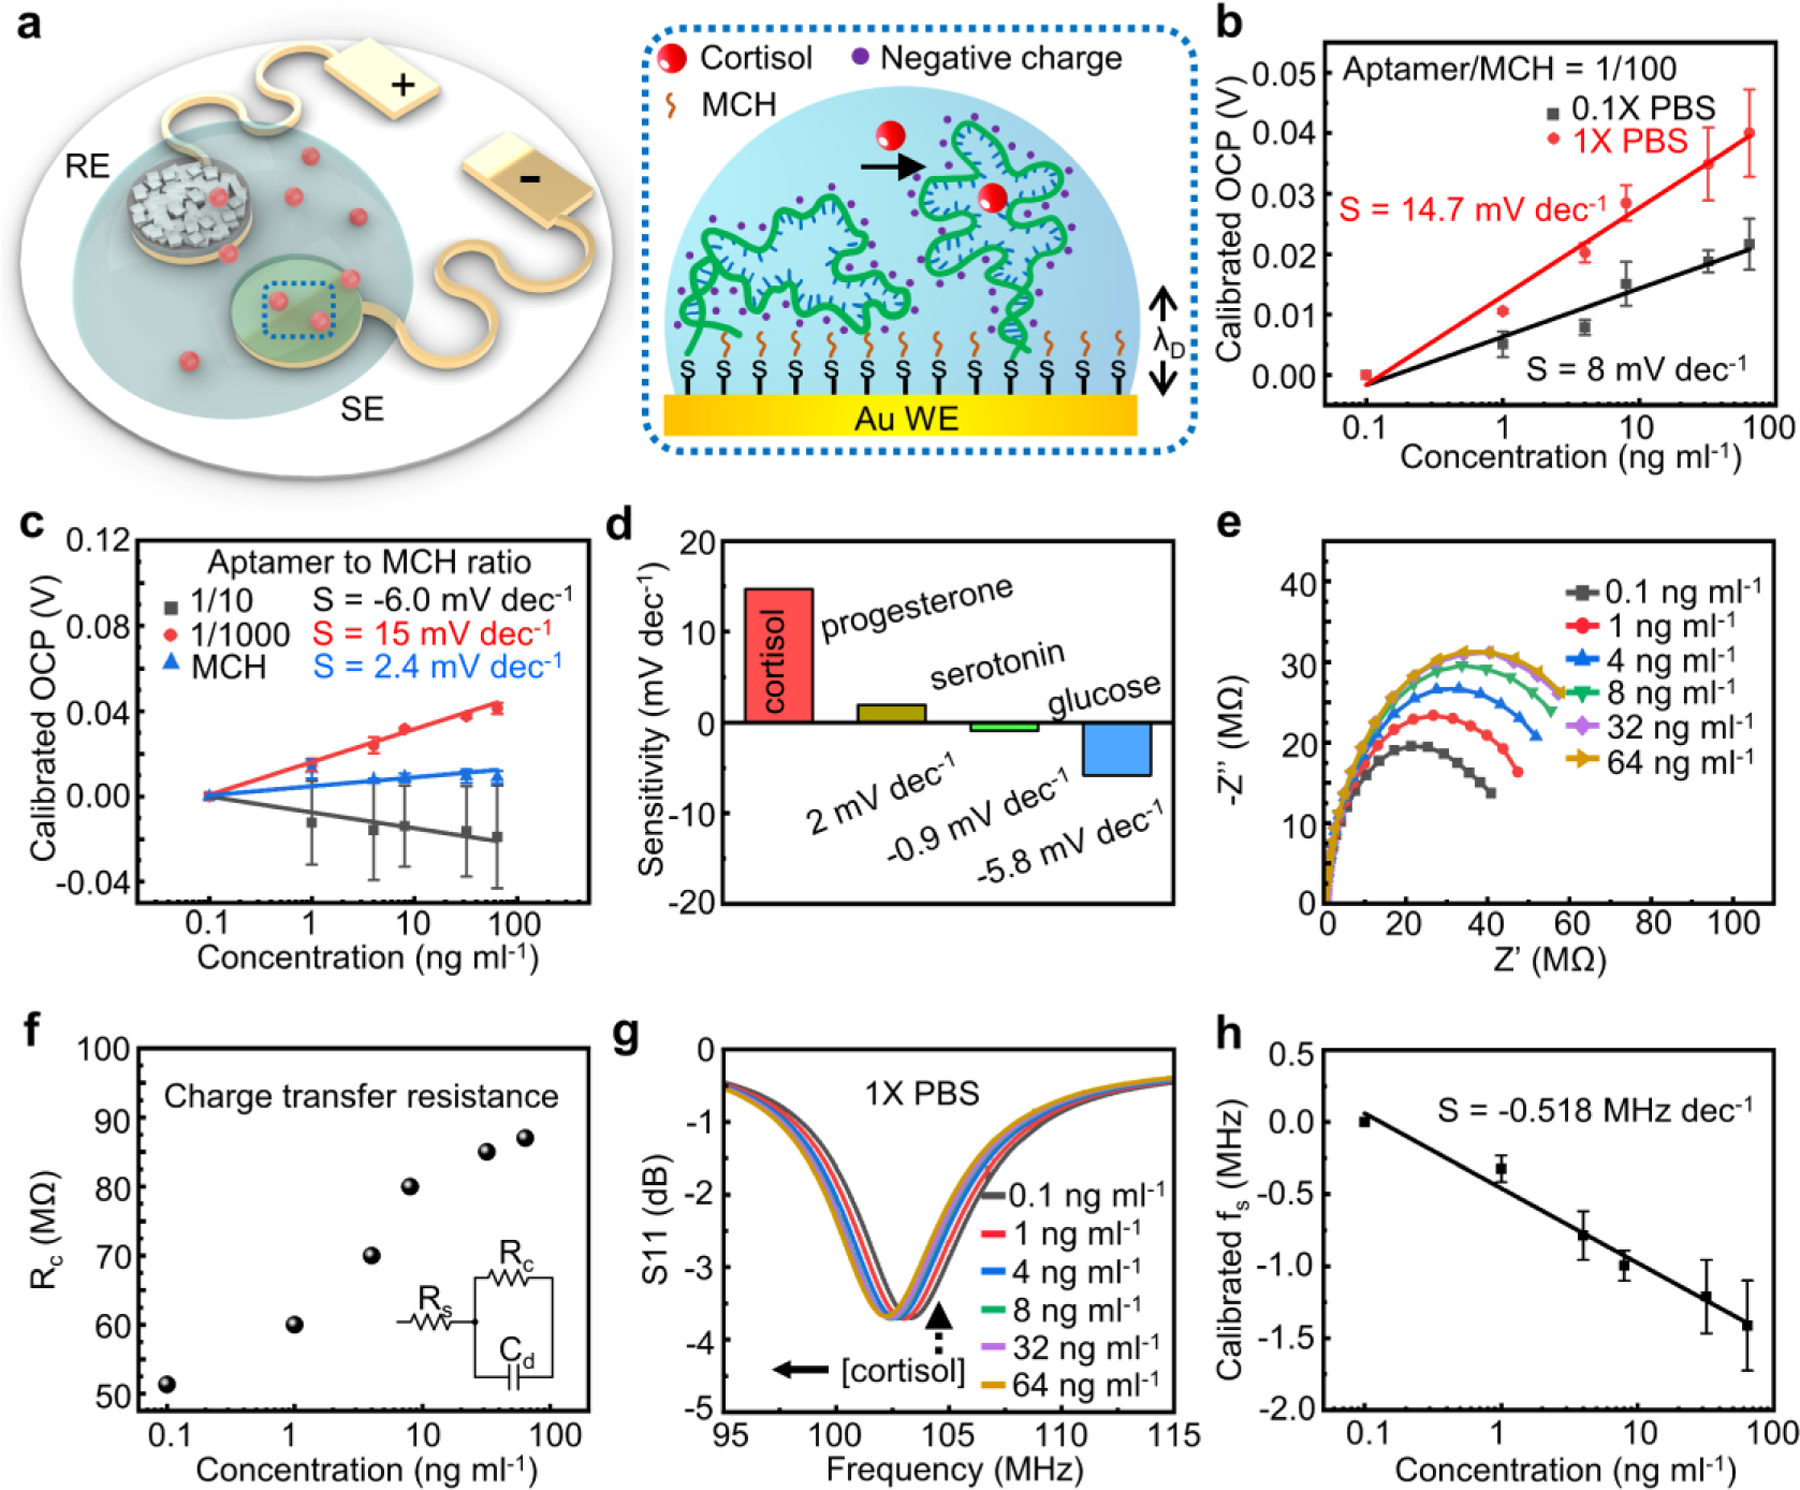
Performance characterization of devices with aptamer-functionalized working electrodes for cortisol sensing. (a) Schematic illustration of the sensing mechanism of the anti-cortisol aptamer functionalized electrodes. The aptamers with negatively charged phosphodiester backbones undergo a conformational change upon binding with cortisol. (b) Calibration plots of working electrodes in solutions with varying cortisol concentration. The individual data points represent the averages of three distinct electrodes, and the error bars represent the standard deviation of measurements from three electrodes (n = 3). (c) Calibration plots of working electrodes with different aptamer/MCH ratios. The individual data points represent the averages of three distinct electrodes, and the error bars represent the standard deviation of measurements from three electrodes (n = 3). (d) Responses of anti-cortisol aptamer functionalized electrodes to cortisol versus interferents. (e) EIS characterization (Nyquist plots) of anti-cortisol functionalized working electrode in 1X PBS solutions with varying concentration of cortisol. (f) Extracted charge transfer resistances based on Nyquist plots in E. (g) Resonance curves of a wireless sensor system integrated with the anti-cortisol functionalized working electrode responding to 1X PBS solutions with varying concentration of cortisol and (h) extracted calibration plot of the wireless sensor system. The individual data points represent the averages of three distinct sensors, and the error bars represent the standard deviation of measurements from three distinct sensors (n = 3).
Electrochemical impedance spectroscopy (EIS) further examines the interaction mode between aptamers and cortisol. Figure 4e presents the Nyquist plots obtained in 1X PBS solution in the presence of redox couples (Fe(CN)64-/Fe(CN)63-). Fitting the results using a Randles cell yields the charge transfer resistance (Figure 4f). An increasing cortisol concentration leads to a larger . The results are likely due to the reorientation of aptamers with negative charges, shielding the redox couples away from the electrode surface. Additionally, despite of the electrically neutral nature, cortisol may also physically block the surface of WE which further contributes to an increased . As stated in the preceding section, the differential electric potential between WE and RE can serve as the reverse bias which controls the thickness of the depletion layer in the varactor diodes. Consequently, the resonance circuit can transduce a change in OCP (WE vs. RE) into a shift in for wireless signal readout. As the value of OCP remains negative throughout the dynamic range, the sensor has the anodes and cathodes of the varactors connected to WE and RE respectively such that the voltage serves as the reverse bias. As a result, the resonance curve shifts toward the negative direction as the OCP (negative value) increases toward 0 with an elevated concentration of cortisol (Figure 4g). The extracted sensitivity of the wireless cortisol sensor is −0.458 MHz dec−1 (Figure 4h). In principle, functionalizing the working electrode with different bio-recognition elements can extend the capability of the “two-part” resonance circuit in detecting alternative biomarkers.
2.4. Design of Frequency Modulated, Multifunctional Sensing Platforms
Beyond cortisol sensing using the detachable device design, furthering this concept for concurrent, real-time monitoring of different biochemical and biophysical signals is of great interest for tracking health status and establishing stress-related biometric signature profiles. Integrating multiple magnetic coupling units into the skin-mounted sensor patch and properly designing the sensing interfaces form a multifunctional sensor system capable of simultaneously recording the concentration of cortisol in and pH value of sweat as well as the skin temperature. The pH sensor follows the same design as the cortisol counterpart with modularized DC and AC parts. Functionalizing the Au surface of WE with polyaniline (PANI) through electropolymerization enables the reversible capture of protons. The PANI film transforms between the emeraldine salt and emeraldine base states in response to changes in pH[51–53] (Figure 5a): a low pH shifts the equilibrium towards emeraldine salt which increases the surface potential of WE, and vice versa. Figure 5b shows a linear relationship between the OCP (WE vs. RE) and pH with a super-Nernstian sensitivity (>59 mV dec−1) of −69.4 mV pH−1 consistent with observations in previous reports[54–56] (discussion in Supplementary Note S3). Following the same working principle, the surface potential can serve as the reverse bias (WE connected with the cathode) for wireless signal transmission (Figure 5c). A calibration plot appears in Figure 5d showing a sensitivity of −3.368 MHz pH-1.
Figure 5.
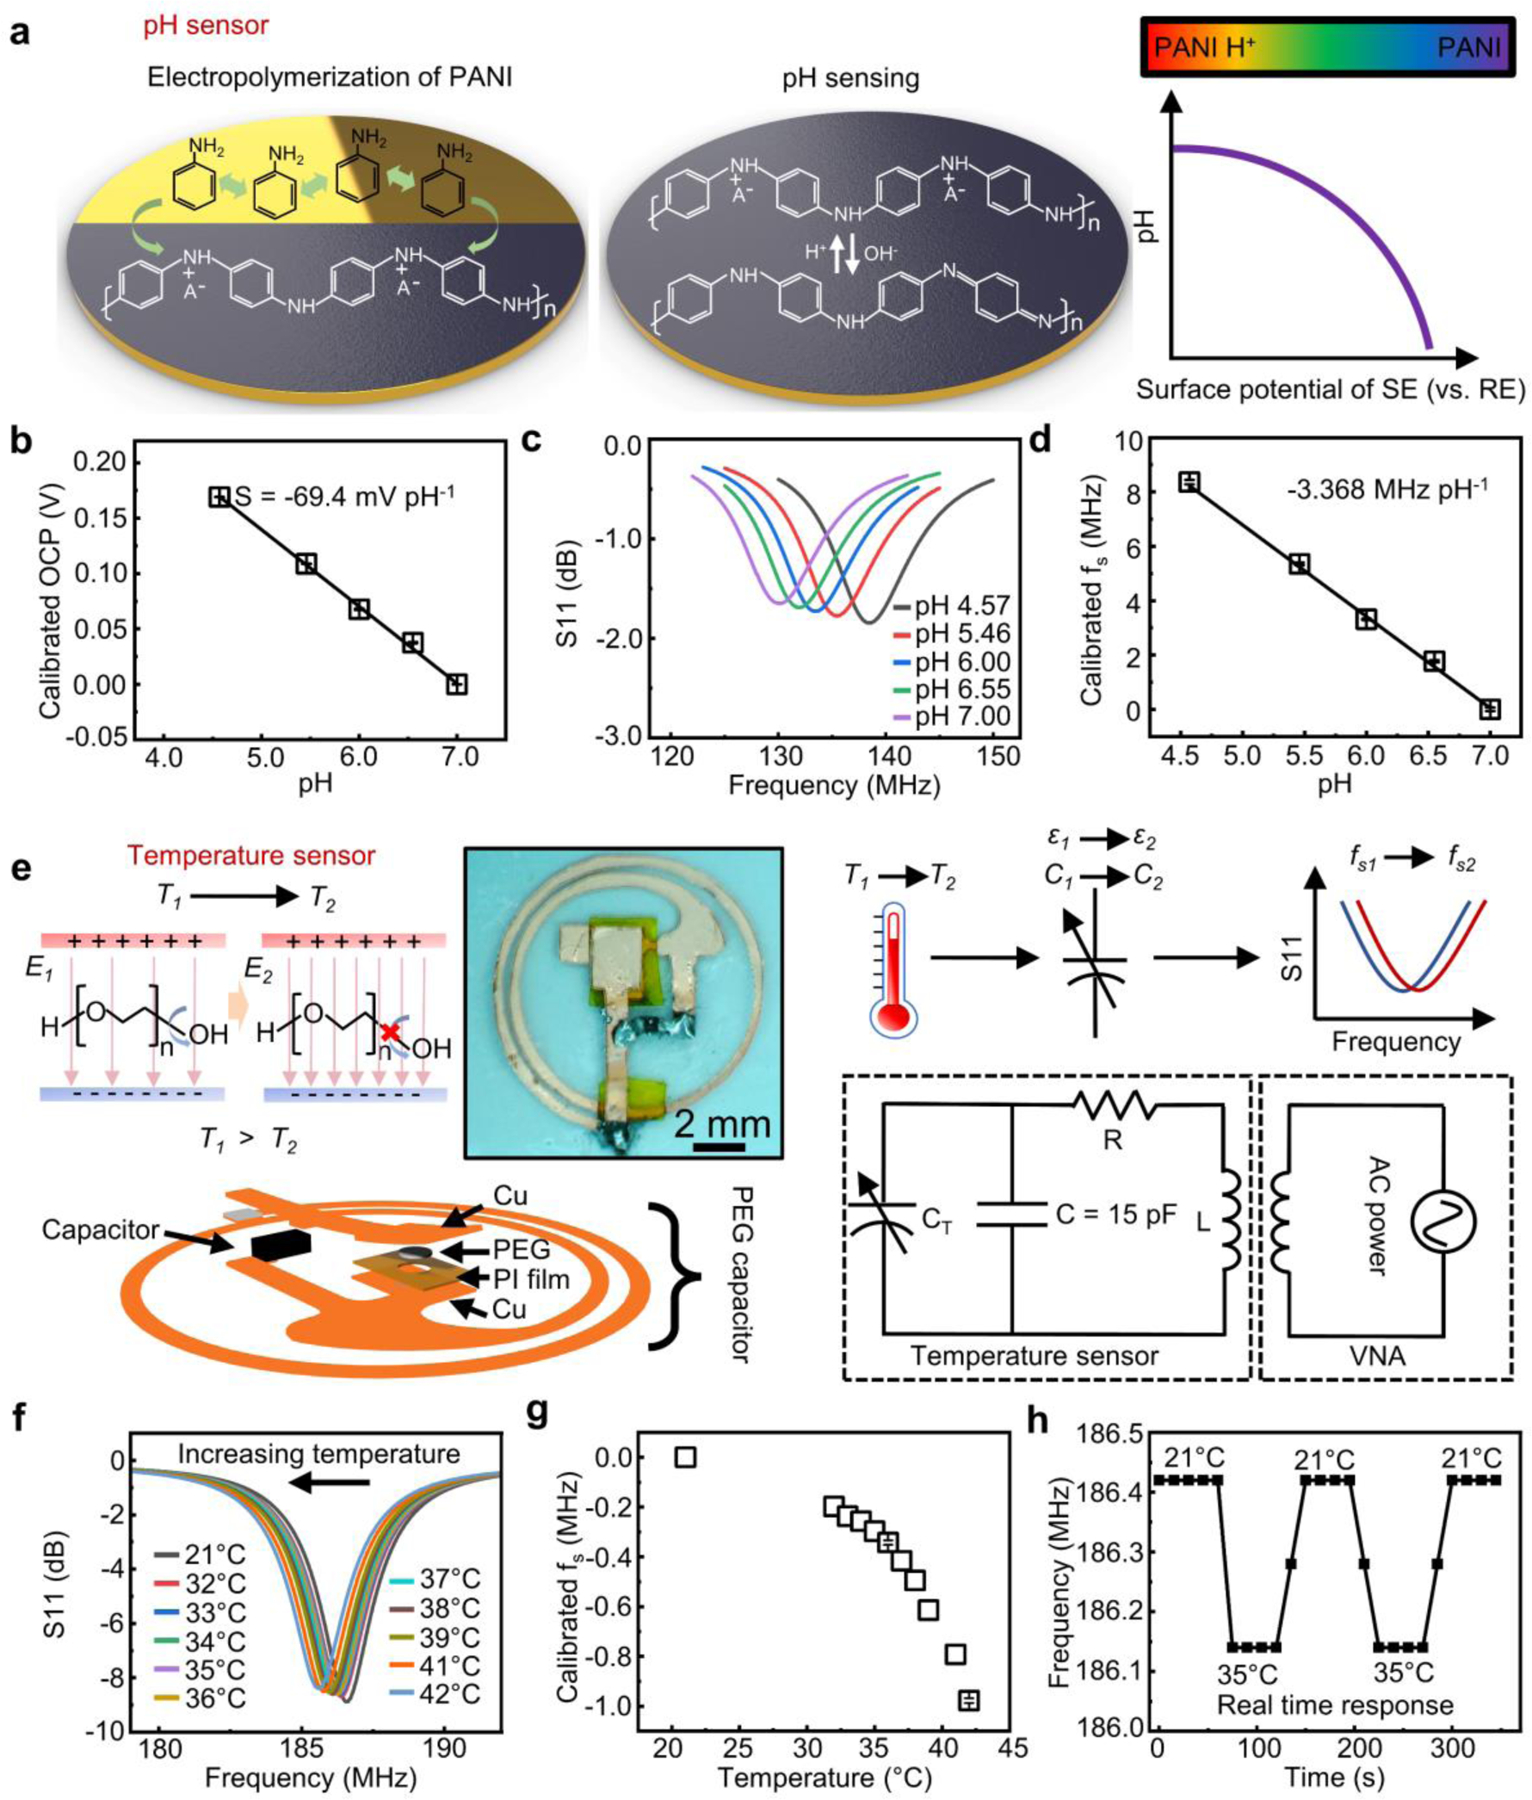
Design and characterization of the pH and temperature sensors in the “two-part” sweat patch based on LC resonance. (a) Schematic illustration of the electropolymerization process and pH sensing mechanism of PANI. (b) Calibration plot of PANI-based pH sensing interface showing the linear relationship between pH. The individual data points represent the averages of three measurements, and the error bars represent the standard deviation of three measurements (n = 3). (c) Resonance curves of an integrated wireless sensor obtained in solutions with different pH values and (d) extracted calibration plot. The individual data points represent the averages of three measurements, and the error bars represent the standard deviation of three measurements (n = 3). (e) Schematic illustration of the sensing mechanism of the PEG-based temperature sensors with a circuit diagram and exploded view and photograph showing the sensor structure. (f) Resonance curves of the wireless temperature sensor obtained under different temperatures and (g) extracted calibration plot. The individual data points represent the averages of three measurements, and the error bars represent the standard deviation of three measurements (n = 3). (h) Real-time response of the wireless temperature sensor.
Meanwhile, a reusable wireless temperature sensor integrated into the coupling unit detects skin temperature. The working principle involves the temperature induced capacitance change in a PEG capacitor (Figure 5e). A decreasing temperature below the melting point of PEG gradually suppresses the rotation of hydroxyl groups on the polymer backbones, which limits the capability of PEG in screening electric fields, leading to a decreased dielectric constant of the dielectrics.[57–59] The following equation describes as a function of temperature:[46]
| (2) |
where and are the dielectric constant of PEG in solid and liquid phase, respectively, is the melting temperature of PEG, and is the effective Curie temperature. Since , , , and are all constants, the dielectric constant of PEG, and thus the capacitance of the overall system, is a function of . Based on Equation (1), the temperature sensor also works based on the frequency modulation mechanism. Adding an additional capacitor in parallel with the temperature sensing unit brings the (180–190 MHz) close to those of the two chemical sensors (cortisol and pH) within the patch ( and 130–140 MHz). Figure 5e shows the microscopic image of the temperature sensor. Figure 5f presents resonance curves recorded under different temperatures. As expected, decreases with an increasing temperature (Figure 5g), consistent with results reported in pioneering studies.[46] For real time sensing, a fast response to the varying temperature is necessary. Results suggest that of the sensor instantaneously changes and stabilizes within 30 s upon the variation in external temperature (Figure 5h), indicating the potential of the sensors for rapid, sensitive, and reversible measurement. The multifunctional patch has the temperature sensor incorporated within the reusable AC coupling unit, with an underlying PDMS layer and thermal grease serving as the heat conductive adhesive. Figure S12a and S12b show the resonance curves and the extracted of a temperature sensor assembled with a thermal grease-mediated microfluidic system. The change in is ~0.425 MHz when the temperature rises from 21 °C to 36 °C, which is slightly larger than the change (~0.343 MHz from 21 °C to 36 °C) observed when the sensor directly attaches to a hot plate. The underlying medical adhesive and the thermal grease creates a more thermally conductive pathway for heat transfer compared to that when the sensor loosely attaches to the hot plate directly, which might account for the difference in sensitivity. Figure S12c presents the real-time response of the assembled temperature sensor. The value of stabilizes in 60 s, which satisfies the need for rapid and reversible monitoring of the skin temperature.
2.5. System Integration and Performance Validation Through Human Subject Studies
Pilot human subject studies validate the capability of the sensor system in noninvasively recording cortisol concentration, pH value and temperature. Figure 6a-c presents a test device deployed on the skin surface of a healthy, consenting human subject. Subjects wear the microfluidics-coupled sensor part during aerobic exercise (cycling) for generation and collection of sweat samples. Connecting the sensor layer with the magnetic coupling unit during each measurement establishes the resonance circuit for wireless signal readout of biosignals. The assembled device has a weight of ~580 mg with a total thickness of ~1.4 mm. The temperature sensor incorporated in the coupling unit part interfaces with the PDMS patch through a layer of thermal conductive silicone paste. Sweeping the frequency range using a portable VNA with a primary coil in reflection mode obtains the resonance curve (Figure 6d).
Figure 6.
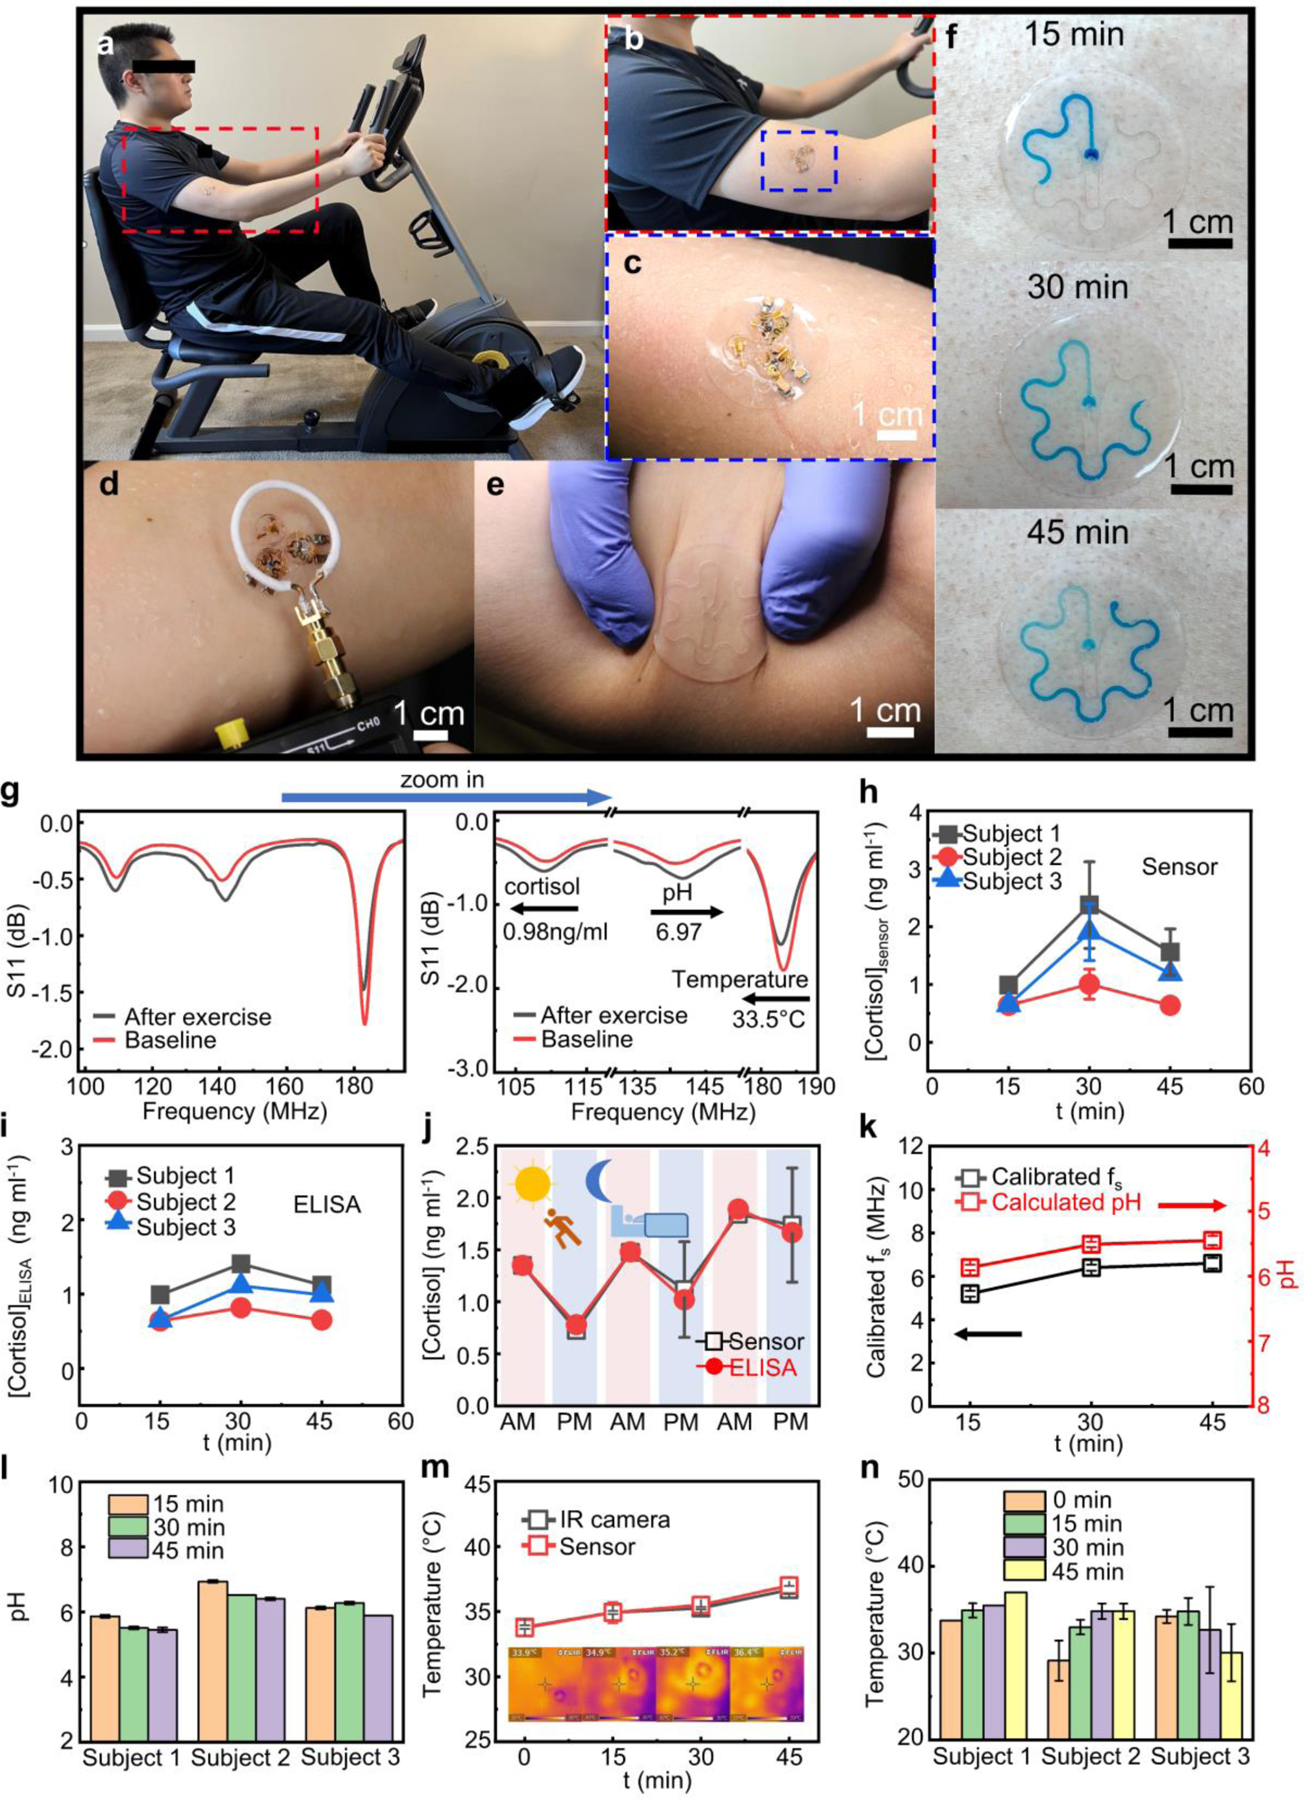
Integrated wireless sweat patch for on-body analysis of biochemical and biophysical signals. (a) Photos of a human subject wearing the multifunctional sweat patch during exercise and (b-c) zoom-in view of the patch laminated on the skin surface of the arm. (d) Wirelessly recording the signals using a primary coil connected to a handheld VNA. (e) Photograph of the microfluidic channels on human skin under deformation. (f) Sequential photographs showing colored sweat flowing through the microfluidic channel at different time points during exercise for sweat rate estimation. (g) Resonance curves of a multifunctional sweat patch recorded before/after exercise for concurrent monitoring of cortisol level, sweat pH, and skin temperature and zoom-in view of the curves showing the shifts in the resonance frequency of each sensor. (h-i) Variation in sweat cortisol levels of three different human subjects during exercise quantified by the sensor (h) and by ELISA assay (i). (j) The circadian rhythm of sweat cortisol level in a health subject in a period of three days recorded using the cortisol wearable sensor and ELISA assay. (k) Variation in sweat pH during exercise of one human subject detected by the sensor. (l) Summary of changes in sweat pH during exercise constructed from three different human subjects. (m) Variation in skin temperature during exercise of one human subject with simultaneously recorded IR camera images showing the skin temperature around the location of the sensor for comparison purpose. (n) Summary of changes in skin temperature during exercise constructed from three different human subjects. The individual data points in (h) and (j-n) represent the averages of three measurements, and the error bars represent the standard deviation of three measurements (n = 3).
In addition to the electrical biosignals recorded using the resonance circuits, incorporating another serpentine-shaped microfluidic channel allows for the assessment of sweat rate during exercise. The flexible PDMS microfluidic channel firmly and conformally attaches to human skin under deformation due to the soft mechanical construction (Figure 6e). Upon the entering of sweat, the dissolution of the water-soluble food coloring gel placed at the inlet of the channel turns the liquid to blue enabling easy visual identification. Inspecting the volume of the colored sweat in the channel collected within a certain period estimates the sweat rate in the local area which quantitively correlates to the total body sweat loss during the time course of the study.[60] Figure 6f presents the sequential photographs of colored sweat samples collected by the microfluidics on the skin surface at different time points in a study session. During the period between t = 15 and 30 min, the sweat rate in this area (0.325 μL min−1) slightly ramps up compared to that measured during the first 15 minutes of exercise (0.304 μL min−1) when the body is warming up. The sweat rate reported here is comparable to those reported in a pioneering study.[61] After 45 minutes of exercise, sweat fills up the whole channel. Further increasing the dimension of the channel can allow for sweat rate analysis over a longer period. The sweat rate measured in the first 15 minutes also shows that sweat can fill up the inlet reservoir aligned to the cortisol and pH WE and RE pairs, providing enough amounts of samples (~ 1 μL) for on-chip signal generation and analysis.
An example demonstrating the concurrent sensing capability of the sweat patch appears in Figure 6g, showing data collected before (red curve, in 1X PBS as the base reference solution at 21 °C) and after (black curve, on-body data) a 30 min cycling session. Based on the data, the calculated sweat cortisol concentration, sweat pH value, and skin temperature are 0.98 ng ml−1, 6.97, and 33.5 °C, respectively (calculation methods detailed in Supplementary Note S4). Profiling the dynamic variation of the biochemical and biophysical signals using the sensor patch provides a realistic route for rapid, real-time health monitoring and management. In the first example, three human subjects wear the sensor and exercise on a stationary bicycle for 45 min with microfluidics-coupled sensors replaced (to address the surface saturation issue of aptamers) and recorded every 15 min. Figure 6h shows the change in sweat cortisol concentration over time (raw data in Figure S13-S15, data points with no error bars indicate the extracted during three measurements have almost identical values). For all three human subjects, the recorded cortisol levels increase from t = 0 to 30 min, and then slightly decrease during t = 30 to 45 min as the body gradually adapts to the activated state. The results are consistent with pioneering studies[4] that physical exercise at the beginning can act as a stimuli to activate the HPA,[62] resulting in the secretion of cortisol to cope with exertion induced stress, which is also similar to that observed in studies with the human serum.[63] To evaluate the sensing accuracy, self-made sweat-collecting pockets (Figure S16a) collect sweat samples simultaneously for validation using commercial cortisol enzyme-linked immunosorbent assay (ELISA) kit (representative calibration plot shown in Figure S16b). Figure 6i shows the variation in cortisol level over time during exercise obtained using ELISA, which follows a similar trend to that observed using the wireless sensors.
The cortisol level in human body usually changes in a diurnal pattern (also known as circadian rhythm):[64–66] the concentration is the highest in the morning after awakening and gradually decreases throughout the day, reaching the lowest level in the evening. In this study, the wearable cortisol sensors record the cortisol diurnal pattern in a human subject for three days. As expected, the recorded cortisol level presents a circadian rhythm throughout the test period (Figure 6j, Figure S17a-S17g), which correspond well with the results obtained using ELISA. Figure S17h summarizes the correlation of the cortisol concentration measured using the sensor and the those obtained from ELISA with a Pearson coefficient (r) of 0.729.
Similarly, microfluidics-coupled wireless pH sensors record the pH changes of sweat during exercise. The tests start with calibrating of the sensors in 1X PBS (pH= ~7.4) to establish the baseline. Figure 6k presents changes in measured of a pH sensor over time and the calculated sweat pH values of one participant (raw data in Figure S13d). All the measured pH values (6.9–5.4) are within reported normal pH range of sweat during physical exercise.[67–68] The sweat pH values measured in all three human subjects slightly decrease after 45 minutes of exercise (Figure 6l, Figure S14d-S14e, and Figure S15d-S15e), consistent with observations reported in another previous study.[68] Wireless temperature sensors monitor the skin temperatures of human subjects (Figure 6m, Figure S13e, Figure S14f-S14g, Figure S15f-S15g) during exercise. For validation purpose, an infrared camera measures the temperature of the skin close to the location of the sensor (inset of Figure 6m). Figure 6n summarizes the variation in skin temperatures of all three human subjects during exercise. The value increases during exercise for human subject 1 and 2 while decreases for human subject 3. Several factors such as differences in exercise exertion, clothes worn during exercise, and different sweat rates may contribute to the trends of temperature changes observed here. Overall, while further optimization, calibration and process control are necessary to create mature sensing platforms for widespread use, the results presented here suggest the promise of this “two-part” resonance circuit-based wireless sensing technology for recording and analysis of various biochemical/biophysical signals via proper interface design and system integration. Combining the modalities explored in this study will create various types of engineering tools for monitoring multiple biosignals through intimate, seamless, and stable integration with target biosystems.
3. Conclusion
In summary, this work presents materials selections, design principles and integration schemes for building a class of resonance circuit-based wearable sensors that can enable concurrent recording of multiple biochemical and biophysical signals crucial for health monitoring. The sensor leverages a modularized design of a “two-part” resonance circuit with a pair of varactor diodes, which physically separates the sensing interface and magnetic coupling unit. By converting a voltage signal into a modulation in capacitance of resonator tank through the varactors, the system allows for wireless data transmission via inductive coupling when powered by an AC source. Functionalizing the sensing interface with aptamers and PANI enables the capture of cortisol and H+, and in principle, extending this concept using other bio-recognition elements as the interface can address the need of detecting alternative biomarkers through a potentiometric sensing strategy. A detachable design with conductive magnets between the DC and AC part facilitates the recycling of the electronic module for repetitive use without degrading the performance for wireless signal transmission. The multimodal operation simultaneously recording cortisol concentration, pH, and skin temperature addresses the need for obtaining biometric signature profiles. Field testing with healthy human subjects validates the mechanical robustness and sensing capability of the sensor system on soft, curved skin surfaces. The sensor patch reported here provides a promising, low-cost, and convenient strategy for monitoring of cortisol levels and other biochemical/biophysical signals for assessment of physiological health. Future efforts will involve developing lightweight, miniaturized, and human-friendly readout system and the associated user interface for direct visualization of the sensor data, which can be integrated with personal belongings such as smart phones and smart watches. Adapting the designs introduced here for applications in tracking patients with stress-related diseases will create promising directions and fertile areas for future research.
4. Experimental Section
Fabrication of Microfluidic Channels
Figure S1 shows the fabrication procedures for the microfluidic channel using a copper mold patterned by a “cut-and-paste” method.[38] Specifically, laminating a single-sided copper tape (thickness: 60 μm) (adhesive side facing up) onto a piece of ultraviolet (UV) light dicing tape facing up formed the film for cutting. A Silhouette Cameo 4 vinyl cutter engraved the outline of microfluidic channel based on the pattern designed using AutoCAD. Laminating the cut thin film on a glass slide followed by exposing it to UV light unbound the UV dicing tape from the copper film. Peeling off unwanted parts of the copper film yielded patterned metal traces. Stacking three layers of patterned copper films formed the mold for the fabrication of the microfluidics with desired channel height. Spin coating the glass slide with a layer of poly(methyl methacrylate) (PMMA) at 950 rpm weakened the bonding between PDMS (to be coated in the subsequent step) and mold for easy release. Mixing and casting the base and curing agent (weight ratio 15:1) of PDMS (Sylgard 184, Dow Corning) onto the copper mold followed by spin coating at 350 rpm for 1 min and curing at 100 °C formed the top layer of the soft microfluidic channel. Spin coating another PMMA-coated glass slide with PDMS (weight ratio of base to curing agent: 15:1) at 300 rpm for 20 s and then at 950 rpm for 1 min followed by curing at 100 °C formed the bottom layer. Punching the layers with circle-shaped punchers with proper sizes formed the inlets and outlets of the channels. Attaching the patterned top layer and bottom layer after ozone plasma treatment formed the microfluidics. Wetting the channel with Silwet L-77 ethanol solution (volume ratio 1:100) for at least 30 min hydrophilized the channel and completed the fabrication.
Fabrication of Magnet Coupling Units
Figure S2 presents the fabrication procedures for the LC coupling unit. The preparation of the metal traces on a piece of PET film followed the same procedures using the “cut-and-paste” method described previously. Mounting two varactor diodes (SMV1249–040LF, Skyworks Solutions, Inc., CA, USA 1.0 × 0.6 × 0.46 mm3) and a 9 kΩ resistor to the metal traces through soldering completed the fabrication of the LC coupling unit. Conductive neodymium magnet plates pasted on the two contact pads at the end using conductive silver epoxy formed the conductive bridges connecting the coupling unit to the working electrodes in the DC part.
The fabrication of the temperature sensor followed a similar “cut-and-paste” process. Instead of using a pair of varactors for the LC circuit, the temperature sensor exploited a capacitor structure with PEG (MW = 1500) as the dielectric material sandwiched by two copper films (Figure 5e). A double-sided adhesive polyimide (PI) film (thickness: 90 μm) served as the spacer defining the distance between two copper plates. The PEG was filled in a hole (diameter: 1 mm) cut in the middle of the PI film which defined the area of the PEG dielectric materials. A 15-pF capacitor in parallel with the PEG capacitor tuned the of the LC circuit to the range of 170–190 MHz. Encapsulating the PEG capacitor with marine epoxy completed the fabrication of the LC temperature sensor.
Deformation and Displacement Tests
For the deformation test, a commercial VNA recorded the resonance curves of an integrated device (with microfluidics, AC and DC parts) deployed on curved surfaces with different bending radius of 40, 60 and 80 mm. Before testing, the center of the coupling unit aligned with that of the primary coil with a vertical distance of ~7 mm. Shorting WE and RE minimized fluctuations and noises associated with electrostatic charges in the environment.
In the displacement test, moving the sensor system along a vector systematically varied the lateral distance between the readout coil and the device with a fixed vertical distance of 1 cm. A Cartesian coordination system denoted the 25 different positions used for testing: specifically, the coordinate of the Euclidean vector defined the position of the sensor array relative to the readout coil (Figure 3e), where and were the geometric center of the readout coil and the three-sensor system, respectively (, , step: 0.5 mm for both and ).
Fabrication of RE and WE for Biochemical Sensing
The preparation of the gold thin film electrodes started with cutting a polyimide (PI) film (~13 μm) with electron-beam evaporated Cr (10 nm)/Au (200 nm) bilayers using the “cut-and-paste” method. Acrylic conformal coating (MG chemicals, 419D) passivated the conductive traces, leaving the electrode areas at the tip (diameter: 500 μm) uncovered for functionalization.
The anti-cortisol DNA aptamer (5’ to 3’: HO(CH2)6-S-S-(CH2)6- GGA ATG GAT CCA CAT CCA TGG ATG GGC AAT GCG GGG TGG AGA ATG GTT GCC GCA CTT CGG CTT CAC TGC AGA CTT GAC GAA GCTT) received from Integrated DNA Technologies (Coralville, IA) was in an oxidized form with S atoms protected in disulfide bonds. The preparation of aptamer sensing functionalized electrodes for cortisol started with reducing the oxidized anti-cortisol DNA aptamers. Specifically, mixing the as-purchased aptamers with dithiothreitol (DTT) (100 μM DNA aptamer, 10 mM DTT in 1X Tris-ethylenediaminetetraacetic acid (TE) buffer) reduced the oxidized thiol groups. Centrifugation of the mixed solution mentioned above in Macro SpinColumns (Harvard Apparatus) removed DTT. Drop casting the aptamer solution (50 μM aptamer and MCH (1:100) in 1X TE buffer) on the gold electrode followed by drying overnight completed the fabrication of the functionalized working electrode by forming the Au-S bonds between aptamers and the electrode.
The fabrication of PANI pH working electrodes followed the method described in our previous study.[69] Performing cyclic voltammetry in 0.25 M aniline (in 0.5M H2SO4) in the range from 0.2 to 1 V for 10 cycles using a gold thin film electrode as the working electrode, a Ag/AgCl as the reference electrode, and a Platinum wire (Pt) as the counter electrode deposited a thin film of PANI on the working electrode for pH sensing.
The preparation of the thin-film Ag/AgCl reference electrode started with coating the gold thin-film electrode with silver epoxy (Chemtronics CW2400) followed by curing it at room temperature overnight. Soaking the electrode in sodium hypochlorite solution (5 wt%) for 1 hour converted the surface to AgCl. Homogenizing 438 mg polyvinyl butyral (PVB, 10 wt%) and 250 mg KCl powder in 5 mL anhydrous ethanol through ultrasonication formed the solid electrolyte coating solution. Drop casting the solid electrolyte coating solution onto the Ag/AgCl followed by drying overnight completed the fabrication process the reference electrode.
Sensor Calibration and Characterization
Before testing, soaking the cortisol working electrode in 1 mM MCH solution for at least 30 min passivated any remaining uncovered Au area. Immersing the thin-film Ag/AgCl reference electrode in 1X PBS overnight prepared the reference electrode for testing. An electrochemical workstation (PalmSens4, CA, USA) measured the OCP between the WE and RE after incubating the electrodes in the cortisol solution for 30 min. Meanwhile, a commercial VNA (NanoVNA) recorded the resonance curve of the LC coupling unit connected to the WE and RE. Specifically, the VNA measured the reflection coefficient (real and imaginary parts) in reflection mode using a single-turn coil connected through Sub-Miniature Version A (SMA) connectors. For a single sensor system, the VNA swept a frequency range of 20 MHz (frequency step: 19.82 kHz, 1010 data points in total), yielding the resonance curve. A single measurement took about 8 s. For data analysis, calculation of dB using the raw data yielded data. Fitting the resonance curve determined the value at the peak position. Dissolving 20 g sodium chloride, 17.5 g ammonium chloride, 5 g acetic acid, and 15 g lactic acid in 1 L DI water followed by tuning the pH to 7.0 by slowly adding concentrated sodium hydroxide formed the artificial sweat solution. A cortisol working electrode, a Ag/AgCl reference electrode and a Pt wire counter electrode formed the cell for the electrochemical impedance spectroscopy (EIS) with K4Fe(CN)6/K3Fe(CN)6 (1:1) (2 mM) serving as the redox couple. Simulation (Z-view software) of the Nyquist plots based on a Randles circuit model yielded the charge transfer resistance .
Validation of Sensor Performance Through Human Subject Studies
Pilot human subject studies followed a protocol approved by the Institutional Review Board (IRB) at The Ohio State University (study number: 2021H0205). Informed written consent was obtained before the field testing. Three human subjects participated in the tests for real-time monitoring of cortisol, sweat pH, and skin temperature. Before exercise, alcohol wipes cleaned the human subjects’ skin surfaces for sensor attachment (microfluidic channel with the DC part). A self-made sweat collection patch with a piece of parafilm laminated on the adhesive side of 3M Tegaderm film collected sweat at a location next to the sensor for validation with the cortisol ELISA as the gold standard (Enzo ADI-900–701 cortisol ELISA kit, assay process detailed on ENZO website and product manual). For real time monitoring of cortisol, a VNA recorded the resonance curve every 15 min after attaching the AC coupling unit to the DC part. Meanwhile, a fresh microfluidic channel with a new pair of WE and RE collected sweat and measured the cortisol level within the next 15 min. The VNA recorded the data 10 min after the assembling of the device for stable signal readout. The recording used a frequency step of 0.198 MHz. Sweat pH monitoring followed the same procedures with a scan step of 0.297 MHz (101 points in total). In skin temperature tests, human subjects worn a PDMS microfluidic patch during exercise, a VNA recorded the resonance curve every 15 min after attaching the temperature sensor onto the PDMS patch using thermal grease (SILICON 500, COOLERCUBE) with a step of 0.138 MHz (101 points in total).
For cortisol circadian rhythm tests, the human subject exercised twice on a stationary bike for 30 min, one in the morning (9:00 am - 10:00 am) and the other in the evening (7:00 pm - 8:00 pm), with the sensor patch (microfluidic channel with WE and RE) laminated on the skin surface. Similarly, a self-made sweat collection patch collected sweat at a location next to the sensor for validation and calibration with the ELISA assay kit. After the human subject exercised for 30 min, a VNA recorded the resonance curve of the assembled sensor with a frequency step of 0.198 MHz (101 points in total).
Data Collection and Analysis
A low-pass Fast Fourier transform (FFT) algorithm in OriginPro software filtered the background thermal noise and smoothed the resonance curve. The peak analyzer function in OriginPro determined the value for each resonance curve. The data shown in Figure 4b, 4c, and 4h are averages of data collected from three independent working electrodes. Setting the OCP values at the cortisol concentration of 0.1 ng ml−1 as the baseline and subtracting the baseline from the OCP data obtained in the test yielded the calibrated OCP values. Similarly, setting the values at the cortisol concentration of 0.1 ng ml−1 as the baseline and subtracting the baseline from the data obtained in the test yielded the calibrated values.
Statistical Analysis
Data are presented in the way of mean ± SD, the sample size is 3. Origin 2022 software was used for data analysis.
Supplementary Material
Acknowledgements
Y.D. and T.-L.L. contributed equally to this work. This work was supported by The Ohio State University start-up funds, the Chronic Brain Injury Pilot Award Program at The Ohio State University, The Ohio State University Center for Medical and Engineering Innovation pilot grant, and the National Center for Advancing Translational Sciences (award number: UL1TR002733). The content is solely the responsibility of the authors and does not necessarily represent the official views of the National Center for Advancing Translational Sciences or the National Institutes of Health. This work was also supported by the Ohio State University Materials Research Seed Grant Program, funded by the Center for Emergent Materials; NSF-MRSEC, grant DMR-2011876; the Center for Exploration of Novel Complex Materials; and the Institute for Materials Research. J.L. acknowledges the support from NSF award ECCS-2223387.
Footnotes
Supporting Information
Supporting Information is available from the Wiley Online Library or from the author.
Conflict of Interest
T.-L.L. and J.L. are inventors on a pending patent filed by the Ohio State University (application no.: 63/171,694, filed on 7 April 2021). The other authors declare no competing financial interests.
Contributor Information
Yan Dong, Department of Materials Science and Engineering, The Ohio State University, Columbus, OH 43210, USA.
Tzu-Li Liu, Department of Materials Science and Engineering, The Ohio State University, Columbus, OH 43210, USA.
Shulin Chen, Department of Materials Science and Engineering, The Ohio State University, Columbus, OH 43210, USA.
Prasad Nithianandam, Department of Materials Science and Engineering, The Ohio State University, Columbus, OH 43210, USA.
Keyan Matar, Department of Materials Science and Engineering, The Ohio State University, Columbus, OH 43210, USA.
Jinghua Li, Department of Materials Science and Engineering, Chronic Brain Injury Program, The Ohio State University, Columbus, OH 43210, USA.
References
- [1].de Kloet ER, Joëls M, Holsboer F, Nat. Rev. Neurosci 2005, 6, 463. [DOI] [PubMed] [Google Scholar]
- [2].Cohen S, Janicki-Deverts D, Miller GE, JAMA 2007, 298, 1685. [DOI] [PubMed] [Google Scholar]
- [3].Pearlmutter P, DeRose G, Samson C, Linehan N, Cen Y, Begdache L, Won D, Koh A, Sci. Rep 2020, 10, 19050. [DOI] [PMC free article] [PubMed] [Google Scholar]
- [4].Torrente-Rodríguez RM, Tu J, Yang Y, Min J, Wang M, Song Y, Yu Y, Xu C, Ye C, IsHak WW, Gao W, Matter 2020, 2, 921. [DOI] [PMC free article] [PubMed] [Google Scholar]
- [5].Holsboer F, Ising M, Annu. Rev. Psychol 2009, 61, 81. [DOI] [PubMed] [Google Scholar]
- [6].Herman JP, McKlveen JM, Ghosal S, Kopp B, Wulsin A, Makinson R, Scheimann J, Myers B, Compr. Physiol 2016, 6, 603. [DOI] [PMC free article] [PubMed] [Google Scholar]
- [7].Tang W, Yin L, Sempionatto JR, Moon J-M, Teymourian H, Wang J, Adv. Mater 2021, 33, 2008465. [DOI] [PubMed] [Google Scholar]
- [8].Bariya M, Li L, Ghattamaneni R, Ahn CH, Nyein HYY, Tai L-C, Javey A, Sci. Adv 6, eabb8308. [DOI] [PMC free article] [PubMed] [Google Scholar]
- [9].Yu Y, Nyein HYY, Gao W, Javey A, Adv. Mater 2020, 32, 1902083. [DOI] [PubMed] [Google Scholar]
- [10].Lee H, Song C, Hong YS, Kim M, Cho HR, Kang T, Shin K, Choi SH, Hyeon T, Kim D-H, Sci. Adv 3, e1601314. [DOI] [PMC free article] [PubMed] [Google Scholar]
- [11].Sempionatto JR, Lin M, Yin L, De la paz E, Pei K, Sonsa-ard T, de Loyola Silva AN, Khorshed AA, Zhang F, Tostado N, Xu S, Wang J, Nat. Biomed. Eng 2021, 5, 737. [DOI] [PubMed] [Google Scholar]
- [12].Yin L, Kim KN, Lv J, Tehrani F, Lin M, Lin Z, Moon J-M, Ma J, Yu J, Xu S, Wang J, Nat. Commun 2021, 12, 1542. [DOI] [PMC free article] [PubMed] [Google Scholar]
- [13].Ganguly A, Lin KC, Muthukumar S, Prasad S, ACS Sens 2021, 6, 63. [DOI] [PubMed] [Google Scholar]
- [14].Pali M, Jagannath B, Lin K-C, Upasham S, Sankhalab D, Upashama S, Muthukumar S, Prasad S, Electrochim. Acta 2021, 390, 138834. [Google Scholar]
- [15].Kinnamon D, Ghanta R, Lin K-C, Muthukumar S, Prasad S, Sci. Rep 2017, 7, 13312. [DOI] [PMC free article] [PubMed] [Google Scholar]
- [16].Liu J, Xu N, Men H, Li S, Lu Y, Low SS, Li X, Zhu L, Cheng C, Xu G, Liu Q, Sensors (Basel) 2020, 20, 1422. [DOI] [PMC free article] [PubMed] [Google Scholar]
- [17].Manickam P, Fernandez RE, Umasankar Y, Gurusamy M, Arizaleta F, Urizar G, Bhansali S, Sen. Actuators B Chem 2018, 274, 47. [Google Scholar]
- [18].Sonawane A, Mujawar MA, Manickam P, Bhansali S, ACS Appl. Electron. Mater 2021, 3, 230. [Google Scholar]
- [19].Zhou Q, Kannan P, Natarajan B, Maiyalagan T, Subramanian P, Jiang Z, Mao S, Sens. Actuators B Chem 2020, 317, 128134. [Google Scholar]
- [20].Naik AR, Zhou Y, Dey AA, Arellano DLG, Okoroanyanwu U, Secor EB, Hersam MC, Morse J, Rothstein JP, Carter KR, Watkins JJ, Lab Chip 2022, 22, 156. [DOI] [PubMed] [Google Scholar]
- [21].Jang H-J, Lee T, Song J, Russell L, Li H, Dailey J, Searson PC, Katz HE, ACS Appl. Mater. Interfaces 2018, 10, 16233. [DOI] [PMC free article] [PubMed] [Google Scholar]
- [22].Parlak O, Keene Scott T, Marais A, Curto Vincenzo F, Salleo A, Sci. Adv 2018, 4, eaar2904. [DOI] [PMC free article] [PubMed] [Google Scholar]
- [23].Ku M, Kim J, Won J-E, Kang W, Park Y-G, Park J, Lee J-H, Cheon J, Lee Hyun H, Park J-U, Sci. Adv 2020, 6, eabb2891. [DOI] [PMC free article] [PubMed] [Google Scholar]
- [24].Sheibani S, Capua L, Kamaei S, Akbari SSA, Zhang J, Guerin H, Ionescu AM, Commun. Mater 2021, 2, 10. [DOI] [PMC free article] [PubMed] [Google Scholar]
- [25].Wang B, Zhao C, Wang Z, Yang K-A, Cheng X, Liu W, Yu W, Lin S, Zhao Y, Cheung KM, Lin H, Hojaiji H, Weiss PS, Stojanović MN, Tomiyama AJ, Andrews AM, Emaminejad S, Sci. Adv 2022, 8, eabk0967. [DOI] [PMC free article] [PubMed] [Google Scholar]
- [26].Kim S, Lee B, Reeder Jonathan T, Seo Seon H, Lee S-U, Hourlier-Fargette A, Shin J, Sekine Y, Jeong H, Oh Yong S, Aranyosi Alexander J, Lee Stephen P, Model Jeffrey B, Lee G, Seo M-H, Kwak Sung S, Jo S, Park G, Han S, Park I, Jung H-I, Ghaffari R, Koo J, Braun Paul V, Rogers John A, Proc. Natl. Acad. Sci. U. S. A 2020, 117, 27906. [DOI] [PMC free article] [PubMed] [Google Scholar]
- [27].Tu E, Pearlmutter P, Tiangco M, Derose G, Begdache L, Koh A, ACS Omega 2020, 5, 8211. [DOI] [PMC free article] [PubMed] [Google Scholar]
- [28].Steckl AJ, Ray P, ACS sens 2018, 3, 2025. [DOI] [PubMed] [Google Scholar]
- [29].Xu X, Clément P, Eklöf-Österberg J, Kelley-Loughnane N, Moth-Poulsen K, Chávez JL, Palma M, Nano Lett 2018, 18, 4130. [DOI] [PubMed] [Google Scholar]
- [30].Nakatsuka N, Yang K-A, Abendroth JM, Cheung KM, Xu X, Yang H, Zhao C, Zhu B, Rim YS, Yang Y, Weiss PS, Stojanović MN, Andrews AM, Science 2018, 362, 319. [DOI] [PMC free article] [PubMed] [Google Scholar]
- [31].Chen H, Xiao M, He J, Zhang Y, Liang Y, Liu H, Zhang Z, ACS Sens 2022, 7, 2075. [DOI] [PubMed] [Google Scholar]
- [32].Li T, Liang Y, Li J, Yu Y, Xiao M-M, Ni W, Zhang Z, Zhang G-J, Anal. Chem 2021, 93, 15501. [DOI] [PubMed] [Google Scholar]
- [33].Li K, Tu J, Zhang Y, Jin D, Li T, Li J, Ni W, Xiao M-M, Zhang Z-Y, Zhang G-J, iScience 2022, 25, 104522. [DOI] [PMC free article] [PubMed] [Google Scholar]
- [34].Klinghammer S, Voitsekhivska T, Licciardello N, Kim K, Baek C-K, Cho H, Wolter K-J, Kirschbaum C, Baraban L, Cuniberti G, ACS Sens 2020, 5, 4081. [DOI] [PubMed] [Google Scholar]
- [35].Liu Y, Wu B, Tanyi EK, Yeasmin S, Cheng L-J, Langmuir 2020, 36, 7781. [DOI] [PMC free article] [PubMed] [Google Scholar]
- [36].Jo S, Lee W, Park J, Kim W, Kim W, Lee G, Lee H-J, Hong J, Park J, Sens. Actuators B Chem 2020, 304, 127424. [Google Scholar]
- [37].Favaro M, Jeong B, Ross PN, Yano J, Hussain Z, Liu Z, Crumlin EJ, Nat. Commun. 2016, 7, 12695. [DOI] [PMC free article] [PubMed] [Google Scholar]
- [38].Yang S, Chen YC, Nicolini L, Pasupathy P, Sacks J, Su B, Yang R, Sanchez D, Chang YF, Wang P, Schnyer D, Neikirk D, Lu N, Adv. Mater 2015, 27, 6423. [DOI] [PubMed] [Google Scholar]
- [39].Olanrewaju A, Beaugrand M, Yafia M, Juncker D, Lab Chip 2018, 18, 2323. [DOI] [PubMed] [Google Scholar]
- [40].Bandodkar AJ, Choi J, Lee SP, Jeang WJ, Agyare P, Gutruf P, Wang S, Sponenburg RA, Reeder JT, Schon S, Ray TR, Chen S, Mehta S, Ruiz S, Rogers JA, Adv. Mater 2019, 31, 1902109. [DOI] [PubMed] [Google Scholar]
- [41].Liu T-L, Dong Y, Chen S, Zhou J, Ma Z, Li J, Sci. Adv 2022, 8, eabo7049. [DOI] [PMC free article] [PubMed] [Google Scholar]
- [42].Kim N-Y, Adhikari KK, Dhakal R, Chuluunbaatar Z, Wang C, Kim E-S, Sci. Rep 2015, 5, 7807. [DOI] [PMC free article] [PubMed] [Google Scholar]
- [43].Kim J, Kim M, Lee M-S, Kim K, Ji S, Kim Y-T, Park J, Na K, Bae K-H, Kyun Kim H, Bien F, Young Lee C, Park J-U, Nat. Commun 2017, 8, 14997. [DOI] [PMC free article] [PubMed] [Google Scholar]
- [44].Liu F, Chen Y, Song H, Zhang F, Fan Z, Liu Y, Feng X, Rogers JA, Huang Y, Zhang Y, Small 2019, 15, 1804055. [DOI] [PubMed] [Google Scholar]
- [45].Lim D, Hong I, Park SU, Chae JW, Lee S, Baac HW, Shin C, Lee J, Roh Y, Im C, Park Y, Lee G, Kim U, Koh J-S, Kang D, Han S, Won SM, Adv. Funct. Mater 2022, 32, 2201854. [Google Scholar]
- [46].Lu D, Yan Y, Avila R, Kandela I, Stepien I, Seo M-H, Bai W, Yang Q, Li C, Haney CR, Waters EA, MacEwan MR, Huang Y, Ray WZ, Rogers JA, Adv. Healthc. Mater 2020, 9, 2000942. [DOI] [PubMed] [Google Scholar]
- [47].Baker LB, Sports Med 2017, 47, 111. [DOI] [PMC free article] [PubMed] [Google Scholar]
- [48].Lara B, Gallo-Salazar C, Puente C, Areces F, Salinero JJ, Del Coso J, J. Int. Soc. Sports Nutr 2016, 13, 31. [DOI] [PMC free article] [PubMed] [Google Scholar]
- [49].Zhao J, Nyein HYY, Hou L, Lin Y, Bariya M, Ahn CH, Ji W, Fan Z, Javey A, Adv. Mater 2021, 33, 2006444. [DOI] [PubMed] [Google Scholar]
- [50].Yang Y, Song Y, Bo X, Min J, Pak OS, Zhu L, Wang M, Tu J, Kogan A, Zhang H, Hsiai TK, Li Z, Gao W, Nat. Biotechnol 2020, 38, 217. [DOI] [PubMed] [Google Scholar]
- [51].Li Y, Mao Y, Xiao C, Xu X, Li X, RSC Adv 2020, 10, 21. [DOI] [PMC free article] [PubMed] [Google Scholar]
- [52].Rahimi R, Ochoa M, Tamayol A, Khalili S, Khademhosseini A, Ziaie B, ACS Appl. Mater. Interfaces 2017, 9, 9015. [DOI] [PubMed] [Google Scholar]
- [53].Guinovart T, Valdés-Ramírez G, Windmiller JR, Andrade FJ, Wang J, Electroanalysis 2014, 26, 1345. [Google Scholar]
- [54].Kaempgen M, Roth S, J. Electroanal. Chem 2006, 586, 72. [Google Scholar]
- [55].Madeira GDM, Dias Mello HJNP, Faleiros MC, Mulato M, J. Mater. Sci 2021, 56, 2738. [Google Scholar]
- [56].Karyakin AA, Vuki M, Lukachova LV, Karyakina EE, Orlov AV, Karpachova GP, Wang J, Anal.Chem 1999, 71, 2534. [DOI] [PubMed] [Google Scholar]
- [57].Hill NE, Andrade ENDC, Proc. R. Soc. Lond. A Math. Phys. Sci 1957, 240, 101. [Google Scholar]
- [58].Hoffman JD, Smyth CP, J. Am. Chem. Soc 1949, 71, 431. [Google Scholar]
- [59].Schrödle S, Buchner R, Kunz W, J. Phys. Chem. B 2004, 108, 6281. [DOI] [PubMed] [Google Scholar]
- [60].Koh A, Kang D, Xue Y, Lee S, Pielak RM, Kim J, Hwang T, Min S, Banks A, Bastien P, Manco MC, Wang L, Ammann KR, Jang K-I, Won P, Han S, Ghaffari R, Paik U, Slepian MJ, Balooch G, Huang Y, Rogers JA, Sci. Transl. Med 2016, 8, 366ra165. [DOI] [PMC free article] [PubMed] [Google Scholar]
- [61].Bandodkar AJ, Gutruf P, Choi J, Lee K, Sekine Y, Reeder JT, Jeang WJ, Aranyosi AJ, Lee SP, Model JB, Ghaffari R, Su C-J, Leshock JP, Ray T, Verrillo A, Thomas K, Krishnamurthi V, Han S, Kim J, Krishnan S, Hang T, Rogers JA, Sci. Adv 2019, 5, eaav3294. [DOI] [PMC free article] [PubMed] [Google Scholar]
- [62].Kanaley JA, Weltman JY, Pieper KS, Weltman A, Hartman ML, J. Clin. Endocrinol. Metab 2001, 86, 2881. [DOI] [PubMed] [Google Scholar]
- [63].Weise M, Drinkard B, Mehlinger SL, Holzer SM, Eisenhofer G, Charmandari E, Chrousos GP, Merke DP, J. Clin. Endocrinol. Metab 2004, 89, 3679. [DOI] [PubMed] [Google Scholar]
- [64].Oster H, Challet E, Ott V, Arvat E, de Kloet ER, Dijk D-J, Lightman S, Vgontzas A, Van Cauter E, Endocr. Rev 2017, 38, 3. [DOI] [PMC free article] [PubMed] [Google Scholar]
- [65].Laudat MH, Cerdas S, Fournier C, Guiban D, Guilhaume B, Luton JP, J. Clin. Endocrinol. Metab 1988, 66, 343. [DOI] [PubMed] [Google Scholar]
- [66].Ivars K, Nelson N, Theodorsson A, Theodorsson E, Ström JO, Mörelius E, PLoS ONE 2015, 10, e0129502. [DOI] [PMC free article] [PubMed] [Google Scholar]
- [67].Bandodkar AJ, Hung VWS, Jia W, Valdés-Ramírez G, Windmiller JR, Martinez AG, Ramírez J, Chan G, Kerman K, Wang J, Analyst 2013, 138, 123. [DOI] [PubMed] [Google Scholar]
- [68].Curto VF, Fay C, Coyle S, Byrne R, O’Toole C, Barry C, Hughes S, Moyna N, Diamond D, Benito-Lopez F, Sens. Actuators B Chem 2012, 171, 1327. [Google Scholar]
- [69].Dong Y, Chen S, Liu T-L, Li J, Small 2022, 18, 2106866. [DOI] [PMC free article] [PubMed] [Google Scholar]
Associated Data
This section collects any data citations, data availability statements, or supplementary materials included in this article.