

Significance
Benjamin Franklin fought against money counterfeiting in pre-Federal America by inventing new printing methods and production measures. Our comprehensive scientific analysis of six hundred paper money notes printed from 1709 to 1790 provide a unique perspective into Franklin’s ingenious ways for safeguarding bills, their materials, and historical instances of money manufacturing. Our work also sheds light on Franklin’s role as an inventor in this little-discussed aspect of the pre-Federal American fiscal enterprise.
Keywords: historic paper money, Benjamin Franklin, scientific analysis, spectroscopy, aberration-corrected scanning transmission electron microscopy
Abstract
Benjamin Franklin was a preeminent proponent of the new colonial and Continental paper monetary system in 18th-century America. He established a network of printers, designing and printing money notes at the same time. Franklin recognized the necessity of paper money in breaking American dependence on the British trading system, and he helped print Continental money to finance the American War of Independence. We use a unique combination of nondistractive, microdestructive, and advanced atomic-level imaging methods, including Raman, Infrared, electron energy loss spectroscopy, X-ray diffraction, X-ray fluorescence, and aberration-corrected scanning transmission electron microscopy, to analyze pre-Federal American paper money from the Rare Books and Special Collections of the Hesburgh Library at the University of Notre Dame. We investigate and compare the chemical compositions of the paper fibers, the inks, and fillers made of special crystals in the bills printed by Franklin’s printing network, other colonial printers, and counterfeit money. Our results reveal previously unknown ways that Franklin developed to safeguard printed money notes against counterfeiting. Franklin used natural graphite pigments to print money and developed durable “money paper” with colored fibers and translucent muscovite fillers, along with his own unique designs of “nature-printed” patterns and paper watermarks. These features and inventions made pre-Federal American paper currency an archetype for developing paper money for centuries to come. Our multiscale analysis also provides essential information for the preservation of historical paper money.
The $100 bill in the United States displays the portrait of Benjamin Franklin. Franklin earned the honorary title of “The First American” for his efforts to unify the American colonies and to gain independence from Britain. It is less known that Franklin was also a preeminent advocate for establishing the American monetary system (1). When he opened his printing house in 1728, paper money was a new concept across Western civilization (2, 3). Most of the silver and gold coins brought to the British–American colonies were rapidly drained away to pay for manufactured goods imported from abroad, leaving the colonies without sufficient monetary supply to expand their economy (4, 5). Although paper money is commonplace today, its introduction as a medium of exchange caused considerable uncertainty (6). Unlike specie coins, paper money served as a “representative token” without intrinsic value and at risk of quickly depreciating. In order to safeguard paper notes against depreciation and encourage confidence in their dependability, Franklin proposed tying the bill’s value to land, enabling consistent increases in quantity and price within the American colonies (3, 7, 8). During his career, Franklin printed nearly 2,500,000 money notes worth £903,410 for the Delaware, New Jersey, and Pennsylvania colonies. In 1749, he brought in a business partner, David Hall, who carried on the practice with William Sellers in 1764 (1, 7). Franklin also created a network of printers in other colonies, supplying printing presses, paper, and ink (1). This network printed paper notes for the Delaware, New Jersey, New York, Maryland, and South Carolina colonies (4).
Forging money was a well-organized activity in pre-Federal America (2, 4), and the new currency seemed to be a prime target for counterfeiters, who were most likely associated with competing printer networks. In response, Franklin invented sophisticated printing methods and maneuvers to foil counterfeiters. In 1736 to 1739, he introduced the “nature printing” method, which used the impression of a leaf with its unique and intricate vein structure to create an image that was nearly impossible for counterfeiters to copy (4, 8). Leonardo da Vinci first used this practice for imprinting the form of botanical objects (9). Franklin, however, invented a way to transfer leaf structures into the printing process (10). Franklin also deliberately misspelled certain words on different denominations of bills to serve as checks for detecting value alterations (2).
Additionally, Franklin was likely involved in developing a distinct type of paper for printing money (11). Alongside his main account book (12), he kept a separate ledger (never found) to record dealings with papermaker Anthony Newhouse in 1742 to 1743. In the mid to late 1740s, he purchased “money paper” from Newhouse (11). Historians speculate that Franklin was developing this new money paper with Newhouse and separated these accounts to keep its security features confidential (7).
As the colonies sought freedom from Britain, Franklin argued that paper money was vital in establishing an independent economy and breaking American dependence on the British trading system (13). In 1775, during the first month of the War of Independence, when the Continental Congress met in Philadelphia, one of their initial acts called for new bills of credit (13, 14). A committee, cochaired by John Adams and Benjamin Franklin, was formed to oversee the printing of the new Continental currency denominated in Spanish American dollars. Thomas Wilcox, Franklin’s former business partner and owner of the Ivy Mill, supplied the paper, while David Hall and William Sellers printed the money (4). The well-designed and consistently printed Continental money with security features against counterfeiting was used to finance the Continental Army. In response, the British military began importing materials to duplicate these unique features (15), flooding the colonies with counterfeit money issues that eventually caused hyperinflation of the Continental currency (6). The circulation of counterfeit bills by the British presented a new economic warfare tactic that was later used during the French Revolution, the Napoleonic conquest of Austria, the Union printers in the American Civil War, and by the Germans during both World Wars (15).
Our work uses spectroscopic and imaging methods (16), including advanced aberration-corrected scanning transmission electron microscopy (STEM), to shine a light on the pre-Federal American paper money housed in the Rare Books and Special Collections of the Hesburgh Library at the University of Notre Dame. We probed and compared the structure and composition of inks, fibers, paper, and fillers for over six hundred bills printed from 1709 to 1790 by Franklin’s network, those printed by other printers, and counterfeiters. This comprehensive analysis provides unique insight into Franklin’s ingenious methods for safeguarding bills, explores their materials, and describes historical instances of money manufacturing. This multiscale analysis may also aid future preservation of printed historical money.
Results
Characteristic printed attributes of Franklin’s paper money are found in borders, symbolic imagery, and text. Fig. 1A displays an example of a twenty-shilling Pennsylvania bill printed by Franklin on August 10, 1739. Across colonial paper bills, the borders and images identify the issuing bodies and regions. The printed text on the bill explains the denomination, classification, authorization, warning to counterfeiters, and printer information. The bill’s reverse features a “nature-printed” pattern of leaves. The paper contains impressed watermarks to identify its source, in addition to blue threads (Fig. 1B), colored microfiber (Fig. 1C), and translucent fillers (Fig. 1D). The money also had handwritten serial numbers and signatures.
Fig. 1.

General characteristics of pre-Federal American paper money printed by B. Franklin and his network. The photo (A) of a twenty shillings Pennsylvania paper money printed by B. Franklin on August 10, 1739, exhibits “nature printed” patterns of leaves at the bill’s reverse, blue threads (B), and fibers (C) on a six shillings Delaware money printed by J. Adams on January 01, 1776, translucent filler in a fifty dollar Continental money printed by D. Hall and W. Sellers on January 4, 1779 (D), Raman spectrum (E) of black printing pigment of bill shown at panel A, and a photo a twenty shillings Delaware money printed by B. Franklin on March 1, 1734, with XRF mapping for Si (K) characteristic X-ray (F).
Printing Pigments.
In money printed by Franklin’s network, the ink pigment is primarily black, with the occasional use of red and blue. The red colorant contains Hg and S (SI Appendix, Fig. S1). Raman spectra of these red areas exhibit symmetric A1 and two degenerate transverse (ETO) and longitudinal (ELO) vibrational modes for the mercury sulfide (HgS), indicating the use of vermilion (17, 18). Prussian blue (Fe4[Fe(CN)6]3) is also identified by a Fe (K) characteristic line on X-ray fluorescence (XRF) analysis and the vibrational mode of cyanide ligand (CN−) at 2,153 cm−1 (19) on Raman spectra (SI Appendix, Fig. S2).
The Raman spectrum (Fig. 1E) of black printing ink from a twenty shillings Pennsylvania bill indicates a carbon-containing pigment (20). After baseline correction, the spectrum shows two bands: an intense G band centered at 1,593 cm−1 and a broad peak at 1,300 to 1,400 cm−1. The latter is deconvoluted into two components centered at 1,341 (D4) and 1,370 (D1) cm−1. This low-intensity peak suggests a defective structure (20). Raman spectra of black pigments for multiple Pennsylvania, Delaware, New Jersey, and Continental bills (SI Appendix, Figs. S3–S6) also exhibit similar features. A few spectra also reveal the presence of silicon dioxide (quartz) impurities (SI Appendix, Fig. S4) by an A1 vibration centered at ~470 cm−1 (21). XRF analysis confirms these findings. For example, the black printing pigment of a twenty shillings Delaware bill (March 1, 1734) exhibits Si (Fig. 1F). The quartz impurity and intense G peak suggest the use of graphite-based pigment prepared by natural graphite from metamorphic rocks. This finding is surprising given that historical records from March 23, 1733, indicated that Franklin purchased a workshop to produce lampblack (also known as furnace black) by burning vegetable oils (22). He extensively used lampblack, advertised and sold his inks, and specified ink used in his Pennsylvania Gazette as ‘‘Benjy Franklin’s ink,” ‘‘B Franklin’s New Ink,” and ‘‘Ink of a very different sort.” Raman spectra of lampblack (20) are more complex than the ones acquired from these bills. The peak at 1,300 to 1,400 cm−1, representing the disordered carbon, is broader and more intense than the peak for lampblack. The spectrum usually requires up to seven bands to fit peaks at 1,000 to 1,800 cm−1 region for the lampblack (20).
The presence of Ca and P on XRF elemental maps is a viable identifier for pre-Federal money. The black printing pigments Franklin and his associates used show negligible amounts of Ca and P (Fig. 2 A and B and SI Appendix, Fig. S7). In contrast, counterfeit bills mimicking the bills printed by Franklin’s network contain considerable amounts of these elements (Fig. 2C and SI Appendix, Fig. S8). Such composition indicates pigmentation derived from the pyrolysis of bones containing hydroxyapatite (23). We should note that most legitimate colonial money printers outside Franklin’s network also used bone black. Several examples include a five shillings New York bill printed by William Bradford (Fig. 2D), a one hundred shillings Rhode Island bill printed by William Claggett in 1738 (SI Appendix, Fig. S9), a twenty shillings Virginia bill printed in 1757 (SI Appendix, Fig. S10), a forty shillings North Carolina bill (Fig. 2E), and a Massachusetts bill printed by Paul Revere and Thomas Fleet (Fig. 2F). We also identify bone black in the counterfeit money mimicking these colonial printers. For example, Fig. 2G shows a fake bill ascribed to Paul Revere containing bone black. These results suggest that Franklin developed a unique graphite-based black ink formulation for printing bills.
Fig. 2.
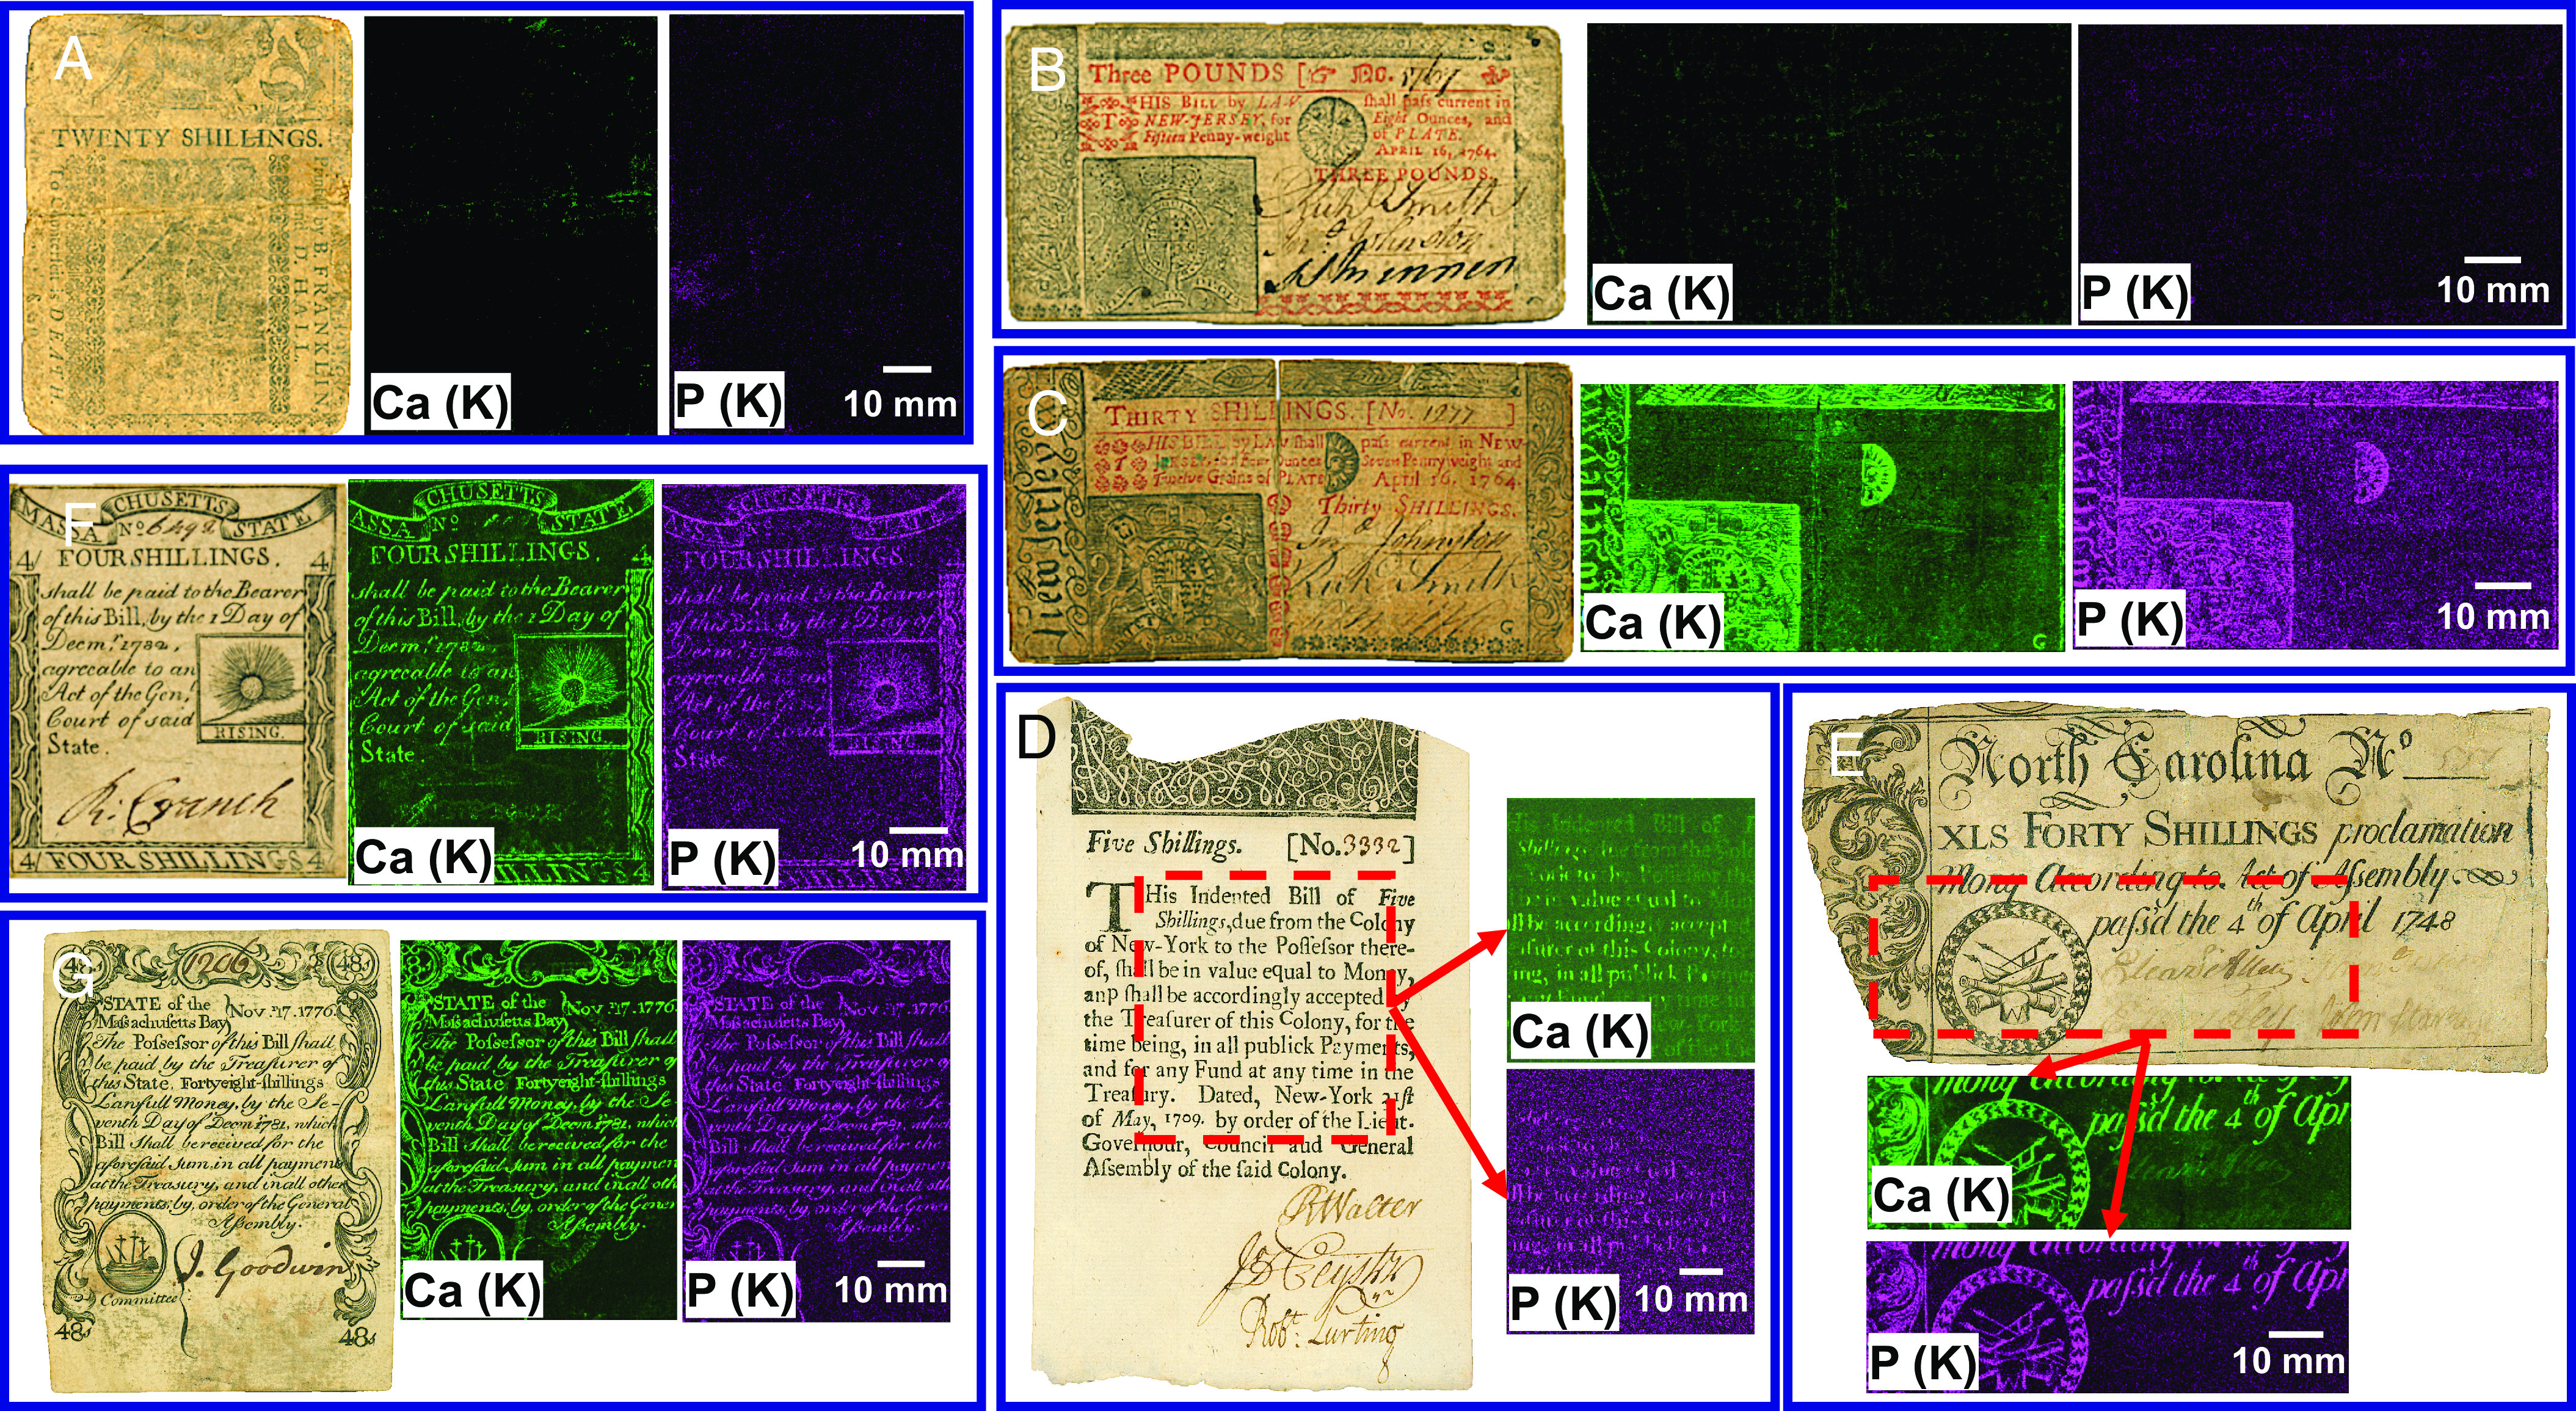
Photos and XRF elemental mapping for Ca (K) and P (K) characteristic X-rays of legitimate money printed by Franklin’s network (A and B), other printers (D, E, and F), and counterfeit bills (C and G). Twenty shillings Delaware bill (May 1, 1758) printed by B. Franklin and D. Hall (A), three pounds New Jersey bill (April 16, 1764) printed by J. Parker (B), counterfeit New Jersey bill ascribed to J. Parker (C), five shillings New York bill (May 31, 1709) printed by W. Bradford (D), forty shillings North Carolina bill (April 4, 1748) (E), four shillings Massachusetts bill printed by P. Revere and T. Fleet on 1779 (F), and counterfeit Massachusetts bill ascribed to P. Revere (G).
Paper.
Franklin’s paper currency contains thin (100 to 300 μm) and long (millimeters) blue fibers (Fig. 1 B and C and SI Appendix, Fig. S11). The bills printed in the 1770s also incorporate much larger (up to a few centimeters long) threads and microfibers. Photography (Fig. 1B and SI Appendix, Fig. S11) and optical microscopy imaging (Fig. 1C) show these fibers concentrated on the paper surface. Presumably, wet blue-dyed additions were sprayed on paper pulp before the final pressing and drying. Blue fibers are found exclusively in paper money printed by Franklin and his associates. Such colored security features were later used to print US dollar banknotes starting in 1862 (24). XRF analysis (SI Appendix, Fig. S11) shows that blue fibers contain Ca, K, and S. Raman spectra (SI Appendix, Fig. S11) acquired from fibers exhibit multiple bands of indigo (25) and symmetric stretching vibration of the SO42− group (26, 27). Lime, primarily composed of CaO and Ca(OH)2, and wood ash containing potassium-bearing compounds, were used to extract indigo from plants and used in the dying process of fabrics (28).
Another characteristic feature of paper bills is translucent fillers of different sizes (Fig. 1D). We conducted X-ray diffraction (XRD) investigation of bills to reveal the crystal structure of these fillers. The XRD pattern (SI Appendix, Fig. S12) of a Pennsylvania bill printed by Franklin on August 10, 1739, exhibits only diffraction peaks for cellulose I attributed to the planes of (1 ), (1 1 0), and (2 0 0) (29). The XRD pattern for a Pennsylvania bill printed on April 25, 1759, (Franklin and Hall) contains two small peaks at 2θ ∼ 26.7° and 45.3° in addition to the cellulose peaks. The intensities of these diffraction peaks significantly increase along with other narrow and highly intense peaks for the money printed in the 1770s (SI Appendix, Fig. S12). The indexing of all these peaks shows that the paper filler is muscovite. This hydrated phyllosilicate mineral (C2/c space group) consists of negatively charged layers held together by K+ ions. Each layer comprises two tetrahedrally coordinated aluminosilicate sheets that sandwich an octahedrally coordinated layer. Weak electrostatic interactions with the K+ ions and the covalently bonded atoms within layers allow muscovite to cleave between opposing sheets producing thin crystals within atomically flat surfaces.
We analyzed several 50-nm-thick specimens (SI Appendix, Fig. S13) extracted from fillers using the aberration-corrected (S)TEM method. These samples are susceptible to electron beam damage. Even brief exposure causes amorphization due to beam-induced radiolysis (SI Appendix, Fig. S13). To reduce the irradiation damage, we used a dispersed beam and low magnifications to find the orientation of the sample and the area of interest. This approach maintains a dose of ~3 electrons/Angstrom2 for the entire sample. Utilizing Drift Corrected Frame Integration (DCFI), we achieved the best signal-to-noise by simultaneously monitoring and measuring dose and adding images to provide the required resolution. SI Appendix, Fig. S14 shows several frames of a TEM dose series acquired by the DCFI with a dose rate of ~570 e−/Å2/s. The first and twentieth frames are similar, while further beam exposure gradually damages the sample. Such a procedure allows for integrating the best frames and discarding those that have suffered damage. A single frame and an integrated image of the first twenty frames with a different area of interest show no signs of sample deterioration (SI Appendix, Fig. S15). However, the limited spatial resolution and the low elemental contrast of conventional TEM imaging did not resolve the complex atomic-level structure of muscovite.
We also conducted high-angle annular dark-field (HAADF) imaging and integrated differential phase-contrast (iDPC) STEM imaging. This method has high signal-to-noise ratios, allowing for O, Al, and Si imaging in low-dose conditions. The beam-induced damage of samples was estimated by acquiring a series of HAADF-iDPC at increasing doses. The damage is insignificant for the first three scans, and amorphous areas were observed only at a cumulative dose above 25,000 e/Å2. The first frames of such simultaneous imaging show atomically resolved images of muscovite (SI Appendix, Fig. S16). The elemental contrast in the HAADF mode is proportional to the element’s atomic number. Therefore, the iDPC provides a significantly improved contrast ratio (e.g., 1.46 vs. 2.17 for K/Si), resulting in better-resolved images. Fig. 3A shows an iDPC image for a specimen with well-resolved K+ ions and tetrahedral/octahedral sheets. The top and lower sheets consist of Si, Al, and O, and, in the middle, a layer of O atoms and OH groups covalently bound to octahedral Al. We also used annular dark-field (ADF) and annular bright-field (ABF) segmented detectors to capture almost all electrons passing through the samples for imaging the lighter elements. This feature significantly increases the signal-to-noise ratio and provides a greater ability to resolve O, Si, and Al atoms. Fig. 3 B and C show integrated images of the same region acquired simultaneously by these detectors. Noise filtering of ADF images and template matching with a unit cell of muscovite lattice allows for the determination of the Si (or Al) and K (Fig. 3D) positions. ABF images also allow the indirect positioning of oxygen atoms (Fig. 3E).
Fig. 3.

Atomic-level imaging and electron energy loss spectra of a sample extracted from muscovite filler particle in a Pennsylvania twenty shillings money printed by B. Franklin and D. Hall, July 1, 1757. iDCP image showing the atomically resolved layered structure of muscovite (A), ADF (B), and ABF (C) images, high-resolution template matching with muscovite unit cell (D and E), core-loss EELS spectra for O K (F) Al L & Si L (G), and Fe L2,3 edges (H).
We also probed the muscovite filler samples with electron energy loss spectroscopy (EELS). Multiframe 2D array spectrum images were acquired at ultralow probe current (4 pA) using subpixel scanning and a large pixel size of 3 nm. This condition gave a low electron dose per spectrum image frame of 1,480 e/Å2 to minimize electron beam–induced damage. EELS data from multiple spectrum image frames were summed to improve the spectrum signal-to-noise ratio. SI Appendix, Fig. S17 shows a representative core-loss EELS spectrum exhibiting Al L2,3, Si L2,3, Fe M1, Al L1, Si L1, C K, K L2,3, O K, and Fe L2,3 ionization edges. The measured carbon was attributed to contamination. Additional spectrum images were acquired at 5,930 e/Å2 and 8,550 e/Å2 per spectrum image frame and reduced pixel size of 0.25 and 0.30 nm to determine the effect of increased electron dose. A preedge peak at ~528.5 eV was observed in the oxygen K edge, corresponding to the π* peak for molecular oxygen (SI Appendix, Fig. S18). This preedge peak is more intense in the high dose (50,000 e/Å2) and reduces significantly at the relatively lower dose (42,700 e/Å2) (SI Appendix, Fig. S18). We conclude that the excitation of electrons from the specimen’s atoms leads to cation (e.g., K+) migration under the force of the local electronic field, creating vacancies and excess oxygen (SI Appendix, Fig. S18). Oxygen atoms then form O2 and diffuse to the specimen surface. This result is consistent with time-resolved EELS studies on K2O–SiO2 and MgAl2O4 complex oxides, indicating strong oxygen K edge prepeak results from electron irradiation damage (30).
Using a large spectrum image pixel size combined with subpixel scanning allowed us to minimize electron beam–induced damage and eliminate the preedge peak in our low dose setup, even up to a total electron dose of 14,800 e/Å2 (Fig. 3F). The Al and Si L2,3 edges result from transitions from 2p core states to unoccupied s and d states (Fig. 3G). Due to their close proximity in energy loss, there is a significant overlap in the energy loss near edge fine structure (ELNES). Fig. 3G also shows normalized reference spectra for Al2O3 and SiO2. Al2O3 has only an octahedral Al configuration (~78.2 eV) (31). Compared with the Al2O3 spectrum, the muscovite Al L2,3 edge is slightly shifted with an unresolved feature at ~76 eV and a more intense peak at ~83 eV. Therefore, we assign these additional features to tetrahedral Al. The Si 2p core electron excitation for the measured specimen contains a primary peak at 107.5 eV and three low-intensity peaks centered at ~113 eV, 129 eV, and ~157 eV. These peaks are consistent with respective peaks in the SiO2 (quartz) spectrum (31) except for a feature at ~105 eV (Fig. 3G). Such a difference indicates that Al atoms influence the chemical environment of the Si atoms in the tetrahedral layers. Fig. 3H shows the muscovite Fe L2,3 spectrum with a normalized α-Fe2O3 reference. In the case of Fe L2,3 edge, the ELNES results from excitations of core 2p electrons to unoccupied 3d states. A small multiplet peak at 708 eV and L3/L2 ratio agrees with the α-Fe2O3 reference (32), suggesting that Fe is present mainly in the +3 oxidation state and an octahedral coordination environment in the muscovite. Our results do not indicate any Fe(II), although it is possibly below the experiment’s detection limit. Based on these results, we suggest that iron partially substitutes aluminum atoms in the muscovite structure.
We also analyzed bills from the colonies printed by Franklin’s network on various dates using XRF to evaluate muscovite filler particle composition changes. Although XRF analysis is not suited to measure lighter elements (e.g., oxygen), it provides information on the changes in relatively heavier Al, Si, K, and Fe. Fig. 4 A and B display the Al/Si and K/Al peak ratios determined from XRF spectra for filler particles of bills. These ratios are the same for bills printed on close dates, even in different colonies, indicating that muscovite particles have the same geological origin. Systematic image analysis of these XRF maps, such as characteristic X-ray K-lines for potassium (Fig. 4C), demonstrates an interesting pattern. Bills printed in the 1730s do not contain muscovite. All bills printed by Franklin and his associates after 1754, available for us to analyze, exhibit significant quantities of muscovite particles. Fig. 4C shows that the sizes of particles increase over time. Image analysis of XRF maps confirms this trend (SI Appendix, Fig. S19). These particles became considerably larger in Continental notes (Fig. 4C and SI Appendix, Fig. S19). Notably, the area of filler particles per mm2 of the paper for most analyzed bills is 0.5 to 2.5% (SI Appendix, Fig. S20).
Fig. 4.

XRF analysis and imaging of filler particles. The Si/Al (A) and Fe/K (B) XRF peak ratios for particles and maps (C) of K (K) characteristic X-ray peak for bills printed by Franklin and his associates for Pennsylvania (PA), Delaware (DE), New Jersey (NJ), Maryland (MD) money, and Continental Dollar (CD).
Discussion
We applied several novel techniques, such as high-resolution TEM, scanning TEM with advanced detectors, and EELS, to investigate the structure and composition of materials in historical artifacts. Combining these new methods with more traditional approaches used in conservation science enables the investigation of sensitive minerals in artworks and artifacts at the nanoscale and atomic levels. The unique combination of nondestructive and microdestructive methods allows for uncovering previously unknown ways that Benjamin Franklin developed to safeguard printed money notes against counterfeiting.
Franklin was a proponent of a paper monetary system that eventually had significant economic consequences for the colonies’ independence. He pioneered establishing a network of printers and initiated many developments to protect paper money from counterfeiters. Franklin consistently produced and promoted high-quality craftsmanship among his printing networks. Since counterfeiters often focused on replicating the bill’s design while using cheaper materials, forgeries could be of noticeably poorer quality (4). As a businessman, Franklin’s high-quality craftsmanship, both within the paper mills he employed and in his printing shops, ensured his competitive advantage. Money printing was likely one of the most profitable investments for colonial printers (22). Franklin became a leading player within the industry, connecting himself with the most successful papermakers. Even following his retirement from the printing business, Franklin’s innovations and impact remained vastly influential on pre-Federal paper money, which became an archetype for money development in the following centuries until the present.
Among his many efforts against forgeries, Franklin is best known for his earliest nature printing process, which he introduced to inhibit manual copying of Colonial money. Both leading up to and during the Revolutionary War, Franklin’s design and other features helped create unique challenges for counterfeiters to duplicate money. Our work suggests that he developed many methods for deterring forgeries. He used black graphite–containing ink for printing currency. The indigo-colored blue fibers and threads can be found in his money as early as 1739 and in fragments of muscovite crystals before 1754. Traditionally, the invention of adding colored thread into paper pulp has been attributed to Zenas Marshall Crane in 1844, who began using this technique for protected banknote paper. However, long before his time, colored silks and muscovite became critical features of paper money developed by Franklin and Newhouse, then carried on by Hall, Sellers, and Wilcox of the Ivy Mills.
We presume that muscovite filler particles had a dual intent. Franklin and Newhouse were likely experimenting to improve the durability of money paper to withstand the inevitable damage due to circulation and aging. For this purpose, they could introduce muscovite flakes into the paper pulp. No historical records corroborate this assumption, as Franklin kept a never-discovered confidential ledger to document dealings with Newhouse. However, Franklin mentions his papermaking activities in a letter to Peter Collinson, a British botanist (33). Franklin wrote, “I also send you a few Sheets of Paper made of the Asbestos. I am sorry it is so tender. I made some formerly that was much stronger.”
Our results show that Franklin was, indeed, engaged in developing mechanically robust paper types, even though nothing is known about his “asbestos paper”. Our Fourier-transform infrared spectroscopy (FTIR) results (SI Appendix, Figs. S21 and S22 and Table S1) for Franklin’s money paper show vibrations of cellulose (34, 35) and muscovite (36). FTIR spectra for the bills printed by other colonial printers (SI Appendix, Fig. S23 and Table S2) contain vibrations of kaolinite. This mineral has been extensively used as a standard filler to increase the mechanical strength of hand-made paper and to provide a white color (37, 38). These data indicate that Franklin and Newhouse developed a new formulation to prepare money paper with muscovite fillers. While experimenting, Franklin likely noticed larger muscovite flakes appearing on the paper surface and reflecting light upon tilting the bills. He might have leveraged this property as a protective feature for his paper bills. XRF analysis of counterfeit money notes supports this hypothesis. For example, a counterfeit New Jersey bill (April 16, 1764) does not contain fillers, whereas legitimate money printed by James Parker (Franklin’s associate) contains multiple muscovite particles (SI Appendix, Fig. S24).
The security features invented by Franklin used throughout Continental money, were prevalent in denominations above eight dollars since the risk of harm caused by counterfeits increased with the bill’s value. The British began importing material to duplicate the unique features. In 1779, Commodore Samuel Nicholson reported in the Virginia Gazette that on board a British ship heading towards New York, they “found it contained materials for counterfeiting our currency, consisting of types, paper with silk and glass in it” (7).
Specimens and Methods
Our sample paper bills are from the Rare Books and Special Collections of the Hesburgh Library at the University of Notre Dame. This Collection includes an extensive sampling of colonial American and Continental money. This study examined over six hundred paper money specimens ranging from the New York issue of May 31, 1709, to fractional currency privately released in the 1790s. Digital copies with extensive descriptions of nearly all money notes are available through the coins.nd.edu/ColCurrency webpage.
An inVia Raman Microscope (Renishaw) with a laser operating at 632.8 nm and NRS-5100 (Jasco) using at 532 and 785 nm excitation were utilized to obtain Raman spectra of printing pigments. The spectra were recorded as extended scans, and select regions were recorded as static scans with five acquisitions of 60 s each. The laser beam was focused with a 50× lens to realize a spatial resolution of ~2 μm. The laser power was kept below one milliwatt using neutral density filters to prevent the photodegradation of paper bills. Raman spectra were corrected to remove cosmic rays and normalize the signal. Based on the spectra’ shape, baseline correction was conducted by second- or fourth-order piecewise polynomial functions. FTIR was used to obtain absorption spectra for the cellulose paper and muscovite fillers. A Bruker Tensor 27 spectrophotometer was used to acquire FTIR spectra with an attenuated total reflection sampling technique and 4 cm−1 resolution over a scanning range of 400 to 4,000 cm−1.
An Orbis (EDAX) XRF analyzer with an Rh X-ray tube, poly-capillary optics, and a Si(Li) drift detector was used to determine the elemental composition and characterize the elemental distribution of pigments and paper filler. The Orbis system contains a dual-color CCD camera and an automated sample stage. The system produces focused X-ray beams with variable spot sizes of 2, 1, and 0.03 mm. These beams were used to conduct single-point analysis and high-resolution two-dimensional elemental maps. The experimental conditions for obtaining two-dimensional elemental maps were 40 kV, 400 mA, 0.03 mm beam spot size and 0.5 s acquisition time. We used a 1-mm beam spot size and 60 s acquisition time for single-point measurements. The paper money was also characterized by XRD using a Bruker D8 Advance diffractometer with Cu Kα radiation in the 2θ range from 5 to 80°.
The structural characterization of the muscovite paper fillers by high-resolution TEM and STEM is performed with traditional TEM and HAADF, iDPC ABF, and ADF imaging methods using Titan 300 and aberration-corrected Spectra 30 to 300 electron microscopes working at 300 kV. TEM samples were prepared using Helios 600 (Thermo) focus-ion beam–scanning electron microscopy. Filler particles with ~100 μm were extracted from the bills and placed on Al sample holders using double-sided conductive carbon tape. A 3-nm iridium layer was deposited on fillers using magnetron sputtering. Samples were then loaded into Helios, and a platinum layer (1 μm thick) in a 5 μm × 0.5 μm rectangular area was deposited onto the selected area of fillers. Then, ∼5-μm deep trenches with a 52° base angle were milled on both sides of the platinum layer with an accelerating voltage of 3 keV and a milling current of 5 nA. The slice was subsequently lifted from the sample and polished to a ∼ 50 nm thickness under an accelerating voltage of 3 keV and a milling current of 500 pA to produce clean cross-section samples for TEM imaging without milling artifacts. To acquire high-quality STEM images of electron-beam sensitive muscovite samples, the beam current was monitored and measured by microscope read-out and a Faraday cup of the EELS spectrometer. The electron beam current of 5 to 10 pA and dwell time of ~10 μs were used to avoid beam-induced amorphization. We used 2,048 × 2,048 pixels (image size) and 1.5 to 8 million magnifications to image the structure of samples.
EELS characterization of the muscovite fillers was performed using a cold field emission JEOL F200 (S)TEM equipped with a Gatan Continuum electron energy-loss spectrometer fitted with a single electron counting detector (Gatan, K3). Analysis was performed with a four pA 1.5 Å electron probe with convergence and collection semiangles of 8 mrad and 18 mrad, respectively. All EELS data were acquired at energy-dispersion 0.45 eV/ch in dualEELS mode with low-loss and high-loss acquisition times of 0.33 ms and 1 ms in spectrum imaging (SI) mode. SI acquisition was typically performed over 1 μm × 1 μm specimen areas. SI pixel size was set to 0.25 to 3 nm and pixel dwell time set to 1.33 ms, with subpixel scanning enabled. A 4×4 subgrid was selected to reduce specimen dose and minimize beam damage while minimizing scan artifacts.
Supplementary Material
Appendix 01 (PDF)
Acknowledgments
The work was performed with the financial support of the FY17 Faculty Research Support Program and Notre Dame Research at the University of Notre Dame. The work was primarily performed at the Nuclear Science Laboratory of the University of Notre Dame, supported by the U.S. NSF (PHY-2011890). The authors also acknowledge the Notre Dame Center for Environmental Science & Technology, the Materials Characterization Facility, the Molecular Structure Facility, and the Integrated Imaging Facility for instrumental usage.
Author contributions
K.M., L.J., Z.D.S, and M.W. designed research; K.M., A.Y., M.K., M.R., L.R.L., and L.S, M.W. performed research; A.Y., M.K., M.R., and L.R.L. analyzed data; and K.M., A.A., L.J., L.R.L., L.S., Z.D.S., and M.W. wrote the paper.
Competing interests
The authors declare no competing interest.
Footnotes
This article is a PNAS Direct Submission.
Data, Materials, and Software Availability
Data (39) (raw spectra and imaging files) have been deposited in Materials Data Facility (40). All study data are included in the article and/or SI Appendix. Some study data are available (American paper money is drawn from Rare Books and Special Collections of the Hesburgh Library, University of Notre Dame. This Collection has an extensive collection of colonial American and Continental money featuring over six hundred pieces of paper money ranging from the New York issue of May 31, 1709, to the fractional currency privately emitted in the 1790s. Digital copies with extensive descriptions of nearly all money notes are available through the coins.nd.edu/ColCurrency webpage). Photos of money notes were reproduced from the original held by the Department of Special Collections of the Hesburgh Libraries of the University of Notre Dame.
Supporting Information
References
- 1.Franklin B., “The autobiography of Benjamin Franklin” in The Autobiography of Benjamin Franklin: Penn Reading Project Edition, Conn P., Goodman N. G., Eds. (University of Pennsylvania Press, 2005), pp. 7–142. [Google Scholar]
- 2.Newman E. P., Franklin making money more plentiful. Proc. Am. Philos. Soc. 115, 341–349 (1971). [Google Scholar]
- 3.Mumford M. D., Social innovation: Ten cases from Benjamin Franklin. Creat. Res. J. 14, 253–266 (2002). [Google Scholar]
- 4.Newman E. P., The Early Paper Money of America (Krause Publications, ed. 5, 2008), pp. 5–504. [Google Scholar]
- 5.Davies G., History of Money (University of Wales Press, ed. 4, 2016), pp. 5–800. [Google Scholar]
- 6.Persson K. G., An Economic History of Europe: Knowledge, Institutions and Growth, 600 to the Present (Cambridge University Press, 2015). 10.1017/CBO9780511800610. [DOI] [Google Scholar]
- 7.Barrett D., “Modest Enquiry” and major innovation: Franklin’s early American currency. Visible Lang. 29, 316–363 (1995). [Google Scholar]
- 8.Grubb F., Benjamin Franklin and the birth of a paper money economy (2006), pp. 1–10. https://www.philadelphiafed.org/education/benjamin-franklin-and-the-birth-of-a-paper-money-economy.
- 9.Hume N., The nature print and photography in the 1850s. Hist. Photogr. 35, 44–58 (2011). [Google Scholar]
- 10.Roberts J. L., The veins of Pennsylvania: Benjamin Franklin’s nature-print currency. Grey Room 69, 50–79 (2017). [Google Scholar]
- 11.Miller C. W., Benjamin Franklin’s Philadelphia Printing: A Descriptive Bibliography (American Philosophical Society, Philadelphia, 1974), pp. 1–583. [Google Scholar]
- 12.Eddy G. S., Account Books Kept by Benjamin Franklin: Ledger “D” 1739–1747 (Columbia University Press, New York, 1929), pp. 1–126. [Google Scholar]
- 13.Grubb F., “The Continental dollar: Initial design, ideal performance, and the credibility of congressional commitment” Working Paper 17276 (National Bureau Of Economic Research, Cambridge, MA, 2011), August 2011, https://www.nber.org/papers/w17276. [Google Scholar]
- 14.Carson T., Bonk M., Ed., “The age of revolution, 1763–1790 overview” in Gale Encyclopedia of U.S. Economic History (Gale Group, Detroit, 1999), vol. 1, pp. 9–12. [Google Scholar]
- 15.Newman E., The successful British counterfeiting of American paper money during the American revolution. Br. Numis. J. 29, 174–187 (1958). [Google Scholar]
- 16.Wiescher M., Manukyan K., Scientific Analysis of Cultural Heritage Objects, Synthesis Lectures on Engineering, Science, and Technology (SLEST) (Springer Nature, 2020), pp. 1–228, 10.1007/978-3-031-02087-2. [DOI] [Google Scholar]
- 17.Zallen R., Lucovsky G., Taylor W., Pinczuk A., Burstein E., Lattice vibrations in trigonal HgS. Phys. Rev. B 1, 4058–4070 (1970). [Google Scholar]
- 18.Frost R. L., Edwards H. G. M., Duong L., Kloprogge J. T., Martens W. N., Raman spectroscopic and SEM study of cinnabar from Herod’s palace and its likely origin. Analyst 127, 293–296 (2002). [Google Scholar]
- 19.Kettle S. F. A., Diana E., Marchese E. M. C., Boccaleri E., Stanghellini P. L., The vibrational spectra of the cyanide ligand revisited: The ν(CN) infrared and Raman spectroscopy of Prussian blue and its analogues. J. Raman Spectrosc. 42, 2006–2014 (2011). [Google Scholar]
- 20.Coccato A., Jehlicka J., Moens L., Vandenabeele P., Raman spectroscopy for the investigation of carbon-based black pigments. J. Raman Spectrosc. 46, 1003–1015 (2015). [Google Scholar]
- 21.Colomban P., Milande V., Le Bihan L., On-site Raman analysis of Iznik pottery glazes and pigments. J. Raman Spectrosc. 35, 527–535 (2004). [Google Scholar]
- 22.Leo Lemay J. A., The Life of Benjamin Franklin (University of Pennsylvania Press, 2006), vol. 2, pp. 3–38. [Google Scholar]
- 23.Ruberto C., et al. , Imaging study of Raffaello’s “La Muta” by a portable XRF spectrometer. Microchem. J. 126, 63–69 (2016). [Google Scholar]
- 24.Wang H., Sun L., Materials and society: Functional chemicals and materials in banknote and security paper. Acc. Mater. Res. 2, 1–6 (2021). [Google Scholar]
- 25.Coupry C., Sagon G., Gorguet-Ballesteros P., Raman spectroscopic investigation of blue contemporary textiles. J. Raman Spectrosc. 28, 85–89 (1997). [Google Scholar]
- 26.Qiu J., Li X., Qi X., Raman spectroscopic investigation of sulfates using mosaic grating spatial heterodyne Raman spectrometer. IEEE Photonics J. 11, 1–12 (2019). [Google Scholar]
- 27.Frost R. L., Williams P. A., Martens W., Leverett P., Kloprogge J. T., Raman spectroscopy of basic copper(II) and some complex copper(II) sulfate minerals: Implications for hydrogen bonding. Am. Mineral. 89, 1130–1137 (2004). [Google Scholar]
- 28.Li S., Cunningham A. B., Fan R., Wang Y., Identity blues: The ethnobotany of the indigo dyeing by Landian Yao (Iu Mien) in Yunnan, Southwest China. J. Ethnobiol. Ethnomed. 15, 13 (2019). [DOI] [PMC free article] [PubMed] [Google Scholar]
- 29.Agarwal U. P., Ralph S. A., Baez C., Reiner R. S., Verrill S. P., Effect of sample moisture content on XRD-estimated cellulose crystallinity index and crystallite size. Cellulose 24, 1971–1984 (2017). [Google Scholar]
- 30.Jiang N., Spence J. C. H., Interpretation of oxygen K pre-edge peak in complex oxides. Ultramicroscopy 106, 215–219 (2006). [DOI] [PubMed] [Google Scholar]
- 31.Ewels P., Sikora T., Serin V., Ewels C. P., Lajaunie L., A complete overhaul of the electron energy-loss spectroscopy and X-ray absorption spectroscopy database: Eelsdb.eu. Microsc. Microanal. 22, 717–724 (2016). [DOI] [PubMed] [Google Scholar]
- 32.Almeida T. P., et al. , Visualized effect of oxidation on magnetic recording fidelity in pseudo-single-domain magnetite particles. Nat. Commun. 5, 5154 (2014). [DOI] [PMC free article] [PubMed] [Google Scholar]
- 33.National Archives and The University of Virginia Press, From Benjamin Franklin to Peter Collinson (National Archives & the University of Virginia Press, 1755). [Google Scholar]
- 34.Garside P., Wyeth P., Identification of cellulosic fibres by FTIR spectroscopy: Thread and single fibre analysis by attenuated total reflectance. Stud. Conserv. 48, 269–275 (2004). [Google Scholar]
- 35.Mohamed M. A., Salleh W. N. W., Jaafar J., Asri S. E. A. M., Ismail A. F., Physicochemical properties of “green” nanocrystalline cellulose isolated from recycled newspaper. RSC Adv. 5, 29842–29849 (2015). [Google Scholar]
- 36.Jia F., Song S., Preparation of monolayer muscovite through exfoliation of natural muscovite. RSC Adv. 5, 52882–52887 (2015). [Google Scholar]
- 37.Worasith N., Goodman B. A., Neampan J., Jeyachoke N., Thiravetyan P., Characterization of modified kaolin from the Ranong deposit Thailand by XRD, XRF, SEM, FTIR, and EPR techniques. Clay Miner. 46, 539–559 (2011). [Google Scholar]
- 38.Vahur S., Eero L., Lehtaru J., Virro K., Leito I., Quantitative non-destructive analysis of paper fillers using ATR-FT-IR spectroscopy with PLS method. Anal. Bioanal. Chem. 411, 5127–5138 (2019). [DOI] [PubMed] [Google Scholar]
- 39.Manukyan K., et al. , Data for Multiscale analysis of Benjamin Franklin’s innovations in American paper money. Materials Data Facility. 10.18126/KNHR-SR7F. Deposited 22 June 2023. [DOI] [PMC free article] [PubMed]
- 40.Blaiszik B., et al. , A data ecosystem to support machine learning in materials science. MRS Communications 9, 1125–1133 (2019). [Google Scholar]
Associated Data
This section collects any data citations, data availability statements, or supplementary materials included in this article.
Supplementary Materials
Appendix 01 (PDF)
Data Availability Statement
Data (39) (raw spectra and imaging files) have been deposited in Materials Data Facility (40). All study data are included in the article and/or SI Appendix. Some study data are available (American paper money is drawn from Rare Books and Special Collections of the Hesburgh Library, University of Notre Dame. This Collection has an extensive collection of colonial American and Continental money featuring over six hundred pieces of paper money ranging from the New York issue of May 31, 1709, to the fractional currency privately emitted in the 1790s. Digital copies with extensive descriptions of nearly all money notes are available through the coins.nd.edu/ColCurrency webpage). Photos of money notes were reproduced from the original held by the Department of Special Collections of the Hesburgh Libraries of the University of Notre Dame.