Abstract
Hearing impairment without threshold elevations can occur when there is damage to high-threshold auditory nerve fiber synapses with cochlear inner hair cells. Instead, cochlear synaptopathy produces suprathreshold deficits, especially in older patients, which affect conversational speech. Since listening in noise at suprathreshold levels presents significant challenges to the ageing population, we examined the effects of synaptopathy on tone-in-noise coding on the central recipients of auditory nerve fibers – the cochlear nucleus neurons.
To induce synaptopathy, guinea pigs received a unilateral sound overexposure to the left ears. A separate group received sham exposures. At 4 weeks post-exposure, thresholds had recovered but reduced ABR wave 1 amplitudes and auditory nerve synapse loss remained on the left side. Single unit responses were recorded from several cell types in the ventral cochlear nucleus to puretone and noise stimuli. Receptive fields and rate-level functions in the presence of continuous broadband noise were examined.
The synaptopathy-inducing noise exposure did not affect mean unit tone-in-noise thresholds, nor the tone-in-noise thresholds in each animal, demonstrating equivalent tone-in-noise detection thresholds to sham animals. However, synaptopathy reduced single-unit responses to suprathreshold tones in the presence of background noise, particularly in the cochlear nucleus small cells.
These data demonstrate that suprathreshold tone-in-noise deficits following cochlear synaptopathy are evident in the first neural station of the auditory brain, the cochlear nucleus neurons, and provide a potential target for assessing and treating listening-in-noise deficits in humans.
Keywords: Electrophysiology, auditory neurophysiology, small cell cap, cochlear nucleus, central auditory system
Graphical Abstract
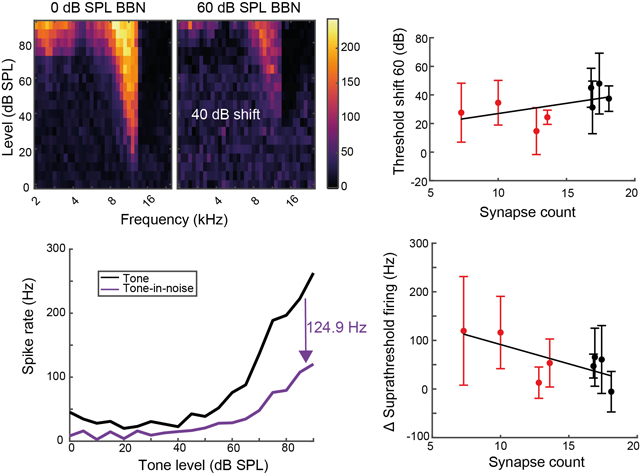
A) Unilateral noise exposure induces synaptopathy and temporary threshold shift (TTS) in guinea pigs. B) Auditory thresholds of single units in the cochlear nucleus are shifted in background noise, and this shift is not affected by synaptopathy. C) Suprathreshold firing rates are decreased by background sound, and this decrease correlates with cochlear synaptopathy.
INTRODUCTION
Hearing deficits can occur in the absence of auditory threshold shifts when preferential injury occurs to the synapses of low spontaneous rate (SR), high threshold auditory nerve fibers (ANFs) with cochlear inner hair cells (IHCs) (Furman et al., 2013). High threshold ANFs can be identified by their contacts on the modiolar side of IHCs and are calretnin-rich (Sharma et al., 2018). Cochlear synaptopathy is a potentially widespread health issue, as human temporal bones demonstrate broad synaptic damage across an ageing population, even before hair cell damage (Makary et al., 2011; Viana et al., 2015; Wu et al., 2019). Furthermore, age negatively correlates with the ability to understand speech in noisy environments, even in subjects with clinically normal auditory thresholds (Pichora-Fuller & Souza, 2003; Rajan & Cainer, 2008; Robert Frisina & Frisina, 1997).
Aged patients with normal audiometric thresholds, but presumptive more cochlear synaptopathy, have worse tone-in-noise (TIN) thresholds than young healthy hearing patients (Ralli et al., 2019). Therefore, TIN tests have been considered as viable tests for synaptopathy. Using a TIN test has the advantage of being able to determine frequency-specific deficits without requiring complex higher-level processes such as attention and it can be globally standardised across different languages. The alternative, speech-in-noise tests, use stimuli most often described as difficult by likely cochlear synaptopathy patients; however they have had limited success as a synaptopathy test in human studies, possibly due to the attention required (Couth et al., 2020; Guest et al., 2018).
Animal studies are useful to determine perceptual consequences of cochlear synaptopathy, as the peripheral damage can be carefully titrated and measured, allowing correlations with changes to auditory processing (as in Parthasarathy & Kujawa, 2018). Mice with ouabain-induced neural degeneration in the cochlea have shown increased behavioural TIN detection thresholds, despite no changes to tone-in-quiet thresholds (Resnik & Polley, 2021). In contrast, in a budgerigar model using kainate to induce auditory-nerve synapse loss, no changes to behavioural TIN thresholds were seen (Henry & Abrams, 2021). These studies leave open the question of how a noise-induced cochlear synaptopathy may affect TIN coding.
Here, we recorded from cochlear nucleus (CN) neurons in guinea pigs with cochlear synaptopathy and demonstrate that the peripheral cochlear neural damage does not produce TIN threshold shifts. Furthermore, our recordings show that suprathreshold TIN is impaired, providing a potential target for cochlear synaptopathy detection in humans. These data provide important insights into mechanisms underlying perceptual difficulties accompanying synaptopathy.
METHODS
Ethical approval
All animal experimental procedures were performed under protocols established by the National Institutes of Health (Publication 80–23) and were approved by the Institutional Animal Care & Use Committee at the University of Michigan. Male and female (n = 8 and 6, respectively) pigmented guinea pigs weighing 280–500g were obtained from Elm Hill Labs. No differences in unit responses between animals’ sex were found. Guinea pigs were housed in pairs on a 12/12 h light-dark cycle, with food and water available ad libitum. Using a unilateral noise exposure on the left side, 10 guinea pigs (6 male, 4 female) were noise-exposed to produce cochlear synaptopathy. A further 4 animals (2 male, 2 female) underwent a sham exposure to act as a control group.
Noise exposure and auditory brainstem responses
Auditory brainstem responses (ABRs, the volume-conducted synchronous activity of ANFs and their brainstem recipients in response to short tone bursts) were recorded from guinea pigs anesthetised with a mixture of ketamine (50 mg kg−1; s.c., Hospira Inc., Lake Forrest, IL, USA) and xylazine (5 mg kg−1; s.c., Akorn Inc.; Lake Forrest, IL, USA). Anaesthetic depth was monitored using the rear paw withdrawal reflex and maintained using 10 mg kg−1 ketamine and 1 mg kg−1 xylazine supplements. Atropine (0.05 mg kg−1) was administered to reduce bronchial secretions. Animals were placed in a stereotaxic frame (Kopf; Tuijunga, U.S.A.) within a sound-attenuating and electrically shielded double-walled chamber. Three needle electrodes were placed into the skin, one at the dorsal midline close to the neural crest, one behind the left pinna, and one behind the right pinna. ABRs were recorded in response to tone bursts (8, 12, 16 and 20 kHz; 5 ms duration, 1 ms rise/fall times, 21 Hz presentation rate, 512 repetitions in 10 dB steps from 0–90 dB SPL; Tucker-Davis Technologies RZ6). ABR wave 1 amplitudes were analysed with TDT BioSigRZ. ABRs were recorded pre- (baseline) and immediately post- noise exposure and at 2- and 4-weeks post-exposure. For noise trauma, anesthetised animals were unilaterally exposed (left ear) with narrow-band noise (centered at 7 kHz, half-octave bandwidth) at 102 dB SPL for 2 h. Sham-exposed animals underwent the same procedures, without turning on the noise.
Single-unit surgery & sound presentation
At the 4-week timepoint, immediately following ABR recordings, single-unit recordings were made in the cochlear nucleus. Guinea pigs were anaesthetised with ketamine (50 mg kg−1; Hospira Inc., Lake Forrest, IL, USA) and xylazine (5 mg kg−1; Akorn Inc.; Lake Forrest, IL, USA). Anaesthetic depth was monitored using the rear paw withdrawal reflex and maintained using 10 mg kg−1 ketamine and 1 mg kg−1 xylazine supplements. Atropine (0.05 mg kg−1) was administered during the initial surgery to reduce bronchial secretions. Animals were placed in a stereotaxic frame (Kopf; Tuijunga, U.S.A.) within a sound-attenuating and electrically shielded double-walled chamber. A midline incision was made to expose the skull, temporalis muscle removed, and a craniotomy performed to allow access to the left cerebellum. The dura mater was removed, and the exposed brain surface was kept moist by regular applications of saline. Auditory stimuli were delivered monaurally via a closed-field, calibrated system (modified DT770 drivers; Beyerdynamic Heilbronn, Germany) coupled to hollow ear bars. The speakers were driven by a Tucker-Davis Technologies (TDT; Alachua, FL, USA) System 3 (RZ6, PA5 & HB7), controlled by TDT Synapse and custom MATLAB (Mathworks; Natick, U.S.A) software.
Neural recordings
Multi-channel recording probes (NeuroNexus; Ann Arbor, MI, USA) were advanced stereotaxically through the cerebellum towards the left CN using an MP-285 microdrive (Sutter Instruments; Novato, CA, USA). Signals were amplified by a TDT PZ5 preamp connected to a TDT RZ2 processor for filtering (0.3 – 5 kHz), and data was collected using TDT Synapse software. Spikes were detected on-line with threshold set at 4 standard deviations from mean background noise, then spike-sorted post-hoc using PCA clustering of spike waveforms. Electrodes were positioned so that shanks passed through the dorsal cochlear nucleus (DCN) to reach the small cell cap (SCC) and ventral cochlear nucleus (VCN). Units were typed by their temporal responses (peristimulus time histograms/PSTHs) to tone-burst and broadband noise (BBN), receptive fields (RFs) - and rate-level functions (RLFs) (Ghoshal & Kim, 1997; Palmer, 1987; Stabler et al., 1996; Winter & Palmer, 1995). Units were further characterised using a machine learning model described previously (Hockley et al., 2022) which divided units into 5 broad categories; PL (bushy cells), Ch (T-stellates), SC (small cells), B (buildups) and On (onsets). Receptive-field stimuli consisted of randomised tone bursts (50 ms duration, 200 ms ISI, 2–24 kHz, 0.1 octave spacing, 5 dB steps, 5 ms cosine on/off ramp, 15 repeats, randomised). From these, thresholds and characteristic-frequencies (CF) were obtained from the lowest sound level and frequency to produce spikes >2 standard deviations above spontaneous firing rates. RLFs at CF were then used for further analyses. RFs were collected in silence, or in the presence of a continuous 40- or 60-dB SPL broadband background noise. After neurophysiological recordings, animals were euthanised (1 ml Euthatal) and cochleae were collected.
Cochlear Immunostaining for synaptic counts
Four weeks post-noise exposure, after the final ABRs and neural recordings, guinea pigs were perfused with 500 ml PBS followed by 500 ml 4 % paraformaldehyde. After perfusion, inner ear tissues were dissected and post-fixed in 4 % paraformaldehyde in 0.01 M phosphate-buffered saline (PBS) for 2 h at room temperature, followed by decalcification in 5 % EDTA at 4 °C for 3 weeks. Fresh 5 % EDTA was provided weekly. Cochlear tissues were microdissected and permeabilised by freeze–thawing in 30 % sucrose. The microdissected tissues were incubated in blocking buffer containing 5 % normal horse serum and 0.3 % Triton X-100 in PBS for 1 h. Tissues were then incubated in primary antibodies (diluted in 1 % normal horse serum and 0.3 % Triton X-100 in PBS) at 37 °C overnight. The primary antibodies used in this study were as follows: anti-Ctbp2 (BD Biosciences, San Jose, CA; 1:200; catalog no. 612044), anti-GluR2 (Millipore, Billerica, MA; 1:1000; catalog no. MAB397), and anti-MyoVIIa (Proteus Biosciences, Ramona, CA; 1:100; catalog no. 25–6790). Tissues were then incubated with appropriate Alexa Fluor-conjugated fluorescent secondary antibodies (Invitrogen, Carlsbad, CA; 1:1000 diluted in 1 % normal horse serum and 0.3 % Triton X-100 in PBS; AF488 IgG2a catalog no. A-21131; AF568 IgG1 catalog no. A-21124; AF647 IgG catalog no. A-21244) for 1 h at room temperature. The tissues were mounted on microscope slides in ProLong Diamond Antifade Mountant (Thermo Fisher Scientific). Cochleae were imaged at low power (10X magnification) to convert cochlear location into frequency (tonotopic mapping) using a custom plug-in to ImageJ (1.53c NIH, MD). Cochlear tissues from 12, 16 and 20 kHz regions were used for further analyses. Confocal z-stacks of cochlear tissues were taken using a Leica SP8 confocal microscope. For inner hair cell synapse counts, z-stacks (0.3 μm step size) were taken under 63X (+2.4X optical zoom) magnification spanning the entire IHC height to ensure all synapses were imaged. Imaging and analyses of synapses were performed as previously described in (Wan et al., 2014). Briefly, imageJ/Fiji software (version 1.53c, NIH, MD) was used for image processing and quantification. One cochlea from each animal was imaged for each experiment, with three images acquired at each cochlear region. For synapse counts, CtBP2 and GluR2 puncta in each image stacks were captured and counted manually using ImageJ/Fiji software multi-point counter tool. Synaptic counts of each z-stack were divided by the number of IHCs, which could be visualised by staining of MyoVIIa antibody. Each individual image usually contained 8–10 IHCs. For figures, one representative image was selected from amongst the 24–30 images from the specific frequency shown.
Experimental design and statistical analysis
Graphics and statistical tests for ABR and synapse-count data were performed using GraphPad Prism version 9.3.1 for Windows (GraphPad Software, www.graphpad.com). Data sets with normal distributions were analysed with parametric tests while non-parametric tests were used for sets that did not conform to normality criteria. Two-way ANOVAs, followed by Tukey’s multiple comparisons test were used to compare ABR thresholds and ABR wave 1 amplitudes at each time point (baseline, post exposure/sham, 2 weeks and 4 weeks post exposure/sham). Quantification of confocal microscopy images for IHC synapse density at an individual frequency were analysed by unpaired t-test (Mann-Whitney test). Single-unit data analysis and statistics were conducted in MATLAB. Statistical tests, including t-test, Kruskal-Wallis test and Pearson correlation coefficient were used to compare between groups (α = 0.05). All average data are presented as mean +/− SD.
RESULTS
Evidence of Cochlear Synaptopathy
ABR’s immediately post acoustic trauma revealed large threshold shifts for frequencies above the noise exposure spectrum which returned to baseline in most frequencies within 2 weeks, with a mild permanent threshold elevation at the noise-exposure frequency (Fig 1A). At 12 kHz, noise exposure increased mean ABR thresholds from 7.5 (SD 4.926) to 74 (SD 8.433) dB SPL. After 2 and 4 weeks these thresholds revered to 9.286 (SD 6.075) & 11 (SD 6.583) dB SPL, respectively. ABR wave 1 amplitude, representing synchronised ANF activity, was measured as a potential indicator of cochlear synaptopathy (Lobarinas et al., 2017). In contrast to the temporary nature of the threshold shifts, large noise-induced decreases in ABR wave 1 amplitudes which did not fully recover 4-weeks post-exposure were observed (Fig 1B). At 12 kHz, noise exposure reduced the mean normalised ABR P1 amplitudes from 100 (SD 15.241) to 12.205 (SD 12.568). After 2 and 4 weeks these thresholds revered to 74.226 (SD 23.063) & 74.796 (SD 23.921), respectively. Sham-exposed animals showed no significant changes to ABR thresholds or wave 1 amplitudes at any timepoint (Fig 1A and B). Four weeks post-noise exposure, CN recordings were performed, and cochleae processed for histological analysis. Consistent with the observed reduction in ABR wave 1 amplitudes in the exposed animals, IHC synapse densities were decreased compared to the sham group (Fig 1C and D), demonstrating that the noise exposure was sufficient to produce IHC synaptopathy.
Fig 1: ABR recordings and synapse counts are consistent with IHC synaptopathy.
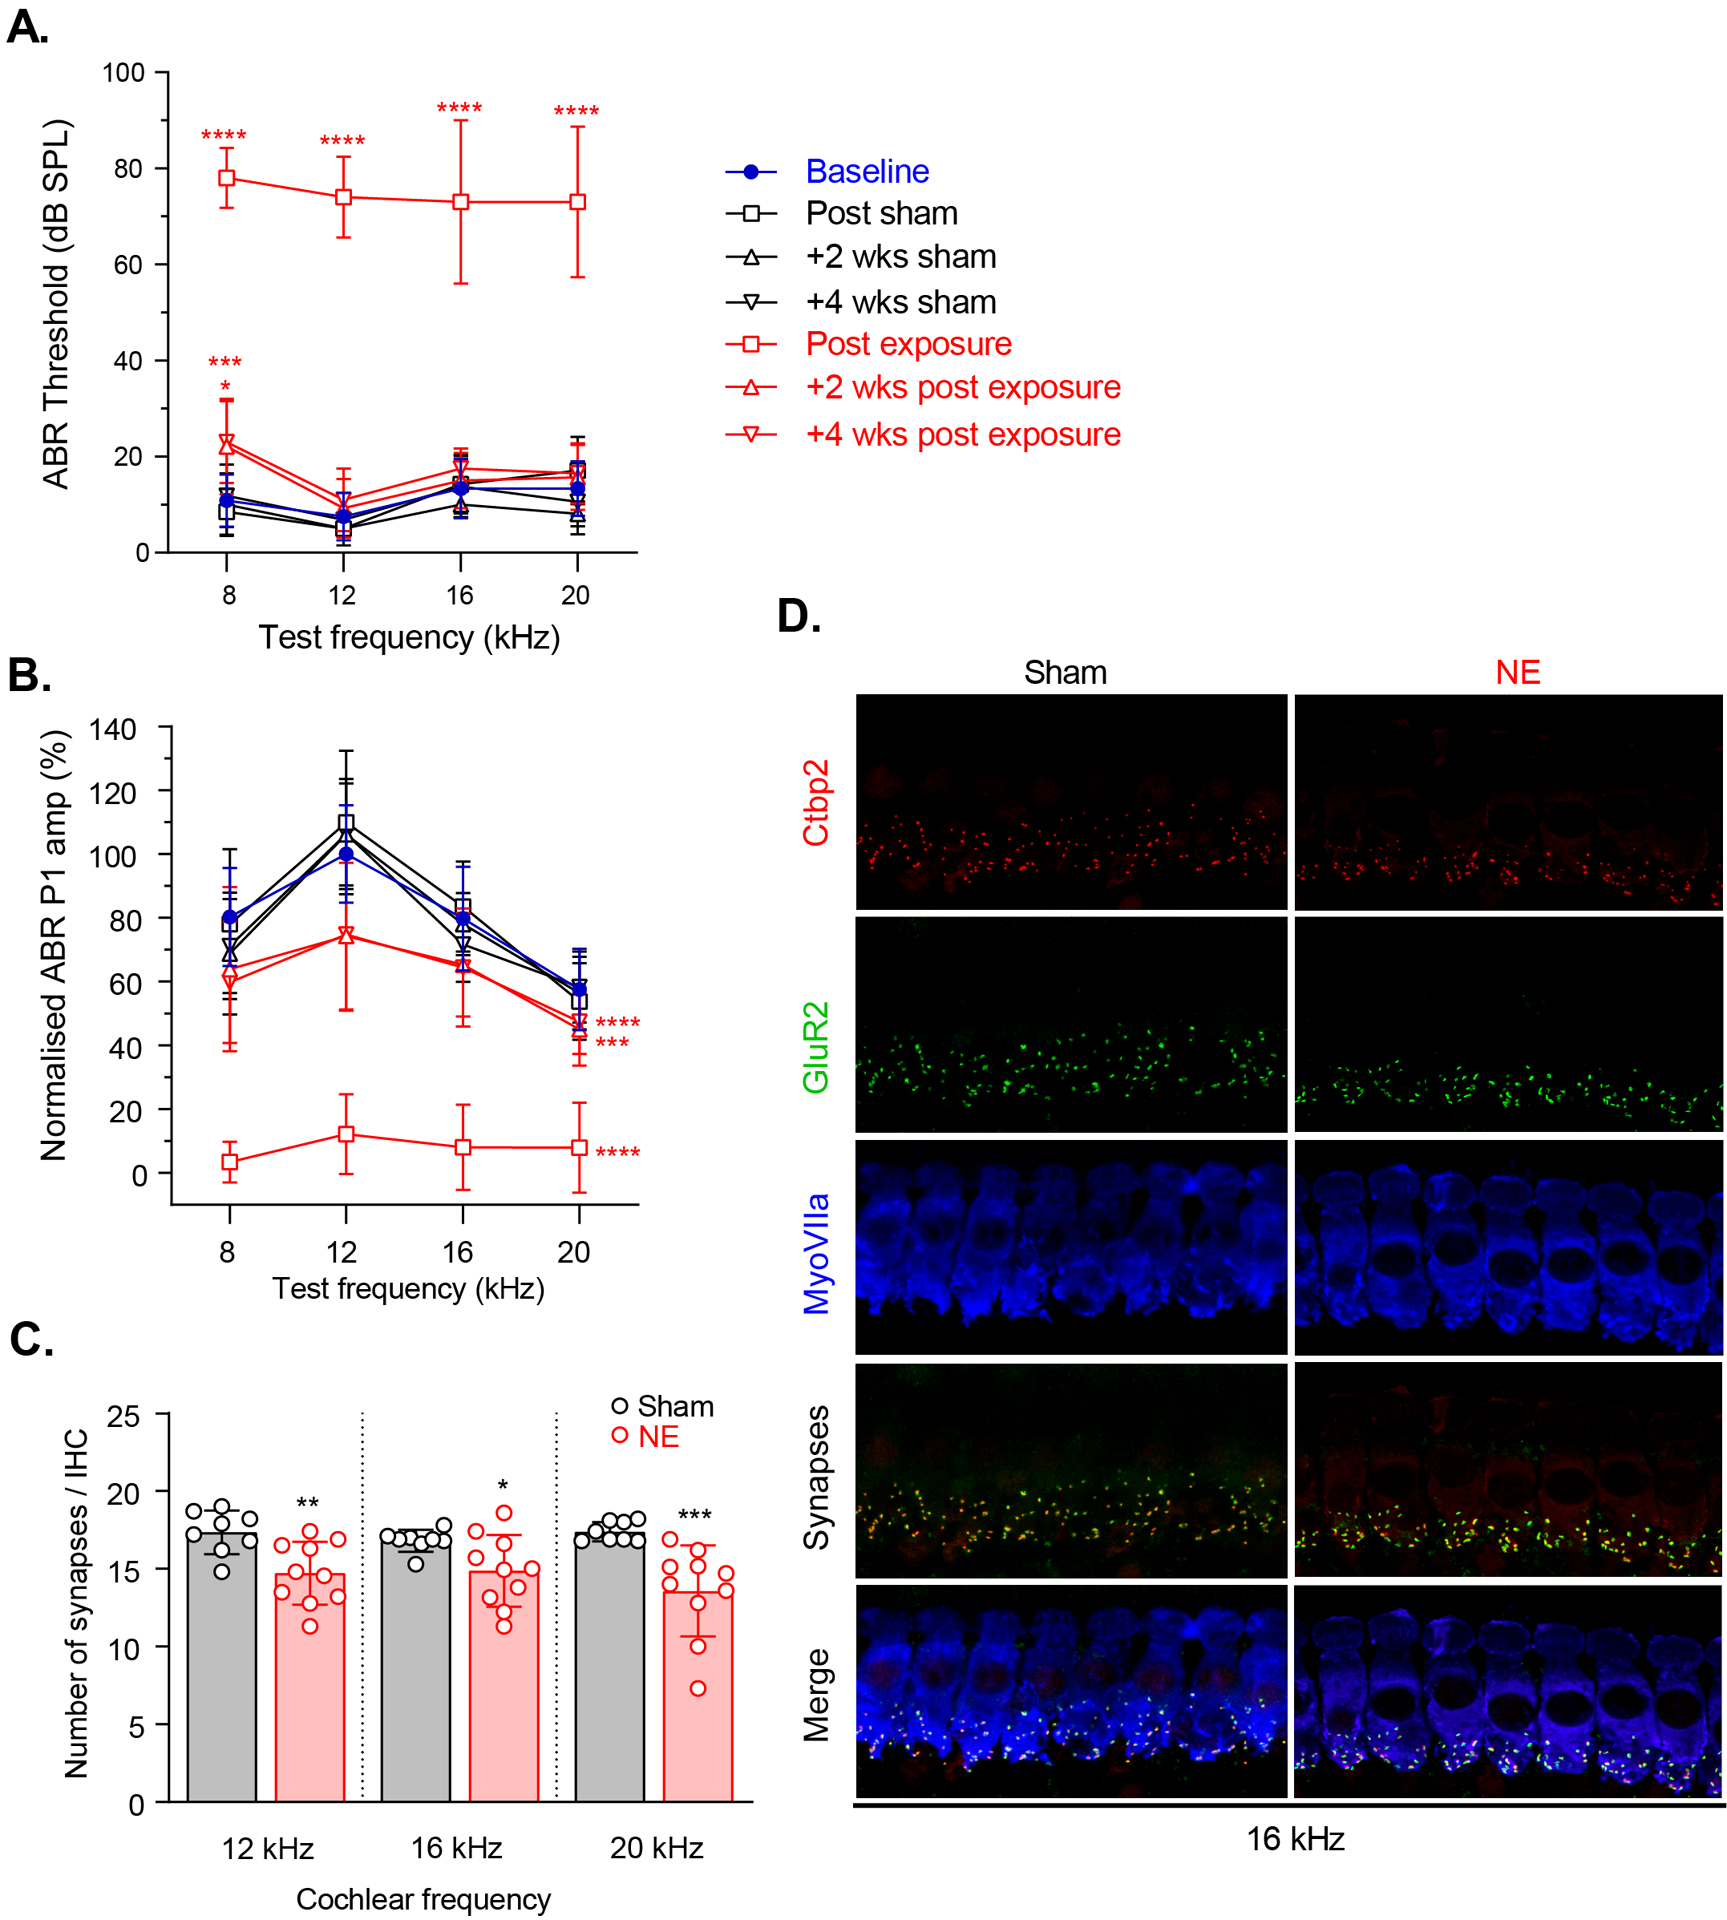
A) Noise exposure produced a temporary threshold shift at mid-high frequencies and a mild permanent threshold shift at 8 kHz. B) Noise exposure resulted in a permanent decrease in mean ABR wave 1 amplitudes. C) Acoustic trauma produced a significant decrease in IHC synapse density in the noise-exposed animals compared to sham-exposed animals at frequencies above the noise-exposure spectrum (17.2% at 12 kHz, 11.3% at 16 kHz and 21.8% at 20 kHz; p = 0.0092, p = 0.0459, p = 0.0003, respectively). D) Example synapse immunostaining for a sham and noise-exposed animal at the 16 kHz tonotopic cochlea location. For synapse counts, Ctbp2 (ribbon synapses marker, red) and GluR2 (post synaptic marker, green) puncta in each of 3 adjacent image stacks were captured. Synaptic counts of each z-stack were divided by the number of IHCs (visualized by staining of MyoVIIa, blue). Each individual image usually contained 8–10 IHCs. * p < 0.05; ** p < 0.01; *** p < 0.001; **** p < 0.0001. Error bars represent SD.
Cochlear Nucleus Recordings
Four weeks following noise exposure, 32-channel electrodes were used to isolate 699 single units from the 10 noise-exposed animals and 379 units from the 4 sham-exposed animals. Electrodes were positioned to simultaneously record units from the SCC and VCN. As previously described (Hockley et al., 2022) unit types were classified using a machine learning model based on their temporal and frequency response patterns, which was authenticated by manual unit typing (Ghoshal & Kim, 1997; Stabler et al., 1996; Winter & Palmer, 1995; E D Young et al., 1988). Onset and weakly-driven units were excluded from analyses due to their low numbers. Responses of typical small cell (SC), primary-like (PL) and chopper (Ch) neurons are shown in Fig 2. For each cell type, the RLF, PSTH and RF from a single example unit are shown (Fig 2A–C), and the mean RLFs for that cell type for the noise- and sham-exposed groups (Fig 2D). No differences in the mean RLFs were observed in the synaptopathy animals compared to the sham group. This result was unexpected, as it indicates no impairment of suprathreshold tone coding in the CN, thus challenging the hypothesis that reduced suprathreshold input following cochlear synaptopathy results in lower spike rates in the CN. Further, no significant differences were found between thresholds of small cells from sham and noise exposed animals (Sham 32.2 (SD 15.65) dB SPL, NE 32.84 (SD 14.95) dB SPL, n’s = 125 & 169, p=0.947). Likewise, for primary-like neurons not significant difference in thresholds were observed (Sham 34.8 (SD 15.17) dB SPL, NE 36.54 (SD 14.5) dB SPL, p=0.353). And for chopper cells a significant increase in threshold was seen (Sham 16.38 (SD 11.65) dB SPL, NE 27.41 (SD 13.74) dB SPL, p<0.0001).
Fig 2: Example cell types of the cochlear nucleus.
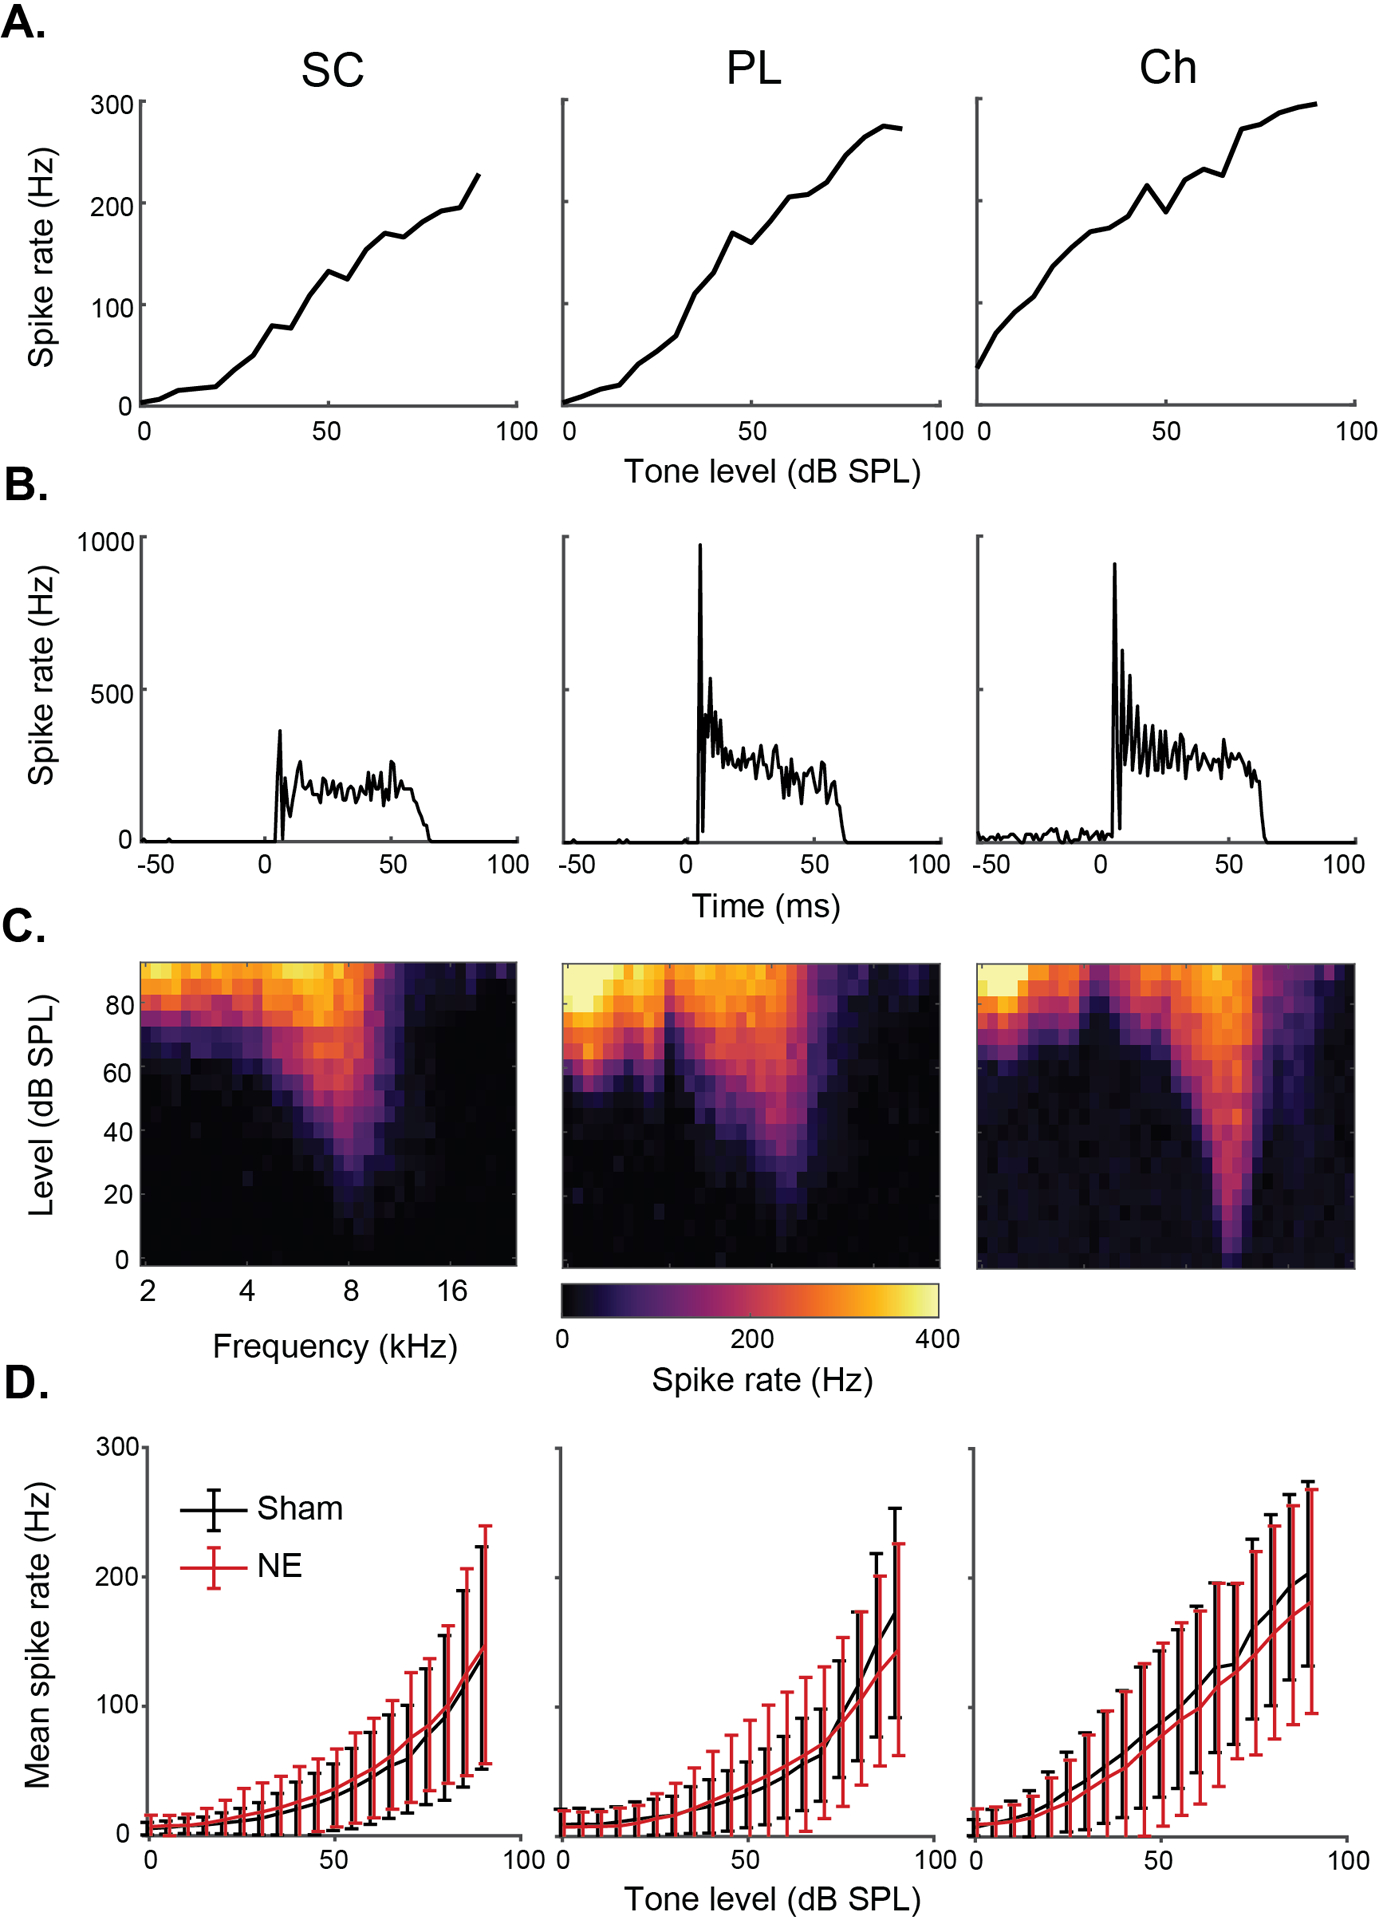
A-C) For the three major types of cells studied (SC, PL and Ch) we show example rate-level functions (RLFs), peristimulus-time histograms (PSTHs) and receptive fields (RFs). D) Mean (± SD) RLFs for the three cell types in sham vs noise exposed animals (NE).
Primary-like spontaneous firing rates were significantly reduced by noise exposure, from 9.02 Hz to 6.55 Hz (SD 11.489 & 10.12, p = 0.000572), however no significant changes were seen in small cells or chopper cells.
Cochlear Nucleus Suprathreshold TIN coding is impaired after Synaptopathy
While synaptopathy does not affect TIN threshold shifts in the VCN cells, we hypothesised that synaptopathy could impair coding of suprathreshold tones to a greater degree because synaptopathic noise exposure affects primarily high-threshold/low SR ANFs (Furman et al., 2013), which project preferentially to CN SCs (Liberman, 1991; Ryugo, 2008). We therefore plotted the suprathreshold TIN response functions for each neuron, and from these then calculated the mean reduction in spike rate for tones between 80–90 dB SPL to designate the suprathreshold impairment of TIN functions (SITIN) (Fig 3A). Mean synapse counts for each animal were calculated across the three cochlear frequencies evaluated (12, 16 & 20 kHz) and used as a single metric for synaptopathy in each animal.
Fig 3: Changes in suprathreshold firing rates in noise correlate with synaptopathy.
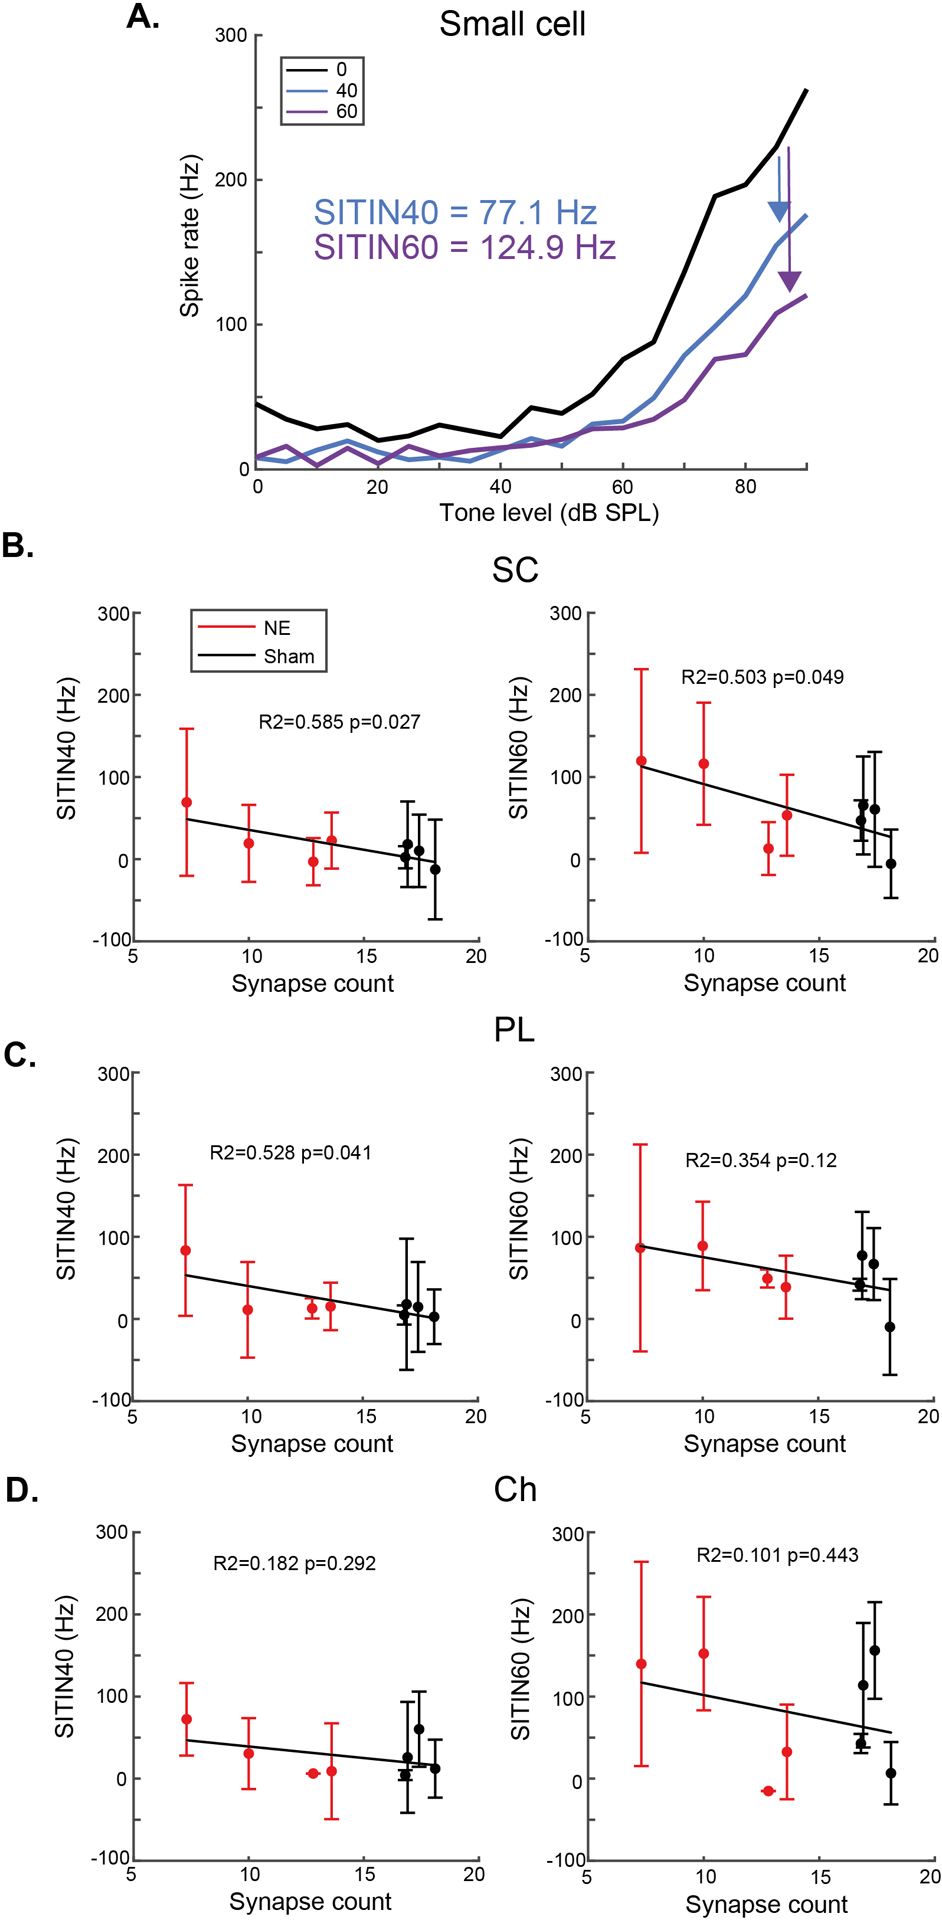
A) Example singe-neuron suprathreshold impaired TIN (SITIN) calculation from the rate-level functions of a small cell from a noise-exposed animal. B) SC SITIN correlates with synaptopathy for 40- and 60-dB background sound levels. C) PL neuron SITIN correlates with synaptopathy for the lower, but not higher, background sound level D) Ch neuron SITIN does not correlate with synaptopathy at either background sound level. Error bars indicate SD.
For SCs suprathreshold impairment of TIN (SITIN) at 40- (SITIN40) and 60-dB (SITIN60) SPL background sound significantly correlated with cochlear synapse counts (Fig 3B). PL neurons showed a significant correlation between SITIN40 and synapse counts, but not SITIN60, whereas Ch cells did not show significant correlations (Fig 3C&D).
Cochlear Nucleus TIN Threshold Shifts Do Not Increase After Synaptopathy
TIN stimuli were presented while recording from CN neurons of sham- and noise-exposed animals to determine the effect of synaptopathy on TIN coding in the CN. TIN stimuli consisted of the full tone-level range of RF stimuli presented in the presence of continuous 40- or 60-dB SPL broadband noise (N=397 neurons from 4 noise-exposed animals, 379 from the 4 sham-exposed animals). Fig 4A shows an example SC RF and the effects of 40- and 60-dB SPL background noise. Here, the background noises produce a 10- or 40 dB threshold shift, respectively (Fig 4A).
Fig 4: Single-unit tone-in-noise threshold shifts are reduced by cochlear synapopathy.
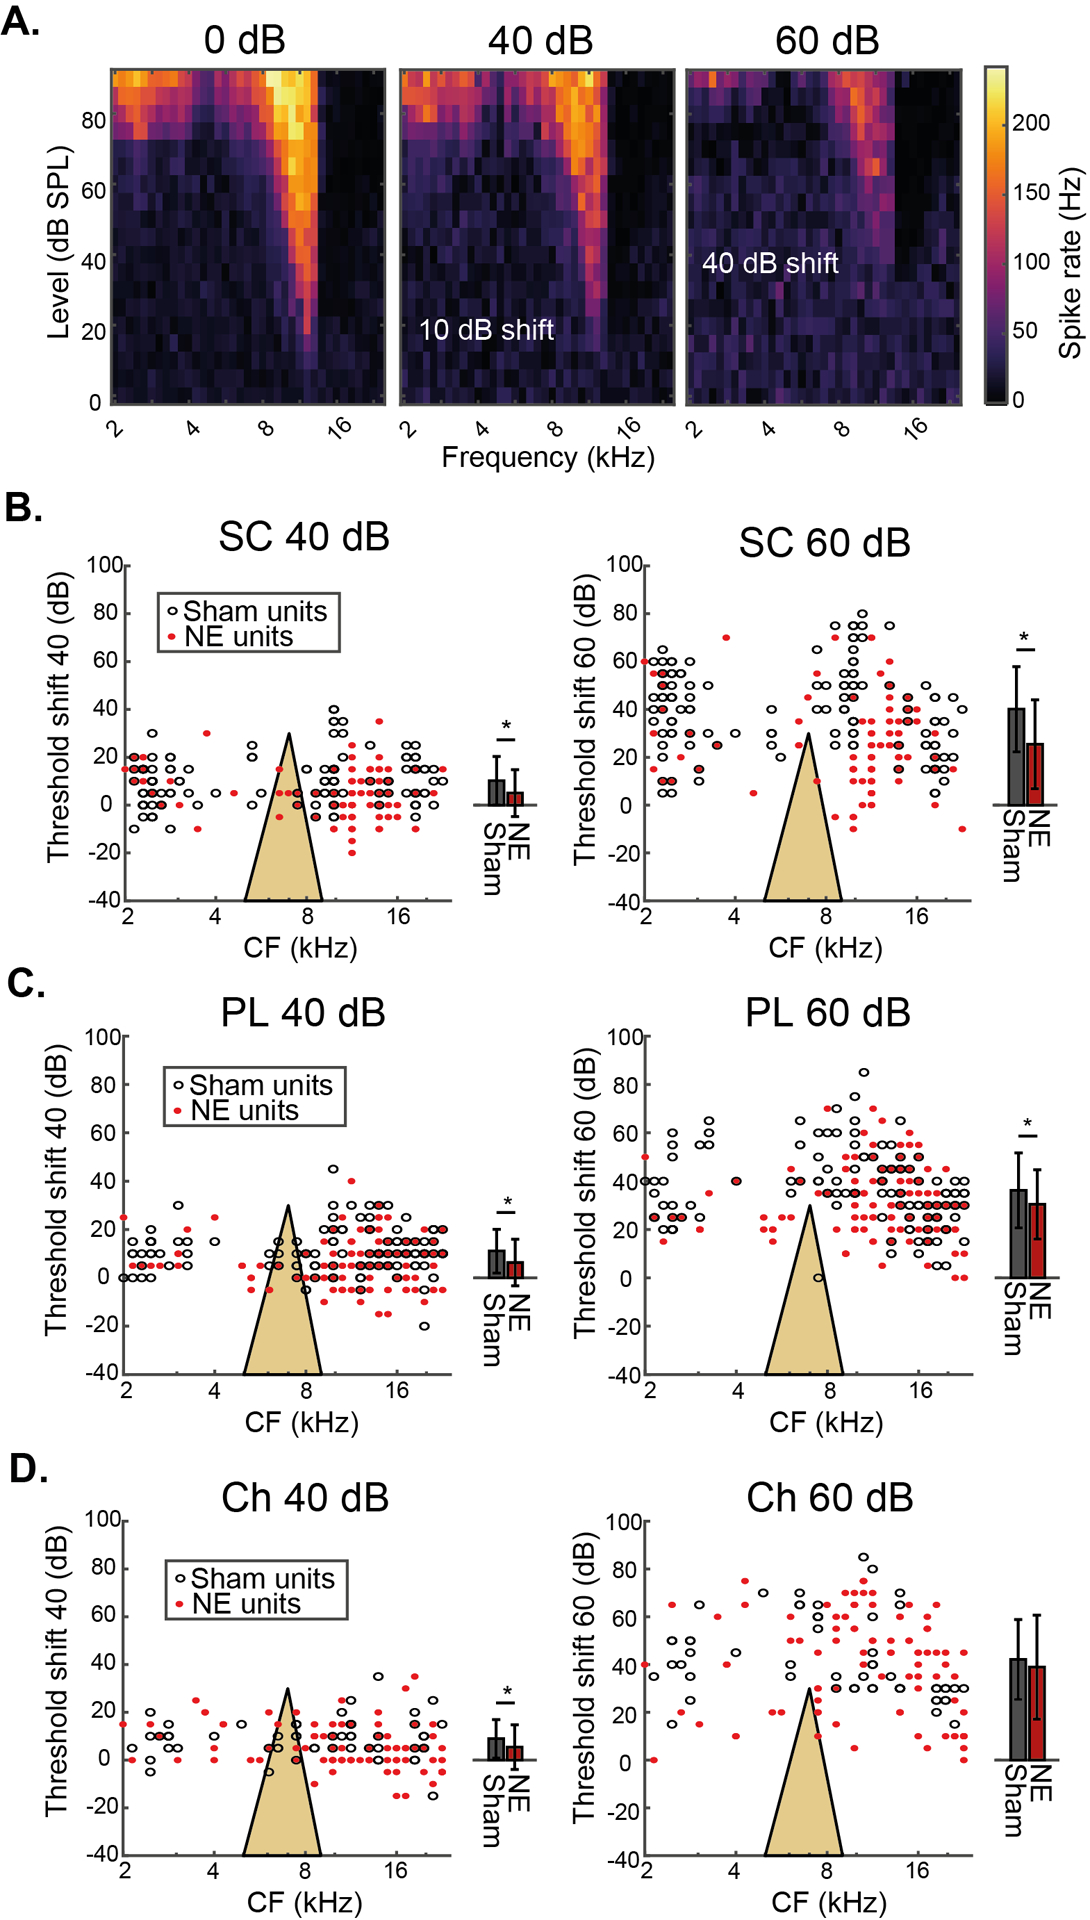
A) Example change in RF for a SC from a noise-exposed animal in the presence of 40- and 60-dB SPL background noise. B) Single-unit TIN threshold shifts for 40- and 60-dB SPL background noise for SCs from sham and noise-exposed animals. Both individual units (black and red dots), and mean data (± SD, black and red bars) are presented with the same y-axis. C) Single-unit TIN threshold shifts at 40- and 60-dB SPL for PL neurons from sham and noise-exposed animals. D) Single-unit TIN threshold shifts at 40 - and 60-dB SPL for Ch neurons from sham and noise-exposed animals. Yellow triangles represent the noise exposure spectrum.
TIN threshold shifts for SC, PL and Ch cells are presented in Fig 4B–D, greater TIN threshold shift indicating more impairment of tone perception by the noise. Unpaired t-tests revealed that SCs from noise exposed animals had significantly lower TIN threshold shifts in both background sound levels, compared to SCs from sham animals (n = 101 NE, 125 sham; p < 0.001; Fig 4B). PL cells from noise exposed animals also had significantly lower TIN threshold shift than those from sham animals in both 40- and 60-dB SPL background sound levels (n = 90 NE, 102 sham; p = 0.007 & 0.016; Fig 4C) but Ch neurons from noise exposed animals had significantly lower TIN threshold shift only in 40, but not 60 dB SPL background sound levels when compared to sham animals (n = 95 NE, 58 sham; p<0.001 & p=0.525; Fig 4D). For SCs, this effect was CF specific, with the greatest difference between normal and synaptopathic animals occurring at CFs above the noise exposure spectrum (Fig 4B), where cochlear synaptopathy is most prevalent (Fig 1B and C). In summary, TIN thresholds of single CN neurons are not increased by synaptopathy, signifying no impairment of TIN coding in animals with synaptopathy. Single CN neurons in animals with synaptopathy rather show reduced TIN threshold shifts.
To confirm the absence of TIN threshold elevations in noise exposed animals, we used single unit thresholds to estimate an audiogram for each animal. The outline of the excitatory RF area for every neuron was used to calculate the lowest tone intensity predicted to evoke activity in the CN (Fig 5A). Estimate audiograms are therefore built using on-CF and off-CF thresholds, allowing assessment of whether off-CF coding may account of the lack of effect observed in the on-CF threshold shift data. We then analysed how the estimated audiometric threshold was shifted in the presence of background noise (Fig 5B). The estimated audiometric TIN threshold shifts reveal limited differences between sham- and noise-exposed animals (n=4 for each group), with a significant difference only at 6.5 kHz for the 40 dB SPL background sound condition, where the shaded 95% confidence interval area does not overlap (Fig 5C). These data are consistent with minimal TIN threshold shifts in the synaptopathy animals, by demonstrating that off-CF coding of TIN does not account for the lack of effect observed in fig 4.
Fig 5: Determining tone-in-noise threshold shifts with estimated audiograms.
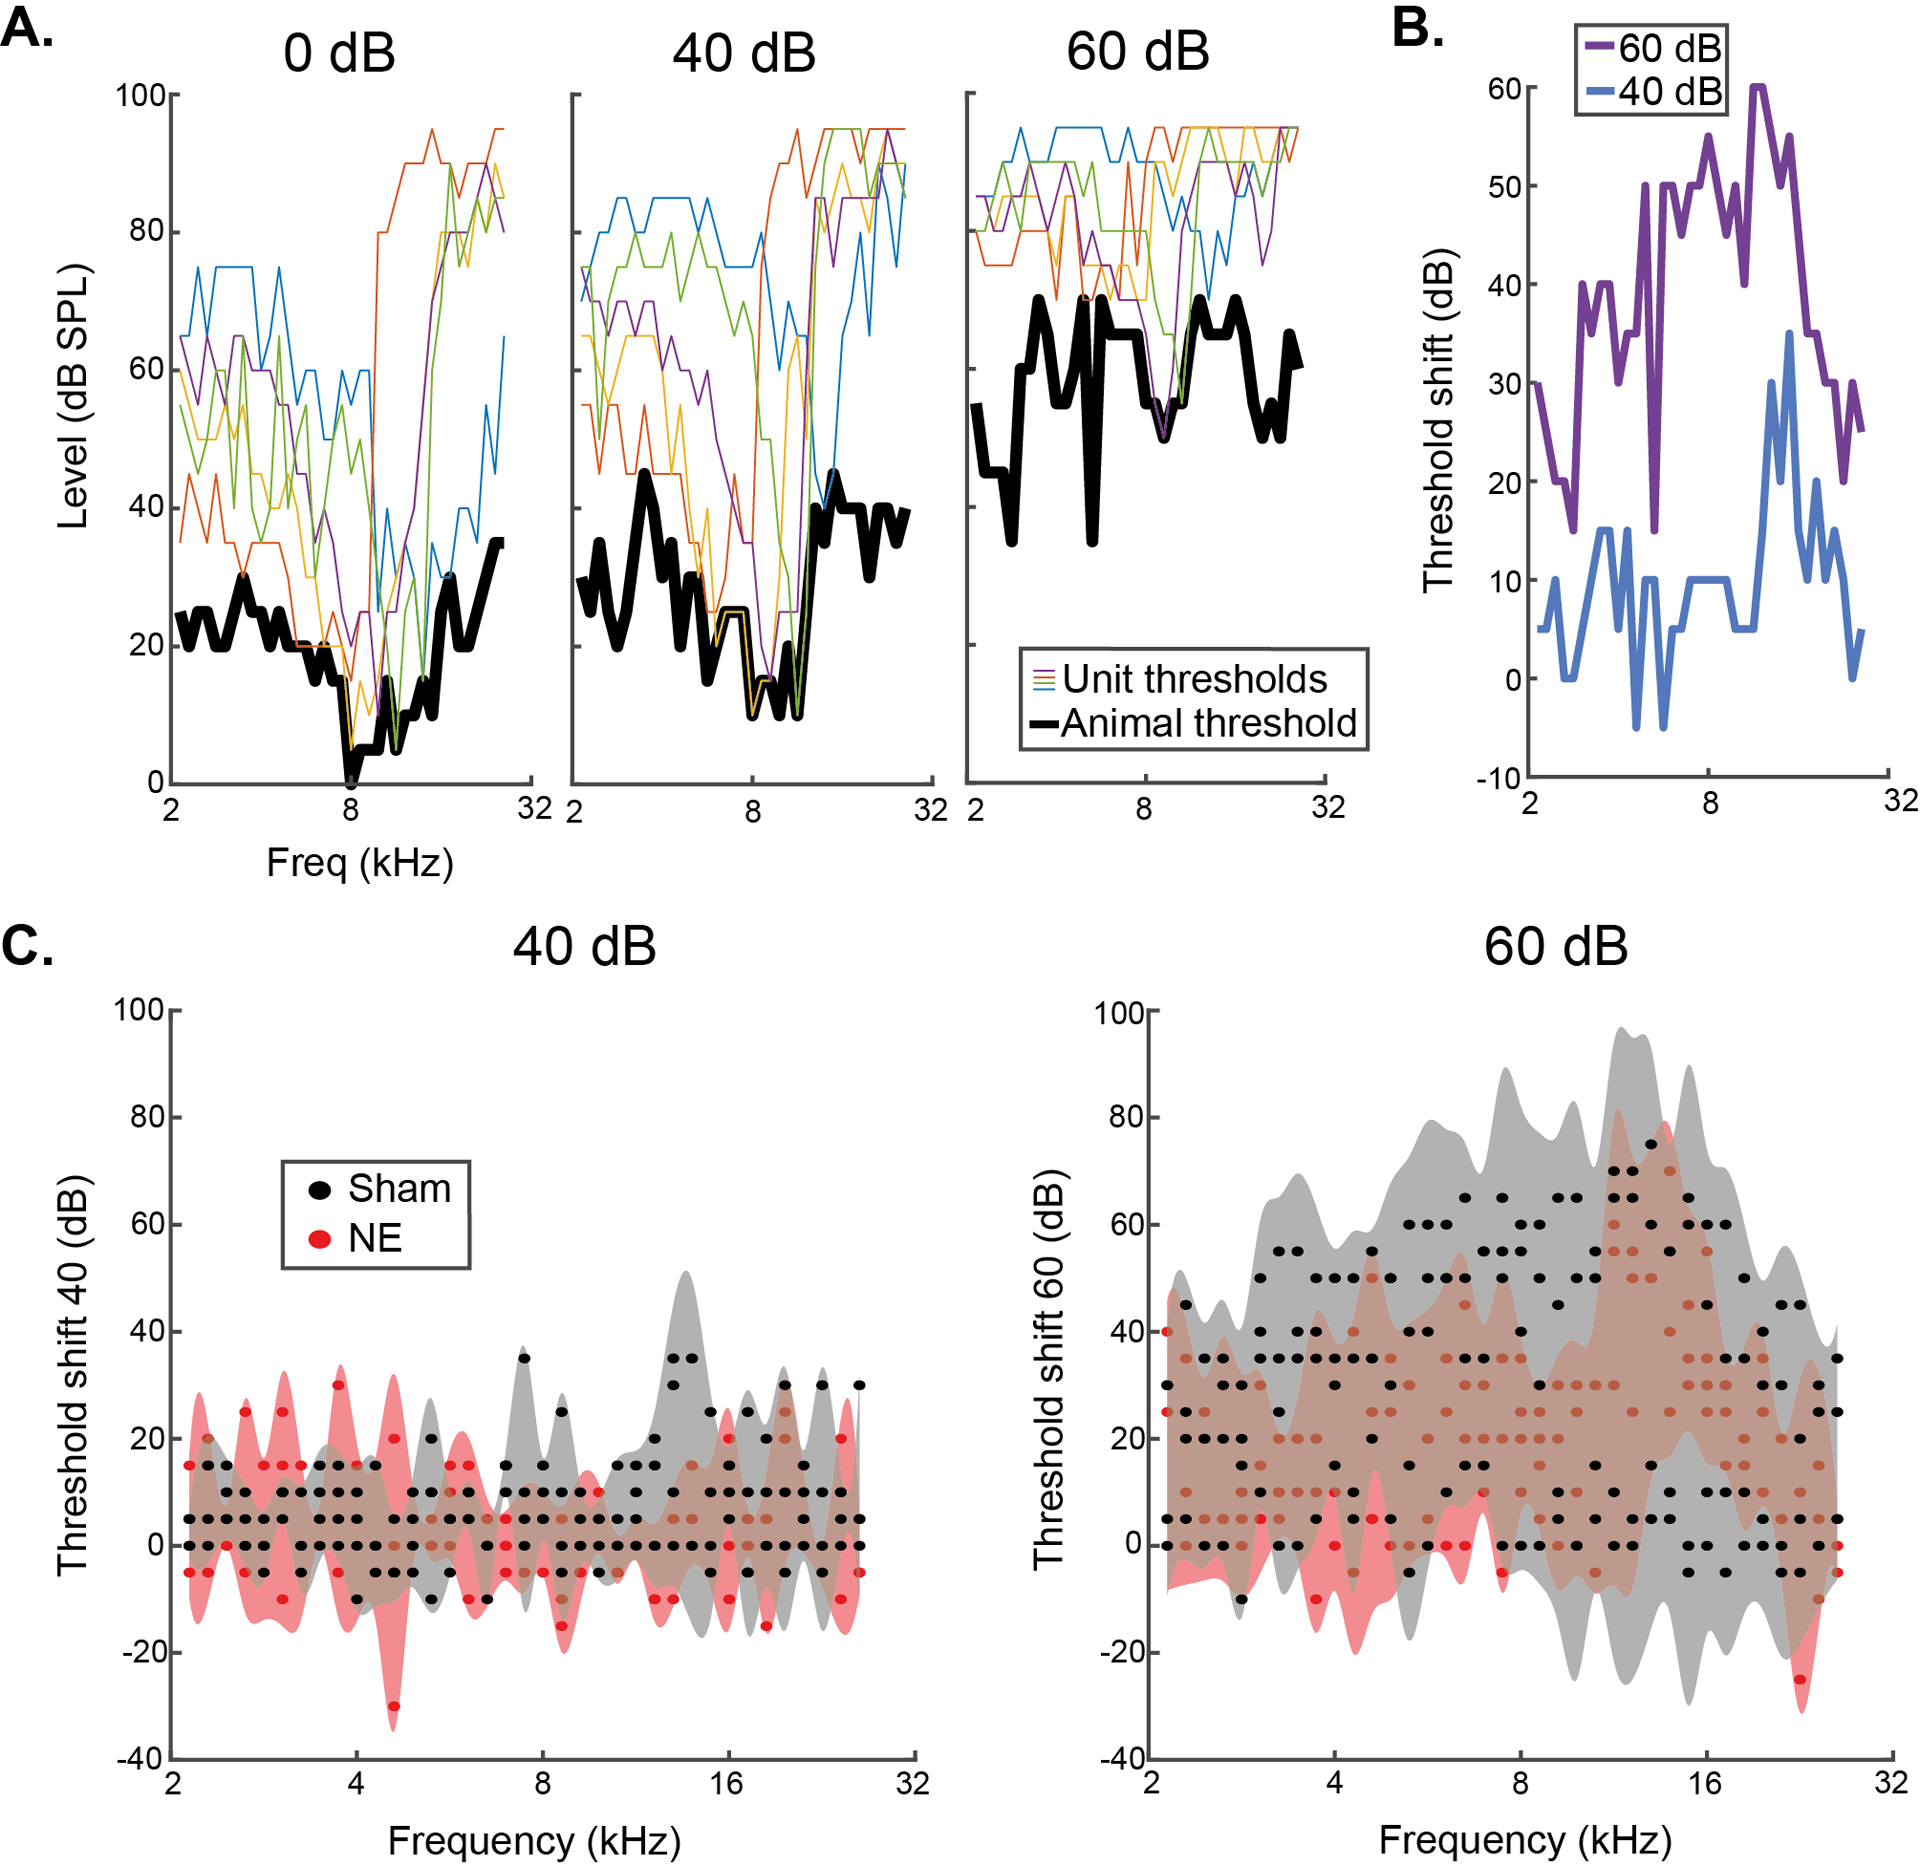
A) Example animal using individual unit thresholds (coloured lines; 5/143 units shown for this animal) to estimate the audiometric threshold of animals for TIN stimuli (black). The ABR thresholds of this animal at 8, 12, 16 and 20 kHz were 10-, 5-, 15- and 15-dB SPL, respectively. B) Estimated audiometric threshold shift for this example animal at 40- and 60-dB SPL background noise. C) Threshold shift of estimated audiometric thresholds in noise for the 4 sham and noise-exposed animals. TIN threshold shifts are equivalent between groups. Shaded area = 95 % CI.
Synaptopathy induced by noise exposure was not entirely consistent across animals, so while there are no group differences in TIN thresholds between the noise- and sham-exposed groups, we probed the hypothesis that those with more synaptopathy would show impaired TIN thresholds. Fig 6 shows correlations between synapse counts and their mean single-unit TIN thresholds. Synapse counts were calculated as the mean number of synapses per IHC across the three cochlear frequencies evaluated (12, 16 & 20 kHz). No cell type had a significant correlation for any condition, solidifying the conclusion that TIN thresholds are not impaired by cochlear synaptopathy. Fig 7 shows correlations between synapse counts and their mean single-unit TIN threshold shifts. This analysis showed no significant correlations with cochlear synaptopathy.
Fig 6: Single unit thresholds and tone-in-noise thresholds do not correlate with synaptopathy.
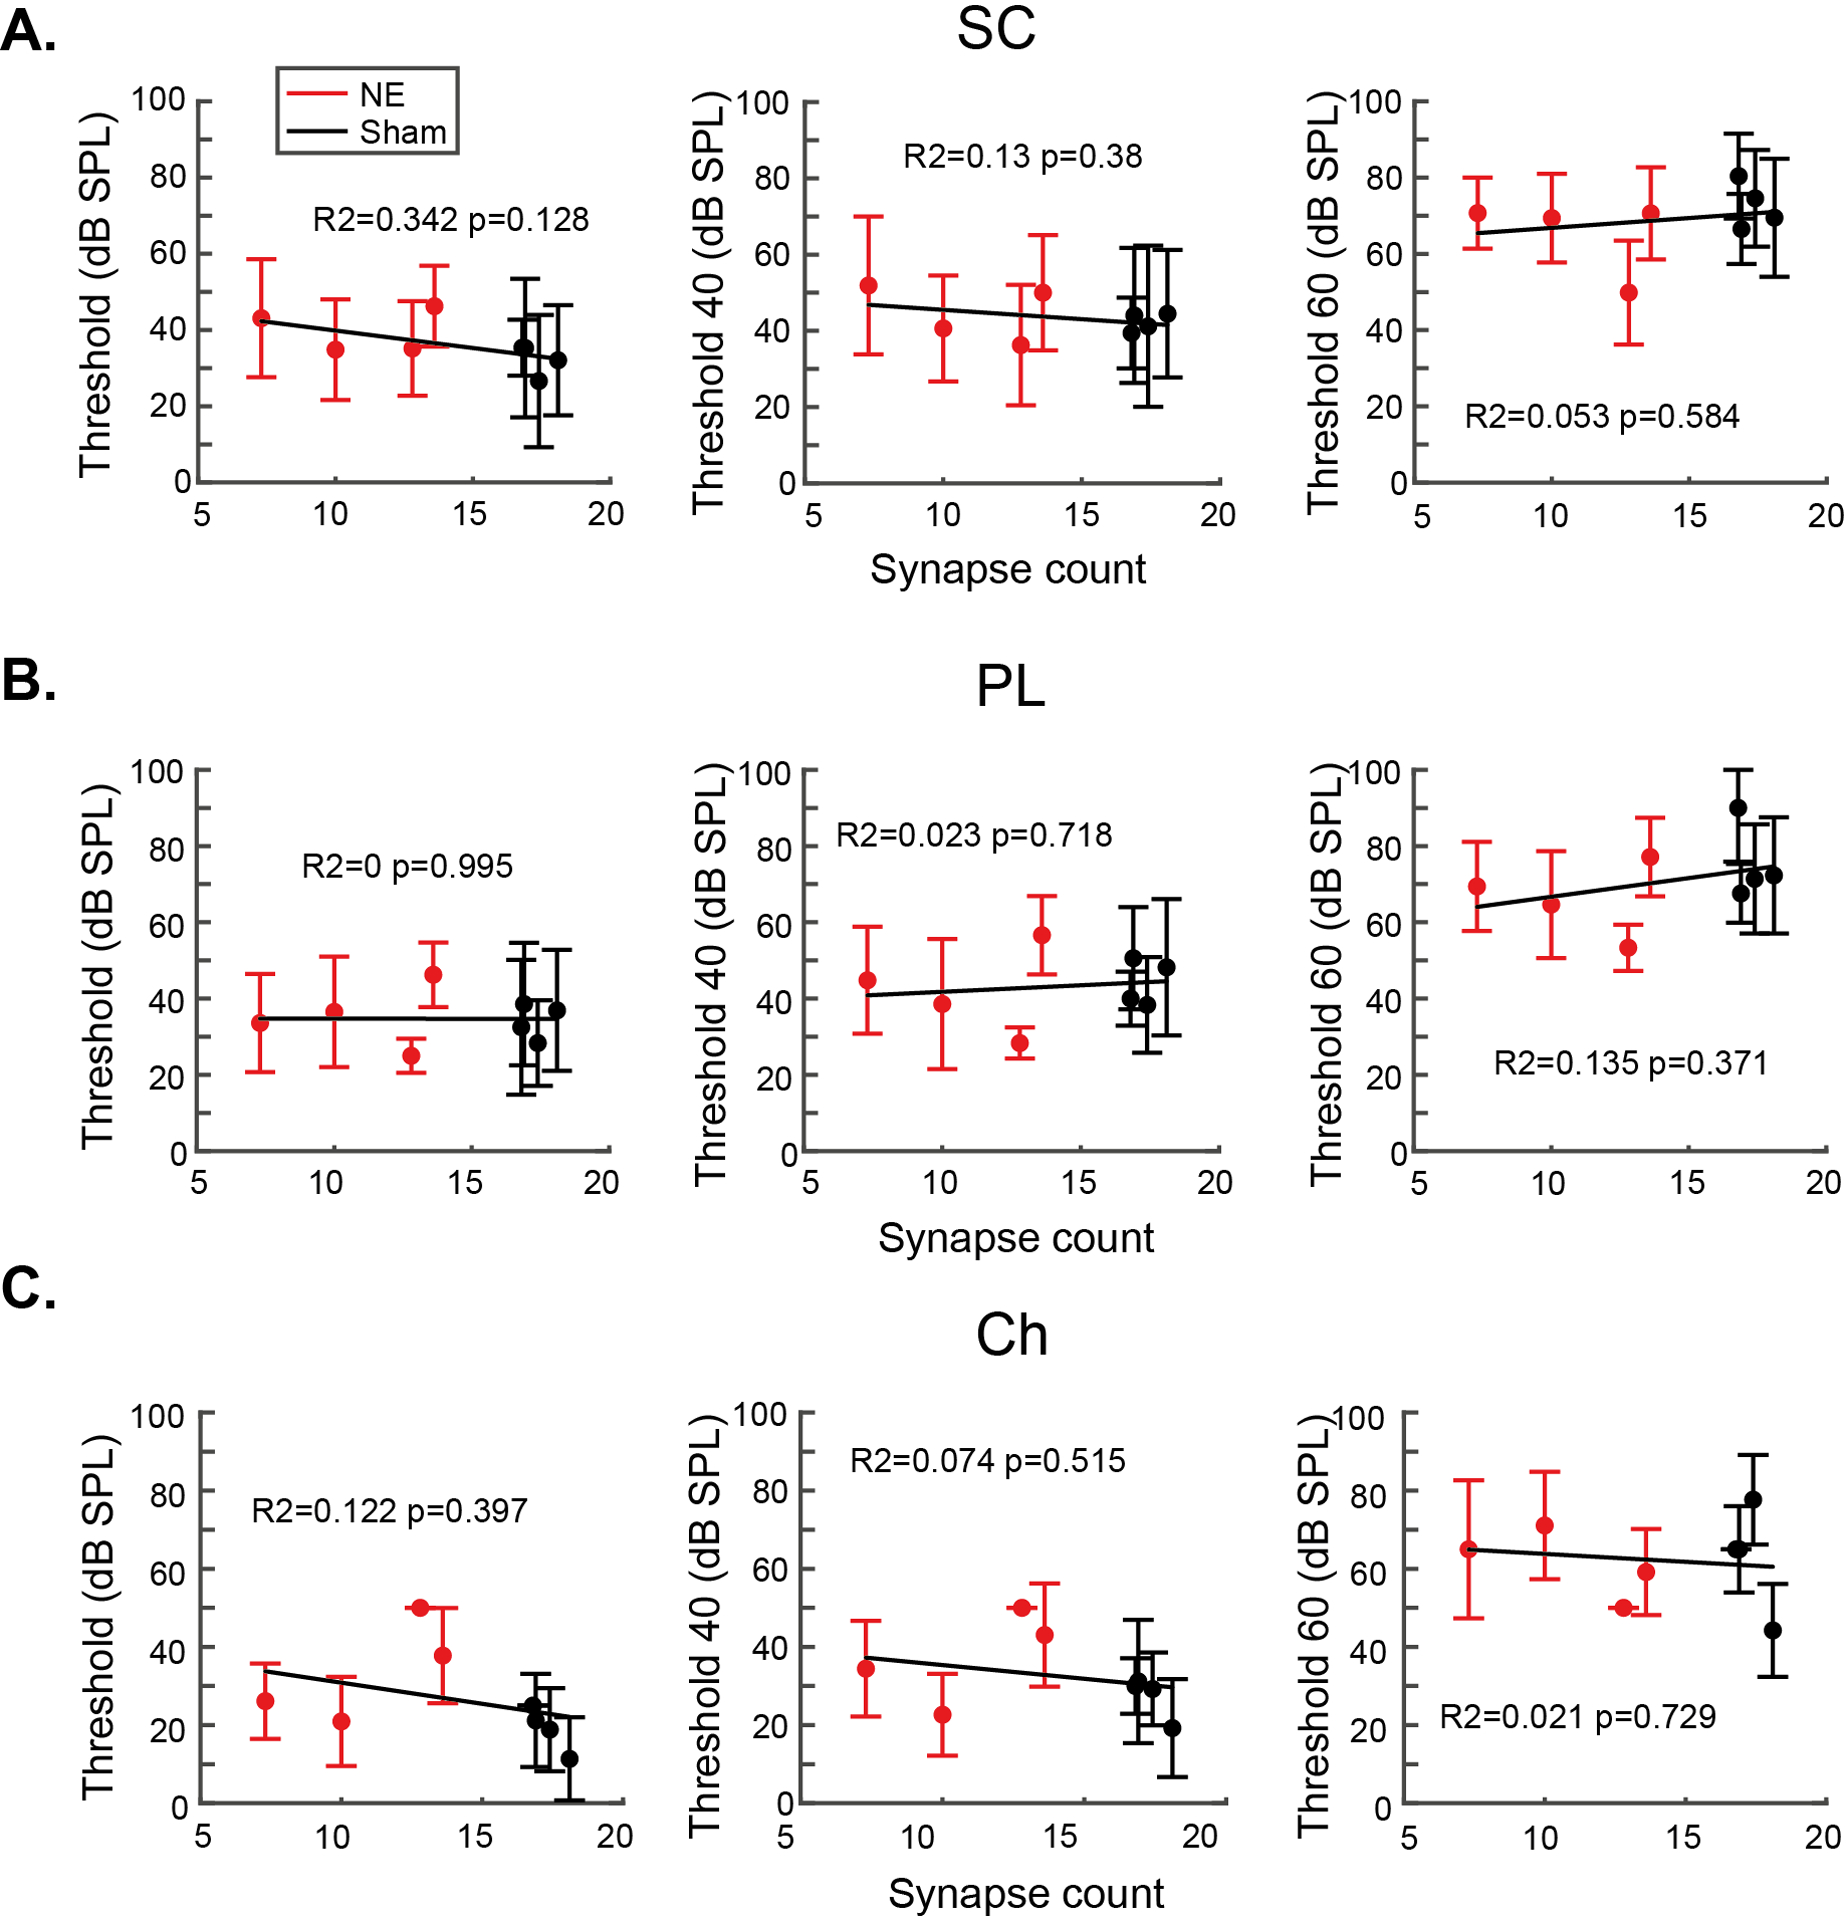
A) Thresholds for SCs in the presence of 0-, 40- or 60-dB SPL background noise. B) Thresholds for PL neurons in the presence of 0-, 40- or 60-dB SPL background noise. C) Thresholds for Ch neurons in the presence of 0-, 40- or 60-dB SPL background noise. Error bars indicate SD. No significant correlations were found between cochlear synaptopathy and any threshold or ton-in-noise threshold.
Fig 7: Threshold shifts of cochlear nucleus neurons in the presence of 40 or 60 dB background sound.
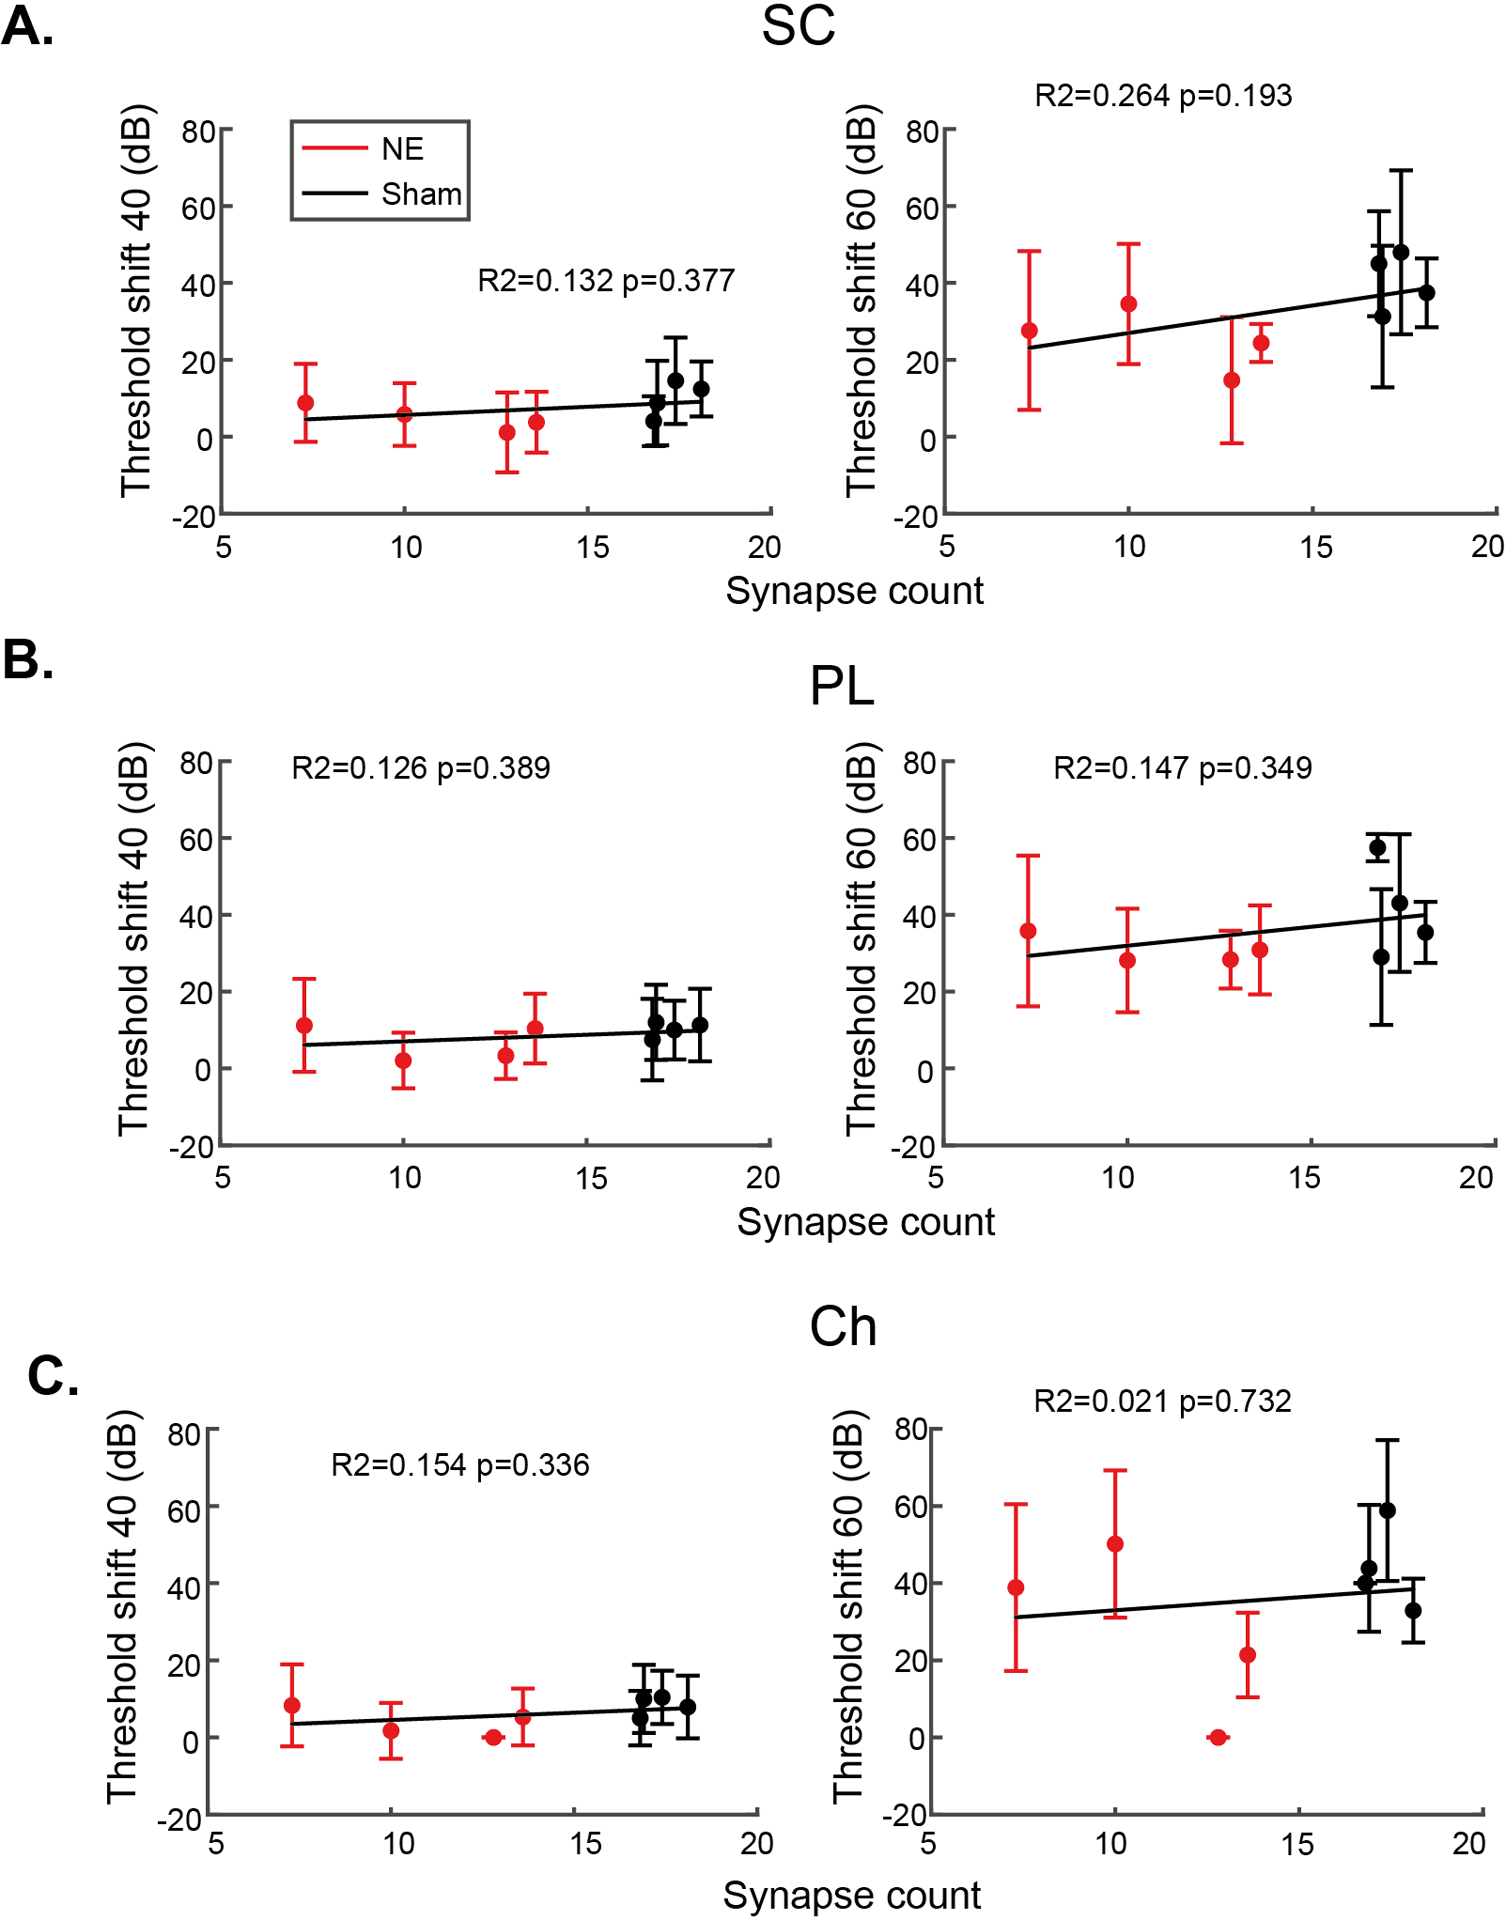
For small cells (A), primary-like neurons (B) and chopper neurons (C), no significant correlations were found between cochlear synaptopathy and threshold shift in background noise. Error bars indicate SD.
Cochlear Nucleus Small Cell Subtypes
Earlier studies of CN SCs have relied on single-channel recordings, resulting in low numbers of units (Ghoshal & Kim, 1996, 1997). The large number of SCs recorded in this study with multichannel electrodes gave us the opportunity to test the hypothesis that there may be physiologically heterogenous groups of SCs (Fig 8). RLF PCAs were calculated, and k-means clustered using the city block distance metric and repeated for 2 – 10 clusters. The greatest silhouette score of 0.5161 for 2 clusters revealed two subtypes of SCs, for which the PC1 metric was binomially distributed, confirming the existence of discrete clusters. SC subtype 1 (SC1) was characterised by lower firing rates at high tone intensities, and higher steady state firing rates compared to onset firing rates. SC subtype 2 (SC2) had greater evoked firing rates and unusual onset peaks, with one delayed onset peak at ~15 ms. SC1 showed a significant correlation between cochlear synapse counts and threshold shifts in 60 dB SPL noise, suggesting that subtype SC1 is responsible for the trend observed in Figs 6 & 7. Neither subtype showed a significant correlations between synapse counts and suprathreshold TIN impairments, suggesting that both cell types contribute to the correlation found in Fig 3.
Fig 8: Potential small cell subtypes are both affected by synaptopathy.
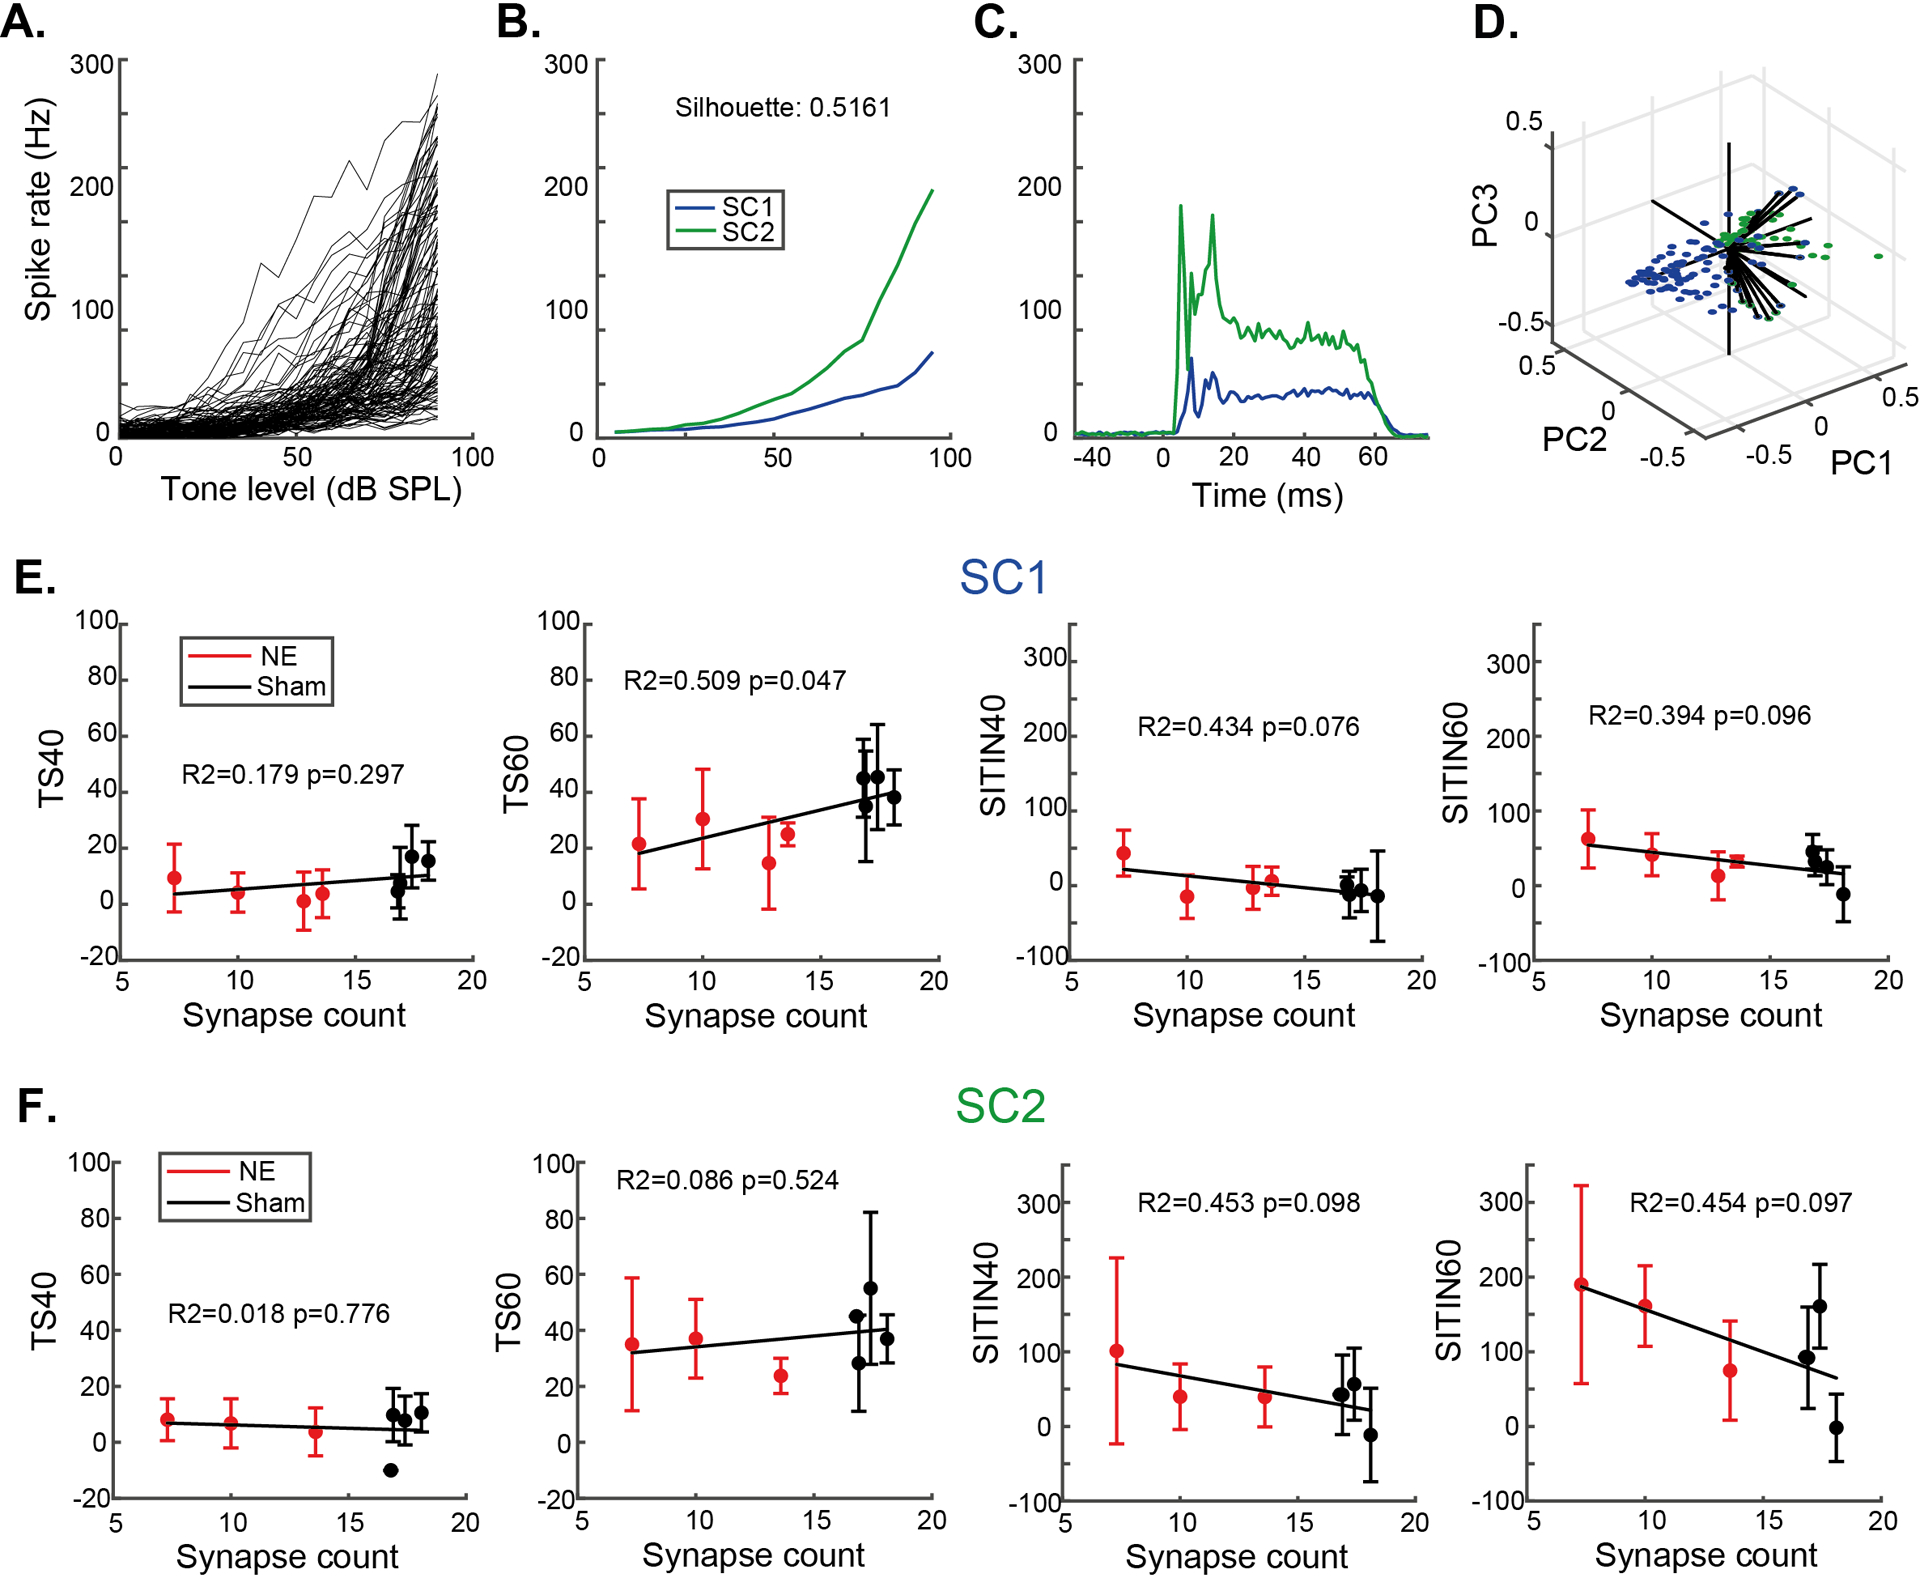
A-D) Based on RLF shape, SCs were categorised into two subtypes using PCA clustering (SC1 & SC2) with different mean RLFs and PSTHs (B and C). E and F) Subtypes SC1 and SC2, despite their differences in activity patterns, neither show significant correlations between SITIN and synaptopathy. SC1 showed a correlation between synaptopathy and threshold shift, suggesting SC1s are the drivers of the trend for SCs observed in Fig 3. Error bars indicate SD.
DISCUSSION
The data presented here represent the first study on the effects of cochlear synaptopathy on sound coding by cells in the CN. Since inner hair cell synapse loss cannot currently be quantified in humans, recordings from the guinea pig CN with induced cochlear synaptopathy were used to determine whether synaptopathy affected sound-evoked thresholds and suprathreshold central responses with and without background noise. We found that TIN detection thresholds are not affected by cochlear synaptopathy. However, suprathreshold TIN coding was impaired in animals with cochlear synaptopathy. The impairments discovered here deepen our understanding of central changes following damage to the auditory periphery and have implications for development of future tests for cochlear synaptopathy in humans.
The noise-exposure model used here produced cochlear synaptopathy with minimal auditory threshold shift at the noise exposure frequency (Fig 1), however, whether this would translate to an increased behavioural detection threshold is unknown. Comparisons of ABR thresholds and behavioural detection thresholds have generated variable results, with initial studies showing good correlations between the two measures in noise- and kanamycin-exposed animals (Borg & Engstrom, 1983). However, other studies have shown more variable results, especially for the tone-evoked ABR’s as used in this study (Heffner et al., 2008). A more recent study using ouabain-induced cochlear neural degeneration has demonstrated a 30 dB ABR threshold shift with no change to behavioural tone detection thresholds (Resnik & Polley, 2021). Therefore, we do not see the mild permanent threshold shift as a confounding factor in this study, as behavioural detection thresholds are likely not increased. Cochlear-synapse recovery in the guinea pig after synaptopathic noise exposure is well documented (Hickman et al., 2021; Shi et al., 2013; Zhang et al., 2020), so the noise exposure was carefully titrated to ensure synaptopathy was maintained for at least 4 weeks. The use of anaesthesia during noise exposure affects the damage induced, which may have contributed to the need for a lower exposure level in the present study when compared to other studies of cochlear synaptopathy in guinea pig (Hickman et al., 2021; Shi et al., 2013; Zhang et al., 2020). These studies have each used different sound levels, frequency spectra and methods for determining hearing thresholds, so direct comparisons are not straightforward. Initial attempts to titrate our sound exposure level used a lower exposure intensity of 99 dB SPL that resulted in a synapse loss that recovered between 2- and 4-weeks post-exposure, alongside a full recovery of ABR wave 1 amplitudes to baseline levels (data not shown). Increasing the levels enabled us to induce synaptopathy that lasted at least 4 weeks, but we were unable to easily produce a permanent synaptopathy combined with no permanent ABR threshold shift.Noise exposure produces cochlear synaptopathy that preferentially targets the low SR/high threshold ANFs, which is expected to produce difficulty encoding suprathreshold sounds (Furman et al., 2013). Suprathreshold TIN coding in ANFs occurs to a greater extent in the low-SR fibers due to flattened RLFs and reduced dynamic ranges in the low threshold, high-SR fibers (Costalupes et al., 1984; Young & Barta, 1986). The spike-rate code has been shown to be the driving factor for TIN detection in high frequency ANFs (>2.7kHz), whereas low frequency TIN coding uses a temporal code (Huet et al., 2018). For the present study, it is likely that the rate-based intensity code is preserved, as almost all recorded neurons were within the high frequency region used by a previous study (Huet et al.,2018).
Impairment of suprathreshold sound encoding by cochlear synaptopathy has been assumed to be amplified by central synapse changes following peripheral damage, as has been observed following age-related hearing loss (Wang et al., 2021). However, our data showed no changes to mean RLFs, an unexpected result indicating no impairment of suprathreshold tone coding in the CN. This challenges the hypothesis that reduced input during sound stimulation results in lower spike rates in the VCN. Various homeostatic plasticity mechanisms in the VCN & SCC, including olivocochlear contributions (Hockley et al., 2022) could be responsible maintaining the firing rates observed in the current study (Gröschel et al., 2014; Hockley et al., 2020; Poveda et al., 2020; Vogler et al., 2011). An alternative mechanism is local stress peptide signaling. Pagella et al. (2021) showed that small cells express CRFR2, a Urocortin 3 (UCN3) receptor, which can be produced by bushy and stellate cells. However, the contribution of this peptide on small cell activity or auditory signal processing is currently unknown.
CN SCs showed the greatest impairment of suprathreshold TIN coding. SCs receive exclusive input from the low and medium SR ANFs, which are preferentially affected by cochlear synaptopathy (Liberman, 1991; Ryugo, 2008). As a result of combined low-SR ANF and olivocochlear collateral inputs, SCs have superior intensity coding capabilities compared to other CN cell types (Hockley et al., 2022). Therefore, impairment of suprathreshold coding of TIN in SCs may be due to changes in low-SR ANFs input targeted to SCs, or changes to olivocochlear system changes following noise exposure.
SCs project directly to the auditory thalamus, a pathway for short-latency relay of sound intensity information to the auditory cortex, bypassing the IC (Malmierca et al., 2002; Schofield, Mellott, et al., 2014; Schofield, Motts, et al., 2014). Thus, because the suprathreshold impairments observed here are maximal in SCs they are likely to have a rapid perceptual effect.
Suprathreshold TIN responses are reduced in the cochlear nucleus following synaptopathy. This is counter to results observed in the inferior colliculus (IC), where increased responses to quiet speech-in-noise are observed (Monaghan et al., 2020). Interestingly, this increased activity only occurs at quiet speech levels, in contrast to the present data where we see greater reductions to tone-in-noise spike rates at higher tone intensities. Together, these results imply that mechanisms producing increased responses to quiet in noise within the IC occur independently to the effects seen in the VCN and SCC, either in the IC or in other areas that project directly to the IC such as the DCN. That opposite results are seen in the IC and cochlear nucleus small cells (which bypass the IC) suggests two potential mechanisms for suprathreshold impairment following synaptopathy. Either impairment of small cell suprathreshold responses or impairment of central gain mechanisms in the DCN/IC pathway could produce perceptual deficits. It is also possible that the levels used in the current study were not sufficiently high to produce the observed effects in the psychophysical studies.
The data presented here provide clues for identifying cochlear synaptopathy in humans. While a previous study has shown impaired TIN thresholds in aged humans, the effect was greater at lower background sound intensities (Ralli et al., 2019). We have shown that TIN thresholds in CN are not altered with synaptopathy, but rather suprathreshold coding of TIN is affected, suggesting that clinical testing of TIN thresholds is not likely to detect cochlear synaptopathy. Thresholds are instead encoded by the high-SR ANFs which are not as affected by synaptopathy. Assessing the perceived loudness of suprathreshold TIN stimuli would be more likely to identify synaptopathy in human patients.
Supplementary Material
KEY POINTS.
Recording from multiple central auditory neurons can determine any tone-in-noise deficits in animals with quantified cochlear synapse damage.
Using this technique, we found that tone-in-noise thresholds are not altered by cochlear synaptopathy, whereas coding of suprathreshold tones-in-noise is disrupted.
Suprathreshold deficits occur in small cells and primary-like neurons of the cochlear nucleus.
These data provide important insights into the mechanisms underlying difficulties associated with hearing in noisy environments.
Conflict of Interest Statement:
The authors declare that the research was conducted in the absence of any commercial or financial relationships that could be construed as a potential conflict of interest. GC is a scientific founder of Decibel therapeutics, has equity interest in the company and has received compensation for consulting. The company was not involved in this study. SES is co-founder and CSO of Auricle Inc, which was not involved in this study.
Acknowledgements:
This study was supported by National Institutes of Health grant R01-DC017119 (SES) and the Royal National Institute for Deaf People. The authors would like to thank Aditi S. Desai for her contribution to processing the cochlear samples.
Biography

Data Availability Statement:
Data are available as supporting information, MATLAB scripts are available from the authors on request.
REFERENCES
- Borg E, & Engstrom B (1983). Hearing thresholds in the rabbit: A behavioral and electrophysiological study. Acta Oto-Laryngologica, 95(1–4), 19–26. 10.3109/00016488309130911 [DOI] [PubMed] [Google Scholar]
- Costalupes JA, Young ED, & Gibson DJ (1984). Effects of continuous noise backgrounds on rate response of auditory nerve fibers in cat. Journal of Neurophysiology, 51(6), 1326–1344. 10.1152/jn.1984.51.6.1326 [DOI] [PubMed] [Google Scholar]
- Couth S, Prendergast G, Guest H, Munro KJ, Moore DR, Plack CJ, Ginsborg J, & Dawes P (2020). Investigating the effects of noise exposure on self-report, behavioral and electrophysiological indices of hearing damage in musicians with normal audiometric thresholds. Hearing Research, 108021. 10.1016/j.heares.2020.108021 [DOI] [PubMed] [Google Scholar]
- Furman AC, Kujawa SG, & Liberman MC (2013). Noise-induced cochlear neuropathy is selective for fibers with low spontaneous rates. Journal of Neurophysiology, 110(3), 577–586. [DOI] [PMC free article] [PubMed] [Google Scholar]
- Ghoshal S, & Kim DO (1996). Marginal shell of the anteroventral cochlear nucleus: intensity coding in single units of the unanesthetized, decerebrate cat. Neuroscience Letters, 205, 71–74. [DOI] [PubMed] [Google Scholar]
- Ghoshal S, & Kim DO (1997). Marginal Shell of the Anteroventral Cochlear Nucleus: Single-Unit Response Properties in the Unanesthetized Decerebrate Cat. J Neurophysiol, 77(4), 2083–2097. [DOI] [PubMed] [Google Scholar]
- Gröschel M, Ryll J, Gotze R, Ernst A, & Basta D (2014). Acute and long-term effects of noise exposure on the neuronal spontaneous activity in cochlear nucleus and inferior colliculus brain slices. BioMed Research International, 2014, 909260. 10.1155/2014/909260 [DOI] [PMC free article] [PubMed] [Google Scholar]
- Guest H, Munro KJ, Prendergast G, Millman RE, & Plack CJ (2018). Impaired speech perception in noise with a normal audiogram: No evidence for cochlear synaptopathy and no relation to lifetime noise exposure. Hearing Research, 364, 142–151. 10.1016/j.heares.2018.03.008 [DOI] [PMC free article] [PubMed] [Google Scholar]
- Heffner HE, Koay G, & Heffner RS (2008). Comparison of behavioral and auditory brainstem response measures of threshold shift in rats exposed to loud sound. The Journal of the Acoustical Society of America, 124(2), 1093–1104. 10.1121/1.2949518 [DOI] [PMC free article] [PubMed] [Google Scholar]
- Henry KS, & Abrams KS (2021). Normal tone-in-noise sensitivity in trained budgerigars despite substantial auditory-nerve injury: No evidence of hidden hearing loss. Journal of Neuroscience, 41(1), 118–129. 10.1523/JNEUROSCI.2104-20.2020 [DOI] [PMC free article] [PubMed] [Google Scholar]
- Hickman TT, Hashimoto K, Liberman LD, & Liberman MC (2021). Cochlear Synaptic Degeneration and Regeneration After Noise: Effects of Age and Neuronal Subgroup. Frontiers in Cellular Neuroscience, 15(August). 10.3389/fncel.2021.684706 [DOI] [PMC free article] [PubMed] [Google Scholar]
- Hockley A, Berger JI, Smith PA, Palmer AR, & Wallace MN (2020). Nitric oxide regulates the firing rate of neuronal subtypes in the guinea pig ventral cochlear nucleus. European Journal of Neuroscience, August, 1–21. 10.1111/ejn.14572 [DOI] [PMC free article] [PubMed] [Google Scholar]
- Hockley A, Wu C, & Shore SE (2022). Olivocochlear projections contribute to superior intensity coding in cochlear nucleus small cells. The Journal of Physiology, 600(1), 61–73. 10.1113/jp282262 [DOI] [PMC free article] [PubMed] [Google Scholar]
- Huet A, Desmadryl G, Justal T, Nouvian R, Puel J-L, & Bourien J (2018). The Interplay Between Spike-Time and Spike-Rate Modes in the Auditory Nerve Encodes Tone-In-Noise Threshold. The Journal of Neuroscience, 38(25), 5727–5738. 10.1523/JNEUROSCI.3103-17.2018 [DOI] [PMC free article] [PubMed] [Google Scholar]
- Liberman MC (1991). Central projections of auditory‐nerve fibers of differing spontaneous rate. I. Anteroventral cochlear nucleus. Journal of Comparative Neurology, 313(2), 240–258. [DOI] [PubMed] [Google Scholar]
- Lobarinas E, Spankovich C, & Le Prell CG (2017). Evidence of “hidden hearing loss” following noise exposures that produce robust TTS and ABR wave-I amplitude reductions. Hearing Research, 349, 155–163. 10.1016/J.HEARES.2016.12.009 [DOI] [PubMed] [Google Scholar]
- Makary CA, Shin J, Kujawa SG, Liberman MC, & Merchant SN (2011). Age-related primary cochlear neuronal degeneration in human temporal bones. JARO - Journal of the Association for Research in Otolaryngology, 12(6), 711–717. 10.1007/s10162-011-0283-2 [DOI] [PMC free article] [PubMed] [Google Scholar]
- Malmierca MS, Merchán MA, Henkel CK, & Oliver DL (2002). Direct projections from cochlear nuclear complex to auditory thalamus in the rat. Journal of Neuroscience, 22(24), 10891–10897. 10.1523/jneurosci.22-24-10891.2002 [DOI] [PMC free article] [PubMed] [Google Scholar]
- Monaghan JJM, Garcia-Lazaro JA, McAlpine D, & Schaette R (2020). Hidden Hearing Loss Impacts the Neural Representation of Speech in Background Noise. Current Biology, 1–12. 10.1016/j.cub.2020.09.046 [DOI] [PMC free article] [PubMed] [Google Scholar]
- Pagella S, Deussing JM & Kopp-Scheinpflug C (2021) Expression Patterns of the Neuropeptide Urocortin 3 and Its Receptor CRFR2 in the Mouse Central Auditory System, Frontiers in Neural Circuits, 15(November), pp. 1–16. doi: 10.3389/fncir.2021.747472. [DOI] [PMC free article] [PubMed] [Google Scholar]
- Palmer AR (1987). Physiology of the cochlear nerve and cochlear nucleus. Br Med Bull, 43(4), 838–855. [DOI] [PubMed] [Google Scholar]
- Parthasarathy A, & Kujawa SG (2018). Neurobiology of Disease Synaptopathy in the Aging Cochlea: Characterizing Early-Neural Deficits in Auditory Temporal Envelope Processing. Journal of Neuroscience, 38(32), 7108–7119. 10.1523/JNEUROSCI.3240-17.2018 [DOI] [PMC free article] [PubMed] [Google Scholar]
- Pichora-Fuller MK, & Souza PE (2003). Effects of aging on auditory processing of speech. International Journal of Audiology, 42(SUPPL. 2). 10.3109/14992020309074638 [DOI] [PubMed] [Google Scholar]
- Poveda C, Valero M, Pernia M, Alvarado J, Ryugo D, Merchan M, & Juiz J (2020). Expression and Localization of Kv1.1 and Kv3.1b Potassium Channels in the Cochlear Nucleus and Inferior Colliculus after Long-Term Auditory Deafferentation. Brain Sciences, 10(1), 35. 10.3390/brainsci10010035 [DOI] [PMC free article] [PubMed] [Google Scholar]
- Rajan R, & Cainer KE (2008). Ageing without hearing loss or cognitive impairment causes a decrease in speech intelligibility only in informational maskers. Neuroscience, 154(2), 784–795. 10.1016/j.neuroscience.2008.03.067 [DOI] [PubMed] [Google Scholar]
- Ralli M, Greco A, De Vincentiis M, Sheppard A, Cappelli G, Neri I, & Salvi R (2019). Tone-in-noise detection deficits in elderly patients with clinically normal hearing. American Journal of Otolaryngology - Head and Neck Medicine and Surgery, 40(1), 1–9. 10.1016/j.amjoto.2018.09.012 [DOI] [PMC free article] [PubMed] [Google Scholar]
- Resnik J, & Polley DB (2021). Cochlear neural degeneration disrupts hearing in background noise by increasing auditory cortex internal noise. Neuron, 109(6), 984–996.e4. 10.1016/j.neuron.2021.01.015 [DOI] [PMC free article] [PubMed] [Google Scholar]
- Robert Frisina D, & Frisina RD (1997). Speech recognition in noise and presbycusis: Relations to possible neural mechanisms. Hearing Research, 106(1–2), 95–104. 10.1016/S0378-5955(97)00006-3 [DOI] [PubMed] [Google Scholar]
- Ryugo DK (2008). Projections of low spontaneous rate, high threshold auditory nerve fibers to the small cell cap of the cochlear nucleus in cats. Neuroscience, 154(1), 114–126. [DOI] [PMC free article] [PubMed] [Google Scholar]
- Schofield BR, Mellott JG, & Motts SD (2014). Subcollicular projections to the auditory thalamus and collateral projections to the inferior colliculus. Frontiers in Neuroanatomy, 8(70), 1–16. [DOI] [PMC free article] [PubMed] [Google Scholar]
- Schofield BR, Motts SD, Mellott JG, & Foster NL (2014). Projections from the dorsal and ventral cochlear nuclei to the medial geniculate body. Frontiers in Neuroanatomy, 8(10), 1–12. [DOI] [PMC free article] [PubMed] [Google Scholar]
- Sharma K, Seo YW and Yi E (2018) ‘Differential expression of Ca2+-buffering protein calretinin in cochlear afferent fibers: A possible link to vulnerability to traumatic noise’, Experimental Neurobiology, 27(5), pp. 397–407. doi: 10.5607/en.2018.27.5.397. [DOI] [PMC free article] [PubMed] [Google Scholar]
- Shi L, Liu L, He T, Guo X, Yu Z, Yin S, & Wang J (2013). Ribbon synapse plasticity in the cochleae of guinea pigs after noise-induced silent damage. PLoS ONE, 8(12). 10.1371/journal.pone.0081566 [DOI] [PMC free article] [PubMed] [Google Scholar]
- Stabler SE, Palmer AR, & Winter IM (1996). Temporal and mean rate discharge patterns of single units in the dorsal cochlear nucleus of the anesthetized guinea pig. Journal of Neurophysiology, 76(3), 1667–1688. [DOI] [PubMed] [Google Scholar]
- Viana LM, O JT, Burgess BJ, Jones DD, ACP Oliveira C, Santos F, Merchant SN, Liberman LD, & Charles Liberman M (2015). Cochlear neuropathy in human presbycusis: confocal analysis of hidden hearing loss in post-mortem tissue HHS Public Access. Hear Res, 327, 78–88. 10.1016/j.heares.2015.04.014 [DOI] [PMC free article] [PubMed] [Google Scholar]
- Vogler DP, Robertson D, & Mulders WHAM (2011). Hyperactivity in the ventral cochlear nucleus after cochlear trauma. Journal of Neuroscience, 31(18), 6639–6645. 10.1523/JNEUROSCI.6538-10.2011 [DOI] [PMC free article] [PubMed] [Google Scholar]
- Wan G, Gómez-Casati ME, Gigliello AR, Charles Liberman M, & Corfas G (2014). Neurotrophin-3 regulates ribbon synapse density in the cochlea and induces synapse regeneration after acoustic trauma. ELife, 2014-Octob, 1–35. 10.7554/eLife.03564 [DOI] [PMC free article] [PubMed] [Google Scholar]
- Wang M, Zhang C, Lin S, Wang Y, Seicol BJ, Ariss RW, & Xie R (2021). Biased auditory nerve central synaptopathy is associated with age-related hearing loss. Journal of Physiology, 0, 1–22. 10.1113/JP281014 [DOI] [PMC free article] [PubMed] [Google Scholar]
- Winter IM, & Palmer AR (1995). Level dependence of cochlear nucleus onset unit responses and facilitation by second tones or broadband noise. Journal of Neurophysiology, 73(1), 141–159. [DOI] [PubMed] [Google Scholar]
- Wu PZ, Liberman LD, Bennett K, de Gruttola V, O’Malley JT, & Liberman MC (2019). Primary Neural Degeneration in the Human Cochlea: Evidence for Hidden Hearing Loss in the Aging Ear. Neuroscience, 407, 8–20. 10.1016/J.NEUROSCIENCE.2018.07.053 [DOI] [PMC free article] [PubMed] [Google Scholar]
- Young ED, Robert JM, & Shofner WP (1988). Regularity and latency of units in ventral cochlear nucleus: implications for unit classification and generation of response properties. Journal of Neurophysiology, 60(1), 1–29. [DOI] [PubMed] [Google Scholar]
- Young Eric D., & Barta PE (1986). Rate responses of auditory nerve fibers to tones in noise near masked threshold. Journal of the Acoustical Society of America, 79(2), 426–442. 10.1121/1.393530 [DOI] [PubMed] [Google Scholar]
- Zhang Z, Fan L, Xing Y, Wang J, Aiken S, Chen Z, & Wang J (2020). Temporary Versus Permanent Synaptic Loss from Repeated Noise Exposure in Guinea Pigs and C57 Mice. Neuroscience, 432, 94–103. 10.1016/j.neuroscience.2020.02.038 [DOI] [PubMed] [Google Scholar]
Associated Data
This section collects any data citations, data availability statements, or supplementary materials included in this article.
Supplementary Materials
Data Availability Statement
Data are available as supporting information, MATLAB scripts are available from the authors on request.


