

Summary
Lymphocyte trafficking requires fine-tuning of chemokine-mediated cell migration. This process depends on cytoskeletal dynamics and polarity, but its regulation remains elusive. We quantitatively measured cell polarity and revealed critical roles performed by integrin activator Rap1 in this process, independent of substrate adhesion. Rap1-deficient naive T cells exhibited impaired abilities to reorganize the actin cytoskeleton into pseudopods and actomyosin-rich uropods. Rap1-GTPase activating proteins (GAPs), Rasa3 and Sipa1, maintained an unpolarized shape; deletion of these GAPs spontaneously induced cell polarization, indicative of the polarizing effect of Rap1. Rap1 activation required F-actin scaffolds, and stimulated RhoA activation and actomyosin contractility at the rear. Furthermore, talin1 acted on Rap1 downstream effectors to promote actomyosin contractility in the uropod, which occurred independently of substrate adhesion and talin1 binding to integrins. These findings indicate that Rap1 signaling to RhoA and talin1 regulates chemokine-stimulated lymphocyte polarization and chemotaxis in a manner independent of adhesion.
Subject areas: Cellular physiology, Molecular interaction, Cell
Graphical abstract
Highlights
-
•
Rap1 facilitates front-back T cell polarity via RhoA and talin1 upon CCL21 stimuli
-
•
Rap1 activation requires F-actin scaffold by PI3K/Dock2 via the translocation of RapGEFs
-
•
Talin1 facilitates front-back T cell polarity via actomyosin at the downstream of Rap1
-
•
The talin1 function in front-back T cell polarity is independent of substrate adhesion
Cellular physiology; Molecular interaction; Cell
Introduction
Naive lymphocytes recirculate between the blood and lymphatic organs and scan cognate antigens in lymphoid tissues. Lymphocyte homing to peripheral lymph nodes is regulated by an interplay of adhesion molecules and chemokines, initiated by selectin-dependent tethering/rolling along the endothelium. Endothelial chemokines induce integrin activation on T cells, resulting in firm adhesion and extravasation.1,2 Extravasated T cells migrate to paracortical T cell areas, expressing immobilized T cell chemokines CCL19/CCL21 on fibroblastic reticular cells and dendritic cells, randomly interacting with these cells at a wide range of velocities, often exceeding 20 μm/min. T cell migration involves several modes with cell shape changes, as seen in ameboid migration, including gliding movements and blebbing-based motility.3,4 Previous studies have shown that intranodal T cell migration involves Gi signaling and integrin LFA1, indicating that chemokines control integrin-dependent and -independent processes.5,6,7 The random motility and deformability of T cells under the influence of chemokines and integrin-mediated adhesion likely facilitate encounters of rare cognate antigens in the densely packed, confined microenvironments of the paracortex before egress.8,9
While the function of chemokines in the integrin-mediated arrest step of rolling lymphocytes is well established, the molecular mechanism of lymphocyte cell shape changes and the relationship with integrin regulation remain unclear. Chemotaxis is the best-studied function of chemokines and involves directed migration within a gradient of chemoattractant. Chemotaxis is elicited via seven transmembrane receptors coupled with pertussis toxin-sensitive Gi proteins, which initially induce global F-actin response in seconds, leading to asymmetrical distribution of distinct F-actin organization in minutes—actin polymerization at one pole (pseudopod) and actin-myosin contractile complexes at the opposite pole and sides (uropod).10 The distinct actin structures define cell polarity, orienting cells with pseudopods at the leading edge and uropods at the rear for migration toward higher concentrations of stimuli. On the other hand, it is well known that uniformly applied stimuli also induce symmetry breaking (i.e., self-organizing polarity),11 allowing polarized cells to move randomly, which is reminiscent of the random motility of T cells on immobilized chemokines.
Over decades, the extensive study of chemotaxis in Dictyostelium, neutrophils, and cell lines has advanced our understanding of the signaling network underlying cell polarization induced by chemoattractants. Ligand binding to G-protein-coupled receptors triggers the dissociation of trimeric Gi proteins into Gαi and Gβγ, which interact with their respective downstream effector proteins to transduce intracellular signals. In leukocyte chemotaxis, Gβγ promotes pseudopods by activating phosphatidylinositol 3-kinase (PI3K) γ, leading to the generation of phosphatidylinositol (3,4,5) triphosphates.12 This in turn activates the DOCK2-Rac pathway to induce F-actin polymerization and generates subsequent F-actin-rich pseudopods.13 The Gαi subunit also plays an important role in Rac/Cdc42 activation, stable pseudopod formation, and the migration of neutrophils and cancer cells through interactions with downstream effectors including ELMO1/Dock180, mInsc, and Homer3.14,15,16 The generation of uropods involves RhoA, which promotes Rho-associated coiled-coil kinase (ROCK)-mediated phosphorylation of the myosin light chain (MLC), and consequent activation of myosin II, which results in actin-myosin contractility.11,17 Although the basic mechanisms of actin remodeling and chemotaxis have been clarified, the cooperative mechanisms generating the front-back polarity are less clear and seem to be diversified across species and regulated differently in cell lineages.
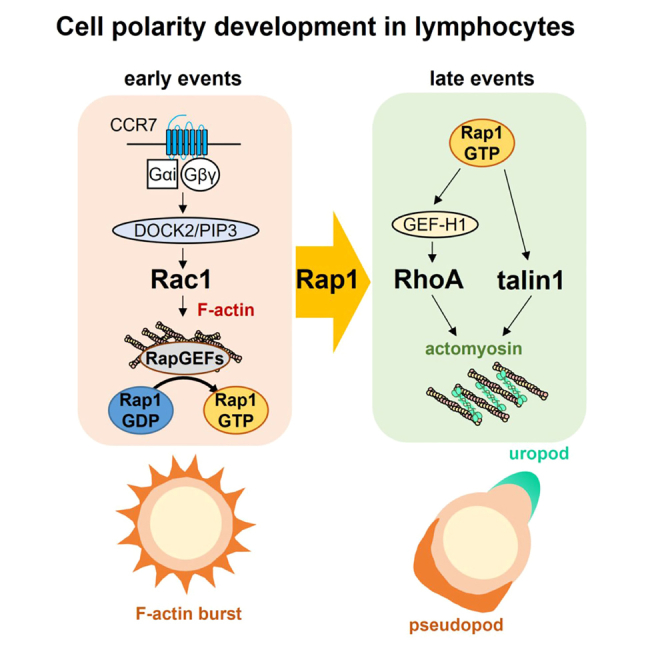
The small GTPase Ras-related protein 1 (Rap1) is a master regulator of integrin-mediated adhesion in lymphocytes upon chemokine or antigen stimulation.18,19 Rap1 recruits the integrin adaptors talin1 and kindlin-3 to integrin β cytoplasmic tails to induce ligand binding.20,21,22,23 Ectopic expressions of constitutively active Rap1 mutants and its effector RAPL, but not Ras or RhoGTPases, generated cell polarity in the absence of chemokines.18,24 Although informative, these studies were performed in overexpression systems using activated T cells or lymphoid cell lines and did not directly address the roles of Rap1 in cell polarization and chemotaxis of primary lymphocytes. Here, we report crucial roles of Rap1 and talin1 in this process independent of substrate adhesion. We show that Rap1 has a polarization-organizing property to induce symmetry breaking, leading to a morphologically distinct cytoskeleton, F-actin accumulation, and actomyosin, on opposing edges. Rap1 activation required F-actin scaffolds, and stimulated RhoA and myosin. Talin1 acted as a downstream effector of Rap1 to promote the contraction of F-actin/myosin complexes in the uropod, independent of adhesion. While the absence of talin1 or Rap1 diminished both cell polarity and adhesion to ICAM1, an LFA1 mutant defective in talin1 binding did not affect cell polarization. This highlights that Rap1 signaling to RhoA and talin1 facilitates the chemotactic migration of T cells through integrin-independent processes.
Results
Rap1 is required for efficient polarization in response to chemokine stimulation
Uniform concentrations of chemokines transform spherical lymphocytes into those with distinct elongated shapes (“hand-mirror” shapes) with the development of an F-actin-rich pseudopod and CD44-rich uropod at opposing ends of a cell to facilitate cell migration.25,26 However, morphological changes of lymphocytes occur variably, from those with almost no changes to those with typical hand-mirror shapes, and most evaluations have been performed on microscopic observations of a small number of cells. To determine quantitatively whether Rap1 is involved in naive T cell shape changes by chemokines, we introduced quantitative methods using imaging cytometry to measure cell shape changes with uniform stimulation of a T cell chemokine, CCL21. CCR7, a receptor for CCL21, was expressed at comparable levels in wild-type (WT) and Rap1a−/−Rap1b−/− (Rap1-deficient) T cells from Cd4-cre Rap1aflox/floxRap1bflox/flox mice (Figure 1A).27 Primary splenic WT and mutant T cells stimulated with CCL21 were fluorescently stained for F-actin and CD44 (a uropod marker) (Figures 1B and 1C). Naive T cells gated based on size and low CD44 expression (Figure S1A) were measured for basic morphological parameters including aspect ratios (width vs. height) and circularity (variation of cell radius) of cells (Figures 1C and S1B‒S1D). Polarity parameters representing the degree of segregation of the pseudopod and uropod were computed based on the distance between the brightness center of F-actin and CD44 (Figures S1B and S1D). Polarized cells were gated to distinguish variations of cell shapes of WT T cells in resting states under our conditions (cut-off value of ∼3.0%) and elongated cells were defined as cells with an aspect ratio less than 0.78 to discriminate slight variations in resting T cell shapes. Combinations of these parameters and gating allowed us to sort a large number of stimulated T cells (>104 cells) to identify typical “polarized cells” exhibiting hand-mirror shapes with lower circularity and higher polarity (Figures 1C, 1D, S1C, and S1D). We tested our procedures using Dock2−/− T cells, the null mutation of which was previously reported to cause profound defects of chemokine-stimulated F-actin polymerization and cell polarization.13,28 Consistently, our procedures detected severe impairment in CCL21-induced cell polarization of mutant T cells relative to WT T cells (Figure S1E).
Figure 1.

Defective polarization of T cells deficient in Rap1
(A) Expression profiles of CCR7 on WT (red) and Rap1a−/−Rap1b−/− (blue) T cells. CCR7 expression was measured using CCL19-Fc and FITC-conjugated anti-human IgG. A representative histogram of two experiments is shown. Solid and dotted lines represent the bindings of CCL19-Fc and Fc proteins, respectively.
(B) A schematic flow of experimental procedures for cell polarity measurement.
(C) The typical cell shapes with F-actin and CD44 distribution in unpolarized and polarized cells and representative images acquired using an imaging cytometer as in (B), with numerical values of the aspect ratios, circularity, and polarity. Polarized cells exhibited low aspect ratios and circularity, but high polarity.
(D) Contour plots with polarity (x-axis) and circularity (y axis) of WT and Rap1a−/−Rap1b−/−naïve T cells in the absence (upper) and the presence (lower) of CCL21 (100 nM). The numbers show percentages of cells in the gate 5 min after stimulation.
(E) The changes in the cell elongation and polarization of naive T cells after the stimulation of CCL21 (100 nM). The data at each time point show the average percentages ±SD (n = 3) of WT (black) and Rap1a−/−Rap1b−/− (red) T cells exhibiting cell elongation (left) and cell polarity (right).
(F) Clustering of F-actin (left) and CD44 (right), shown as in (E).
(G) Evaluation of defective polarity in Rap1a−/−; Rap1b−/− T cells with supervised machine learning. The score profiles of CCL21-stimulated WT and Rap1a−/−Rap1b−/− T cells as judged by AI were statistically significant (chi-squared test, p < 0.0001) (see STAR Methods).
(H) The changes in the cell polarization of CCL21-stimulated WT and Rap1a−/−Rap1b−/− T cells were judged by AI. The average percentages ±SD (n = 3) of polarized (Hand-Mirror score >0.9) cells were shown. Statistical significance for all data was determined by two-tailed Student’s t test except (G), which was determined by a chi-squared test. ∗p < 0.05, ∗∗p < 0.01, and ∗∗∗∗p < 0.0001.
We then compared efficiencies of cell polarization in WT and Rap1-deficient T cells. Most of the resting WT T cells exhibited unpolarized shapes (Figure 1D). CCL21 stimulation led to an 8-fold increase in the polarized cell population in WT cells, with the rest showing elongated cells with limited segregation of polarization parameters. On the other hand, polarized cells only increased by two to 3-fold in a Rap1-deficient background. In time course experiments, CCL21 increased the population of elongated WT cells after 60 s post-treatment, which plateaued until 300 s post-treatment (Figure 1E, left). Percentages of polarized WT cells peaked at 60 s and were sustained at slightly lower levels (Figure 1E, right). The changes in elongation and cell polarization of WT T cells were in agreement with those of a previous study using human T cells and CCL19.29 Although the time-response curves of Rap1-deficient T cells were similar to those of WT cells, they decreased the elongated cell population by 40–50% (Figure 1E, left) and the polarized cell population by 30–40% (Figure 1E, right). To dissect the cell polarization processes, we measured the clustering of F-actin and CD44 (Figure 1F). The clustering was calculated as the distance between a morphological center and the brightness of an object of interest (Figure S1B). Compared to WT T cells, the initial F-actin burst, occurring uniformly on the plasma membrane within a few seconds after chemokine stimulation, was slightly reduced, but comparable after 30 s in Rap1-deficient T cells (Figure S1F). The subsequent F-actin clustering was evident in WT T cells at 30 s after stimulation, peaked at 60 s, and was sustained thereafter. In Rap1-deficient T cells, F-actin clustering was significantly reduced (Figure 1F, left). While WT T cells gradually increased CD44 clustering concomitantly with elongation after stimulation, CD44 clustering in Rap1-deficient T cells transiently increased at earlier time points, but subsequently decreased to lower levels than those observed in WT T cells (Figure 1F, right). The absence of Rap1 caused inefficient F-actin clustering and defective CD44 accumulation (Figure 1F).
To validate the above findings, we utilized supervised machine learning for unbiased judgment of cell polarization by artificial intelligence (AI) using transfer learning on a deep convolutional neural network (CNN) (Figures 1G, 1H, and S2A). The representative images of unpolarized (circularityhi polaritylo ARhi, Hand-Mirror score = 0) and polarized cells (circularitylo polarityhi ARlo, Hand-Mirror score = 1) were used as supervisors (see STAR Methods). The AI sorted T cell images into “unpolarized” (score <0.1), “polarized” (Hand-Mirror score >0.9), and “partially polarized” (Hand-Mirror score 0.1–0.9) T cells (Figure 1G). We confirmed that polarized cells selected by the AI exhibited low circularity and high polarity, consistent with manually gated fractions (Figure S2B). Having established the AI-based polarity measurement program, a large dataset of captured images of CCL21-stimulated WT and Rap1-deficient T cells was loaded into the program to measure efficiencies of cell polarization (Figure 1H). Compared to WT T cells, polarized cells decreased significantly by 30–50% with a reciprocal increase in unpolarized fractions and partially polarized fractions in Rap1-deficient T cells (Figures 1G and 1H). Based on the results from these two independent approaches, we concluded that Rap1 deficiency in T cells resulted in impairment of CCL21-induced cell polarity.
A loss of Rap-GAP proteins promotes polarization in the absence of chemokines
Overexpression of a constitutively active Rap1 mutant promotes spontaneous cell polarization of lymphocyte cell lines or activating lymphocytes.18,24 Therefore, Rap1 activation by the inactivation of Rap-GAPs should facilitate autonomous T cell polarity. T cells abundantly expressed Rap1-GAPs, RASA3, and SIPA1.30,31 To evaluate the contribution of Rap-GAPs to Rap1 suppression in the resting state, we generated Sipa1−/− mice using Crisper-Cas9 system and crossed with Cd4-cre Rasa3flox/flox to obtain Cd4-cre Rasa3flox/floxSipa1−/− mice, and measured the amount of Rap1-GTP in T cells (Figures S3A and S3B). The basal amount of Rap1-GTP was increased 25-fold in the double mutant T cells (Figure 2A), which was slightly lower than the level observed in WT T cells stimulated with CCL21 at 5 s (Figure 2A). Thus, the loss of these Rap-GAPs significantly induced Rap1 activation in non-activated T cells. Therefore, we next examined the effects of the loss of RASA3 and SIPA1 on the cell polarization of T cells (Figures 2B–2E). The loss of both RASA3 and SIPA1 proteins substantially increased cell elongation and cell polarity (Figures 2B–2E). RASA3 has dual GAP activity toward Rap1 and Ras,32 the latter of which is involved in the cell polarity of Dictyostelium.33 To confirm whether the induction of polarity in Rasa3−/−Sipa1−/− T cells is due to activated Rap1, we measured the cell polarity of Rasa3−/−Sipa1−/− T cells deficient in Rap1 isolated from Cd4-cre Rasa3flox/floxSipa1−/−Rap1aflox/floxRap1bflox/flox mice. The increased cell elongation and polarity were abolished in the mutant T cells lacking Rap1 (Figures 2F and 2G). Therefore, the activation of Rap1 was responsible for the spontaneous induction of cell polarity in naive T cells deficient in RASA3 and SIPA1.
Figure 2.

Spontaneous polarization in T cells deficient for RASA3 and SIPA1
(A) Rap1 activation in WT T cells with or without CCL21(100 nM) and Rasa3−/−Sipa1−/− T cells without CCL21, with values relative to unstimulated WT T cells (none) shown as a bar graph (average ±SD, n = 3).
(B) Representative confocal images of F-actin and CD44 in WT and Rasa3−/−Sipa1−/− T cells. Scale bar, 10 μm.
(C) Cell elongation of T cells deficient for Rasa3−/−Sipa1−/− T cells. Bars represent the average percentage of elongated cells ±SD (aspect ratios <0.78) (n = 4).
(D) Cell polarization in T cells. Average percentage of polarized cells ±SD (n = 4).
(E) The percentage of polarized cells ±SD (Hand-Mirror score >0.9) was evaluated by AI in (D).
(F and G) The impact of Rap1 deficiency on cell polarity of Rasa3−/−Sipa1−/− T cells. The percentage of cells exhibiting (F) cell elongation and (G) cell polarization for WT T cells and mutant T cells lacking RASA3/SIPA1, RASA3/SIPA1/Rap1a/Rap1b, or Rap1a/Rap1b, as indicated. Average ±SD (n = 3, representative of two experiments). Statistical significance for the above data was determined by two-tailed Student’s t test. ∗p < 0.05, ∗∗p < 0.01, and ∗∗∗∗p < 0.0001.
DOCK2 and F-actin are important for Rap1 activation by regulating guanine nucleotide exchange factors localization
To explore the mechanisms by which Rap1 regulates cell polarity, we first examined the spatiotemporal relationship of Rap1-GTP and F-actin development in response to chemokines. For this purpose, a Rap-GTP affinity probe and lifeact were fused to fluorescent proteins and expressed in a Ba/F3 proB cell line, which exhibited Rap1-dependent cell polarization, similarly to primary T cells.18 Time-lapse imaging with confocal microscopy revealed that after stimulation with CXCL12, Rap-GTP was localized at the plasma membrane within 10 s and then accumulated at the edge of an F-actin-rich multiple protrusion and in the perinuclear regions (Figure 3A). Within minutes, distinct lamellipodia and uropods were formed with Rap1-GTP sharply accumulated at the edge of the lamellipodia and, to lesser degrees, at the side and rear membranes and in the perinuclear regions.
Figure 3.

The DOCK2/F-actin axis triggers Rap1 activation via RapGEF localization
(A) Time-lapse imaging of Ba/F3 cells expressing lifeact-Turquoise2 (upper), GFP-RalGDS RBD (Rap-GTP affinity probe, middle), and DIC (lower) before and after stimulation with CXCL12 (100 nM). Images. Scale bar, 10 μm.
(B) Rap1 activation of T cells pretreated with latrunculin A (0.5 μM) upon stimulation with CCL21 (10 nM) and subjected to pull-down assays to detect Rap1-GTP (top). The blots with relative values are shown. The right panel shows the relative values at 5 s (n = 2).
(C) Rap1 activation of T cells from Dock2−/− mice unstimulated or stimulated with CCL21 (10 nM, 5 s). Relative amounts of Rap1-GTP against total Rap1 are shown later in discussion. The right panel shows the relative values at 5 s (n = 2).
(D) Rap1 activation of T cells in the presence of a PI3K inhibitor. T cells treated with wortmannin (100 nM, 30 min) were stimulated with CCL21 (100 nM) for indicated times. The right panel shows the relative values at 5 s (n = 2).
(E) Time-lapse imaging of lifeact-Turquoise2 (upper) and GFP-RasGRP2 (middle) in Ba/F3 cells before and after stimulation with CXCL12 (100 nM) in the presence or absence of latrunculin A (1 μM). DIC images were also acquired (bottom). Scale bar, 10 μm.
(F) Time-lapse images of Lifeact-TQ2 (upper), GFP-C3G (middle), and DIC (lower) in Ba/F3 cells before and after the addition of CXCL12 in the presence or absence of latrunculin A (1 μM) with lapse time indicated (hh:mm:ss).
The co-localization of Rap1-GTP with F-actin led us to examine whether F-actin is required for Rap1 activation. We found that the inhibition of actin polymerization with latrunculin A decreased Rap1 activation in primary T cells (Figure 3B). As shown previously, DOCK2 and PI(3)K are crucial for actin polymerization in response to chemokines via Rac activation.13,28 Consistently, gene knockout of Dock2 as well as the pharmacological inhibition of PI(3)K by wortmannin treatment also impaired Rap1 activation in primary T cells (Figures 3C and 3D), indicating that Rac-mediated actin polymerization via DOCK2/PI(3)K was required for efficient Rap1 activation. In contrast, a loss of Rap1 had little impact on Rac1 and Cdc42 activation upon CCL21 stimulation (Figures S4A and S4B). These data indicate that the regulation of Rap1 activation requires F-actin polymerization to occur in the process of cell polarization.
The above results suggest that F-actin acts as a scaffold for the recruitment of guanine nucleotide exchange factors (GEF) for Rap1. To visualize major Rap1-GEFs expressed in lymphocytes, we transfected RASGRP2 and C3G fused with GFP into Ba/F3 cells and examined their localization.22 In the resting state, GFP-RASGRP2 and GFP-C3G were diffusely present in the cytoplasm (Figures 3E, 3F, S4C, and S4D). CXCL12 stimulation caused immediate but transient translocation of GFP-RASGRP2 to the plasma membrane within a few seconds (Figures 3E and S3C). In contrast, GFP-C3G was apparently localized at the edge of the cell protrusion and lamellipodia (Figures 3F and S3D). These localizations of RASGRP2 and C3G were severely inhibited with treatment of latrunculin A (Figures 3E and 3F), supporting the notion that Rap1 activation requires F-actin scaffolds to recruit distinct Rap1-GEFs to appropriate locations.
Rap1 regulates T cell polarization via RhoA signaling
As uropod formation is regulated by the RhoA-ROCK-MLC/myosin II axis,17 we investigated whether Rap1 could affect the RhoA signaling axis. RhoA activation in naive T cells was measured by intracellular staining with anti-RhoA-GTP antibodies and flow cytometry.34,35,36 The amount of RhoA-GTP increased in T cells stimulated with CCL21, which was abolished with pertussis toxin (PTX) treatment (Figure 4A), indicating that CCL21-induced RhoA activation is regulated by Gi-dependent signaling, as reported previously.36 Notably, RhoA activation was inhibited in Rap1-deficient T cells stimulated with CCL21, indicating that Rap1 is crucial for global RhoA activation (Figures 4B and 4C). Consistently, the amount of phosphorylated MLC (pMLC) was decreased in Rap1-deficient T cells with CCL21 (Figure 4D). Accumulation of pMLC in the rear part of polarized cells was evident in WT T cells, but not in Rap1-deficient T cells (Figures 4E and 4F). Conversely, Rasa3−/−Sipa1−/− T cells, in which basal Rap1-GTP was plentiful (Figure 2), exhibited enhanced RhoA activation and pMLC without stimulation (Figures 4G–4I). The increase of pMLC in Rasa3−/−Sipa1−/− T cells was inhibited by treatment with a ROCK inhibitor Y-27632 (Figure 4I). Cell elongation of Rasa3−/−Sipa1−/− T cells was also impaired by Y-27632, as well as blebbistatin, a myosin II inhibitor (Figure 4J). These data strongly suggest that Rap1 regulates the RhoA-ROCK-MLC/myosin II axis.
Figure 4.

Rap1 promotes T cell polarization via RhoA signaling
(A) RhoA activation with CCL21 was Gαi dependent. T cells treated with or without pertussis toxin (PTX, 200 ng/mL, 2 h) were stimulated with CCL21 (100 nM) and stained for RhoA-GTP with specific antibodies. Bars indicate the average of median fluorescent intensity (MFI) ± SD (n = 3).
(B) RhoA-GTP of WT and Rap1a−/−Rap1b−/−naïve T cells (CD44low) 0, 2, and 5 min after CCL21 stimulation (100 nM). The results are shown as above (n = 3).
(C) Relative amount of RhoA-GTP against total RhoA in WT and Rap1a−/−Rap1b−/−naïve T cells (CD44low) with or without CCL21 (100 nM) at 120 s (n = 3).
(D) Phosphorylated MLC at Ser 19 (pMLC) in WT and Rap1a−/−Rap1b−/− T cells without or with CCL21 (100 nM). The relative amount of pMLC in mutant T cells was calculated as MLC levels by the MFI normalized to the average of MFI of unstimulated WT T cells. Bars indicate the average ±SD.
(E) Impaired clustering of pMLC in Rap1a−/−; Rap1b−/− T cells. Two examples of 3D projection of F-actin and pMLC with composite-colored images (merged) in WT and Rap1a−/−Rap1b−/− T cells stimulated with CCL21 (100 nM).
(F) Clustering of pMLC in WT and Rap1a−/−Rap1b−/− T cells. Contour plots of pMLC clustering (x axis) vs. circularity (y axis) with percentages of pMLC clustering cells in the gate. Bar shows average percentage ±SD of pMLC-clustering cells (n = 2–3).
(G) RhoA-GTP in WT and Rasa3−/−; Sipa1−/−naïve T cells. Bars indicate average MFI ±SD (n = 3).
(H) Relative amount of RhoA-GTP against total RhoA in WT and Rasa3−/−Sipa1−/− naive T cells (CD44low). Bars indicate average ±SD (n = 3).
(I) pMLC in Rasa3−/−Sipa1−/− T cells in the absence or presence of Y27632 (20 μM). Bars indicate average ±SD (n = 3, a representative of two independent experiments).
(J) Suppression of cell polarization of Rasa3−/−Sipa1−/− T cells with ROCK inhibitor Y27632 (20 μM) and myosin II inhibitor blebbistatin (50 μM). Bars show average percentages ±SD of elongated cells (n = 3).
(K) The phosphorylation of NDR1 at Thr444 in WT and Rap1a−/−Rap1b−/− T cells. The right bar graph shows the average amount of NDR1 against total Rap1 (n = 2).
(L) Impaired clustering of GEF-H1 in Rap1a−/−Rap1b−/− T cells. 3D projections of GEF-H1, F-actin, and composite images.
(M) Changes of GEF-H1 clustering upon CCL21 stimulation (100 nM). Bars indicate the average percentages ±SD (n = 3) of GEF-H1-clustered cells.
(N) GEF-H1 clustering of Rasa3−/−Sipa1−/− T cells in the absence of chemokine as shown in (M). Statistical significance for the above data was determined by two-tailed Student’s t test. ∗p < 0.05, ∗∗p < 0.01, and ∗∗∗p < 0.001.
Previous studies have reported that T cells lacking kinase Mst1/2 or Ndr1/2 exhibited defective RhoA activation and cell polarization,37,38 but their relationship with Rap1 remains unknown. As a Rap1 interacting protein RAPL activates Mst1,39 which in turn phosphorylates and activates Ndr1/2,37,38,40 we speculate that the absence of Rap1 would inhibit the phosphorylation of Ndr1. CCL21 induced the phosphorylation of Ndr1 on Thr444 (T444), a site targeted by Mst1 in wild-type T cells,21,38,41 which was minimally observed in Rap1-deficient T cells (Figure 4K). This result supports the notion that Rap1 is required for RhoA activation via Ndr1. In this context, we hypothesized that GEF-H1 (Rho/Rac guanine nucleotide exchange factor 2, ARHGEF2), a microtubule-associated RhoA activating GEF, may be involved since the association of Ndr and GEF-H1 was previously reported.42 To investigate whether Rap1 would affect GEF-H1 localization in T cells, we stimulated WT and Rap1a−/−Rap1b−/− T cells with CCL21 and stained them with anti-GEF-H1 and phalloidin (F-actin). Representative confocal images showed that GEF-H1 was dense in uropods, and to a lesser degree, in the regions behind pseudopods in WT T cells, whereas GEF-H1 was diffusely distributed in the cytoplasm of Rap1-deficient T cells (Figure 4L). Quantitative measurement of GEF-H1 clustering with imaging cytometry revealed that GEF-H1 clustering was decreased by half in Rap1-deficient T cells relative to WT T cells (Figure 4M). Conversely, in Rasa3−/−Sipa1−/− T cells GEF-H1 clustering increased approximately 2-fold without chemokines, indicating a signaling linkage of Rap1 and GEF-H1 (Figure 4N).
Involvement of talin1 downstream of Rap1 in myosin light chain activation
The recruitment of talin1 via Rap1 to integrins is critical to inducing integrin-dependent adhesion.20,22,23 However, a linkage of Rap1 and talin1 for T cell polarity in the absence of integrin-dependent adhesion has not yet been reported. To explore Rap1-dependent talin1 functions in cell polarity, we measured cell polarity development in Tln1−/− T cells with CCL21 (Figures 5A and 5B). CCR7 was normally expressed in Tln1−/− T cells (Figure S5A). Notably, as observed in Rap1-deficient T cells, in Tln1−/− T cells, the cell elongation and polarization were severely impaired (Figures 5A and 5B). Thus, talin1 was important for cell polarity independent of substrate adhesion. Consistently, a chemotactic response to CCL21 was attenuated in Tln1−/− and Rap1-deficient T cells in transwell assay (Figure 5C).
Figure 5.

Talin1 is involved in cell polarity downstream of Rap1
(A) Changes of cell elongation of naive WT and Tln1−/− T cells after stimulation. T cells suspended in RPMI1640 containing 1% BSA were stimulated with CCL21 (100 nM) and examined for cell elongation by imaging cytometry. The data shows the average percentage ±SD (n = 3, a representative of two experiments).
(B) Changes in the cell polarization of naive WT and Tln1−/− T cells as in (A).
(C) Chemotactic assays of WT, Tln1−/− (left panel) and Rap1a−/−Rap1b−/− (right panel) T cells in response to 30 nM CCL21 (n = 3).
(D) The amount of RhoA-GTP of Tln1−/− T cells at 2 min after stimulation with CCL21 (100 nM) measured by flow cytometry. Bars indicate the average MFI of RhoA-GTP ±SD (n = 3, a representative of two experiments).
(E) The amount of pMLC of Tln1−/− T cells at 2 min after stimulation with CCL21 (100 nM). The relative amount of pMLC in mutant T cells was calculated as MLC levels by MFI normalized to the average of MFI of unstimulated WT T cells. (n = 3, a representative of two independent experiments).
(F) The clustering of pMLC in WT and Tln1−/− T cells at 2 min after stimulation with CCL21 (100 nM) was measured by imaging cytometry. Bars indicate the average ±SD (n = 3, a representative of two independent experiments).
(G) A representation of confocal images of F-actin, talin1, and pMLC in HT-talin1 knock-in (Tln1HT/WT) T cells stained with HaloTag SaraFluor 650T Ligand. WT T cell (Tln1w/w) was used for negative control of HT-specific staining. Scale bar, 5 μm.
(H) Relative levels of pMLC in WT, Rasa3−/−Sipa1−/−, Rasa3−/−Sipa1−/−Tln1−/−, and Tln1−/−T cells were measured by flow cytometry. Bars indicate average ±SD (n = 3, a representative of two independent experiments).
(I) The clustering of pMLC (average ±SD) as in (H).
(J) The cell elongation (average ±SD) as in (H). Statistical significance for the above data was determined by two-tailed Student’s t test. ∗p < 0.05, ∗∗p < 0.01, ∗∗∗p < 0.001, and ∗∗∗∗p < 0.0001.
To investigate how talin1 is involved in cell polarity, we measured RhoA activation and MLC phosphorylation in Tln1−/− T cells (Figures 5D–5F). Although Tln1−/− T cells exhibited only a slight decrease in RhoA activation, both amount and clustering of pMLC were substantially decreased in Tln1−/− T cells. Confocal microscopy using T cells derived from HaloTag(HT)-fused talin1 knock-in mice (Tln1HT/wt) showed that talin1 accumulated in the vicinity of pMLC in uropods (Figure 5G). These findings support the notion that talin1 regulates cell polarity via MLC activation downstream of RhoA. To further confirm whether talin1 is a downstream effector of Rap1-induced cell polarization, we measured MLC activation and elongation of T cells from Rasa3−/−Sipa1−/−mice (Figures 5H–5J). Compared to Rasa3−/−Sipa1−/− T cells, Rasa3−/−Sipa1−/−Tln1−/− T cells exhibited defective MLC phosphorylation and clustering with a modest impact on cell elongation. These data indicate that talin1 acts in part as a downstream effector of Rap1 and regulates MLC activation and cell polarization.
Rap1 associates with talin1 via RIAM, or directly through the talin FERM domain.20,43,44 To determine the molecular mechanism of the link between Rap1 and talin1 in chemokine-induced cell polarity, we examined RIAM-deficient (Apbb1ip−/−) T cells. RIAM-deficient T cells failed to adhere to ICAM1 (Figure S5B), as reported.45 However, the absence of RIAM had marginal impacts on cell polarization—no significant changes in polarization parameters 2 min post-stimulation with a small decrease of elongation and polarization at 5 min (Figure S5C). The F0 subdomain of the FERM domain in talin1 mediates direct binding to Rap1.22 To examine the involvement of the F0 subdomain in cell polarization, we employed a Ba/F3 line, in which talin1 was inactivated with CRSPR/Cas9 and introduced with either wild-type talin1, or a mutant lacking the F0 subdomain (Figure S5D). Compared to the wild type, the mutant talin1 inhibited cell elongation and polarization induced by CXCL12 (Figure S5E). These results indicate that direct binding of Rap1 to talin1 plays a major role in chemokine-induced cell polarization.
Talin1 regulates cell polarization independent of binding to integrins
So far, our data strongly suggest an integrin-independent role of talin1 in cell polarization. T cells expressed ICAM1/ICAM2, but rarely VCAM1 and MAdCAM1, ligands for α4β1 and α4β7 (Figure 6A). Therefore, it might be possible that transient LFA1-ICAMs interactions in trans or cis might activate talin1, thereby facilitating cell polarization by outside-in signaling. To exclude this possibility, we employed naive T cells from knock-in mice (Itgb2W748A) that express a mutant β2 subunit bearing an alanine substitution of a critical talin-binding tryptophan (W748A) (Figures S6A and S6B).22,46 The mutant T cells expressed the αL and β2 subunits, as well as CCR7, comparably with WT (Figures 6B and S6C). Detachment assays confirmed that the mutant T cells lost the ability to adhere to ICAM1, as observed with Tln1−/− T cells (Figure 6C). By contrast, the mutant T cells exhibit CCL21-induced cell elongation and polarization at levels similar to those of WT T cells (Figure 6D). These results further emphasize the integrin-independent role of talin1 in cell polarization independent of integrin-mediated interaction.
Figure 6.

Effects of the Itgb2W748A mutation on cell polarization
(A) Expression of ICAM1, ICAM2, VCAM1, and MAdCAM1 in WT and Itgb2W748A KI T cells. Red line: isotype control, blue line: ICAM1, ICAM2, VCAM1, and MAdCAM1.
(B) Expression of αL and β2 subunits of naive WT and W748A mutant T cells. Red line: isotype control, blue line: αL and β2.
(C) Adhesion of WT, Itgb2W748A KI (left panel) and Tln1−/− T cells (right panel) on ICAM1 (n = 3–5).
(D) Changes of cell elongation and cell polarization of naive WT, W748A and Tln1−/− T cells after CCL21 stimulation (100 nM) in RPMI1640 containing 1% BSA, measured by Imaging cytometer. Bars represent the average percentage ±SD of elongated cells (n = 3). Statistical significance for the above data was determined by two-tailed Student’s t test. ∗p < 0.05, ∗∗p < 0.01, ∗∗∗∗p < 0.0001, NS: not significant.
Talin1 localization during T cell migration
It is generally thought that a cyclic process of cell attachment at the front, cell elongation, and pulling and detachment at the rear is important for cell motility.47 To gain insights into how talin1 is involved in cell polarization and motility, we performed live imaging of T cells expressing HT-talin1. T cells were incubated on immobilized ICAM1 and CCL21, and imaged with a confocal microscope. z stack images of T cells showed that a part of the front region of a polarized T cell adhered to and slid onto the substrate, while the uropod formed in the back region of the T cell was kept lifted during migration (Figure 7A, Video S1). We found that HT-talin1 was recruited to distinct sites during migrations: the pseudopod at the front, attachment sites, and the uropod at the back (Figure 7A). Immunostaining of fixed cells showed that HT-talin1 was distributed in frontal areas from a tip of F-actin-rich lamellipodia to the region right behind the lamellipodia associated with F-actin and myosin II. HT-talin1 was also localized in the uropod enriched with myosin II (Figure 7B). These findings suggest that talin1 is involved in lamellipodial protrusion and attachment at the front and uropod formation. Super-resolution radial fluctuation (SRRF) imaging revealed that talin1 was scattered as dots over the contact surface (Figure 7C). Only a fraction of talin1 was colocalized with F-actin and myosin II, suggesting low frequencies of high-affinity interactions of LFA1/ICAM1 that need actomyosin and traction force.48 This finding is in agreement with our previous studies using single-molecule imaging that showed that high-affinity engagement with ICAM1 accounted for less than 10% of total LFA1-ICAM1 interactions.22 In contrast, a larger fraction of talin1 colocalized with myosin II in the non-adherent uropod (Figure 7D). Collectively, these results support the notion that talin activates actomyosin to form uropods at the rear, thereby restricting the contact membrane at the front that mediates transient integrin-dependent attachment (Figure 7E).
Figure 7.

Localization of talin1 during T cell migration
(A) Timelapse imaging of HT-talin1 during T cell migration on immobilized ICAM1 (5 μg/mL) and CCL21 (100 nM). Upper and lower images represent xy and xz projection images, respectively. Dotted lines represent the contact surface.
(B) Representative xy and xz projection images of HT-talin1, F-actin, and myosin II in WT and Tln1HT/wt T cells migrated on immobilized ICAM1 (5 μg/mL) and CCL21 (100 nM). Scale bar, 5 μm. Dotted lines represent the contact surface.
(C and D) Super-resolution radial fluctuation (SRRF) image of HT-talin1, F-actin, and myosin II at contact surface (C) and in uropod (D) with enlarged views of dotted areas (right). Arrowheads indicate HT-talin1 colocalized with F-actin (C) and F-actin in the vicinity of myosin II (D). Scale bar, 5 μm.
(E) A schematic view of Rap1/talin1 pathways in migrating cells on ICAM-1. Rap1 and talin1 to orchestrate chemotactic migration via both integrin-dependent adhesion and integrin-independent cell polarity. The DATA above are a representative of 2 experiments.
Examples of timelapse imaging of HT-talin1 in T cells during CCL21-induced T cell migration on ICAM1. Upper and lower images represent xy and xz projection images, respectively. 5s/frame.
Discussion
In this study, we have identified important functions and mechanisms of the integrin regulator Rap1 and talin1 in cell polarity and chemotaxis of naive T cells. With the introduction of quantitative measurements and AI, we showed that Rap1 had a polarization-organizing property to induce symmetry breaking with distinct cytoskeletal reorganizations, F-actin accumulation, and actomyosin, on opposing edges. We revealed the important role of Rap1 in this process through the spatiotemporal regulation of RhoA signaling to balance actin polymerization and actomyosin contraction via talin1. Furthermore, we demonstrated that the Rap1-talin1 axis plays a critical role in chemotactic migration.
Chemokines activate the Rho family GTPases Rac and RhoA through the heterotrimeric G proteins resulting in the reorganization of the distinct actin cytoskeleton—F-actin-rich pseudopods and uropods enriched with contractile actomyosin, respectively. Although both Rac and RhoA depend on PTX-sensitive Gi proteins in T cells stimulated with CCL21, the Rac–F-actin response occurred fully within a few seconds, whereas RhoA activation gradually increased over several minutes, forming uropods, as previously reported.49 Our results suggest that Rap1 translates the Rac-F-actin signal to RhoA-dependent contractile F-actin/myosin II complexes. Specifically, Rap1 induces the segregation of the two distinct actin cytoskeletons resulting in symmetry breaking; Rap1 is activated depending on F-actin scaffolds generated by the PI3K-DOCK2-Rac signaling and the activated Rap1 subsequently stimulates Rho signaling. As a result, the RhoA signaling induces MLC activation and contractile F-actin/myosin complexes demarcated with growing pseudopods, leading to well-developed bipolar structures of the cell. Thus, Rap1 signaling constitutes a positive linkage of the front-to-back signaling modules and allows the cooperative generation of F-actin ruffles and actomyosin to reorganize the actin cytoskeleton and shape changes (Figure S7). This modality of cell polarization enables synchronous reinforcement/attenuation of the front and back polarity to adapt to the fluctuation of chemokine stimulation. This mechanism sharply contrasts with that reported in neutrophil-like HL60 cells stimulated with fMLP. In this case, G12/G13 initiated the “backness” signal through RhoA, whereas Gi signaling transmits the “frontness” signal through the Rac-F-actin pathway.11 Since different heterotrimeric G proteins transmit a chemoattractant receptor signaling to distinct Rho family members, inhibition of either of the two pathways results in the domination of the other. However, this is not the case with T cells, in which both “frontness” of the Rac signal and “backness” of the RhoA signal are initiated by the same Gi signaling and generation of cell polarity.
We show that PI3K-DOCK2-Rac activation and F-actin is important for Rap1 activation upon chemokine stimulation. The disruption of F-actin inhibited the membrane translocation of Rap-GEFs RasGRP2 and C3G, indicating that F-actin act as scaffold for RasGRP2 and C3G RasGRP2 to activate Rap1. Although the exact mechanisms how F-actin regulates Rap-GEF translocation, RasGRP2 might translocate to the plasma membrane and membrane ruffles via a direct association with F-actin.50 Similarly, C3G, complexed with Able and CrkL, could translocate to the membrane via interaction with WAVE2–Arp2/3 complex.51
Previous studies reported a requirement of Mst1/Mst2 and NDR1/NDR2 kinases for RhoA activation in mature thymocytes and T cells stimulated with chemokines and sphingosine-1-phosphate.37,38 Mst1/Mst2 kinases directly associate with the Rap1-GTP-binding protein RAPL and are activated. Then, Mst1 phosphorylates and activates NDR1/2 kinases.21,38,41 In support of this notion, we demonstrated that Rap1-deficient T cells exhibit the defective phosphorylation of NDR1 kinase (Figure 4L). The absence of each component in the Rap1-RAPL-Mst1/2-NDR1/2 axis results in defective cell polarity of T cells,38,39,40 suggesting that these signaling components act in the same genetic pathway.
We showed the requirement of Rap1 in GEF-H1 accumulation in the posterior part of the cell body in polarized T cells. The activity of GEF-H1 is controlled by the phosphorylation and dephosphorylation of GEF-H1 in different cellular contexts.52,53,54 Our study suggests that one possible activation signaling of GEF-H1 is mediated by the Rap1-RAPL-Mst1/2-NDR1/2 pathway in T cells.42 Localized activation of RhoA drives cellular contractility through MLC phosphorylation downstream of the Rho-ROCK signaling axis. In this context, we revealed unexpected roles of talin1 for cell elongation and polarity development. Rap1 associates with and recruits talin directly or indirectly to the cytoplasmic tail of integrin β-subunits.20,23,55,56 Talin connects integrins with the actomyosin cytoskeleton, thereby activating integrins, leading to cytoskeletal reorganization and mechanotransduction by outside-in signaling.57,58,59,60 Since our experiment showed the inhibition of talin1 binding to the β2 tail had little impact on cell polarization, talin1 promotes cell polarization independent of integrin. We found that the Rap1-interacting F0 subdomain in talin FERM, rather than RIAM, was required for cell polarization suggesting that a direct association of Rap1 with talin1 regulates this process.
Integrin-independent roles of talin have been largely unexplored in leukocytes and other cells. While talin1 deficiency had a modest impact on RhoA activation in T cells stimulated with chemokines, it substantially decreased the total amounts and localization of pMLC in chemokine-stimulated T cells as well as that of mutant T cells exhibiting spontaneous cell polarity due to constitutive Rap1 activation. Although the exact mechanisms by which talin1 regulates MLC are unclear, talin1 might mediate an anchorage of cortical F-actin and myosin II complexes to the plasma membrane via PIP2-binding FERM subdomains and a rod domain that associates with F-actin, thereby supporting proper activation and localization of MLC, leading to contractile force generation.61,62 The close association of talin1 with F-actin and myosin II in the uropod of T cells supports this view. Collectively, our study provides strong evidence that Rap1 promotes cell polarization via RhoA signaling and talin1 (Figure S7).
RIAM and vinculin associated with talin1 and could organize actin cytoskeleton and actin-myosin contractile complexes to facilitate cell polarization in the downstream of talin1. RIAM links Rap1/talin1 to Ena/VASP proteins to facilitate F-actin polymerization.63,64 However, we showed that RIAM had a modest role for cell polarization. Consistently, Ena/VASP proteins do not seem to play an important role for naive T cell polarization, because naive T cell from Ena/VASP knockout mice exhibited normal migration to chemokine and homing to secondary lymphoid tissues.65 The role of vinculin in chemokine-induced T cell migration and polarity has not been elucidated yet, though vinculin mediates a linkage of integrin to actin cytoskeleton via talin166,67 and important for stable adhesion of lymphocytes as well as force generation.68,69 It is possible that the unfolding of the talin rod domain independently regulate actin bundling and force generation via vinculin69 In this context, the binding PI5KIγ and membrane PIP2 of the talin1 head domain might have a role in unfolding of the role.70
We and others previously demonstrated that T cells utilize integrin-dependent and independent migration modalities within lymph nodes, where fast lymphocyte migration is supported by transient interactions with dendritic cells and stromal cells.3,4,7 Visualization of talin1 in the 2-dimensional migration of T cells revealed the localization of talin1 in pseudopods and the contact membrane and non-adhering uropods in the rear. High co-localization of talin with F-actin and myosin II in non-adhering uropods suggests strong contractile force, preventing attachment at the rear, while only a fraction of its association with myosin II at the front allows lamellipodial protrusion and transient integrin-dependent attachment with weak traction force, generating a sliding mode of migration.71,72,73,74 Thus, talin1 has a dual role in rapid T cell migration through the regulation of cell adhesion and cell polarization (Figure S7).
Cell polarity of leukocytes and fast-moving cells alike are characterized by the segregation of activated Rac and Rho small GTPases,75,76 which provide cells with fundamental abilities to alter cell shapes, adhesiveness, and migration. This work will enable further studies to elucidate the precise mechanisms of Rap1 signaling to coordinate Rac and Rho with integrin functions to exert cellular functions in homeostatic and pathological processes.
Limitations of the study
Our study has revealed that Rap1 regulates integrin-independent cell polarization via RhoA and talin1 in chemokine-stimulated naive T cells. Our findings of the front-back development by Rap1 warrants further studies to determine activation mechanisms of the Rap1-RhoA and Rap1-talin1 axis, and to elucidate the importance of their integrin-independent roles in lymphocyte trafficking in health and disease.
STAR★Methods
Key resources table
| REAGENT or RESOURCE | SOURCE | IDENTIFIER |
|---|---|---|
| Antibodies | ||
| APC-Hamster anti-mouse CD3e | BioLegend | Cat# 100312 RRID AB_312 677 |
| FITC Rat anti-mouse CD11a | BioLegend | Cat# 101106 RRID AB_312 779 |
| PE Rat anti-mouse CD18 | BD Bioscience | Cat# 553293 RRID AB_394 762 |
| FITC Rat anti-mouse/human CD44 | BioLegend | Cat# 103008 RRID AB_312 959 |
| APC Rat anti-mouse/human CD44 | BioLegend | Cat# 103012 RRID AB_312 963 |
| FITC Rat anti-mouse ICAM1 | BioLegend | Cat# 116105 RRID AB_313 697 |
| FITC Rat anti-mouse ICAM2 | BioLegend | Cat# 105606 RRID AB_313 199 |
| FITC Rat anti-mouse VCAM1 | BioLegend | Cat# 105705 RRID AB_313 206 |
| Phospho-Myosin Light Chain 2 (Ser19) Antibody | Cell signaling technology | Cat# 3671; |
| Anti-Rac1: Mouse Mab | Cytoskeleton, Inc. | Cat# ARC03 RRID:AB_10709099 |
| Purified Mouse Anti-CDC42 | BD Transduction Laboratories | Cat# 610928; RRID: AB_398244 |
| Rho-GTP-antibody | NewEast Bioscience | Cat# 26904 |
| RhoA Antibody | Santa Cruz Biotechnology | Cat# sc-418 |
| GAP1-InsP4 BP (RASA3) Antibody | Santa Cruz Biotechnology | Cat# sc-398283 |
| Anti-Spa1 Antibody | abcam | Cat# ab85928 |
| Purified Non-muscle Myosin Heavy Chain II-A Antibody | BioLegend | Cat# AB_2734686 |
| Anti-STK38 Antibody | abcam | Cat# ab125131 |
| GEF-H1 antibody | GeneTex, Inc. | Cat# GTX125893 |
| Monoclonal Anti-α-Tubulin antibody (DM1A) | Sigma | Cat# T9026 |
| F(ab')2-Goat anti-Mouse IgG (H+L) Secondary Antibody, eFluor™ 660 | Thermo Fisher Scientific | Cat# 50-4010-82; RRID: AB_11042463 |
| Goat anti-Rabbit IgG (H+L) Highly Cross-Adsorbed Secondary Antibody, Alexa Fluor™ 488 | Thermo Fisher Scientific | Cat # A-11008; RRID: AB_143165 |
| Goat anti-Rabbit IgG (H+L) Highly Cross-Adsorbed Secondary Antibody, Alexa Fluor™ 555 | Thermo Fisher Scientific | Cat # A-21429; RRID: AB_2535849 |
| Rabbit anti-human IgG F(c) Antibody | Rockland | Cat# 609-4103 |
| Anti-rabbit IgG, HRP-linked Antibody | Cat# 7076; RRID: AB_330924 | Cat# 7074; RRID: AB_2099233 |
| Anti-mouse IgG, HRP-linked Antibody | Cat# 7076; RRID: AB_330924 | Cat# 7076; RRID: AB_330924 |
| Rat anti-mouse MAdCAM1 | ATCC | Cat# HB-292 |
| Chemicals, peptides, and recombinant proteins | ||
| Recombinant Mouse ICAM-1 Fc Chimera | Ueda et al.27 | N/A |
| Recombinant Fc Protein | Ueda et al.77 | N/A |
| Recombinant Fc protein | Ueda et al.77 | N/A |
| Recombinant Mouse CCL21/6Ckine Protein | R&D systems | Cat# 457-6C-025 |
| Recombinant Mouse CXCL12/SDF1 Protein | R&D systems | Cat# 350-NS-050 |
| Phalloidin-iFluor 647 Reagent | abcam | ab176759 |
| Phalloidin-iFluor 555 Reagent | abcam | ab176756 |
| SaraFluor650T ligand | Goryo chemical | Cat# A308-02 |
| Critical commercial assays | ||
| Mojosort Mouse CD3 T Cell Isolation Kit | BioLegend | Cat# 480031 |
| Western Lightning Plus-ECL | PerkinElmer | Cat# NEL 104001EA |
| Experimental models: Cell lines | ||
| The mouse pro-B cell line Ba/F3 | RIKEN | RCB4476 |
| Ba/F3.Tln1−/− | Kondo et al.22 | |
| Experimental models: Organisms/strains | ||
| Mouse: C57BL/6 | CLEA Japan | Ordering name: C57BL/6JJcl |
| Mouse: B6.Cg-Tg(CD4-cre)1Cwi N9 | Taconic | Stock No: 4196 |
| Mouse: B6.Rap1af/f; Rap1bf/f | Ueda et al.27 | N/A |
| Mouse: B6.Rasa3f/f | Stefanini et al.78 | N/A |
| Mouse: B6.Sipa1−/− | This paper | N/A |
| Mouse: Dock2−/− | Fukui et al.13 | N/A |
| Mouse: B6.129P2-Tln1tm4.1Crit | The National Mouse Archive | Strain ID: EM:04999 |
| Mouse: B6. Tln1HT/HT | Kamioka et al.79 | N/A |
| Mouse: Apbb1ip−/− | This paper | N/A |
| Mouse: B6.Itgb2W748A/W748A | This paper | N/A |
| Recombinant DNA | ||
| CSII EF MCS/GFP-RalGDS-RBD | Ueda et al.27 | N/A |
| CSII EF MCS/lifeact-Turquoise2 | This paper | N/A |
| CSII-EF MCS/GFP-RasGRP2 | This paper | N/A |
| CSII-EF MCS/GFP-C3G | Kondo et al.22 | N/A |
| pGEX-RalGDS-RBD | Ueda et al.27 | N/A |
| pGEX-PAK-CRIB | This paper | N/A |
| pCAG-HIVgp | RIKEN BRC | RDB04394 |
| pCMV-VSV-G-RSV-Rev | RIKEN BRC | RDB04393 |
| pcDNA4 HT-talin1 | Kondo et al.22 | N/A |
| pcDNA4 HT-talin1 F0 mutant | Kondo et al.22 | N/A |
| Software and algorithms | ||
| Matlab script for front -back polarity judgement | This paper | N/A |
| Matlab | MathWorks | https://matlab.mathworks.com/ |
| Excel | Microsoft | N/A |
| PRISM8 | GraphPad Software Inc. | https://www.graphpad.com |
| FlowJo v10 | BD Biosciences | N/A |
| Fiji | GitHub | https://fiji.sc/ |
| Other | ||
| 35 mm glass bottom dish | Matsunami glass, Japan | Cat# D11130H |
| Glutathione Sepharose 4B | Cytiva | Cat# 17075601 |
| 6.5 mm Transwell® with 5.0 μm Pore Polycarbonate Membrane Insert, Sterile | Corning | Cat# 3421 |
Resource availability
Lead contact
Further information and requests for resources and reagents should be directed to and will be fulfilled by the lead contact, Yoshihiro Ueda (uedayos@hirakata.kmu.ac.jp).
Materials availability
DNA constructs, cell lines and mouse lines generated in this study are available with a material transfer agreement. Requests should be directed to the lead contact, Yoshihiro Ueda (uedayos@hirakata.kmu.ac.jp).
Experimental model and study participant details
Animals
C57BL/6 mice were obtained from CLEA Japan Inc. The floxed Rap1a, Rap1b mice and Rasa3 mice were reported27,78 and floxed Tln1 was obtained from EUCOMM (Tln1tm4.1Crit).80 These strains were intercrossed with Cd4-cre transgenic mice (Taconic) for T-cell specific deletion. Dock2−/− mice were generated by Fukui et al.13 Sipa1-knockout mice were generated by Crisper/Cas9 technology with a guide RNA targeting exon 7 of the mouse sipa1 gene (TTACACGCCTAATAACCAGCA, Figures S3A and S3B). Likewise, Apbb1ip knockout mice were generated with a guide RNA targeting exon 3 of the mouse Apbb1ip gene (CCACCCGTAGAACCCATGCT). HaloTag-talin1 knock-in mice were generated by insertion of HaloTag at the n-terminal region.79 Itgb2W748A knock-in mice were generated by replacement of exon 15 of the mouse Itgb2 gene with mutant allele (Figures S6A and S6B). Littermates or age-matched adult mice (6–22 weeks old) carrying targeted loxP were used as WT controls for conditional knockout mice. Both sexes were used for experiments. All mice were maintained under specific pathogen-free conditions in the animal facility at Kansai Medical University. All animal experiments were performed in accordance with protocols approved by the Animal Care and Use Committee of Kansai Medical University (approval no. 22-101).
Method details
Antibodies and reagents
Anti-phospho-myosin light chain 2 (S19) was purchased from Cell Signaling Technologies. Antibodies specific for Rap1 and CDC42 were from BD Transduction Laboratories. Anti-Rac1 was from Cytoskeleton. Antibodies specific for RhoA, RASA3, and SIPA1 (N-terminus) were from Santa Cruz Biotechnology. Anti-talin1/2 (clone 8D4) and tubulin alpha mAbs were from Sigma Aldrich. Anti-NDR1, anti-SIPA1 (C-terminus), and anti-GEF-H1 were from Abcam and GeneTex. Fluorescent (FITC, PE, APC, eFlour450) antibodies specific for CD3 (clone 2C11) and CD44 (clone IM7), ICAM1, ICAM2, VCAM1 were from Biolegend or Phalloidin conjugated with iFlour 555 or iFlour 647 were purchased from Abcam. Fluorescent (eflour660, AlexaFlour 488, 555, 647) polyclonal anti-mouse IgG, anti-rabbit IgG, or anti-goat IgG antibodies were obtained from Invitrogen or eBioscience. Anti-phospho NDR1 and MAdCAM1 were generated by our laboratory.21 Recombinant CCL21 and CXCL12 were purchased from R&D systems. 5-(and -6)-Carboxyfluorescein diacetate succinimidyl ester (CFSE) and (5-(and-6)-(((4-chloromethyl) benzoyl)amino) tetramethylrhodamine (CMTMR) were from Invitrogen. Latrunculin A and Brebbistatin (ab120491) were obtained from AdipoGen and Abcam, respectively. Y27632 and wortmannin were from Sigma Aldrich. ICAM1 fused with Fc region of human IgG (ICAM1-Fc), GST-tagged RalGDS-RBD, and GST-tagged PAK-CRIB were generated by our laboratory.18 Stimulation conditions of chemokines and chemicals were optimized to types of cells and experimental systems.
Measurements of cell polarity
Purified T cells (1–2 x 10⁶/100 μL) or T cell blast were mixed with an equal volume of CCL21 (final 100 nM or 50 nM, respectively) in RPMI1640 containing 10 mM HEPES and 1% fetal calf serum (FCS) or bovine serum albumin (BSA) in 1.5 mL microtubes, and Ba/F3 cells were similarly mixed with an equal volume of CXCL12 (final concentration, 10 or 50 nM). Stimulated cells were incubated for the indicated times at 37°C, followed by fixation with 4% paraformaldehyde (PFA). Fixed cells were permeabilized and stained with iFlour647-conjugated phalloidin (1:5000) and FITC- or PE-conjugated anti-CD44 antibodies (1:50, 1:100, respectively) for 1 h. For pMLC and GEF-H1 clustering, cells were stained with anti-pMLC or anti-GEF-H1 (1:150, 1:500, respectively), followed by secondary Alexa 488-conjugated anti-rabbit IgG staining (1:1000). Images of 1–20 x 104 stained cells were acquired using an imaging flow cytometer (ImageStream X Mark II, Perkin Elmer) and analyzed using IDEAS Application v6.1 (Perkin Elmer) for parameters including area, aspect ratios, circularity, brightness, and intensity of phalloidin and CD44 in naïve T cells selected by gating single cells with area and width and further extracted the F-actin+CD44lo population (Figures S1A–S1D). Polarity parameter was determined from the distance of the brightness center between F-actin and CD44. Clustering of F-actin, CD44, pMLC, and GEF-H1 was defined as the gap distance value (pixel) between their brightness center and morphological center.
Transfer learning on deep convolutional neural network (CNN)
We sorted cell images exhibiting circularitylopolarityhiARlo and circularityhipolarityloARhi as polarized and unpolarized, respectively, and confirmed by visual inspection (Figure S2). After converting TIFF images of individual cells exported by IDEA software into 227 × 227 pixels of JPEG images, 90% of 263 unpolarized and 186 polarized images were used for training, and the remaining 10% for validation. The statistical difference in the polarized scores between cells from WT and KO mice was evaluated with the chi-square test. Our network parameters were initialized to the default parameter set provided for the deep CNN, ALEXNET, and then fine-tuned to the parameters of the last layer of the networks on our data via back-propagation by using two NVIDIA GeForce RTX 2080Ti graphic processing units. The loss function was defined as the cross-entropy between predicted probability and the true class labels, and the weights were trained by SGDM optimization with a learning rate of 0.0001 and momentum of 0.9.
Isolation of T lymphocytes
Primary T cells were enriched by magnetic cell sorting to more than 95% purity by using MojoSort (Biolegend). To enrich naïve T cells, an optimal dose of magnetic beads bound to anti-CD44 mAb (Biolegend, 10 μg mAb/100 μL beads) was mixed with T cells and incubated for 15 min. Then, the samples were subjected to magnetic sorting to deplete CD44hi effector cells.
Western blotting
Cells were lysed with lysis buffer (1%Triton X, 0.1M Tris-HCl pH7.5, 0.15M NaCl, 2 mM EDTA, aprotinin, PMSF). The lysed samples were subjected to electrophoresis and transferred onto PVDF membrane by semi-dry transfer. The membranes were washed with Tris buffer saline pH 7.3 containing 0.05% Tween 20 (TBST), blocked with TBST containing 5% skim milk and/or 5% BSA incubated with primary antibodies for 2–4 h at RT or overnight at 4°C. Then the membranes were washed with TBST a few times and incubated with secondary antibodies in blocking buffer at the concentration recommended by the manufacturer. Typical dilutions of primary Ab were: anti-RASA3 (1:500), anti-SIPA1 (1:1000), anti-tubulin (1:3000), anti-Rap1 (1:500), anti-Rac1(1:500), anti-CDC42 (1:500), anti-GEF-H1 (1:1000), anti-NDR1(1:500), and anti-phospho NDR1(1:500).
DNA constructs
cDNAs encoding mice RASGRP2, C3G were cloned by RT-PCR and verified by sequencing and subcloned in pEGFP-C1, CSII-EF-MCS, or pCDNA3.1-EF-neo.22 The DNA construct of Lifeact-mTurquoise2 was subcloned into CS-UBC-MCS-vectors from pLifeAct-mTurquoise2 (addgene #36201). To produce lentivirus for protein expression, 293T cells were transfected with polyethyleneimine and 1–3 μg of the lentiviral vector for a target, 1 μg of pCAG-HIVgp, and pCMV-VSV-G-RSV-Rev in a 10-cm dish. Thirty-six hours after transfection, the supernatant of the cell culture was harvested by ultracentrifugation at 50,000g (Beckman). Infectious titer of harvested viruses was determined on the basis of the proportion of 293T cells that were fluorescence positive, as determined by flow cytometry.
Detection of Rap1-GTP, Rac-GTP, and Cdc42-GTP by pull-down assays
Purified T cells (0.5–2 x10⁷) were stimulated with CCL21 in the absence or presence of latrunculin A (0.5–1 μM) or wortmannin (100 nM). Samples were then immediately lysed with one volume of 2 x lysis buffer (2% Triton X, 0.2 M Tris-HCl pH 7.5, 0.3 M NaCl, 30 mM MgCl2, aprotinin, PMSF) and subjected to pull-down assays using Glutathione Sepharose 4B (GE Healthcare) conjugated with GST-RalGDS-RBD for Rap1, or GST-PAK-CRIB for Rac1 and CDC42. Immunoblotting was performed by using antibodies specific for Rap1, Rac1, and CDC42.27
Flow cytometry
For intracellular staining of pMLC, RhoA, and RhoA-GTP, fixed cells were permeabilized with 1x eBioscience Permeabilization Buffer and stained with anti-pMLC (1:150), anti-RhoA (1:200), or anti-active RhoA (1:500) and secondary AlexaFlour488 anti-rabbit IgG or eFluor 660 F(ab')2-goat anti-mouse IgG (H+L) (1:200), respectively. Subsequently, samples were stained with APC or FITC anti-mouse CD44 (1:200) with 1% rat serum to distinguish naïve and effector T cells. To determine CCR7 expression, cells were stained by using CCL19-Fc and Fc, as a control, detected by using FITC anti-human IgG secondary antibodies.77 Samples were analyzed with FACS Canto II (BD Bioscience) or Attune NxT flow cytometer (Invitrogen). To calculate a pMLC level, MFI of pMLC in samples was normalized to the averaged MFI of unstimulated naive wild type T cells.
Transwell chemotaxis assays
T cells (1x10⁶) in 100 μL of RPMI1640/1% FCS/10 mM HEPES were loaded into the upper chamber of 24-well Transwell plates (5-μm pore; Costar) containing 600 μL of CCL21 (30 nM) in the lower chamber of each well. After incubation at 37°C in CO2 incubator for 1.5 h, the number of T cells in the lower chamber was measured by flow cytometry. Chemotaxis efficiencies were determined to be percentages of migrated cell numbers to input cell numbers.
Immunofluorescent microscopy
T cells were stimulated with 100 nM CCL21 and fixed with 2 volumes of 4% PFA at the times indicated in the figures. Fixed cells were washed with PBS and loaded onto glass-bottomed dishes precoated with poly-lysine. In some experiments, 1 × 10⁶ T cells were loaded on glass-bottomed dishes coated with ICAM1 (5 μg/mL) and CCL21 (100 ng/mL). After incubation for 10 min at 37°C in a CO2 incubator, cells were fixed using 4% PFA. For immunofluorescent staining, typically the samples were permeabilized with cytoskeleton permeabilization buffer for 1 min and washed and incubated with blocking buffer for 1 h. They were stained with fluorescently labeled phalloidin and primary antibodies (anti-pMLC, anti-GEF-H1, anti-myosin II) for 1–2 h and fluorescently labeled secondary antibodies. The images of stained samples were acquired using a FV3000 confocal microscope with 0.3 μm intervals of Z-stack SRRF imaging was performed by a Drangonfly microscope for SRRF imaging (Olympus) with a visual inspection of front, back and contact surface region in polarized cells.
Live imaging by confocal microscopy
Confocal live imaging of cells was conducted at 37°C in an incubation chamber filled with humidified 21% O2 and 5% CO2 gas.21 Cells expressing FP-fusion proteins (lifeact-Turquoise2, GFP-RalGDS RBD) were suspended in RPMI1640 containing 1% FCS and 10 mM HEPES and loaded onto a poly-l-lysine coated glass-bottomed dish set in the chamber. Time-lapse images were captured using 60× objective lens and an inverted microscope (IX73, Olympus) that was equipped with a spinning disk confocal unit (CSU-1, Yokogawa) attached with a CCD camera (iXonUltra, Andor). Image acquisition was controlled using a Metamorph software (Molecular Device). Time-lapse images were acquired at a 5.0 s after CCL21 stimulation with time 5.0-s interval.
For Halotag (HT)-Talin1 imaging, T cells from heterozygous Halotag knock-in mice were labeled with Saraflour 650T ligand. 5x10⁶ labeled cells were loaded on a glass-bottomed dish coated with ICAM1-Fc (5 μg/mL) and CCL21 (100 nM). The samples were subjected to live imaging by using a Dragonfly microscope (Olympus). Z-stack time-lapse imaging was performed at 4.0-s/1 μm intervals.
Detachment assay
A temperature-controlled parallel-plate flow chamber (FCS2, Bioptechs) were used for detachment assay. Anti-human IgG Fc specific antibodies (100 μg/mL, Rockland Immunochemicals) were coated overnight on a plastic dish and washed with PBS. Recombinant mouse ICAM1-Fc (1 μg/mL) was loaded on the disk and incubated for >2 h, followed by incubation of CCL21 (200 nM in PBS) at room temperature for 30 min. Then, the disk was placed in a FCS2 flow chamber. Purified T cells (2 × 10⁶/mL) in a warm medium (IMDM containing 1% FCS) were loaded into the chamber, and bright-field images were recorded every 5 s with a 4× objective lens and CCD camera (HAMAMATSU C2741). Cells were settled on ICAM1 for 5 min, shear stress was applied for 1 min at 2 dyn/cm2, with a stepwise increment of 1 dyn/cm2 every minute to 5 dyn/cm2, using a programmed syringe pump (FP-1000, MELQUEST). The attached cells were counted at the end of each shear stress by using an Integrated Morphometry Analysis program of Metamorph (Molecular Devices). Adhesion efficiencies were the percentages of attached cell numbers relative to input cell numbers. Shear stress was calculated with an equation of shear stress denoted by 6Qμ/wh2 (dyn/cm2), in which symbols represent: Q, flow rate (mL/min); m, viscosity (0.007 poise for buffer); w, chamber width (1.2 cm); and h, chamber height (0.1 mm).
Quantification and statistical analysis
P-values were calculated with Student’s t-test, chi-squared test by using Graphpad PRISM and Microsoft Excel. The threshold of statistical significance for all analyses was set at p < 0.05. The data are presented as means ± standard deviation of the mean, unless specified in Figure legends.
Acknowledgments
We thank Manami Nishimura, Rie Hamaguchi, and Keiko Kawai (all from Kansai Medical University) for their technical assistance. This study was supported by JSPS KAKENHI Grant Number 22H02623 (to TK), 25291047 (to TK), 23K06601 (to YU), 20K07554 (to YU), 16K08849 (to YU), and Grant-in-Aid for Scientific Research on Innovative Areas 22111003 (to TK), 25113720 (to YU), a grant for “Private University Research Branding Project on intractable immune and allergic diseases” from Kansai Medical University and NIH grant R35 HL144976 (to W.B.).
Author contributions
Y.U. and T.K. designed the experiments. Y.U. conducted the experiments and data analysis in their entirety. K.H. developed the artificial intelligence. Y.U, and T.K. generated Itgb2W748A knock-in, Apbb1ip and Sipa1 knockout mice. Y.K., W.B., and Y.F. generated the HaloTag-talin1 knock-in, floxed Rasa3, and Dock2 knockout mice, respectively. Y.U., Y.K., and S.H. generated the double, triple, and quad knockout mice. Y.U., N.K., and T.K. generated the DNA constructs. Y.U. and N.K. developed and performed the live imaging system. Y.K. performed the detachment assay. Y.U., T.K., N.K., Y.I., T.F., and Y.K. interpreted the data. Y.U. and T.K. wrote and edited the article.
Declaration of interests
The authors declare no competing interests.
Inclusion and diversity
We support inclusive, diverse, and equitable conduct of research.
Published: July 11, 2023
Footnotes
Supplemental information can be found online at https://doi.org/10.1016/j.isci.2023.107292.
Contributor Information
Yoshihiro Ueda, Email: uedayos@hirakata.kmu.ac.jp.
Tatsuo Kinashi, Email: kinashi@hirakata.kmu.ac.jp.
Supplemental information
Data and code availability
-
•
Original western blot images and microscopic data in this paper will be shared by the lead contact upon request (uedayos@hirakata.kmu.ac.jp).
-
•
All original code in this paper will be shared by the lead contact upon request (uedayos@hirakata.kmu.ac.jp).
-
•
Any additional information required to reanalyze the data reported in this paper is available from the lead contact upon request (uedayos@hirakata.kmu.ac.jp).
References
- 1.Springer T.A. Traffic signals on endothelium for lymphocyte recirculation and leukocyte emigration. Annu. Rev. Physiol. 1995;57:827–872. doi: 10.1146/annurev.ph.57.030195.004143. [DOI] [PubMed] [Google Scholar]
- 2.Butcher E.C., Picker L.J. Lymphocyte homing and homeostasis. Science. 1996;272:60–66. doi: 10.1126/science.272.5258.60. [DOI] [PubMed] [Google Scholar]
- 3.Jacobelli J., Friedman R.S., Conti M.A., Lennon-Dumenil A.M., Piel M., Sorensen C.M., Adelstein R.S., Krummel M.F. Confinement-optimized three-dimensional T cell amoeboid motility is modulated via myosin IIA-regulated adhesions. Nat. Immunol. 2010;11:953–961. doi: 10.1038/ni.1936. [DOI] [PMC free article] [PubMed] [Google Scholar]
- 4.Hons M., Kopf A., Hauschild R., Leithner A., Gaertner F., Abe J., Renkawitz J., Stein J.V., Sixt M. Chemokines and integrins independently tune actin flow and substrate friction during intranodal migration of T cells. Nat. Immunol. 2018;19:606–616. doi: 10.1038/s41590-018-0109-z. [DOI] [PubMed] [Google Scholar]
- 5.Woolf E., Grigorova I., Sagiv A., Grabovsky V., Feigelson S.W., Shulman Z., Hartmann T., Sixt M., Cyster J.G., Alon R. Lymph node chemokines promote sustained T lymphocyte motility without triggering stable integrin adhesiveness in the absence of shear forces. Nat. Immunol. 2007;8:1076–1085. doi: 10.1038/ni1499. [DOI] [PubMed] [Google Scholar]
- 6.Okada T., Cyster J.G. CC chemokine receptor 7 contributes to Gi-dependent T cell motility in the lymph node. J. Immunol. 2007;178:2973–2978. doi: 10.4049/jimmunol.178.5.2973. [DOI] [PubMed] [Google Scholar]
- 7.Katakai T., Habiro K., Kinashi T. Dendritic cells regulate high-speed interstitial T cell migration in the lymph node via LFA-1/ICAM-1. J. Immunol. 2013;191:1188–1199. doi: 10.4049/jimmunol.1300739. [DOI] [PubMed] [Google Scholar]
- 8.Gérard A., Patino-Lopez G., Beemiller P., Nambiar R., Ben-Aissa K., Liu Y., Totah F.J., Tyska M.J., Shaw S., Krummel M.F. Detection of rare antigen-presenting cells through T cell-intrinsic meandering motility, mediated by Myo1g. Cell. 2014;158:492–505. doi: 10.1016/j.cell.2014.05.044. [DOI] [PMC free article] [PubMed] [Google Scholar]
- 9.Ackerknecht M., Gollmer K., Germann P., Ficht X., Abe J., Fukui Y., Swoger J., Ripoll J., Sharpe J., Stein J.V. Antigen availability and DOCK2-driven motility govern CD4+ T cell interactions with dendritic cells in vivo. J. Immunol. 2017;199:520–530. doi: 10.4049/jimmunol.1601148. [DOI] [PubMed] [Google Scholar]
- 10.Sánchez-Madrid F., del Pozo M.A. Leukocyte polarization in cell migration and immune interactions. EMBO J. 1999;18:501–511. doi: 10.1093/emboj/18.3.501. [DOI] [PMC free article] [PubMed] [Google Scholar]
- 11.Xu J., Wang F., Van Keymeulen A., Herzmark P., Straight A., Kelly K., Takuwa Y., Sugimoto N., Mitchison T., Bourne H.R. Divergent signals and cytoskeletal assemblies regulate self-organizing polarity in neutrophils. Cell. 2003;114:201–214. doi: 10.1016/s0092-8674(03)00555-5. [DOI] [PubMed] [Google Scholar]
- 12.Suire S., Condliffe A.M., Ferguson G.J., Ellson C.D., Guillou H., Davidson K., Welch H., Coadwell J., Turner M., Chilvers E.R., et al. Gbetagammas and the Ras binding domain of p110gamma are both important regulators of PI(3)Kgamma signalling in neutrophils. Nat. Cell Biol. 2006;8:1303–1309. doi: 10.1038/ncb1494. [DOI] [PubMed] [Google Scholar]
- 13.Fukui Y., Hashimoto O., Sanui T., Oono T., Koga H., Abe M., Inayoshi A., Noda M., Oike M., Shirai T., Sasazuki T. Haematopoietic cell-specific CDM family protein DOCK2 is essential for lymphocyte migration. Nature. 2001;412:826–831. doi: 10.1038/35090591. [DOI] [PubMed] [Google Scholar]
- 14.Li H., Yang L., Fu H., Yan J., Wang Y., Guo H., Hao X., Xu X., Jin T., Zhang N. Association between Gαi2 and ELMO1/Dock180 connects chemokine signalling with Rac activation and metastasis. Nat. Commun. 2013;4:1706. doi: 10.1038/ncomms2680. [DOI] [PMC free article] [PubMed] [Google Scholar]
- 15.Kamakura S., Nomura M., Hayase J., Iwakiri Y., Nishikimi A., Takayanagi R., Fukui Y., Sumimoto H. The cell polarity protein mInsc regulates neutrophil chemotaxis via a noncanonical G protein signaling pathway. Dev. Cell. 2013;26:292–302. doi: 10.1016/j.devcel.2013.06.008. [DOI] [PubMed] [Google Scholar]
- 16.Wu J., Pipathsouk A., Keizer-Gunnink A., Fusetti F., Alkema W., Liu S., Altschuler S., Wu L., Kortholt A., Weiner O.D. Homer3 regulates the establishment of neutrophil polarity. Mol. Biol. Cell. 2015;26:1629–1639. doi: 10.1091/mbc.E14-07-1197. [DOI] [PMC free article] [PubMed] [Google Scholar]
- 17.Lee J.H., Katakai T., Hara T., Gonda H., Sugai M., Shimizu A. Roles of p-ERM and Rho-ROCK signaling in lymphocyte polarity and uropod formation. J. Cell Biol. 2004;167:327–337. doi: 10.1083/jcb.200403091. [DOI] [PMC free article] [PubMed] [Google Scholar]
- 18.Shimonaka M., Katagiri K., Nakayama T., Fujita N., Tsuruo T., Yoshie O., Kinashi T. Rap1 translates chemokine signals to integrin activation, cell polarization, and motility across vascular endothelium under flow. J. Cell Biol. 2003;161:417–427. doi: 10.1083/jcb.200301133. [DOI] [PMC free article] [PubMed] [Google Scholar]
- 19.Katagiri K., Hattori M., Minato N., Irie S.k., Takatsu K., Kinashi T. Rap1 is a potent activation signal for leukocyte function-associated antigen 1 distinct from protein kinase C and phosphatidylinositol-3-OH kinase. Mol. Cell Biol. 2000;20:1956–1969. doi: 10.1128/mcb.20.6.1956-1969.2000. [DOI] [PMC free article] [PubMed] [Google Scholar]
- 20.Zhu L., Yang J., Bromberger T., Holly A., Lu F., Liu H., Sun K., Klapproth S., Hirbawi J., Byzova T.V., et al. Structure of Rap1b bound to talin reveals a pathway for triggering integrin activation. Nat. Commun. 2017;8:1744. doi: 10.1038/s41467-017-01822-8. [DOI] [PMC free article] [PubMed] [Google Scholar]
- 21.Kondo N., Ueda Y., Kita T., Ozawa M., Tomiyama T., Yasuda K., Lim D.S., Kinashi T. NDR1-dependent regulation of Kindlin-3 controls high-affinity LFA-1 binding and immune synapse organization. Mol. Cell Biol. 2017;37 doi: 10.1128/MCB.00424-16. [DOI] [PMC free article] [PubMed] [Google Scholar]
- 22.Kondo N., Ueda Y., Kinashi T. Kindlin-3 disrupts an intersubunit association in the integrin LFA1 to trigger positive feedback activation by Rap1 and talin1. Sci. Signal. 2021;14 doi: 10.1126/scisignal.abf2184. [DOI] [PubMed] [Google Scholar]
- 23.Gingras A.R., Lagarrigue F., Cuevas M.N., Valadez A.J., Zorovich M., McLaughlin W., Lopez-Ramirez M.A., Seban N., Ley K., Kiosses W.B., Ginsberg M.H. Rap1 binding and a lipid-dependent helix in talin F1 domain promote integrin activation in tandem. J. Cell Biol. 2019;218:1799–1809. doi: 10.1083/jcb.201810061. [DOI] [PMC free article] [PubMed] [Google Scholar]
- 24.Gérard A., Mertens A.E.E., van der Kammen R.A., Collard J.G. The Par polarity complex regulates Rap1- and chemokine-induced T cell polarization. J. Cell Biol. 2007;176:863–875. doi: 10.1083/jcb.200608161. [DOI] [PMC free article] [PubMed] [Google Scholar]
- 25.del Pozo M.A., Cabañas C., Montoya M.C., Ager A., Sánchez-Mateos P., Sánchez-Madrid F. ICAMs redistributed by chemokines to cellular uropods as a mechanism for recruitment of T lymphocytes. J. Cell Biol. 1997;137:493–508. doi: 10.1083/jcb.137.2.493. [DOI] [PMC free article] [PubMed] [Google Scholar]
- 26.Serrador J.M., Alonso-Lebrero J.L., del Pozo M.A., Furthmayr H., Schwartz-Albiez R., Calvo J., Lozano F., Sánchez-Madrid F. Moesin interacts with the cytoplasmic region of intercellular adhesion molecule-3 and is redistributed to the uropod of T lymphocytes during cell polarization. J. Cell Biol. 1997;138:1409–1423. doi: 10.1083/jcb.138.6.1409. [DOI] [PMC free article] [PubMed] [Google Scholar]
- 27.Ueda Y., Kondo N., Ozawa M., Yasuda K., Tomiyama T., Kinashi T. Sema3e/Plexin D1 modulates immunological synapse and migration of thymocytes by Rap1 inhibition. J. Immunol. 2016;196:3019–3031. doi: 10.4049/jimmunol.1502121. [DOI] [PubMed] [Google Scholar]
- 28.Nombela-Arrieta C., Lacalle R.A., Montoya M.C., Kunisaki Y., Megías D., Marqués M., Carrera A.C., Mañes S., Fukui Y., Martínez-A C., Stein J.V. Differential requirements for DOCK2 and phosphoinositide-3-kinase gamma during T and B lymphocyte homing. Immunity. 2004;21:429–441. doi: 10.1016/j.immuni.2004.07.012. [DOI] [PubMed] [Google Scholar]
- 29.Real E., Faure S., Donnadieu E., Delon J. Cutting edge: Atypical PKCs regulate T lymphocyte polarity and scanning behavior. J. Immunol. 2007;179:5649–5652. doi: 10.4049/jimmunol.179.9.5649. [DOI] [PubMed] [Google Scholar]
- 30.Ishida D., Yang H., Masuda K., Uesugi K., Kawamoto H., Hattori M., Minato N. Antigen-driven T cell anergy and defective memory T cell response via deregulated Rap1 activation in SPA-1-deficient mice. Proc. Natl. Acad. Sci. USA. 2003;100:10919–10924. doi: 10.1073/pnas.1834525100. [DOI] [PMC free article] [PubMed] [Google Scholar]
- 31.Wu B., Zhang S., Guo Z., Wang G., Zhang G., Xie L., Lou J., Chen X., Wu D., Bergmeier W., et al. RAS P21 protein activator 3 (RASA3) specifically promotes pathogenic T helper 17 cell generation by repressing T-helper-2-cell-biased programs. Immunity. 2018;49:886–898.e5. doi: 10.1016/j.immuni.2018.09.004. [DOI] [PMC free article] [PubMed] [Google Scholar]
- 32.Kupzig S., Bouyoucef-Cherchalli D., Yarwood S., Sessions R., Cullen P.J. The ability of GAP1IP4BP to function as a Rap1 GTPase-activating protein (GAP) requires its Ras GAP-related domain and an arginine finger rather than an asparagine thumb. Mol. Cell Biol. 2009;29:3929–3940. doi: 10.1128/MCB.00427-09. [DOI] [PMC free article] [PubMed] [Google Scholar]
- 33.Sasaki A.T., Chun C., Takeda K., Firtel R.A. Localized Ras signaling at the leading edge regulates PI3K, cell polarity, and directional cell movement. J. Cell Biol. 2004;167:505–518. doi: 10.1083/jcb.200406177. [DOI] [PMC free article] [PubMed] [Google Scholar]
- 34.Megrelis L., El Ghoul E., Moalli F., Versapuech M., Cassim S., Ruef N., Stein J.V., Mangeney M., Delon J. Fam65b phosphorylation relieves tonic RhoA inhibition during T cell migration. Front. Immunol. 2018;9:2001. doi: 10.3389/fimmu.2018.02001. [DOI] [PMC free article] [PubMed] [Google Scholar]
- 35.Moalli F., Ficht X., Germann P., Vladymyrov M., Stolp B., de Vries I., Lyck R., Balmer J., Fiocchi A., Kreutzfeldt M., et al. The Rho regulator Myosin IXb enables nonlymphoid tissue seeding of protective CD8. J. Exp. Med. 2018;215:1869–1890. doi: 10.1084/jem.20170896. [DOI] [PMC free article] [PubMed] [Google Scholar]
- 36.Montresor A., Bolomini-Vittori M., Toffali L., Rossi B., Constantin G., Laudanna C. JAK tyrosine kinases promote hierarchical activation of Rho and Rap modules of integrin activation. J. Cell Biol. 2013;203:1003–1019. doi: 10.1083/jcb.201303067. [DOI] [PMC free article] [PubMed] [Google Scholar]
- 37.Mou F., Praskova M., Xia F., Van Buren D., Hock H., Avruch J., Zhou D. The Mst1 and Mst2 kinases control activation of rho family GTPases and thymic egress of mature thymocytes. J. Exp. Med. 2012;209:741–759. doi: 10.1084/jem.20111692. [DOI] [PMC free article] [PubMed] [Google Scholar]
- 38.Tang F., Gill J., Ficht X., Barthlott T., Cornils H., Schmitz-Rohmer D., Hynx D., Zhou D., Zhang L., Xue G., et al. The kinases NDR1/2 act downstream of the Hippo homolog MST1 to mediate both egress of thymocytes from the thymus and lymphocyte motility. Sci. Signal. 2015;8:ra100. doi: 10.1126/scisignal.aab2425. [DOI] [PubMed] [Google Scholar]
- 39.Katagiri K., Imamura M., Kinashi T. Spatiotemporal regulation of the kinase Mst1 by binding protein RAPL is critical for lymphocyte polarity and adhesion. Nat. Immunol. 2006;7:919–928. doi: 10.1038/ni1374. [DOI] [PubMed] [Google Scholar]
- 40.Katagiri K., Katakai T., Ebisuno Y., Ueda Y., Okada T., Kinashi T. Mst1 controls lymphocyte trafficking and interstitial motility within lymph nodes. EMBO J. 2009;28:1319–1331. doi: 10.1038/emboj.2009.82. [DOI] [PMC free article] [PubMed] [Google Scholar]
- 41.Katagiri K., Maeda A., Shimonaka M., Kinashi T. RAPL, a Rap1-binding molecule that mediates Rap1-induced adhesion through spatial regulation of LFA-1. Nat. Immunol. 2003;4:741–748. doi: 10.1038/ni950. [DOI] [PubMed] [Google Scholar]
- 42.Keller M., Dubois F., Teulier S., Martin A.P.J., Levallet J., Maille E., Brosseau S., Elie N., Hergovich A., Bergot E., et al. NDR2 kinase contributes to cell invasion and cytokinesis defects induced by the inactivation of RASSF1A tumor-suppressor gene in lung cancer cells. J. Exp. Clin. Cancer Res. 2019;38:158. doi: 10.1186/s13046-019-1145-8. [DOI] [PMC free article] [PubMed] [Google Scholar]
- 43.Han J., Lim C.J., Watanabe N., Soriani A., Ratnikov B., Calderwood D.A., Puzon-McLaughlin W., Lafuente E.M., Boussiotis V.A., Shattil S.J., Ginsberg M.H. Reconstructing and deconstructing agonist-induced activation of integrin alphaIIbbeta3. Curr. Biol. 2006;16:1796–1806. doi: 10.1016/j.cub.2006.08.035. [DOI] [PubMed] [Google Scholar]
- 44.Plak K., Pots H., Van Haastert P.J.M., Kortholt A. Direct interaction between TalinB and Rap1 is necessary for adhesion of Dictyostelium cells. BMC Cell Biol. 2016;17:1. doi: 10.1186/s12860-015-0078-0. [DOI] [PMC free article] [PubMed] [Google Scholar]
- 45.Klapproth S., Sperandio M., Pinheiro E.M., Prünster M., Soehnlein O., Gertler F.B., Fässler R., Moser M. Loss of the Rap1 effector RIAM results in leukocyte adhesion deficiency due to impaired β2 integrin function in mice. Blood. 2015;126:2704–2712. doi: 10.1182/blood-2015-05-647453. [DOI] [PMC free article] [PubMed] [Google Scholar]
- 46.Lim J., Wiedemann A., Tzircotis G., Monkley S.J., Critchley D.R., Caron E. An essential role for talin during alpha(M)beta(2)-mediated phagocytosis. Mol. Biol. Cell. 2007;18:976–985. doi: 10.1091/mbc.e06-09-0813. [DOI] [PMC free article] [PubMed] [Google Scholar]
- 47.Mitchison T.J., Cramer L.P. Actin-based cell motility and cell locomotion. Cell. 1996;84:371–379. doi: 10.1016/s0092-8674(00)81281-7. [DOI] [PubMed] [Google Scholar]
- 48.Comrie W.A., Babich A., Burkhardt J.K. F-actin flow drives affinity maturation and spatial organization of LFA-1 at the immunological synapse. J. Cell Biol. 2015;208:475–491. doi: 10.1083/jcb.201406121. [DOI] [PMC free article] [PubMed] [Google Scholar]
- 49.Ambriz-Peña X., García-Zepeda E.A., Meza I., Soldevila G. Jak3 enables chemokine-dependent actin cytoskeleton reorganization by regulating cofilin and Rac/Rhoa GTPases activation. PLoS One. 2014;9 doi: 10.1371/journal.pone.0088014. [DOI] [PMC free article] [PubMed] [Google Scholar]
- 50.Caloca M.J., Zugaza J.L., Vicente-Manzanares M., Sánchez-Madrid F., Bustelo X.R. F-actin-dependent translocation of the Rap1 GDP/GTP exchange factor RasGRP2. J. Biol. Chem. 2004;279:20435–20446. doi: 10.1074/jbc.M313013200. [DOI] [PubMed] [Google Scholar]
- 51.Nolz J.C., Nacusi L.P., Segovis C.M., Medeiros R.B., Mitchell J.S., Shimizu Y., Billadeau D.D. The WAVE2 complex regulates T cell receptor signaling to integrins via Abl- and CrkL-C3G-mediated activation of Rap1. J. Cell Biol. 2008;182:1231–1244. doi: 10.1083/jcb.200801121. [DOI] [PMC free article] [PubMed] [Google Scholar]
- 52.Zenke F.T., Krendel M., DerMardirossian C., King C.C., Bohl B.P., Bokoch G.M. p21-activated kinase 1 phosphorylates and regulates 14-3-3 binding to GEF-H1, a microtubule-localized Rho exchange factor. J. Biol. Chem. 2004;279:18392–18400. doi: 10.1074/jbc.M400084200. [DOI] [PubMed] [Google Scholar]
- 53.Fujishiro S.H., Tanimura S., Mure S., Kashimoto Y., Watanabe K., Kohno M. ERK1/2 phosphorylate GEF-H1 to enhance its guanine nucleotide exchange activity toward RhoA. Biochem. Biophys. Res. Commun. 2008;368:162–167. doi: 10.1016/j.bbrc.2008.01.066. [DOI] [PubMed] [Google Scholar]
- 54.Sandí M.J., Marshall C.B., Balan M., Coyaud É., Zhou M., Monson D.M., Ishiyama N., Chandrakumar A.A., La Rose J., Couzens A.L., et al. MARK3-mediated phosphorylation of ARHGEF2 couples microtubules to the actin cytoskeleton to establish cell polarity. Sci. Signal. 2017;10 doi: 10.1126/scisignal.aan3286. [DOI] [PMC free article] [PubMed] [Google Scholar]
- 55.Bromberger T., Zhu L., Klapproth S., Qin J., Moser M. Rap1 and membrane lipids cooperatively recruit talin to trigger integrin activation. J. Cell Sci. 2019;132 doi: 10.1242/jcs.235531. [DOI] [PMC free article] [PubMed] [Google Scholar]
- 56.Wen L., Marki A., Roy P., McArdle S., Sun H., Fan Z., Gingras A.R., Ginsberg M.H., Ley K. Kindlin-3 recruitment to the plasma membrane precedes high-affinity β2-integrin and neutrophil arrest from rolling. Blood. 2021;137:29–38. doi: 10.1182/blood.2019003446. [DOI] [PMC free article] [PubMed] [Google Scholar]
- 57.Giannone G., Jiang G., Sutton D.H., Critchley D.R., Sheetz M.P. Talin1 is critical for force-dependent reinforcement of initial integrin-cytoskeleton bonds but not tyrosine kinase activation. J. Cell Biol. 2003;163:409–419. doi: 10.1083/jcb.200302001. [DOI] [PMC free article] [PubMed] [Google Scholar]
- 58.Tadokoro S., Shattil S.J., Eto K., Tai V., Liddington R.C., de Pereda J.M., Ginsberg M.H., Calderwood D.A. Talin binding to integrin beta tails: a final common step in integrin activation. Science. 2003;302:103–106. doi: 10.1126/science.1086652. [DOI] [PubMed] [Google Scholar]
- 59.Ciobanasu C., Faivre B., Le Clainche C. Actomyosin-dependent formation of the mechanosensitive talin-vinculin complex reinforces actin anchoring. Nat. Commun. 2014;5:3095. doi: 10.1038/ncomms4095. [DOI] [PMC free article] [PubMed] [Google Scholar]
- 60.Yao M., Goult B.T., Klapholz B., Hu X., Toseland C.P., Guo Y., Cong P., Sheetz M.P., Yan J. The mechanical response of talin. Nat. Commun. 2016;7 doi: 10.1038/ncomms11966. [DOI] [PMC free article] [PubMed] [Google Scholar]
- 61.Tsujioka M., Yumura S., Inouye K., Patel H., Ueda M., Yonemura S. Talin couples the actomyosin cortex to the plasma membrane during rear retraction and cytokinesis. Proc. Natl. Acad. Sci. USA. 2012;109:12992–12997. doi: 10.1073/pnas.1208296109. [DOI] [PMC free article] [PubMed] [Google Scholar]
- 62.Kelley C.F., Litschel T., Schumacher S., Dedden D., Schwille P., Mizuno N. Phosphoinositides regulate force-independent interactions between talin, vinculin, and actin. Elife. 2020;9 doi: 10.7554/eLife.56110. [DOI] [PMC free article] [PubMed] [Google Scholar]
- 63.Lafuente E.M., van Puijenbroek A.A.F.L., Krause M., Carman C.V., Freeman G.J., Berezovskaya A., Constantine E., Springer T.A., Gertler F.B., Boussiotis V.A. RIAM, an Ena/VASP and Profilin ligand, interacts with Rap1-GTP and mediates Rap1-induced adhesion. Dev. Cell. 2004;7:585–595. doi: 10.1016/j.devcel.2004.07.021. [DOI] [PubMed] [Google Scholar]
- 64.Torres-Gomez A., Fiyouzi T., Guerra-Espinosa C., Cardeñes B., Clares I., Toribio V., Reche P.A., Cabañas C., Lafuente E.M. Expression of the phagocytic receptors α M β 2 and α X β 2 is controlled by RIAM, VASP and Vinculin in neutrophil-differentiated HL-60 cells. Front. Immunol. 2022;13 doi: 10.3389/fimmu.2022.951280. [DOI] [PMC free article] [PubMed] [Google Scholar]
- 65.Estin M.L., Thompson S.B., Traxinger B., Fisher M.H., Friedman R.S., Jacobelli J. Ena/VASP proteins regulate activated T-cell trafficking by promoting diapedesis during transendothelial migration. Proc. Natl. Acad. Sci. USA. 2017;114:E2901–E2910. doi: 10.1073/pnas.1701886114. [DOI] [PMC free article] [PubMed] [Google Scholar]
- 66.Izard T., Vonrhein C. Structural basis for amplifying vinculin activation by talin. J. Biol. Chem. 2004;279:27667–27678. doi: 10.1074/jbc.M403076200. [DOI] [PubMed] [Google Scholar]
- 67.Gingras A.R., Ziegler W.H., Frank R., Barsukov I.L., Roberts G.C.K., Critchley D.R., Emsley J. Mapping and consensus sequence identification for multiple vinculin binding sites within the talin rod. J. Biol. Chem. 2005;280:37217–37224. doi: 10.1074/jbc.M508060200. [DOI] [PubMed] [Google Scholar]
- 68.Saez de Guinoa J., Barrio L., Carrasco Y.R. Vinculin arrests motile B cells by stabilizing integrin clustering at the immune synapse. J. Immunol. 2013;191:2742–2751. doi: 10.4049/jimmunol.1300684. [DOI] [PubMed] [Google Scholar]
- 69.Atherton P., Stutchbury B., Wang D.Y., Jethwa D., Tsang R., Meiler-Rodriguez E., Wang P., Bate N., Zent R., Barsukov I.L., et al. Vinculin controls talin engagement with the actomyosin machinery. Nat. Commun. 2015;6 doi: 10.1038/ncomms10038. [DOI] [PMC free article] [PubMed] [Google Scholar]
- 70.Song X., Yang J., Hirbawi J., Ye S., Perera H.D., Goksoy E., Dwivedi P., Plow E.F., Zhang R., Qin J. A novel membrane-dependent on/off switch mechanism of talin FERM domain at sites of cell adhesion. Cell Res. 2012;22:1533–1545. doi: 10.1038/cr.2012.97. [DOI] [PMC free article] [PubMed] [Google Scholar]
- 71.Smith A., Bracke M., Leitinger B., Porter J.C., Hogg N. LFA-1-induced T cell migration on ICAM-1 involves regulation of MLCK-mediated attachment and ROCK-dependent detachment. J. Cell Sci. 2003;116:3123–3133. doi: 10.1242/jcs.00606. [DOI] [PubMed] [Google Scholar]
- 72.Uchida K.S.K., Kitanishi-Yumura T., Yumura S. Myosin II contributes to the posterior contraction and the anterior extension during the retraction phase in migrating Dictyostelium cells. J. Cell Sci. 2003;116:51–60. doi: 10.1242/jcs.00195. [DOI] [PubMed] [Google Scholar]
- 73.Wong K., Van Keymeulen A., Bourne H.R. PDZRhoGEF and myosin II localize RhoA activity to the back of polarizing neutrophil-like cells. J. Cell Biol. 2007;179:1141–1148. doi: 10.1083/jcb.200706167. [DOI] [PMC free article] [PubMed] [Google Scholar]
- 74.Houk A.R., Jilkine A., Mejean C.O., Boltyanskiy R., Dufresne E.R., Angenent S.B., Altschuler S.J., Wu L.F., Weiner O.D. Membrane tension maintains cell polarity by confining signals to the leading edge during neutrophil migration. Cell. 2012;148:175–188. doi: 10.1016/j.cell.2011.10.050. [DOI] [PMC free article] [PubMed] [Google Scholar]
- 75.Devreotes P., Horwitz A.R. Signaling networks that regulate cell migration. Cold Spring Harb. Perspect. Biol. 2015;7:a005959. doi: 10.1101/cshperspect.a005959. [DOI] [PMC free article] [PubMed] [Google Scholar]
- 76.Wang F. The signaling mechanisms underlying cell polarity and chemotaxis. Cold Spring Harb. Perspect. Biol. 2009;1:a002980. doi: 10.1101/cshperspect.a002980. [DOI] [PMC free article] [PubMed] [Google Scholar]
- 77.Ueda Y., Katagiri K., Tomiyama T., Yasuda K., Habiro K., Katakai T., Ikehara S., Matsumoto M., Kinashi T. Mst1 regulates integrin-dependent thymocyte trafficking and antigen recognition in the thymus. Nat. Commun. 2012;3:1098. doi: 10.1038/ncomms2105. [DOI] [PubMed] [Google Scholar]
- 78.Stefanini L., Paul D.S., Robledo R.F., Chan E.R., Getz T.M., Campbell R.A., Kechele D.O., Casari C., Piatt R., Caron K.M., et al. RASA3 is a critical inhibitor of RAP1-dependent platelet activation. J. Clin. Invest. 2015;125:1419–1432. doi: 10.1172/JCI77993. [DOI] [PMC free article] [PubMed] [Google Scholar]
- 79.Kamioka Y., Ueda Y., Kondo N., Tokuhiro K., Ikeda Y., Bergmeier W., Kinashi T. Distinct bidirectional regulation of LFA1 and α4β7 by Rap1 and integrin adaptors in T cells under shear flow. Cell Rep. 2023;42 doi: 10.1016/j.celrep.2023.112580. [DOI] [PMC free article] [PubMed] [Google Scholar]
- 80.Nieswandt B., Moser M., Pleines I., Varga-Szabo D., Monkley S., Critchley D., Fässler R. Loss of talin1 in platelets abrogates integrin activation, platelet aggregation, and thrombus formation in vitro and in vivo. J. Exp. Med. 2007;204:3113–3118. doi: 10.1084/jem.20071827. [DOI] [PMC free article] [PubMed] [Google Scholar]
Associated Data
This section collects any data citations, data availability statements, or supplementary materials included in this article.
Supplementary Materials
Examples of timelapse imaging of HT-talin1 in T cells during CCL21-induced T cell migration on ICAM1. Upper and lower images represent xy and xz projection images, respectively. 5s/frame.
Data Availability Statement
-
•
Original western blot images and microscopic data in this paper will be shared by the lead contact upon request (uedayos@hirakata.kmu.ac.jp).
-
•
All original code in this paper will be shared by the lead contact upon request (uedayos@hirakata.kmu.ac.jp).
-
•
Any additional information required to reanalyze the data reported in this paper is available from the lead contact upon request (uedayos@hirakata.kmu.ac.jp).