Abstract
Background
Response Evaluation Criteria in Prostate-specific Membrane Antigen (PSMA) PET/CT (RECIP 1.0) initially integrated software-based quantitative assessment of PSMA-positive total tumor volume (TTV). Clinical implementation of such software is not expected soon, limiting the use of RECIP in practice.
Purpose
To assess the agreement of RECIP determined using tumor segmentation software (quantitative RECIP) with RECIP determined by qualitative reads by nuclear medicine physicians (visual RECIP) for response evaluation in metastatic castration-resistant prostate cancer.
Materials and Methods
This multicenter retrospective study at three academic centers included men who received lutetium 177 (177Lu) PSMA treatment between December 2014 and July 2019. PSMA PET/CT images at baseline and 12 weeks were assessed qualitatively by five readers for changes in TTV and for new lesions. Quantitative changes in TTV were also measured using tumor segmentation software. The status of new lesions was combined with qualitative changes in TTV to determine visual RECIP and with quantitative changes in TTV to determine quantitative RECIP. The primary outcomes were the agreement between visual and quantitative RECIP and the interreader reliability of visual RECIP according to the Fleiss κ. The secondary outcome was the association of visual RECIP with overall survival according to Cox regression.
Results
A total of 124 men (median age, 73 years [IQR, 67–76 years]) were included. Forty (32%) and 84 (68%) men had quantitative RECIP progressive disease (PD) and non-PD, respectively. Agreement between visual versus quantitative RECIP was excellent (κ = 0.89; 118 of 124 men [95%]). Agreement among readers in classifying visual RECIP PD versus non-PD was excellent (κ = 0.81; 103 of 124 men [83%]). RECIP PD was associated with significantly shorter overall survival compared with non-PD (hazard ratio, 2.6 [95% CI: 1.7, 3.8]; P < .001).
Conclusion
Qualitatively assessed RECIP demonstrated excellent agreement with quantitative RECIP and excellent interreader reliability and can be readily implemented in clinical practice for response evaluation in men with metastatic castration-resistant prostate cancer undergoing 177Lu-PSMA therapy.
© RSNA, 2023
Summary
Response Evaluation Criteria in Prostate-specific Membrane Antigen PET/CT (RECIP 1.0) assessed qualitatively demonstrated excellent agreement with quantitative evaluation and excellent interreader reliability in metastatic castration-resistant prostate cancer.
Key Results
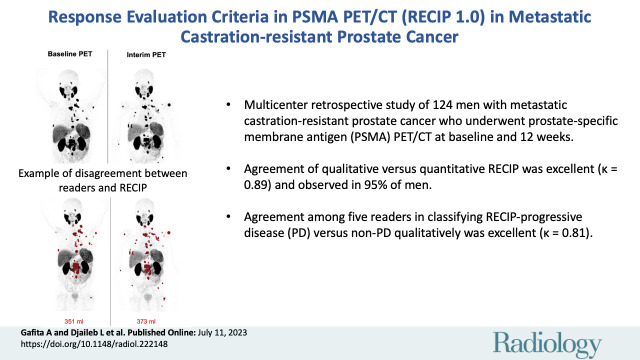
■ In a multicenter retrospective study of 124 men with metastatic castration-resistant prostate cancer who underwent prostate-specific membrane antigen (PSMA) PET/CT at baseline and 12 weeks, agreement of qualitative assessment versus quantitative Response Evaluation Criteria in PSMA PET/CT (RECIP) was excellent (κ = 0.89) and observed in 95% of men.
■ Agreement among five readers in classifying RECIP progressive disease (PD) versus non-PD qualitatively was excellent (κ = 0.81).
■ RECIP PD was associated with shorter overall survival compared with non-PD (hazard ratio, 2.6; P < .001).
Introduction
The availability of prostate-specific membrane antigen (PSMA) ligands for PET imaging (gallium 68 PSMA-11 [Illuccix, Telix] and fluorine 18 DCFPyL [Pylarify, Lantheus Holdings]) and approval of PSMA theranostics in the past 3 years has increased the number of men undergoing PSMA PET/CT for response evaluation in daily practice. Lutetium 177 (177Lu) PSMA-617 (Pluvicto; Advanced Accelerator Applications, a Novartis company) therapy is now approved in the United States and Europe for men with PSMA-positive metastatic castration-resistant prostate cancer who previously received taxane-based chemotherapy and androgen receptor signaling inhibitors.
Imaging-based progression-free survival is an efficacy end point accepted by the U.S. Food and Drug Administration in phase 3 clinical trials for drug approval in men with metastatic castration-resistant prostate cancer. Currently, objective response in metastatic castration-resistant prostate cancer is evaluated using bone scanning and CT in accordance with Prostate Cancer Working Group 3 criteria (1). However, PSMA PET/CT has a superior detection performance to bone scanning and CT (2). Hence, PSMA PET/CT may be used to identify progression earlier during treatment evaluation compared with bone scanning and CT and thereby improve clinical management.
An evidence-based framework for the response evaluation of systemic treatments for metastatic prostate cancer with use of PSMA PET/CT was recently proposed: Response Evaluation Criteria in PSMA PET/CT (RECIP 1.0; hereafter referred to as RECIP) (3). RECIP has demonstrated higher accuracy compared with Response Evaluation Criteria in Solid Tumors 1.1, or RECIST 1.1; Prostate Cancer Working Group 3 criteria; PET Response Criteria in Solid Tumors, or PERCIST; and PSMA PET Progression, or PPP, criteria for response evaluation using PSMA PET/CT (4). RECIP integrates the status of occurrence of new lesions and assessment of changes in PSMA-positive total tumor volume (TTV). In the original RECIP proposal, changes in TTV were quantified by using a segmentation software for whole-body tumor quantification (quantitative RECIP), but clinical implementation of tumor segmentation software is not expected soon. Hence, clinical use of RECIP is currently limited. This retrospective analysis aimed to assess the agreement of RECIP determined using tumor segmentation software (quantitative RECIP) with RECIP determined by qualitative reads by nuclear medicine physicians (visual RECIP) for response evaluation in metastatic castration-resistant prostate cancer.
Materials and Methods
Patients
This study was a multicenter retrospective analysis performed at three academic medical centers. All patients’ data have been previously reported (3–5). These prior publications dealt with the development of quantitative RECIP and the development of a nomogram to predict treatment outcome. In contrast to prior work, this study investigated whether RECIP interpreted by a qualitative method can be implemented immediately in daily practice.
Consecutive men with metastatic castration-resistant prostate cancer treated with 177Lu-PSMA-617 or 177Lu-PSMA-imaging and therapy (or I&T) between December 10, 2014, and July 19, 2019, at the Technical University Munich, University of California Los Angeles, and University Hospital Essen were screened for eligibility. Inclusion criteria were the availability of PSMA PET/CT images at baseline and after two cycles of treatment at 12 weeks ± 2 (interim PET) and the administration of the same PSMA-targeting radiotracer for the baseline and interim PET examinations. Men who (a) received only one cycle of 177Lu-PSMA, (b) did not undergo interim PET or images were not available, (c) underwent PSMA PET/MRI, (d) received different radiotracers for baseline PET and interim PET, or (e) underwent the interim PET examination beyond 12 weeks ± 2 were excluded (Fig 1). Treatment protocols are detailed in Appendix S1.
Figure 1:
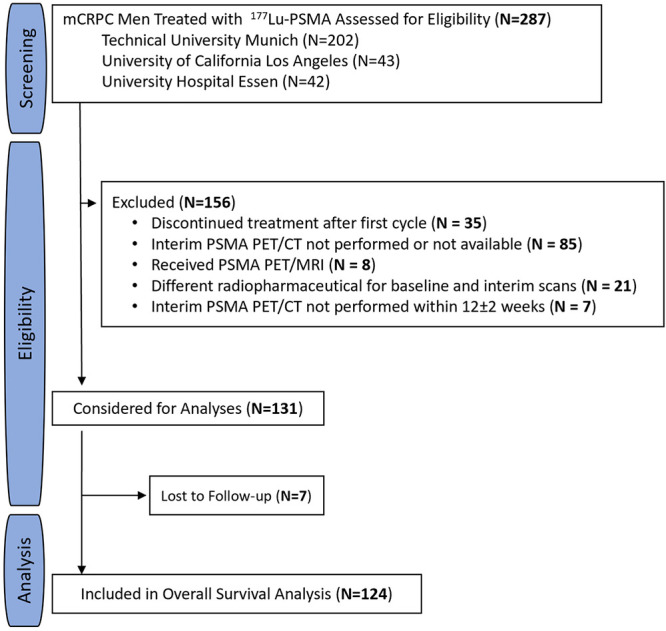
Study flowchart. In total, 287 men were screened at three academic centers. Of these, 156 (54%) did not meet inclusion criteria and were excluded. A total of 131 men (46%) met inclusion criteria and were considered for analyses. Seven of 131 men (5%) were lost to follow-up and excluded from the final analysis. Finally, 124 of 287 men (43%) were included in this study. 177Lu = lutetium 177, mCRPC = metastatic castration-resistant prostate cancer, PSMA = prostate-specific membrane antigen.
This Health Insurance Portability and Accountability Act–compliant analysis was approved by the ethics committee of each participating site (Technical University Munich 115/18S, University of California Los Angeles institutional review board #20–000954, and UKE 19–8570-BO), which waived the requirement for study-specific consent. Patient clinical information was collected anonymously from electronic medical records.
Imaging Acquisition
PSMA PET/CT was performed with Biograph 64 and Biograph mCT scanners (Siemens Healthineers). Eighty-nine of 124 men (72%) received 71–207 MBq (1.9–5.6 mCi) of gallium 68 PSMA-11, and 35 men (28%) received 126–400 MBq (3.4–10.8 mCi) of fluorine 18 rhPSMA-7/7.3. Images were obtained 44–107 minutes after the intravenous application of PSMA radiotracers. On the Biograph 64, PET data were acquired by using the ordered subset expectation maximization iterative algorithm, with two iterations and 24 subsets. On the Biograph mCT scanners, PET data were acquired by using the time-of-flight and point-spread function, with three iterations and 21 subsets (Table S1). The CT portion of PET/CT was a volumetric acquisition with iodine-based contrast enhancement and a section thickness of 3–5 mm.
Image Analyses
Images were interpreted independently by five experienced nuclear medicine physicians with varying degrees of clinical experience in PSMA PET/CT (I.R., 5 years; M.R.B., 1 year; M.W., 2 years; A.F., 6 years; and L.D., 3 years) (Table S2). Each reader was provided with a guideline for image interpretation (Appendix S1), was blinded to the outcome data, and was not involved in the study design. Readers were asked to interpret the baseline and 12-week PET/CT scans for (a) the response in TTV assessed qualitatively and (b) the occurrence of new lesions (Fig S1). Disagreement was resolved by majority rule.
New lesions.— The occurrence of a new lesion was defined as (a) tumor uptake of the PSMA ligand higher than that of the surrounding background, with tumor maximum standardized uptake value (SUVmax) higher than blood pool SUVmax, which was not present at baseline PET (tumor SUVmax lower than blood pool SUVmax) and tumor uptake not attributable to physiologic uptake or to factors known to affect uptake (6); or (b) any new malignant lesion detected on follow-up CT images independent of PSMA ligand uptake. The blood pool SUVmax was measured by placing a 2-cm-diameter spherical volume of interest in the aortic arch in the axial plane. The use of the blood pool uptake as a reference to define PSMA positivity for a tumor lesion was adopted from the Prostate Cancer Molecular Imaging Standardized Evaluation, or PROMISE (7).
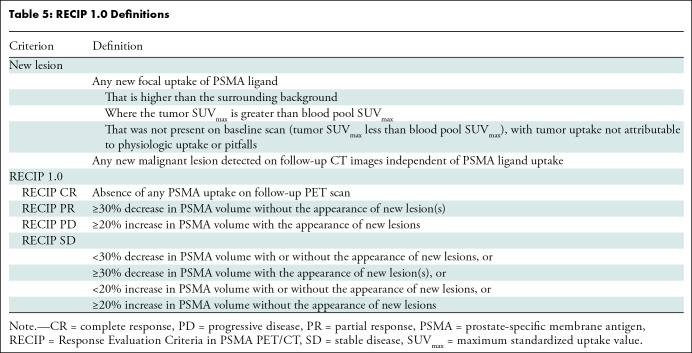
Response in tumor volume.— Changes in TTV were classified according to RECIP criteria: complete response (CR) was the absence of any PSMA uptake at interim PET; partial response (PR) was a 30% or greater decrease in TTV; progressive disease (PD) was a 20% or greater increase in TTV; and stable disease (SD) was a less than 30% decrease or a less than 20% increase. Changes in TTV were approximated qualitatively by means of side-by-side comparison of baseline and follow-up maximum intensity projection PET images. In borderline cases, additional analysis of axial sections was performed. The quantitative analysis of changes in TTV was performed by a nuclear medicine physician (A.G.) using dedicated software, qPSMA version 1.0 (8). Briefly, PSMA ligand–positive tumor identification and delineation were performed automatically at PET imaging with use of a standardized uptake value–based threshold; a cutoff of 3 was used for bone lesions, and a liver-based cutoff was used for soft-tissue lesions. Manual corrections were required in approximately 85% of cases because nonspecific PSMA ligand uptake was annotated as malignancy. TTV was obtained by calculating the volume of all PSMA ligand–positive tumor voxels.
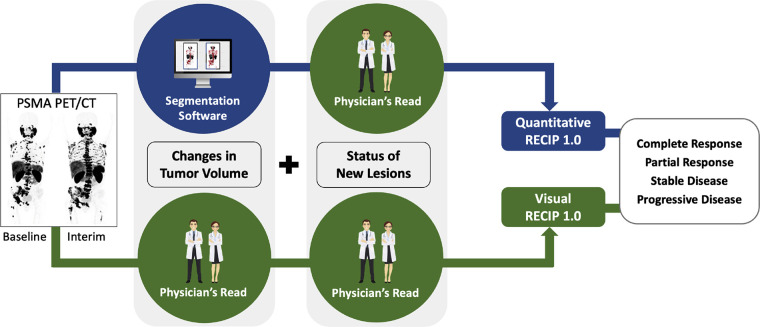
RECIP calculation.— The status of occurrence of new lesions determined by readers was combined with (a) qualitative responses in TTV to calculate visual RECIP and (b) quantitative responses in TTV obtained by qPSMA to calculate quantitative RECIP (Fig 2).
Figure 2:
Pictorial representation of visual Response Evaluation Criteria in Prostate-specific Membrane Antigen (PSMA) PET/CT (RECIP) and quantitative RECIP. RECIP combines changes in PSMA-positive total tumor volume (TTV) and the occurrence of new lesions. Changes in TTV can be determined quantitatively by using tumor segmentation software and combined with the occurrence of new lesions to calculate quantitative RECIP. Changes in TTV can be determined qualitatively by nuclear medicine physicians and combined with the occurrence of new lesions to calculate visual RECIP.
Statistical Analyses
The sample size for this study was derived on the basis of the available data, and no power calculation for sample size was performed upfront. Values are reported as medians with IQRs for continuous variables and numbers with percentages for categorical variables. Response according to RECIP was classified into PD, SD, PR, or CR and also dichotomized for the differentiation of clinically relevant PD versus non-PD (RECIP PD vs non-PD, where non-PD included CR, PR, and SD).
Qualitative versus quantitative analyses.— The agreement between responses in TTV determined by each reader qualitatively and by qPSMA software was evaluated using the Fleiss kappa statistic (κ) (9). The agreement between visual and quantitative RECIP determined by each reader was also evaluated with Fleiss κ. Receiver operating characteristic analysis was used to identify the best cutoff for changes in TTV obtained by qPSMA software to predict PD versus non-PD in TTV assessed with qualitative reads.
Interreader reliability.— The agreement among readers for evaluating the status of occurrence of new lesions, responses in TTV, and RECIP was assessed using Fleiss κ (9). Interreader agreement was considered poor (κ ≤ 0.20), fair (κ = 0.21–0.40), moderate (κ = 0.41–0.60), substantial (κ = 0.61–0.80), or excellent (κ = 0.81–0.99).
Prognostic value.— The associations between changes in the occurrence of new lesions, responses to TTV, and RECIP with overall survival were evaluated using univariable Cox regression analyses. Hazard ratios (HRs) and 95% CIs were derived. Kaplan-Meier analysis was used for overall survival, and the log-rank test was used to compare survival curves between groups of men. The median survival time and its 95% CI for each group of men and the entire cohort was calculated using Kaplan-Meier analysis. Kaplan-Meier curves were truncated when the number at risk fell below 10.
Outcomes.— The primary outcomes of our study were the agreement between visual and quantitative RECIP and the interreader agreement of visual RECIP (according to κ statistics). An excellent κ score (κ ≥ 0.81) was required to consider visual RECIP reliable for clinical implementation. The secondary outcome was the prognostic value of visual RECIP with overall survival (according to Cox regression). A statistically significant association with overall survival was required to consider visual RECIP a prognostic imaging marker for overall survival. P < .05 was considered indicative of statistically significant difference. All statistical analyses were performed using SPSS Statistics, version 27 (IBM).
Results
Patient Characteristics
In total, 124 of 287 screened men (43%) with metastatic castration-resistant prostate cancer were eligible and included. Of these patients, 115 (93%) were treated under compassionate access programs, while nine (7%) were enrolled in a phase 2 clinical trial (ClinicalTrials.gov identifier NCT03042312). Of the 287 screened men, 156 (54%) did not meet the inclusion criteria and were excluded. Of those, 85 (54%) were excluded because interim PET was not performed or images were not available, 35 (22%) because they received only one cycle of 177Lu-PSMA, 21 (13%) because they received different radiotracers for baseline PET and interim PET, eight (5%) because they underwent PSMA PET/MRI, and seven (4%) because they underwent the interim PET examination beyond 12 weeks ± 2. Seven of 287 men (3%) were lost to follow-up and were excluded from the final analysis.
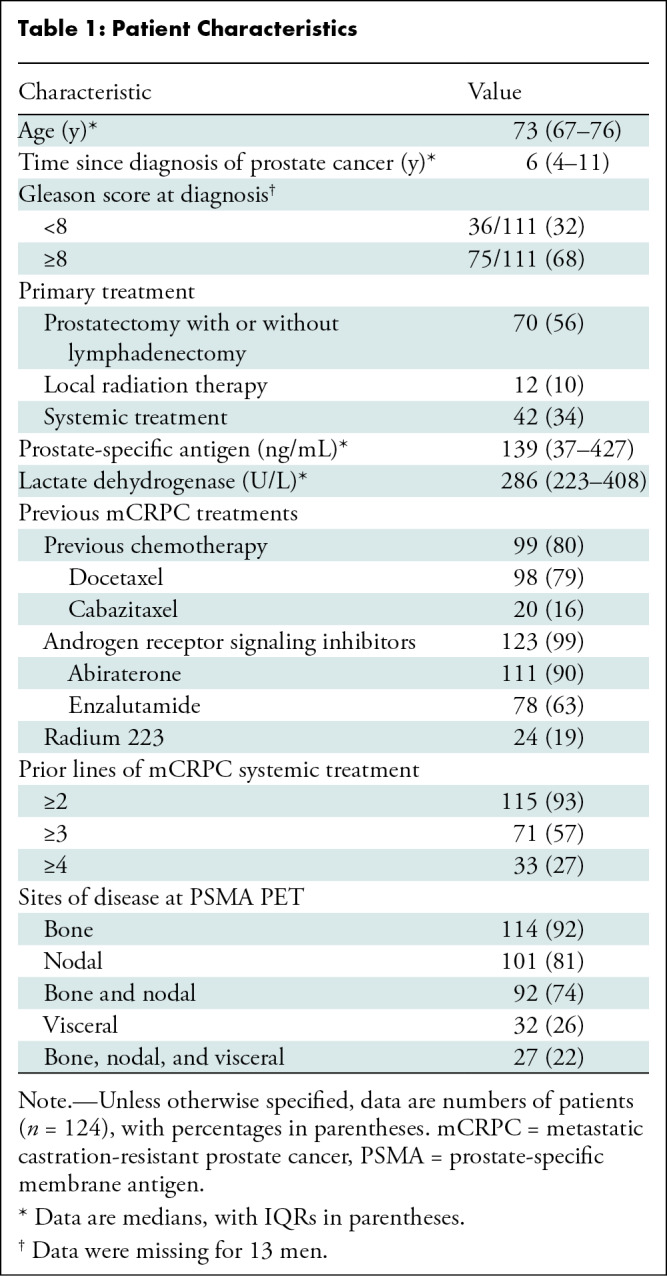
In the 124 men included in the final analysis, the median age was 73 years (IQR, 67–76 years). Of the included patients, 99 (80%) previously received taxane-based chemotherapy, and 123 (99%) received androgen receptor signaling inhibitors. The median prostate-specific antigen level at baseline was 139 ng/mL (IQR, 37–427 ng/mL). Detailed patient characteristics are given in Table 1. The data cutoff date for final analysis was July 1, 2022, and 119 of 124 men (96%) had died at the last follow-up. The median overall survival was 13.5 months (95% CI: 11.6, 15.4). The median follow-up for survivors was 43.0 months (IQR, 34.1–52.5 months).
Table 1:
Patient Characteristics
After the majority rule of the five readers for visual RECIP was applied, 41 of 124 men (33%) had RECIP PD, and 83 of 124 (67%) had non-PD; 0 of 124 (0%), 29 of 124 (23%), and 54 of 124 (44%) men had visual RECIP CR, PR, and SD, respectively.
Qualitative Assessment versus Quantitative Analyses
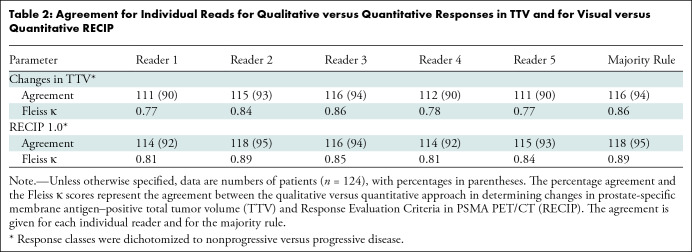
Response in tumor volume.— Agreement between qualitative and quantitative responses for classifying PD versus non-PD in TTV was observed in 111 of 124 (90%), 115 of 124 (93%), 116 of 124 (94%), 112 of 124 (90%), and 111 of 124 men (90%) for readers 1, 2, 3, 4, and 5, respectively. The best cutoff for percentage changes in TTV according to qPSMA software to detect PD versus non-PD according to the majority rule of qualitative reads was +17%. The area under the receiver operating characteristic curve was 0.95 (95% CI: 0.92, 0.99) (Fig S2). For classifying patients’ response into PD, SD, or PR, agreement was observed in 89 of 124 (72%), 100 of 124 (81%), 110 of 124 (89%), 79 of 124 (64%), and 85 of 124 men (69%) for readers 1, 2, 3, 4, and 5, respectively.
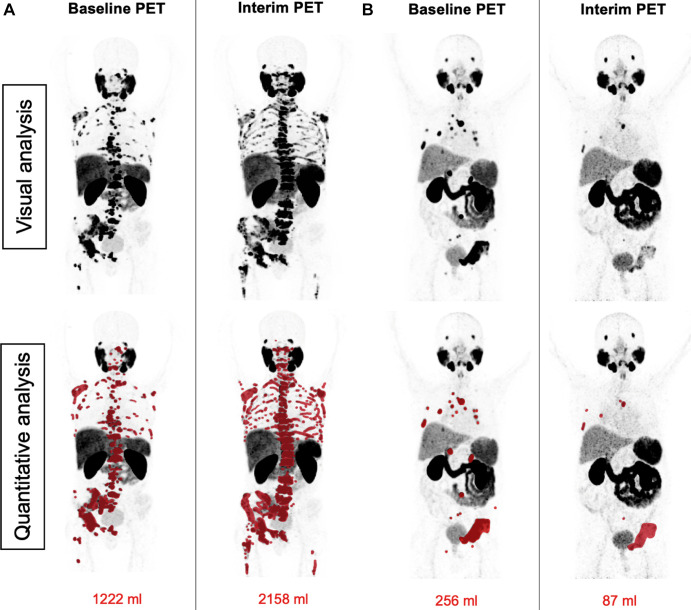
RECIP 1.0.— Agreement between visual and quantitative RECIP for classifying RECIP PD versus non-PD was observed in 114 of 124 (92%), 118 of 124 (95%), 116 of 124 (94%), 114 of 124 (92%), and 115 of 124 men (93%) for readers 1, 2, 3, 4, and 5, respectively. For classifying patients’ response into RECIP PR, SD, or PD, agreement was observed in 96 of 124 (77%), 107 of 124 (86%), 113 of 124 (91%), 89 of 124 (72%), and 95 of 124 men (77%) for readers 1, 2, 3, 4, and 5, respectively. The percentage agreement and Fleiss κ for visual RECIP versus quantitative RECIP are presented in Table 2. Patient examples for the assessment of visual RECIP versus quantitative RECIP are displayed in Figures 3 and 4.
Table 2:
Agreement for Individual Reads for Qualitative versus Quantitative Responses in TTV and for Visual versus Quantitative RECIP
Figure 3:
Patient examples of agreement between visual Response Evaluation Criteria in Prostate-specific Membrane Antigen (PSMA) PET/CT (RECIP) and quantitative RECIP. (A) Baseline and interim fluorine 18 rhPSMA-7.3 PET maximum intensity projection images in a 53-year-old man with metastatic castration-resistant prostate cancer previously treated with docetaxel, abiraterone, enzalutamide, and radium 223. The serum prostate-specific antigen value at baseline was 1457 ng/mL and increased after two cycles of lutetium 177 (177Lu) PSMA to 2598 ng/mL (78% increase). 177Lu-PSMA was discontinued after two cycles. All five readers detected at least one new lesion at the interim PET examination and classified this patient as having progression in PSMA-positive total tumor volume (TTV) and progressive disease (PD) according to visual RECIP. Quantitative analysis of TTV also showed progression in TTV from 1222 mL at baseline to 2158 mL at interim PET (77% increase). The tumor lesions were annotated using qPSMA software, version 1.0, and are highlighted in red on the maximum intensity projection images. Overall survival was 9.2 months. (B) Baseline and interim gallium 68 PSMA-11 PET maximum intensity projection images in a 78-year-old man with metastatic castration-resistant prostate cancer previously treated with docetaxel, abiraterone, and enzalutamide. The serum prostate-specific antigen level at baseline was 24 ng/mL and declined after two cycles of 177Lu-PSMA to 11 ng/mL (55% decrease). All five readers detected no new lesions at the interim PET examination and classified this as nonprogression in TTV and non-PD according to visual RECIP. Quantitative analysis of TTV showed a decline from 256 mL at baseline to 87 mL at interim PET (66% decrease) and non-PD according to quantitative RECIP. The tumor lesions delineated after tumor segmentation are highlighted in red on the maximum intensity projection images. A total of six cycles of 177Lu-PSMA were administered. Overall survival was 21.7 months.
Figure 4:
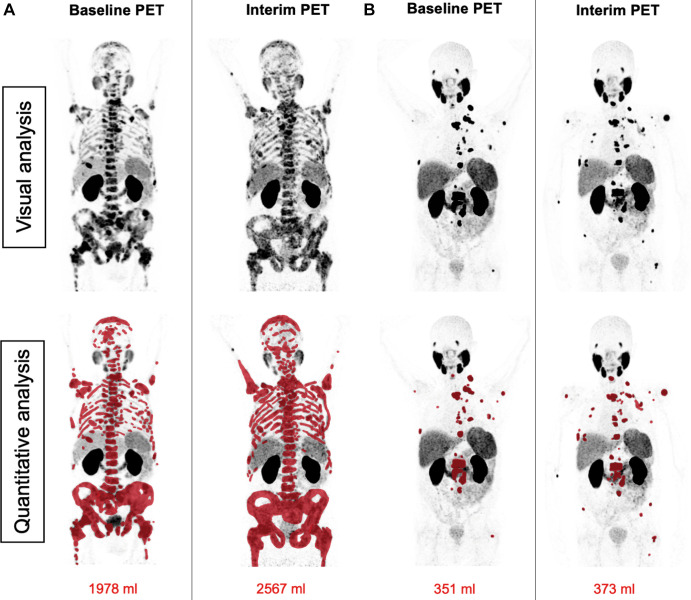
Patient examples of disagreement between visual Response Evaluation Criteria in Prostate-specific Membrane Antigen (PSMA) PET/CT (RECIP) and quantitative RECIP. (A) Fluorine 18 rhPSMA-7.3 PET maximum intensity projection images in a 77-year-old man with metastatic castration-resistant prostate cancer previously treated with docetaxel, abiraterone, and enzalutamide. The serum prostate-specific antigen level at baseline was 2547 ng/mL and declined after two cycles of lutetium 177 (177Lu) PSMA to 1866 ng/mL (27% decrease). All readers detected at least one new lesion at the interim PET examination. Three of five readers classified disease in this patient as nonprogression in PSMA-positive total tumor volume (TTV) (majority rule), which resulted in non–progressive disease (PD) according to visual RECIP. Quantitative analysis of TTV showed an increase from 1978 mL at baseline to 2567 mL at interim PET (30% increase; progression), and it was classified as PD according to quantitative RECIP. The tumor lesions were annotated using qPSMA software, version 1.0, and are highlighted in red on the maximum intensity projection images. A total of four cycles of 177Lu-PSMA were applied. Overall survival was 13.1 months. (B) Gallium 68 PSMA-11 PET maximum intensity projection images in a 69-year-old man with metastatic castration-resistant prostate cancer previously treated with abiraterone and enzalutamide and unfit for chemotherapy. The serum prostate-specific antigen level at baseline was 89 ng/mL and increased after two cycles of 177Lu-PSMA to 138 ng/mL (55% increase). All readers detected at least one new lesion at the interim PSMA PET/CT examination. Four of five readers classified this patient as having progression in TTV (majority rule), which resulted in PD according to visual RECIP. Quantitative analysis of TTV showed an increase from 351 mL at baseline to 373 mL on interim PET (6% increase; nonprogression), which resulted in non-PD according to quantitative RECIP. The tumor lesions are highlighted in red on the maximum intensity projection images. The treatment with 177Lu-PSMA was discontinued after two cycles. The overall survival in this patient was 20.5 months.
Interreader Reliability
New lesions.— In identifying new lesions, complete agreement among readers was observed in 82 of 124 men (66%) (substantial agreement: κ = 0.69). Pairwise agreement ranged between 100 of 124 (81%) and 112 of 124 (90%) (Table S3). The results of independent reads are displayed in Figure S3A.
Response in tumor volume.— In identifying PD versus non-PD, complete agreement among readers was observed in 104 of 124 men (84%) (excellent agreement: κ = 0.83). Pairwise agreement ranged between 111 of 124 (90%) and 117 of 124 men (94%) (Table S4). In classifying patients’ response into PD, SD, or PR, complete agreement was observed in 56 of 124 (45%) men (substantial agreement: κ = 0.61). Pairwise agreement ranged between 83 of 124 (67%) and 98 of 124 men (79%) (Table S4). The results of independent reads are displayed in Figure S3B and S3C.
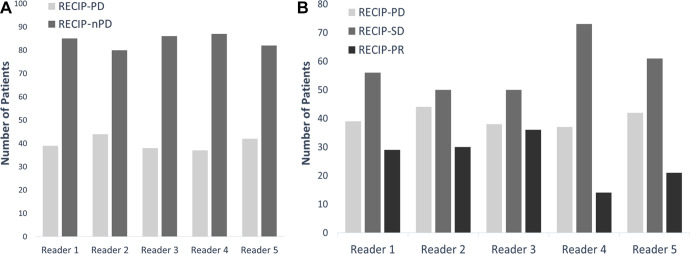
Visual RECIP.— In identifying RECIP PD versus non-PD, complete agreement among readers was observed in 103 of 124 men (83%) (excellent agreement: κ = 0.81). Pairwise agreement ranged between 111 of 124 (90%) and 118 of 124 men (95%) (Table 3). In classifying patients’ response into RECIP PD, SD, or PR, complete agreement was observed in 63 of 124 men (51%) (substantial agreement: κ = 0.61). Pairwise agreement ranged between 85 of 124 (69%) and 102 of 124 men (82%) (Table 4). The results of independent reads are displayed in Figure 5.
Table 3:
Pairwise Interreader Agreement for Visual RECIP and Quantitative RECIP in Identifying RECIP PD versus Non-PD
Table 4:
Pairwise Interreader Agreement for Visual RECIP and Quantitative RECIP in Classifying Patient Disease into RECIP PD, SD, or PR
Figure 5:
Bar graphs show results of independent reads (A) for visual Response Evaluation Criteria in Prostate-specific Membrane Antigen PET/CT (RECIP) progressive disease (PD) versus non-PD (nPD) and (B) for classifying disease into visual RECIP PD, RECIP stable disease (SD), or RECIP partial response (PR).
Quantitative RECIP.— In identifying quantitative RECIP PD versus non-PD, complete agreement among readers was observed in 114 of 124 men (92%) (excellent agreement: κ = 0.92). Pairwise agreement ranged between 117 of 124 (94%) and 123 of 124 men (99%) (Table 3). In classifying patients’ response into quantitative RECIP PD, SD, or PR, complete agreement was observed in 99 of 124 men (80%) (excellent agreement: κ = 0.86). Pairwise agreement ranged between 109 of 124 (88%) and 116 of 124 men (94%) (Table 4).
Prognostic Value
New lesions.— After the readers’ majority rule was applied, 64 of 124 men (52%) had the appearance of at least one new lesion at interim PET. The appearance of new lesions at interim PET was associated with significantly shorter overall survival (HR, 2.1 [95% CI: 1.5, 3.1]; P < .001) (Fig S4).
Response in tumor volume.— After the readers’ majority rule was applied, 41 of 124 (33%), 38 of 124 (31%), and 45 of 124 men (36%) had PR, SD, and PD, respectively, according to visual TTV. Overall survival was significantly shorter in men with PD compared with men with SD (HR, 2.2 [95% CI: 1.4, 3.4]; P < .001) or PR (HR, 2.7 [95% CI: 1.7, 4.4]; P < .001). Kaplan-Meier analysis of qualitative and quantitative changes in TTV with overall survival is displayed in Figure S5A and S5B, respectively.
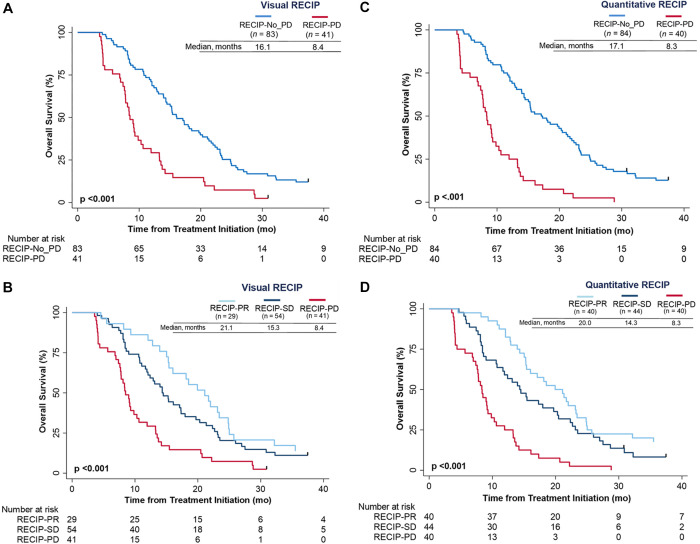
Visual RECIP.— Overall survival was significantly shorter in men with RECIP PD compared with men with non-PD (HR, 2.6 [95% CI: 1.7, 3.8]; P < .001) (Fig 6A). Men with RECIP PD had significantly shorter overall survival compared with men with RECIP SD (HR, 2.3 [95% CI: 1.5, 3.5]; P < .001) or RECIP PR (HR, 3.0 [95% CI: 1.8, 5.0]; P < .001) (Fig 6B). Associations of quantitative RECIP by majority rule with overall survival are displayed in Figure 6C and 6D. Associations of individual readers for visual RECIP and quantitative RECIP with overall survival are displayed in Figure S6.
Figure 6:
Kaplan-Meier plots show the association of overall survival with (A, B) visual Response Evaluation Criteria in Prostate-specific Membrane Antigen PET/CT (RECIP) and (C, D) quantitative RECIP determined by the readers’ majority rule. PD = progressive disease, PR = partial response, SD = stable disease.
Discussion
Response Evaluation Criteria in Prostate-specific Membrane Antigen (PSMA) PET/CT (RECIP 1.0) was developed previously for response evaluation in men with metastatic castration-resistant prostate cancer (3). RECIP combines changes in the PSMA-positive total tumor volume (TTV) and the occurrence of new lesions (Table 5). In the initial RECIP publication, changes in TTV were calculated using a segmentation software with automatic capabilities to quantify whole-body tumor burden, but clinical implementation of the software is not expected soon.
Table 5:
RECIP 1.0 Definitions
Our study investigated a qualitative method to determine RECIP (ie, visual RECIP); changes in TTV were determined qualitatively by nuclear medicine physicians and compared with changes determined quantitatively by a tumor segmentation software (ie, quantitative RECIP). Visual RECIP demonstrated excellent agreement with quantitative RECIP (κ = 0.89; 118 of 124 men [95%]) and excellent interreader agreement in identifying PD versus non-PD (κ = 0.81; 103 of 124 men [83%]). The predefined cutoff for interreader agreement level (κ ≥ 0.81) to consider visual RECIP reliable for clinical implementation was met. There was a significant association of visual RECIP with overall survival, which is promising for clinical practice.
The original RECIP classification includes four categories: RECIP CR, RECIP PR, RECIP SD, and RECIP PD. Visual RECIP classification based on these categories showed relatively high interreader variability (κ = 0.61; 63 of 124 men [51%]), potentially leading to misinterpretation and therefore making it unsuitable for clinical implementation. However, in daily practice, only the determination of PD versus non-PD is clinically relevant to identify patients in whom a treatment benefit is not being obtained and thus are candidates for treatment discontinuation.
The interreader agreement of quantitative RECIP was higher than that of visual RECIP (114 of 124 men [92%] vs 103 of 124 [83%]). Hence, we recommend the use of quantitative RECIP to evaluate objective tumor response in PSMA PET/CT whenever validated software with the capability for total tumor burden quantification becomes available. This might already be feasible in clinical trials, since the time required for objective response evaluation is not as essential as it is in clinical practice, and the standardization of scanning parameters among participating centers can be integrated into the study design. In daily practice, several limitations are yet to be overcome to enable the implementation of tumor segmentation software, such as the lengthy computational time (currently up to 6.8 minutes) (10).
Until the computational time of these technologies is reduced dramatically, evaluation of changes in TTV at PSMA PET/CT for PD versus non-PD can be performed qualitatively by physicians using the method proposed in this study. To enhance the interpretation of visual RECIP in practice, we created an educational platform (http://recip-criteria.com) that is freely available. The platform is intended to offer physicians the opportunity to gain experience in accurately interpreting changes in TTV by using PSMA PET images.
A cutoff of +17% change in TTV yielded the best differentiation between PD and non-PD at the qualitative reads by nuclear medicine physicians, which was close to the RECIP predefined cutoff of +20% used for quantitative changes in TTV to identify PD. These findings suggest that the identification of PD in TTV (defined as a 20% increase in TTV relative to baseline) at qualitative reads can be used in practice as a surrogate for quantitative changes derived from tumor segmentation software.
The interreader agreement for determining new lesions was moderate (82 of 124 men [66%]). Low image quality on the interim PSMA PET/CT scans was identified previously as a predictive factor for disagreement among readers in identifying new lesions (4). Nevertheless, by integrating changes in TTV in the response evaluation, the interreader agreement increased from 82 of 124 men (66%) to 103 of 124 (83%) for visual RECIP.
The main limitations of our study are first, its retrospective nature and second, its lack of an independent validation of the results. Third, the RECIP classification system was developed using the same patient cohort (3), which can lead to an overestimation of its prognostic value. Nevertheless, the primary objective of our study was to evaluate associations between visual RECIP and quantitative RECIP. Hence, the impact of using the same patient cohort is minimal.
In conclusion, Response Evaluation Criteria in Prostate-specific Membrane Antigen (PSMA) PET/CT (RECIP 1.0) assessed qualitatively demonstrated excellent interreader reliability and excellent agreement with RECIP determined using tumor segmentation software. The association with overall survival is promising for clinical practice. Further studies should investigate the value of PSMA PET/CT in guiding clinical management in men who receive lutetium 177 PSMA, and research on the prognostic value of RECIP for monitoring other systemic treatments for metastatic castration-resistant prostate cancer in men who are earlier in disease trajectory is also warranted.
A.G. and L.D. contributed equally to this work.
Supported by the Prostate Cancer Foundation (grant 21YOUN18). A.G. is supported by the Prostate Cancer Foundation (grant 21YOUN18), UCLA Jonsson Comprehensive Cancer Center fellowship award, and Dr. Christiaan Schiepers postdoctoral fellowship award. L.D. is the recipient of grant from the Fondation ARC pour la recherche sur le cancer, Nuovo Soldati foundation, and Phillipe foundation. W.P.F. is supported by the German Research Foundation (Deutsche Forschungsgemeinschaft) (grant FE1573/3-1/659216), Mercator Research Center Ruhr (An-2019-0001), IFORES (D/107-81260, D/107-30240), Doktor Robert Pfleger-Stiftung, and Wiedenfeld-Stiftung/Stiftung Krebsforschung Duisburg. B.H. is supported by the German Research Foundation (Deutsche Forschungsgemeinschaft) (DFG HA 5160/5-1). J.C. is supported by the Prostate Cancer Foundation (grants 20YOUN05 and 19CHAL02) and the Society of Nuclear Medicine and Molecular Imaging (2019 Molecular Imaging Research Grant for Junior Academic Faculty).
Data sharing: All data generated or analyzed during the study are included in the published paper.
Disclosures of conflicts of interest: A.G. No relevant relationships. L.D. No relevant relationships. I.R. No relevant relationships. W.P.F. Grants from SOFIE Biosciences and Bayer; consulting and/or speaker’s fees from Bayer, Janssen, Calyx, Novartis, Eczacıbaşı-Monrol, and Telix. B.H. Grants to institution from Advanced Accelerator Applications/Novartis, BMS, and the German Research Foundation; consulting fees from ABX, Amgen, AstraZeneca, Bayer, BMS, Janssen, Lightpoint Medical, and Pfizer; payment for lectures from Janssen; support for travel or attending meetings from Bayer and Janssen; participation on a data safety monitoring board or advisory board for Janssen. S.P.R. Grants from the National Institutes of Health, Department of Defense, Novartis, Curium, and Lantheus; licensed intellectual property to Precision Molecular and PlenaryAI; consulting fees from Lantheus, Imaging Endpoints, Precision Molecular, and PlenaryAI; speakers’ bureau payment from Lantheus; patents for radiopharmaceuticals targeting CAIX and FAP and for machine learning approaches to PET imaging; advisory board membership for Lantheus and Regeneron; stock or stock options in D&D Pharmatech and PlenaryAI. K.H. Grant from Boston Scientific; consulting fees from Bayer, SOFIE Biosciences, Sirtex, Advanced Accelerator Applications, Novartis, Curium, Boston Scientific, Ipsen, Siemens Healthineers, GE Healthcare, Amgen, Y-mAbs, Aktis Oncology, Theragnostics, Pharma15, Debiopharm, AstraZeneca, and Janssen; payment for lectures from Bayer, SOFIE Biosciences, Sirtex, Advanced Accelerator Applications, Novartis, Curium, Boston Scientific, Ipsen, Siemens Healthineers, GE Healthcare, Amgen, Y-mAbs, Aktis Oncology, Theragnostics, Pharma15, Debiopharm, AstraZeneca, and Janssen; support for travel or attending meetings from Bayer, SOFIE Biosciences, Sirtex, Advanced Accelerator Applications, Novartis, Curium, Boston Scientific, Ipsen, Siemens Healthineers, GE Healthcare, Amgen, Y-mAbs, Aktis Oncology, Theragnostics, Pharma15, Debiopharm, AstraZeneca, and Janssen; participation on a data safety monitoring board or advisory board for Bayer, SOFIE Biosciences, Sirtex, Advanced Accelerator Applications, Novartis, Curium, Boston Scientific, Ipsen, Siemens Healthineers, GE Healthcare, Amgen, Y-mAbs, Aktis Oncology, Theragnostics, Pharma15, Debiopharm, AstraZeneca, and Janssen; chair of the European Association of Nuclear Medicine Oncology & Theranostics Committee; stock or stock options in SOFIE Biosciences, AdvanCell, and Theragnostics. J.C. Grants to institution from Lantheus and Point Biopharma; consulting fees from Amgen, Astellas, Bayer, Blue Earth Diagnostics, Curium, DS Pharma, GE Healthcare, Isoray, Janssen, Lantheus, Lightpoint Medical, Novartis, Point Biopharma, Progenics Pharmaceuticals, RadioMedix, Sanofi, SOFIE Biosciences, and Telix; payment for lectures from IBA Radiopharma, Lantheus, Novartis, and Telix; participation on a data safety monitoring board or advisory board for RadioMedix. M.R. Grants or awards from the National Cancer Institute, Department of Veteran Affairs, Prostate Cancer Foundation, Progenics, NCCN/Pfizer/Myovant, and Merck; consulting fees from Ambryx, Amgen, Milagen, Orphagen, Myovant, and Roivant-Oncopia; payment for lectures from Bayer, Janssen, and Clovis; patent for inhibitors of the androgen receptor N-terminal domain; participation on a data safety monitoring board or advisory board for AstraZeneca, Bayer, Johnson & Johnson, and Myovant; leadership or fiduciary role in Aravalent, Oncovalent, and Suvalent. M.E. Grants to institution from BED and Bayer; consulting fees through institution from Novartis, BED, Telix, Janssen, and Point Biopharma; payment for lectures to institution from Novartis and Eckert & Ziegler; payment for image review from Parexel/Bioclinica; support for attending meetings or travel to institution from BED and Novartis; patent claim for rhPSMA; member of the European Association of Nuclear Medicine Theranostic Committee. M.W. Consulting fees from Boston Scientific; payment for lectures from Eli Lilly and Terumo; participation on a data safety monitoring board or advisory board from Advanced Accelerator Applications. M.R.B. No relevant relationships. A.F. No relevant relationships.
Abbreviations:
- CR
- complete response
- HR
- hazard ratio
- PD
- progressive disease
- PR
- partial response
- PSMA
- prostate-specific membrane antigen
- RECIP
- Response Evaluation Criteria in PSMA PET/CT
- SD
- stable disease
- SUVmax
- maximum standardized uptake value
- TTV
- PSMA-positive total tumor volume
References
- 1. Scher HI , Morris MJ , Stadler WM , et al . Trial design and objectives for castration-resistant prostate cancer: updated recommendations from the Prostate Cancer Clinical Trials Working Group 3 . J Clin Oncol 2016. ; 34 ( 12 ): 1402 – 1418 . [DOI] [PMC free article] [PubMed] [Google Scholar]
- 2. Hofman MS , Lawrentschuk N , Francis RJ , et al . Prostate-specific membrane antigen PET-CT in patients with high-risk prostate cancer before curative-intent surgery or radiotherapy (proPSMA): a prospective, randomised, multicentre study . Lancet 2020. ; 395 ( 10231 ): 1208 – 1216 . [DOI] [PubMed] [Google Scholar]
- 3. Gafita A , Rauscher I , Weber M , et al . Novel framework for treatment response evaluation using PSMA PET/CT in patients with metastatic castration-resistant prostate cancer (RECIP 1.0): an international multicenter study . J Nucl Med 2022. ; 63 ( 11 ): 1651 – 1658 . [DOI] [PMC free article] [PubMed] [Google Scholar]
- 4. Gafita A , Rauscher I , Fendler WP , et al . Measuring response in metastatic castration-resistant prostate cancer using PSMA PET/CT: comparison of RECIST 1.1, aPCWG3, aPERCIST, PPP, and RECIP 1.0 criteria . Eur J Nucl Med Mol Imaging 2022. ; 49 ( 12 ): 4271 – 4281 . [DOI] [PubMed] [Google Scholar]
- 5. Gafita A , Calais J , Grogan TR , et al . Nomograms to predict outcomes after 177Lu-PSMA therapy in men with metastatic castration-resistant prostate cancer: an international, multicentre, retrospective study . Lancet Oncol 2021. ; 22 ( 8 ): 1115 – 1125 . [DOI] [PubMed] [Google Scholar]
- 6. Shetty D , Patel D , Le K , Bui C , Mansberg R . Pitfalls in gallium-68 PSMA PET/CT interpretation—a pictorial review . Tomography 2018. ; 4 ( 4 ): 182 – 193 . [DOI] [PMC free article] [PubMed] [Google Scholar]
- 7. Eiber M , Herrmann K , Calais J , et al . Prostate Cancer Molecular Imaging Standardized Evaluation (PROMISE): proposed miTNM classification for the interpretation of PSMA-ligand PET/CT . J Nucl Med 2018. ; 59 ( 3 ): 469 – 478 . [DOI] [PubMed] [Google Scholar]
- 8. Gafita A , Bieth M , Krönke M , et al . qPSMA: semiautomatic software for whole-body tumor burden assessment in prostate cancer using 68Ga-PSMA11 PET/CT . J Nucl Med 2019. ; 60 ( 9 ): 1277 – 1283 . [DOI] [PMC free article] [PubMed] [Google Scholar]
- 9. McHugh ML . Interrater reliability: the kappa statistic . Biochem Med (Zagreb) 2012. ; 22 ( 3 ): 276 – 282 . [PMC free article] [PubMed] [Google Scholar]
- 10. Nickols N , Anand A , Johnsson K , et al . aPROMISE: a novel automated PROMISE platform to standardize evaluation of tumor burden in 18F-DCFPyL images of veterans with prostate cancer . J Nucl Med 2021. ; 63 ( 2 ): 233 – 239 . [DOI] [PubMed] [Google Scholar]


