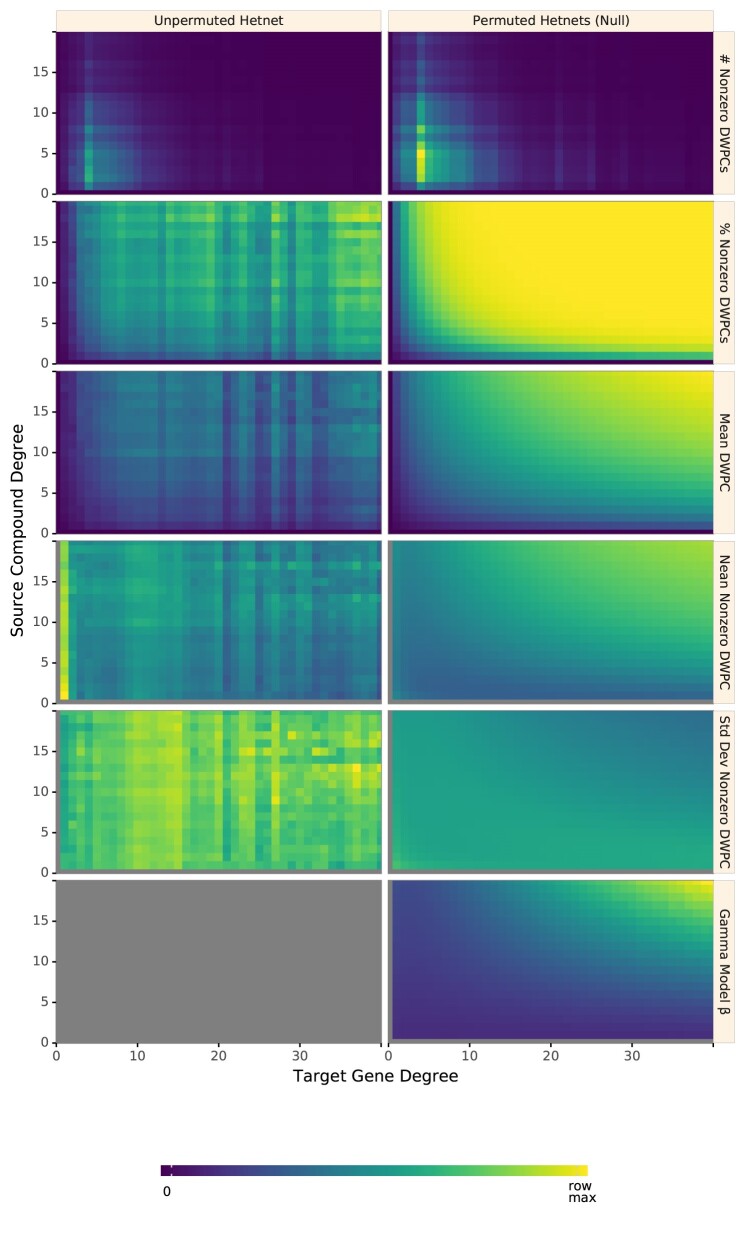
Figure 4:
Path-based metrics vary by node degree and network permutation status. Each row shows a different metric of the DWPC distribution for the CbGpPWpG metapath—traversing Compound–binds–Gene–participates–Pathway–participates–Gene, selected for illustrative purposes. Metrics are computed for degree-groups, which is a specific pair of source degree (in this case, the source compound's count of CbG edges) and target degree (in this case, the target gene's count of GpPW edges). Metrics are reported for the unpermuted hetnet on the left and for the 200 permuted hetnets on the right. Hence, each cell on the right summarizes 200 times the number of DWPCs as the corresponding cell on the left. The color map is row normalized, such that its intensity peaks for the maximum value of each metric across the unpermuted and permuted values. Gray indicates null values.

