

Abstract
Introduction
Risk evaluation for preeclampsia in early pregnancy allows identification of women at high risk. Prediction models for preeclampsia often include circulating concentrations of placental growth factor (PlGF); however, the models are usually limited to a specific PlGF method of analysis. The aim of this study was to compare three different PlGF methods of analysis in a Swedish cohort to assess their convergent validity and appropriateness for use in preeclampsia risk prediction models in the first trimester of pregnancy.
Material and methods
First‐trimester blood samples were collected in gestational week 11+0 to 13+6 from 150 pregnant women at Uppsala University Hospital during November 2018 until November 2020. These samples were analyzed using the different PlGF methods from Perkin Elmer, Roche Diagnostics, and Thermo Fisher Scientific.
Results
There were strong correlations between the PlGF results obtained with the three methods, but the slopes of the correlations clearly differed from 1.0: PlGFPerkinElmer = 0.553 (95% confidence interval [CI] 0.518–0.588) * PlGFRoche –1.112 (95% CI −2.773 to 0.550); r = 0.966, mean difference −24.6 (95% CI −26.4 to −22.8). PlGFPerkinElmer = 0.673 (95% CI 0.618–0.729) * PlGFThermoFisher –0.199 (95% CI −2.292 to 1.894); r = 0.945, mean difference −13.8 (95% CI −15.1 to −12.6). PlGFRoche = 1.809 (95% CI 1.694–1.923) * PlGFPerkinElmer +2.010 (95% CI −0.877 to 4.897); r = 0.966, mean difference 24.6 (95% CI 22.8–26.4). PlGFRoche = 1.237 (95% CI 1.113–1.361) * PlGFThermoFisher +0.840 (95% CI −3.684 to 5.363); r = 0.937, mean difference 10.8 (95% CI 9.4–12.1). PlGFThermoFisher = 1.485 (95% CI 1.363–1.607) * PlGFPerkinElmer +0.296 (95% CI −2.784 to 3.375); r = 0.945, mean difference 13.8 (95% CI 12.6–15.1). PlGFThermoFisher = 0.808 (95% CI 0.726–0.891) * PlGFRoche –0.679 (95% CI −4.456 to 3.099); r = 0.937, mean difference −10.8 (95% CI −12.1 to −9.4).
Conclusion
The three PlGF methods have different calibrations. This is most likely due to the lack of an internationally accepted reference material for PlGF. Despite different calibrations, the Deming regression analysis indicated good agreement between the three methods, which suggests that results from one method may be converted to the others and hence used in first‐trimester prediction models for preeclampsia.
Keywords: first‐trimester screening, method comparison, method correlation, preeclampsia, PlGF, placental growth factor, screening, ultrasound
Placental Growth Factor is often used in algorithms for first‐trimester prediction of preeclampsia. The PlGF methods have different calibrations but there is good consistency between the three methods allowing conversion of results from one method to the other.
Abbreviations
- PlGF
placental growth factor
- sFlt‐1
soluble fms‐like tyrosine kinase‐1
- VEGF
vascular endothelial growth factor
- VEGF R1
VEGF receptor 1
Key message.
Placental growth factor (PlGF) is often used in algorithms for first‐trimester prediction of preeclampsia. PlGF methods have different calibrations but there is good consistency between the three methods, allowing conversion of results from one method to another.
1. INTRODUCTION
Preeclampsia occurs in 3%–5% of all pregnancies in western high‐income countries, 1 and is one of the main causes of maternal and perinatal morbidity and mortality. 2 , 3 Identification of women at risk is important since early detection of preeclampsia has been shown to benefit the mother and the unborn child. 4 In addition, prophylactic aspirin treatment initiated in early pregnancy to high‐risk pregnancies decreases the incidence of preeclampsia up to 40%. 5 Different multivariable preeclampsia prediction models have been developed using a combination of maternal characteristics, medical history, biophysical examinations and blood‐based biomarkers. 6
One important blood‐based biomarker for preeclampsia prediction is placental growth factor (PlGF). PlGF is mainly expressed in the human placenta and umbilical cord during normal pregnancy conditions. 7 , 8 PlGF belongs to the vascular endothelial growth factor (VEGF) family involved in angiogenesis as well as the development and maintenance of the vascular and lymphatic endothelia. PlGF consists of 149 amino acids and binds to both membrane‐bound and soluble VEGF receptor 1 (VEGF R1), also called soluble fms‐like tyrosine kinase‐1 (sFlt‐1). In a non‐preeclamptic pregnancy, there is a clear increase in circulating PlGF levels from gestational week 14, reaching peak values at gestational weeks 27–30. After gestational week 30, the PlGF values starts to decline. 9 Circulating concentrations of PlGF are decreased in the first trimester in women who later in pregnancy develop preeclampsia 10 and intrauterine growth restriction. 11
Placental growth factor is currently included in several different prediction models for preeclampsia. 12 , 13 , 14 There is no internationally accepted calibrator for PlGF, leading to variable test results obtained from different laboratory platforms. The introduction of international reference standards is intended to reduce, if not eliminate, the calibration differences between different manufacturers.
Today, the main manufacturers of immune‐based PlGF analysis for clinical use are PerkinElmer, Roche Diagnostics and Thermo Fisher Scientific.
The objective of this study was to compare assay results obtained with the existing analytic platforms for determining circulating PlGF concentrations and to develop equations for converting PlGF results obtained with the different methods.
2. MATERIAL AND METHODS
This is an observational study comparing three different methods used to analyze PlGF from maternal serum of 150 pregnant women. Women were recruited within the IMPACT study 15 in gestational weeks 11+0 to 13+6 at Uppsala University Hospital's ultrasound department between November 2018 and November 2020. In Uppsala County, all obstetric ultrasound scans are performed at Uppsala University Hospital, and all pregnant women are offered a first‐trimester combined ultrasound and biochemical scan with an 80% acceptance rate. The women were included in the study after receiving written and oral information. Women who did not speak Swedish or were under 18 years of age were excluded from the study.
Serum samples were randomly chosen from the larger IMPACT study cohort and frozen at −80°C. For analysis of PlGF, samples were thawed, mixed, and centrifuged at 2400 g for 10 min before they were divided into three aliquots and subsequently frozen for shipment. The samples were sent to Stockholm, Uppsala, and Gothenburg to be analyzed by the platforms provided by Perkin Elmer, Roche Diagnostics, and Thermo Fisher, respectively. The time to assay was less than 2 months from shipment.
Delfia Express® Model: 6000–0010 (PerkinElmer, Turku, Finland) was used in Stockholm, Roche Diagnostics cobas e 601 analyzer (Roche Diagnostics GmbH, Mannheim, Germany) was used in Uppsala while BRAHMS PlGF plus KRYPTOR (Thermo Fisher Scientific, Hennigsdorf, Germany) was used in Gothenburg.
2.1. Statistical analyses
Method comparisons were performed using Deming regression analysis and the software Method Validator (Metz, France). The three methods were compared pairwise using linear regression and Deming analysis.
2.2. Ethics statement
The study was performed according to the Helsinki Declaration and informed consent was obtained. Confidentiality aspects such as data encryption and storage comply with the General Data Protection Regulation and with ethical committee requirements. This study has been granted national ethical approval by the Uppsala Ethics Committee (2018/231, 2020‐00319, 2022‐05690‐02) on July 4, 2018, February 12, 2020, and November 21, 2022 and national biobank approval at Uppsala Biobank (18 237 22 018 231).
3. RESULTS
3.1. General characteristics of the population
The women included were part of the IMPACT study, a population‐based cohort. All women were living in Uppsala County, including both urban and rural areas. In the county, the prevalence of preeclampsia is around 3%, 80% of the pregnant population is born in the Nordic countries, mean age at pregnancy is 30 years, 5% are smokers, mean body mass index at the beginning of pregnancy is 25 kg/m2, and 47% have an education of more than 12 years. 16
3.2. Method comparison Perkin Elmer and Roche Diagnostics
The Roche Diagnostics method gave approximately 80% higher values than the Perkin Elmer method. The 95% confidence interval [CI] of the intercept was not significantly different from 0 and the methods showed an r value for the correlation of 0.966 (Figure 1).
FIGURE 1.

Bland Altman plot showing the mean of Roche Diagnostics and Thermo Fisher placental growth factor results on the x‐axis and the difference between Roche Diagnostics and Thermo Fisher results on the y‐axis. The values are shown in ng/L.
PlGFPerkinElmer = 0.553 (95% CI 0.518–0.588) * PlGFRoche –1.112 (95% CI −2.773 to 0.550); r = 0.966, mean difference −24.6 (95% CI −26.4 to −22.8).
PlGFRoche = 1.809 (95% CI 1.694–1.923) * PlGFPerkinElmer +2.010 (95% CI −0.877 to 4.897); r = 0.966, mean difference 24.6 (95% CI 22.8–26.4).
3.3. Method comparison Perkin Elmer and Thermo Fisher
The Thermo Fisher method gave close to 50% higher values than the Perkin Elmer method. The 95% CI of the intercept was not significantly different from 0 and the methods showed an r value for the correlation of 0.945 (Figure 2).
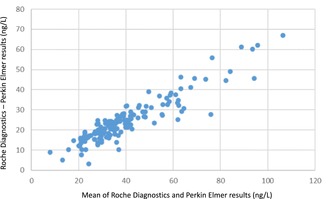
FIGURE 2.

Bland Altman plot showing the mean of Roche Diagnostics and Perkin Elmer placental growth factor results on the x‐axis and the difference between Roche Diagnostics and Perkin Elmer results on the y‐axis. The values are shown in ng/L.
PlGFPerkinElmer = 0.673 (95% CI 0.618–0.729) * PlGFThermoFisher –0.199 (95% CI −2.292 to 1.894); r = 0.945, mean difference −13.8 (−15.1 to −12.6).
PlGFThermoFisher = 1.485 (95% CI 1.363–1.607) * PlGFPerkinElmer +0.296 (95% CI −2.784 to 3.375); r = 0.945, mean difference 13.8 (95% CI 12.6–15.1).
3.4. Method comparison Roche Diagnostics and Thermo Fisher
The Roche Diagnostics method gave approximately 24% higher values than the Thermo Fisher method. The 95% CI of the intercept was not significantly different from 0 and the methods showed an r value for the correlation of 0.937 (Figure 3).
FIGURE 3.

Bland Altman plot showing the mean of Thermo Fisher and Perkin Elmer placental growth factor results on the x‐axis and the difference between Thermo Fisher and PerkinElmer results on the y‐axis. The values are presented in ng/L.
PlGFRoche = 1.237 (95% CI 1.113–1.361) * PlGFThermoFisher +0.840 (95% CI −3.684 to 5.363); r = 0.937, mean difference 10.8 (95% CI 9.4–12.1).
PlGFThermoFisher = 0.808 (95% CI 0.726–0.891) * PlGFRoche –0.679 (95% CI −4.456 to 3.099); r = 0.937, mean difference −10.8 (95% CI −12.1 to −9.4).
4. DISCUSSION
In the present study we show that the choice of PlGF method has a clear impact on the PlGF results. However, the r values were high, indicating that it might be possible to convert the PlGF results to allow for the comparison and merging of data generated by the three assays used in this study (see Figures 4, 5, 6).
FIGURE 4.

Bland Altman plot showing the mean of Roche Diagnostics and Thermo Fisher placental growth factor results on the x‐axis and the difference between Roche Diagnostics and Thermo Fisher results on the y‐axis. The difference on the y‐axis is presented as percentages of the mean values.
FIGURE 5.

Bland Altman plot showing the mean of Roche Diagnostics and Perkin Elmer placental growth factor results on the x‐axis and the difference between Roche Diagnostics and Perkin‐Elmer results on the y‐axis. The difference on the y‐axis is presented as percentages of the mean values.
FIGURE 6.

Bland Altman plot showing the mean of Thermo Fisher and Perkin Elmer placental growth factor results on the x‐axis and the difference between Thermo Fisher and Perkin Elmer results on the y‐axis. The difference on the y‐axis is presented as percentages of the mean values.
Placental growth factor is currently used in prediction models for preeclampsia and all different platforms are used in, for example, the Fetal Medicine Foundation model. 13 , 17 , 18 However, the focus has not been on comparing individual serum sample aliquots with all three major clinically used PlGF methods during first trimester. There are some studies comparing PlGF concentrations collected late in pregnancy. 19 , 20 One previous study, where the authors studied PlGF and VEGF R1 in pregnant women with preeclampsia/HELLP syndrome (hemolysis, elevated liver enzymes, low platelets), revealed differences in PlGF calibration between the Roche Diagnostics and Thermo Fisher methods during late pregnancy. 21 The median gestational length was 32 weeks for the early‐onset preeclampsia group and 38 weeks for the late‐onset group. Soluble VEGF R1 (or sFlt‐1) binds to PlGF and could potentially interfere by hiding the antibody‐binding epitopes when analyzing PlGF. Soluble VEGF R1 increases rapidly during pregnancy. 9 The ratio between PlGF and VEGF R1 will therefore vary depending on the gestational week and the presence of preeclampsia. Depending on the binding sites of the antibodies in the assays, this may interfere with the results of individual assays. Hence, the relationships between different PlGF methods in previous preeclampsia studies may not be valid when used for early pregnancy prediction. Another factor that makes it difficult to use data from method comparisons from different gestational weeks is that PlGF is glycosylated. Glycosylation is the most common of the post‐translational modifications of proteins. Glycosylation affects antibody binding for antibodies that are bound to glycosylated regions influencing the assay results. 22 Previous studies have shown that the glycosylation varies with week of gestation. The changes in transferrin glycosylation can increase disialotransferrin by approximately 50% before delivery. 23 This means that the correlation between different immunoassays may vary with week of gestation.
We investigated the potential instruments for PlGF testing in Sweden and evaluated those supplied by three of the largest suppliers used clinically in Sweden and internationally: PerkinElmer, Roche Diagnostics, and Thermo Fisher.
As of 2022 PlGF is a recommended biomarker in several international guidelines for preeclampsia management. 24 In theory, the PlGF assays could be centralized to a single laboratory in Sweden, but it would lead to longer test‐turnaround times and additional costs for transportation. Considering turnaround times, costs, and the number of PlGF assays needed to test all pregnant women in a first‐trimester preeclampsia prediction model, PlGF testing will most likely continue at a county level. Hence, PerkinElmer, Roche Diagnostics, or Thermo Fisher instrumentation would be chosen depending on the laboratory instrumentation available in the county. This means that there is a need to convert test results from one platform to the others to allow for a comparable cut‐off /threshold level.
To be able to use results from different manufacturers it is important to know the difference in slopes and intercepts between the methods. This is also of importance when interpreting results from scientific publications conducted with various PlGF methods. The linear regression equations presented in this article can be used as a direct translation between different commonly used PlGF platforms to facilitate the incorporation of PlGF into clinical prediction models. A strength of this study is that it used the same aliquot for all three methods and the samples were handled in the same way for all three assays. The samples were also from the preferred gestational age span (gestational weeks 12–14) for preeclampsia prediction. 25
We acknowledge that our study has limitations. One limitation is that the samples were frozen and thawed twice to ensure that they were handled identically for all three assays. The extra freezing–thawing cycle could influence the results but would most probably not affect the relation of the results between the different platforms. 26 We also acknowledge that all immunoassays can show lot‐to‐lot variation. In this study only one lot was used. All females recruited were Swedish residents with mainly Caucasian ethnicity, so it is uncertain whether the results are applicable to other ethnic groups, especially since the number of samples (n = 150) was limited. However, the high correlation is a strong indication that the results can be transferred to larger populations.
The different calibrations will most likely occasionally cause erroneous conclusions. It would therefore be valuable to have an international reference material to reduce method differences. However, this may take years to obtain and until then we need to use equations to align the results of the different methods when they are used in prediction algorithms.
5. CONCLUSION
Our results indicate that the commercial analytic platforms produced by Perkin Elmer, Roche Diagnostics, and Thermo Fisher for determining circulating PlGF concentrations have different calibrations. Despite this, there is good agreement between the three methods, which may allow for converting and then comparing results obtained from the different platforms. We encourage future research to develop conversion equations so that PlGF results from different manufacturers can be used interchangeably in first‐trimester preeclampsia prediction models.
AUTHOR CONTRIBUTIONS
AL, YC, AKW, and AS conceived and designed the study. AL, UG, and GO collected all data. AL, YC, and AKW analyzed the data. YC and AL wrote the manuscript and all authors provided intellectual input and approved the manuscript.
FUNDING INFORMATION
This work was supported by The Healthcare Board, Region Västra Götaland (YC, 931960, 968 567, 979 810), The Swedish Medical Society (YC, 2022), The Gothenburg Society of Medicine (YC, GLS‐973367), Frimurarfonden Barnhusdirektionen Foundation (YC, GLS 7000991), Wilhelm and Martina Lundgren foundation (YC 2018–2094), Hjalmar Svensson Foundation (YC, 2021), Mary von Sydow Foundation (YC, 2021), Regional research funds Uppsala/Örebro region (LB, AK RFR‐839171, 930 161), Center for clinical research, Falun (LB, CKFUU 795621, 895 291) and Region Skåne Research funds (SH, 2020–0281). The study was also financed by grants from the Swedish state under the agreement between the Swedish government and the county councils, the ALF agreement (YC, ALFGBG‐77860, 75 710; AS, ALFStockholm‐590 448).
CONFLICT OF INTEREST STATEMENT
Perkin Elmer, Roche Diagnostics and Thermo Fisher provided reagents used in this study for the analysis of placental growth factor free of charge. Roche Diagnostics and Thermo Fisher also contributed to analyses of placental growth factor (labor costs). YC is currently an employee of AstraZeneca.
ACKNOWLEDGMENTS
We thank Liza Oraha, MSc, Perkin Elmer, Roche Diagnostics, and Thermo Fisher for providing the PlGF reagents for the study. We also thank Associate Professor Erik Hunter for his valuable language check.
Carlsson Y, Sandström A, Bergman L, et al. Comparing the results from a Swedish pregnancy cohort using data from three automated placental growth factor immunoassay platforms intended for first‐trimester preeclampsia prediction. Acta Obstet Gynecol Scand. 2023;102:1084‐1091. doi: 10.1111/aogs.14615
REFERENCES
- 1. Chappell LC, Cluver CA, Kingdom J, Tong S. Pre‐eclampsia. Lancet. 2021;398:341‐354. [DOI] [PubMed] [Google Scholar]
- 2. Mol BWJ, Roberts CT, Thangaratinam S, Magee LA, de Groot CJM, Hofmeyr GJ. Pre‐eclampsia. Lancet. 2016;387:999‐1011. [DOI] [PubMed] [Google Scholar]
- 3. Grunewald C, Esscher A, Lutvica A, Paren L, Saltvedt S. Mödradöd i Sverige: Vården hade många gånger kunnat vara bättre ‐ Lärdomar från 11 års extern kollegial granskning. [Maternal deaths in Sweden: diagnostics and clinical management could be improved]. In Swedish. Lakartidningen. 2019;116:FPL4. [PubMed] [Google Scholar]
- 4. Organization WWH . In: Committee WGAbtGR , ed. WHO Recommendations for Prevention and Treatment of Pre‐Eclampsia and Eclampsia. World Health Organization; 2011. [PubMed] [Google Scholar]
- 5. Rolnik DL, Wright D, Poon LC, et al. Aspirin versus placebo in pregnancies at high risk for preterm preeclampsia. N Engl J Med. 2017;377:613‐622. [DOI] [PubMed] [Google Scholar]
- 6. Akolekar R, Syngelaki A, Poon L, Wright D, Nicolaides KH. Competing risks model in early screening for preeclampsia by biophysical and biochemical markers. Fetal Diagn Ther. 2013;33:8‐15. [DOI] [PubMed] [Google Scholar]
- 7. Gu Y, Lewis DF, Wang Y. Placental productions and expressions of soluble endoglin, soluble fms‐like tyrosine kinase receptor‐1, and placental growth factor in normal and preeclamptic pregnancies. J Clin Endocrinol Metab. 2008;93:260‐266. [DOI] [PMC free article] [PubMed] [Google Scholar]
- 8. Kingdom J, Huppertz B, Seaward G, Kaufmann P. Development of the placental villous tree and its consequences for fetal growth. Eur J Obstet Gynecol Reprod Biol. 2000;92:35‐43. [DOI] [PubMed] [Google Scholar]
- 9. Palm M, Basu S, Larsson A, Wernroth L, Akerud H, Axelsson O. A longitudinal study of plasma levels of soluble fms‐like tyrosine kinase 1 (sFlt1), placental growth factor (PlGF), sFlt1: PlGF ratio and vascular endothelial growth factor (VEGF‐A) in normal pregnancy. Acta Obstet Gynecol Scand. 2011;90:1244‐1251. [DOI] [PubMed] [Google Scholar]
- 10. Romero R, Nien JK, Espinoza J, et al. A longitudinal study of angiogenic (placental growth factor) and anti‐angiogenic (soluble endoglin and soluble vascular endothelial growth factor receptor‐1) factors in normal pregnancy and patients destined to develop preeclampsia and deliver a small for gestational age neonate. J Matern Fetal Neonatal Med. 2008;21:9‐23. [DOI] [PMC free article] [PubMed] [Google Scholar]
- 11. Asvold BO, Vatten LJ, Romundstad PR, Jenum PA, Karumanchi SA, Eskild A. Angiogenic factors in maternal circulation and the risk of severe fetal growth restriction. Am J Epidemiol. 2011;173:630‐639. [DOI] [PubMed] [Google Scholar]
- 12. O'Gorman N, Wright D, Poon LC, et al. Multicenter screening for pre‐eclampsia by maternal factors and biomarkers at 11‐13 weeks' gestation: comparison with NICE guidelines and ACOG recommendations. Ultrasound Obstet Gynecol. 2017;49:756‐760. [DOI] [PubMed] [Google Scholar]
- 13. Tan MY, Syngelaki A, Poon LC, et al. Screening for pre‐eclampsia by maternal factors and biomarkers at 11‐13 weeks' gestation. Ultrasound Obstet Gynecol. 2018;52:186‐195. [DOI] [PubMed] [Google Scholar]
- 14. Park HJ, Kim SH, Jung YW, et al. Screening models using multiple markers for early detection of late‐onset preeclampsia in low‐risk pregnancy. BMC Pregnancy Childbirth. 2014;14:35. [DOI] [PMC free article] [PubMed] [Google Scholar]
- 15. Bergman L, Sandstrom A, Jacobsson B, et al. Study for improving maternal pregnancy and child ouTcomes (IMPACT): a study protocol for a Swedish prospective multicentre cohort study. BMJ Open. 2020;10:e033851. [DOI] [PMC free article] [PubMed] [Google Scholar]
- 16. Petursdottir Maack H, Skalkidou A, Sjoholm A, et al. Maternal body mass index moderates antenatal depression effects on infant birthweight. Sci Rep. 2019;9:6213. [DOI] [PMC free article] [PubMed] [Google Scholar]
- 17. Mazer Zumaeta A, Wright A, Syngelaki A, Maritsa VA, Da Silva AB, Nicolaides KH. Screening for pre‐eclampsia at 11‐13 weeks' gestation: use of pregnancy‐associated plasma protein‐a, placental growth factor or both. Ultrasound Obstet Gynecol. 2020;56:400‐407. [DOI] [PubMed] [Google Scholar]
- 18. Poon LC, Shennan A, Hyett JA, et al. The International Federation of Gynecology and Obstetrics (FIGO) initiative on pre‐eclampsia: a pragmatic guide for first‐trimester screening and prevention. Int J Gynaecol Obstet. 2019;145(Suppl 1):1‐33. [DOI] [PMC free article] [PubMed] [Google Scholar]
- 19. Burke O, Benton S, Szafranski P, et al. Extending the scope of pooled analyses of individual patient biomarker data from heterogeneous laboratory platforms and cohorts using merging algorithms. Pregnancy Hypertens. 2016;6:53‐59. [DOI] [PubMed] [Google Scholar]
- 20. Staff AC , Burke O, Benton S, et al. Maternal circulating PlGF concentrations and placenta‐related pregnancy complications: first results from the CoLab AngF Study. Pregnancy Hypertens. 2013;3:59. [DOI] [PubMed] [Google Scholar]
- 21. Stepan H, Hund M, Dilba P, Sillman J, Schlembach D. Elecsys(R) and Kryptor immunoassays for the measurement of sFlt‐1 and PlGF to aid preeclampsia diagnosis: are they comparable? Clin Chem Lab Med. 2019;57:1339‐1348. [DOI] [PubMed] [Google Scholar]
- 22. Li L, Semenov AG, Feygina EE, et al. Diagnostic utility of total NT‐proBNP testing by immunoassay based on antibodies targeting glycosylation‐free regions of NT‐proBNP. Clin Chem Lab Med. 2023;61:485‐493. [DOI] [PubMed] [Google Scholar]
- 23. Kenan N, Larsson A, Axelsson O, Helander A. Changes in transferrin glycosylation during pregnancy may lead to false‐positive carbohydrate‐deficient transferrin (CDT) results in testing for riskful alcohol consumption. Clin Chim Acta. 2011;412:129‐133. [DOI] [PubMed] [Google Scholar]
- 24. Guidelines N . PLGF‐based testing to help diagnose suspected preterm pre‐eclampsia. Diagnostics Guidance [DG49]. 2022;27 July 2022.
- 25. Tan MY, Wright D, Syngelaki A, et al. Comparison of diagnostic accuracy of early screening for pre‐eclampsia by NICE guidelines and a method combining maternal factors and biomarkers: results of SPREE. Ultrasound Obstet Gynecol. 2018;51:743‐750. [DOI] [PubMed] [Google Scholar]
- 26. Cowans NJ, Alfthan H, Stenman UH, Spencer K. Stability of first trimester placental growth factor in serum and whole blood. Prenat Diagn. 2011;31:1193‐1197. [DOI] [PubMed] [Google Scholar]