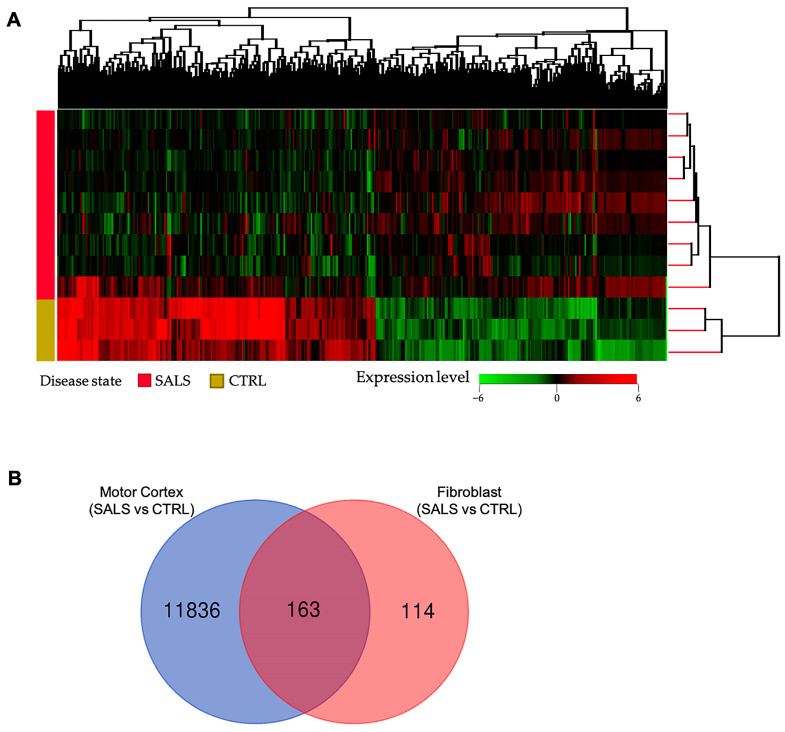
Figure 1.
Transcriptome analysis revealed molecular signatures for sALS fibroblasts. (A) Unsupervised hierarchical clustering analysis (similarity measure: Euclidean; linkage rule: Wards) of 277 DEGs among sALS and control subjects. The heatmap shows the median-normalized expression of individual genes across all samples, where genes and patients were clustered on the basis of expression similarities. In this two-dimensional presentation, each row represents a single gene, and each column represents a fibroblast sample from a control or sALS patient. In the dendrograms shown (top and right), the length and subdivision of the branches display the relatedness of the expression of the genes (top) and the fibroblast samples (right). Heatmap colors represent relative mRNA expression as indicated in the color key: red indicates up-regulation, green indicates down-regulation, and black indicates no change. (B) Venn diagram showing overlap of our list of 277 DEGs with genes deregulated in the motor cortex of sALS patients described in our previous work [40].

