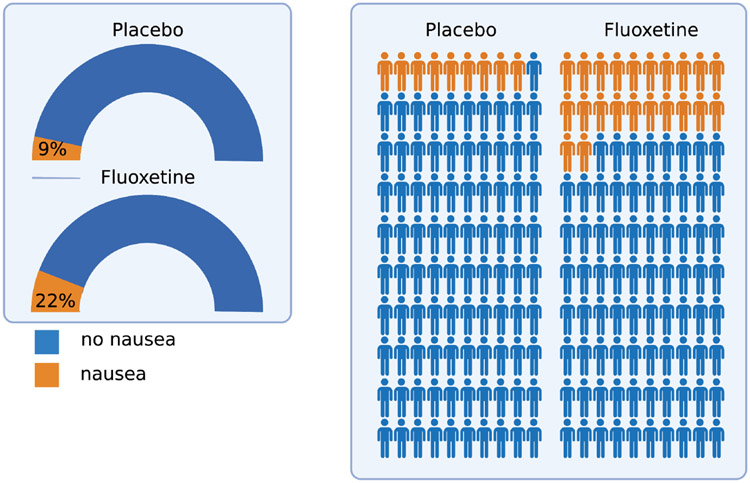
FIGURE 2.
Alternative Approaches to Visualizing Adverse Effects. In contrast to presenting relative rates, odds ratio, or bar graphs, adverse effects can be visually presented relative to the population of antidepressant-treated patients and the comparison group to provide more context. Modified gauges (left) and a pictogram (right) show the incidence of nausea (based on rates in the package insert) for fluoxetine-treated patients across registration trials. Figure created using BioRender.com

